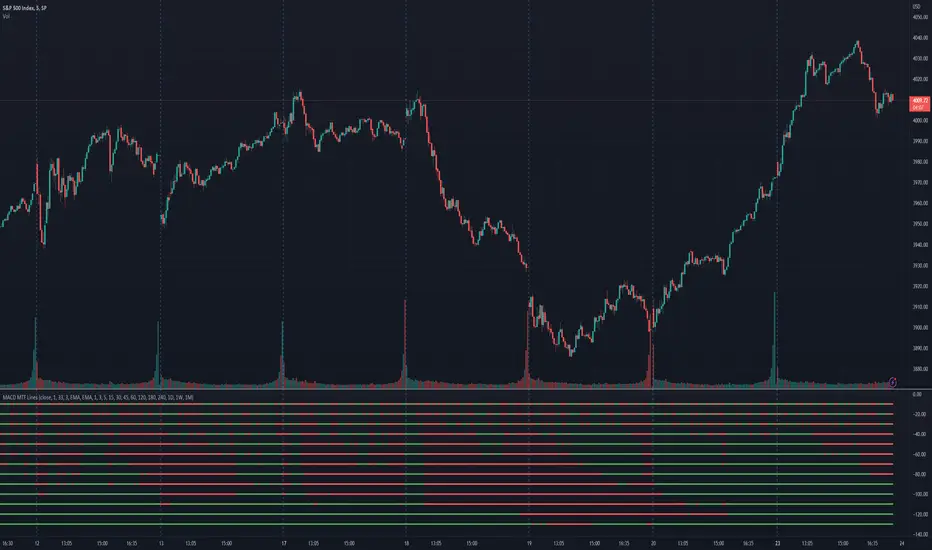
MACD MTF LinesThe indicator shows the MACD histogram sign (positive or negative) for several timeframes at once. You can see at a glance how the price is trending across higher and lower timeframes.
The code uses recursive calculations for the SMA and EMA to avoid lookahead errors and repainting on higher timeframes.
Note that, for lower timeframes, the line becomes yellow to the left because history is limited and there are not enough bars to calculate.
Cari skrip untuk "macd"
MACD DivergencesUpdate of MACD indicator which shows the most recent, and developing, price action divergences with the histogram.

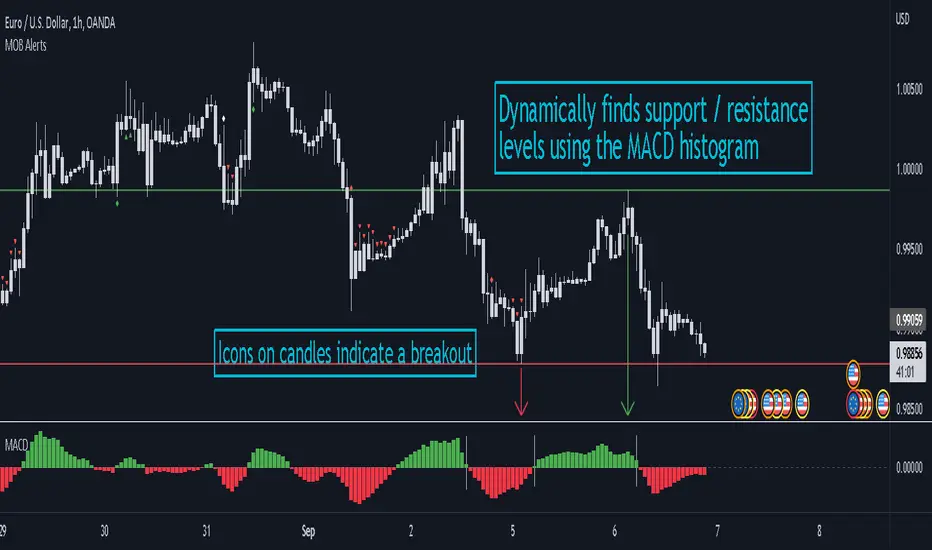
MACD Objective Breakouts + AlertsFinds the most recent support and resistance level as confirmed by the MACD . These level are detected dynamically and the lines will be updated as new levels form.
Alerts can be toggled on or off in the settings but will not work if the alert is not added to your chart. Alerts can be added by selecting the "Alert" button on TradingView then selecting "MOB Alerts" as the condition
Alerts will trigger when price closes above or below the indicated levels.
Please let me know if you find any bugs!
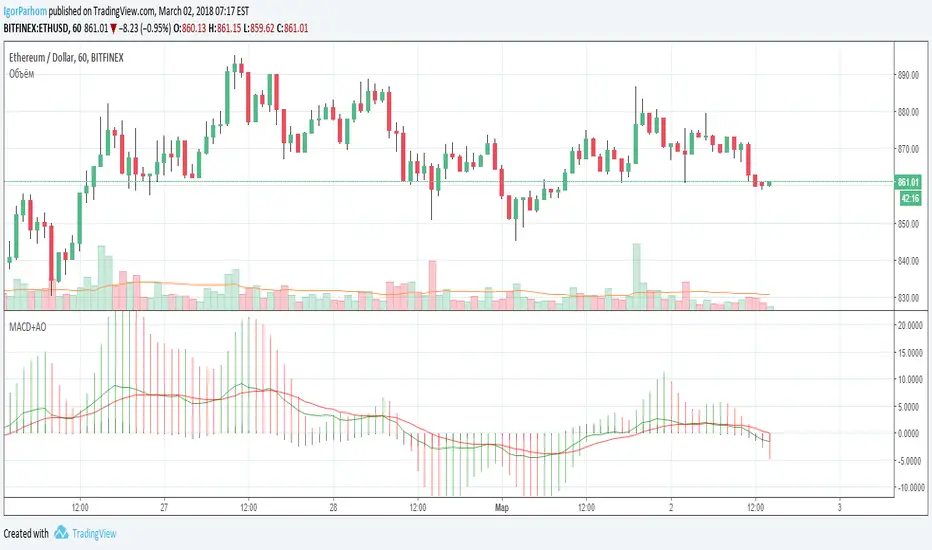
MACD oscillator with EMA strategy 4H This is a simple, yet efficient strategy, which is made from a combination of an oscillator and a moving average.
Its setup for 4h candles with the current settings, however it can be adapted to other different timeframes.
It works nicely ,beating the buy and hold for both BTC and ETH over the last 3 years.
As well with some optimizations and modifications it can be adapted to futures market, indexes(NASDAQ,NIFTY etc), forex(GBPUSD), stocks and so on.
Components:
MACD
EMA
Time condition
Long/short option
For long/exit short we enter when we are above the ema, histogram is positive and current candle is higher than previous.
For short /exit long , when close below ema, histo negative and current candles smaller than previous
If you have any questions please let me know !

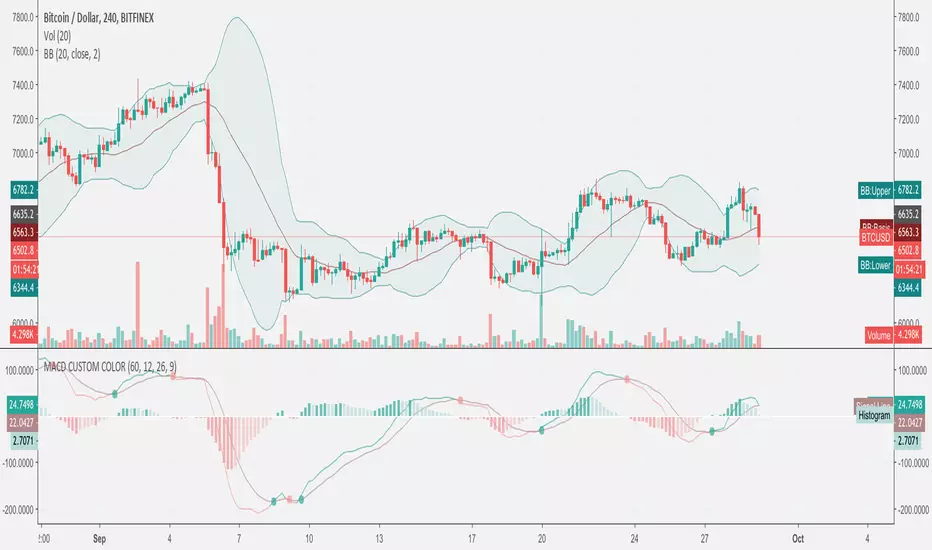
MACD VWAP IndicatorThis indicator uses a combination of the VWAP, EMA 9 and parts of the MACD in order to detect a bullish or bearish trend.
How to trade it:
Set SL either below or above the VWAP line (orange) and TP to 1:1.5 ratio (depending on last few candles, of course).
If EMA200 is close by then place SL either below or above EMA200 (blue) and TP to 1:1.5 ratio
Important:
Best traded in 15M, 30M => Intraday.
Have fun! :)


MACD + RSI Robert's VersionCombination of MACD and RSI to see how they work together, its meant for any market and any condition

MACD 4H StrategyThis strategy is a basic example of using MACD AND the instrument must be found an appropriate timeframe (4H recommended) before being tested with.

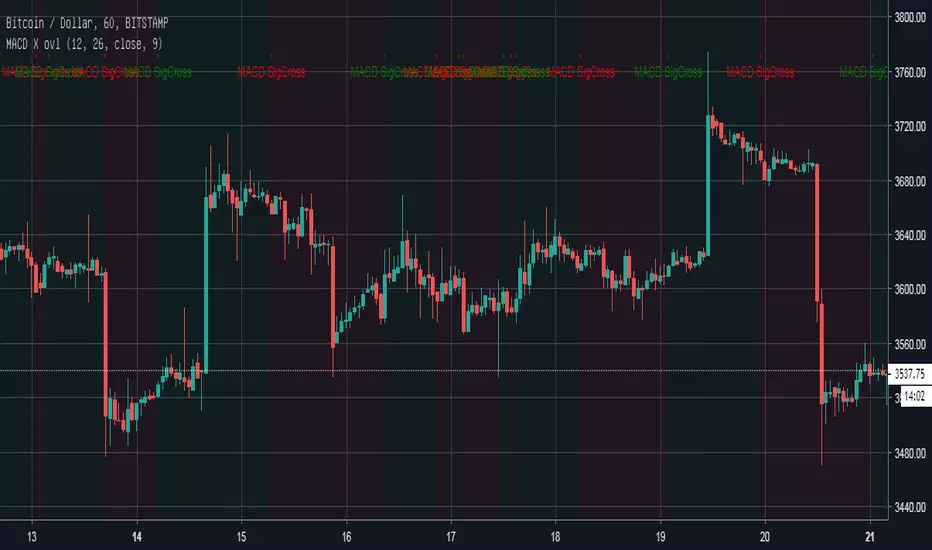
MACD Strategy by SedkurThis gives to you buy-sell signal with MACD histogram value.
Use "Fast and Slow length" and "Buy or Sell Histogram Value" inputs to take less or more signal.

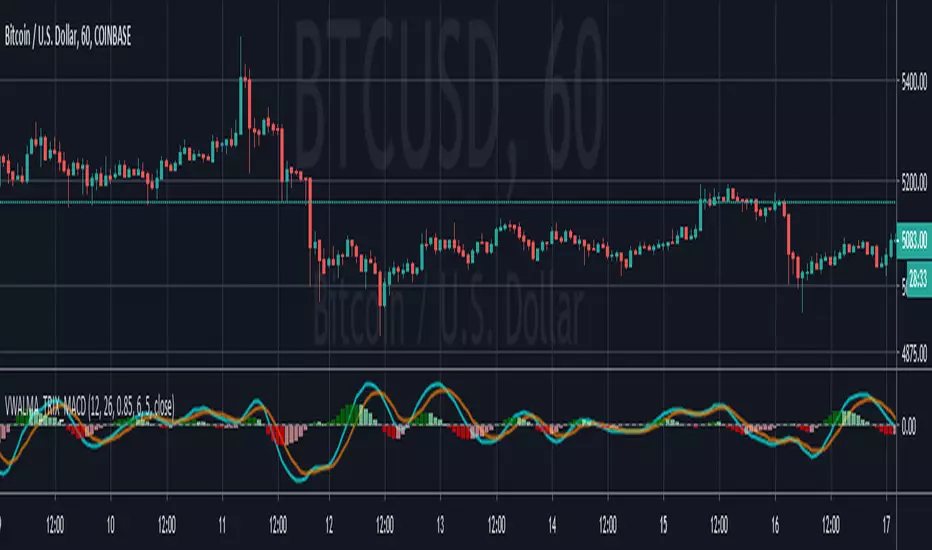
Volume Weighted ALMA TRIX MACDMACD constructed using volume weighted(optional) ALMA TRX
---------------------------------------
If you find it useful please consider a tip/donation :
BTC - 3BMEXEDyWJ58eXUEALYPadbn1wwWKmf6sA

MACD (Moving Average Convergence/Divergence) + Inside BarMACD (Moving Average Convergence/Divergence) + Inside Bar so that free users can have two things in same indicator.
Script is open for everyone.
Check and test the code of Inside Bar and let me know if it is correct.
Feel feel to share.


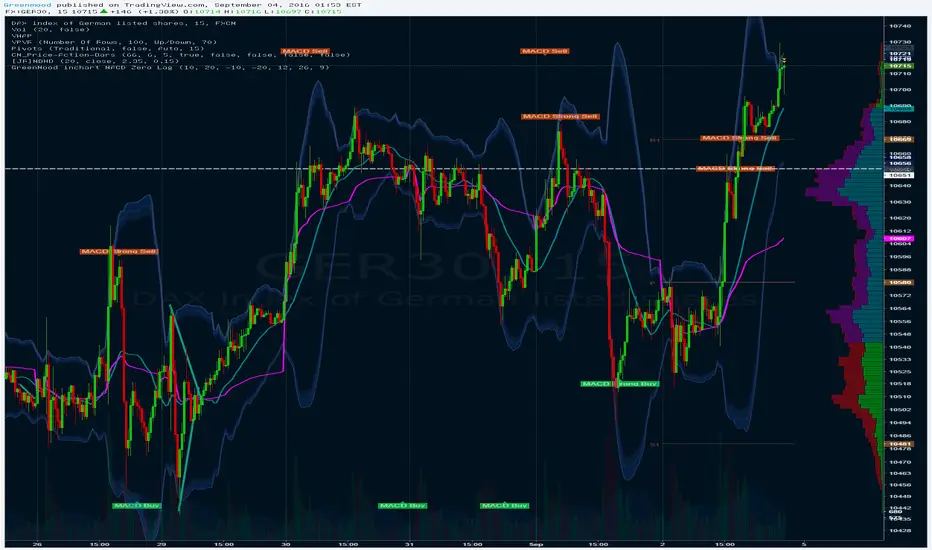
GreenMood inchart MACD Zero LagMACD Zero lag Visual inchart view.
Threshold / Settings can be changed in Format view.
Threshold to be adapted depending on timeframe.

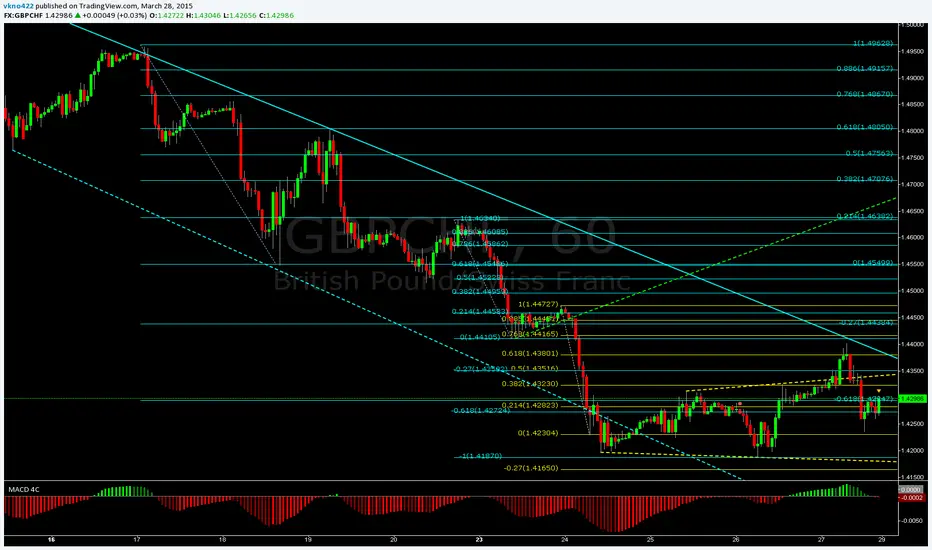
MACD 4C4 Coloured MACD
lime = positive rising
green = positive descending
red = positive rising
maroon = positive descending
MACD 4C4 Coloured MACD
lime = positive rising
green = positive descending
red = positive rising
maroon = positive descending

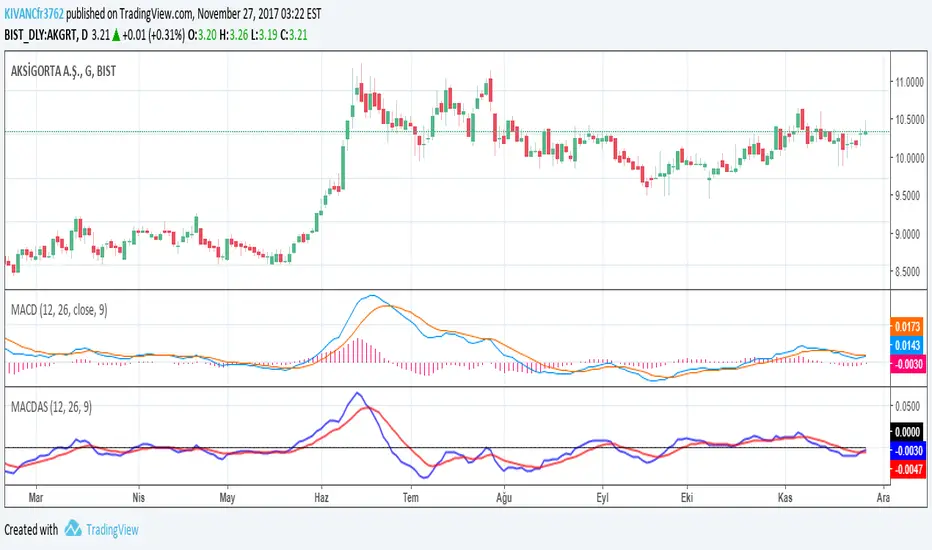
MACDASTHOMAS ASPRAY'S MACD by KIVANC @fr3762 on twitter
drive.google.com
This indicator is simply based on MACD HISTOGRAM'S 9 period EMA signal line
MACDAS = MACD HISTOGRAM= MACD - SIGNAL LINE of MACD
MACDAS SIGNAL LINE = 9 Period EMA of MACD
Note: Macd is originally calculated by using SMA but in this version both MACD and MACDAS and their signal lines are calculated by using EMA.
MACDAS provides earlier BUY / SELL signals than MACD.
TURKISH EXPLANATION:
Thomas Aspray'in bulduğu KIVANC @fr3762 tarafından yazılan versiyon
MACDnin Triggerı ile farkı (Histogram) ile bu farkın 9 günlük üssel hareketli ortalaması alınarak hesaplanmıştır
drive.google.com
Macd indikatörüne göre daha erken AL / SAT sinyalleri üretmektedir.
Kazançlı günlerde kullanmanız dileğiyle...
KıvanÇ