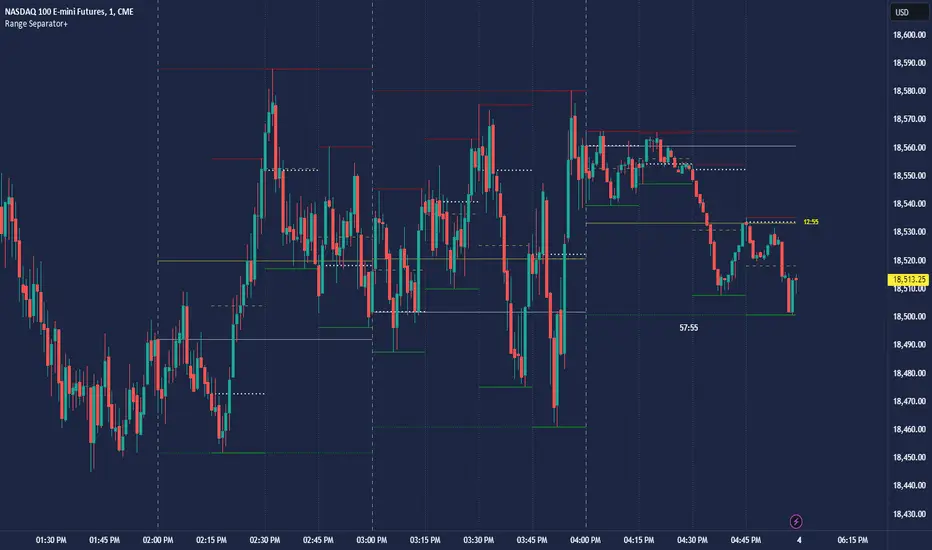
CRT Hourly/15m dividers and opensRange Separator is a unique tool designed to help traders visualize critical price levels and ranges on their charts. This script employs the innovative concepts of "Candles Are Ranges" and the "Power of 3 (PO3)" to enhance trading strategies by marking key time intervals and price levels.
What the Script Does:
Hourly Lines:
Automatically draws vertical lines at the start of each hour.
Provides an option to display only the current hour's line for a cleaner visual.
Allows customization of line color, width, and style.
15-Minute Lines:
Adds vertical lines at 15-minute intervals to highlight smaller time ranges.
Includes an option to draw horizontal lines at the 15-minute interval prices.
Offers customization for line color, width, and style.
Horizontal Lines:
Draws horizontal lines based on the opening, high, or low price of the selected timeframe.
Customizable options for line color, width, and style.
How the Script Works:
Candles Are Ranges: Each candle represents a price range (OHLC) on any timeframe. The script visually emphasizes these ranges, helping traders understand price action better.
Power of 3 (PO3): This concept divides price delivery into three stages: formation, turtle soup (stop hunting), and distribution/expansion. The script marks these intervals, aiding in identifying potential key levels for entries and exits.
How to Use the Script:
Adding the Script:
Apply the script to your chart and adjust the settings in the input menu.
Customize the appearance of hourly and 15-minute lines to suit your preference.
Analyzing the Chart:
Observe the hourly lines to determine higher timeframe biases.
Use 15-minute lines to identify more granular price movements.
Pay attention to horizontal lines that mark significant price levels based on your chosen criteria (open, high, low).
Trading Strategy:
Combine the script's visual aids with your understanding of the "Candles Are Ranges" and "Power of 3" concepts.
Use these visual cues to make informed decisions about potential entry and exit points.
What Makes it Original:
Integration of Candles Are Ranges and PO3 Concepts: Unlike traditional scripts that merely plot lines, this script uniquely integrates two powerful trading theories to provide a comprehensive view of price action.
Customizable Visual Aids: Offers extensive customization options for line colors, widths, and styles, allowing traders to tailor the script to their specific needs.
Enhanced Timeframe Analysis: By marking both hourly and 15-minute intervals, the script provides a detailed view of price ranges across multiple timeframes, enhancing the trader's ability to make informed decisions.
- Key script Parameters
Show Hourly Lines: Toggles the display of vertical lines marking each hour.
Hourly Lines Color: Sets the color of the hourly vertical lines.
Hourly Lines Width: Chooses the width of the hourly vertical lines (1, 2, or 3).
Hourly Lines Style: Selects the style of the hourly lines (Solid, Dashed, or Dotted).
Horizontal Line Color: Defines the color of the horizontal lines drawn at hourly intervals.
Horizontal Line Width: Determines the width of the horizontal lines (1, 2, or 3).
Horizontal Line Style: Sets the style of the horizontal lines (Solid, Dashed, or Dotted).
Horizontal Line Start Price: Specifies which price (Open, High, Low) the horizontal lines will start from.
Show Current Hour Only: Limits the display to only the current hour's horizontal line.
Show 15-Minute Lines: Toggles the display of vertical lines marking each 15-minute interval.
15-Minute Lines Color: Sets the color of the 15-minute vertical lines.
15-Minute Lines Width: Chooses the width of the 15-minute vertical lines (1, 2, or 3).
15-Minute Lines Style: Selects the style of the 15-minute lines (Solid, Dashed, or Dotted).
Show 15-Minute Horizontal Lines: Toggles the display of horizontal lines at 15-minute intervals.
15-Minute Horizontal Lines Color: Defines the color of the horizontal lines drawn at 15-minute intervals.
15-Minute Horizontal Lines Width: Determines the width of the horizontal lines (1, 2, or 3).
15-Minute Horizontal Lines Style: Sets the style of the horizontal lines (Solid, Dashed, or Dotted).
Important Notes:
- Credit to @Yazdanian and his basic "Hourly separators" indicator that plots a simple vertical line every hour which provided the idea for this version and expanded on
- This script is designed to complement your trading strategy by providing visual aids and should be used alongside other technical analysis tools.
It is not intended to issue buy or sell signals but to help you understand price ranges and potential key levels.
Disclaimer: The script is provided as-is, and the authors are not responsible for any trading losses incurred using this script. Always perform your own analysis and use proper risk management.
Cari skrip untuk "key levels"
ATR PivotsThe "ATR Pivots" script is a technical analysis tool designed to help traders identify key levels of support and resistance on a chart. The indicator uses various metrics such as the Average True Range (ATR), Daily True Range ( DTR ), Daily True Range Percentage (DTR%), Average Daily Range (ADR), Previous Day High ( PDH ), and Previous Day Low ( PDL ) to provide a comprehensive picture of the volatility and movement of a security. The script also includes an EMA cloud and 200 EMA for trend identification and a 1-minute ATR scalping strategy for traders to make informed trading decisions.
ATR Detail:-
The ATR is a measure of the volatility of a security over a given period of time. It is calculated by taking the average of the true range (the difference between the high and low of a security) over a set number of periods. The user can input the number of periods (ATR length) to be used for the ATR calculation. The script also allows the user to choose whether to use the current close or not for the calculation. The script calculates various levels of support and resistance based on the relationship between the security's range ( high-low ) and the ATR. The levels are calculated by multiplying the ATR by different Fibonacci ratios (0.236, 0.382, 0.5, 0.618, 0.786, 1.000) and then adding or subtracting the result from the previous close. The script plots these levels on the chart, with the -100 level being the most significant level. The user also has an option to choose whether to plot all Fibonacci levels or not.
DTR and DTR% Detail:-
The Daily True Range Percentage (DTR%) is a metric that measures the daily volatility of a security as a percentage of its previous close. It is calculated by dividing the Daily True Range ( DTR ) by the previous close. DTR is the range between the current period's high and low and gives a measure of the volatility of the security on a daily basis. DTR% can be used as an indicator of the percentage of movement of the security on a daily basis. In this script, DTR% is used in combination with other metrics such as the Average True Range (ATR) and Fibonacci ratios to calculate key levels of support and resistance for the security. The idea behind using DTR% is that it can help traders to better understand the daily volatility of the security and make more informed trading decisions.
For example, if a security has a DTR% of 2%, it suggests that the security has a relatively low level of volatility and is less likely to experience significant price movements on a daily basis. On the other hand, if a security has a DTR% of 10%, it suggests that the security has a relatively high level of volatility and is more likely to experience significant price movements on a daily basis.
ADR:-
The script then calculates the ADR (Average Daily Range) which is the average of the daily range of the security, using the formula (Period High - Period Low) / ATR Length. This gives a measure of the average volatility of the security on a daily basis, which can be useful for determining potential levels of support and resistance .
PDH /PDL:-
The script also calculates PDH (Previous Day High) and PDL (Previous Day Low) which are the High and low of the previous day of the security. This gives a measure of the previous day's volatility and movement, which can be useful for determining potential levels of support and resistance .
EMA Cloud and 200 EMA Detail:-
The EMA cloud is a technical analysis tool that helps traders identify the trend of the market by comparing two different exponential moving averages (EMAs) of different lengths. The cloud is created by plotting the fast EMA and the slow EMA on the chart and filling the space between them. The user can input the length of the fast and slow EMA , and the script will calculate and plot these EMAs on the chart. The space between the two EMAs is then filled with a color that represents the trend, with green indicating a bullish trend and red indicating a bearish trend . Additionally, the script also plots a 200 EMA , which is a commonly used long-term trend indicator. When the fast EMA is above the slow EMA and the 200 EMA , it is considered a bullish signal, indicating an uptrend. When the fast EMA is below the slow EMA and the 200 EMA , it is considered a bearish signal, indicating a downtrend. The EMA cloud and 200 EMA can be used together to help traders identify the overall trend of the market and make more informed trading decisions.
1 Minute ATR Scalping Strategy:-
The script also includes a 1-minute ATR scalping strategy that can be used by traders looking for quick profits in the market. The strategy involves using the ATR levels calculated by the script as well as the EMA cloud and 200 EMA to identify potential buy and sell opportunities. For example, if the 1-minute ATR is above 11 in NIFTY and the EMA cloud is bullish , the strategy suggests buying the security. Similarly, if the 1-minute ATR is above 30 in BANKNIFTY and the EMA cloud is bullish , the strategy suggests buying the security.
Inside Candle:-
The Inside Candle is a price action pattern that occurs when the current candle's high and low are entirely within the range of the previous candle's high and low. This pattern indicates indecision or consolidation in the market and can be a potential sign of a trend reversal. When used in the 15-minute chart, traders can look for Inside Candle patterns that occur at key levels of support or resistance. If the Inside Candle pattern occurs at a key level and the price subsequently breaks out of the range of the Inside Candle, it can be a signal to enter a trade in the direction of the breakout. Traders can also use the Inside Candle pattern to trade in a tight range, or to reduce their exposure to a current trend.
Risk Management:-
As with any trading strategy, it is important to practice proper risk management when using the ATR Pivots script and the 1-minute ATR scalping strategy. This may include setting stop-loss orders, using appropriate position sizing, and diversifying your portfolio. It is also important to note that past performance is not indicative of future results and that the script and strategy provided are for educational purposes only.
In conclusion, the "ATR Pivots" script is a powerful tool that can help traders identify key levels of support and resistance , as well as trend direction. The additional metrics such as DTR , DTR%, ADR, PDH , and PDL provide a more comprehensive picture of the volatility and movement of the security, making it easier for traders to make better trading decisions. The inclusion of the EMA cloud and 200 EMA for trend identification, and the 1-minute ATR scalping strategy for quick profits can further enhance a trader's decision-making process. However, it is important to practice proper risk management and understand that past performance is not indicative of future results.
Special thanks to satymahajan for the idea of clubbing Average True Range with Fibonacci levels.

MTF Key Levels - Support and ResistanceThis indicator shows how to Multi Time Frame (MTF) interpret levels:
Watch how price acts around these levels and how they can act as support/resistance and can be used as great confluence levels for your technical analysis.
This indicator displays:
VWAP Levels
Daily / Weekly / Monthly / Yearly
Within the chart above I have marked out how displaying these VWAP levels can provide support and resistance levels to be aware of.
Daily – Weekly - Monthly – Yearly Levels
O = Open / H = High / L = Low
pO = Previous Open / pH = Previous High / pL = Previous Low / pEQ = Previous Equlibrium
Having previous Low/High levels makes you aware of Swing Failure Patterns (SFP). Also the daily/weekly/monthly opening and previous opening can assist with the trend.
Daily Open: Gives you an idea who is in control for the day. This level very often acts as strong support or resistance.
Weekly Open: Indicates where the price is within the higher timeframe.
Monthly Open & Yearly Levels: Overview of direction for the whole month without looking at a monthly chart and Yearly chart
Line Options
Within the line options you can choose to have a clean chart and display a “short line”. These line length can be adjusted by the user.
Line just to the right.
Line across the screen.
Disclaimer: The Monthly and Yealy VWAP will only show on higher timeframes this is due to restriction of how many candles can be shown on the chart. The candles displayed need to go back to either the start of the month of year to be able to calculate their VWAPs.

SVP + candle + Max volume [midst]
SVP + DALY CANDLE + MAX VOLUME
A comprehensive trading indicator that combines Session Volume Profile (SVP), Higher Timeframe (HTF) Candles, and Intrabar Max Volume Price Detection into one powerful tool. Perfect for traders who want to understand price action, volume distribution, and key levels all in one place.
KEY FEATURES
Session Volume Profile
• Real-time volume distribution across price levels for the current session
• Point of Control (POC) - identifies the price with the highest traded volume
• Value Area High (VAH) & Low (VAL) - shows where 70% of the volume occurred (customizable percentage)
• Color-coded volume bars - distinguish between up volume (bullish) and down volume (bearish)
• Value area highlighting - clearly see the most important price zones
Higher Timeframe Candle Display
• Visual daily (or custom timeframe) candle overlaid on your current chart
• OHLC labels - see Open, High, Low, and Close prices clearly marked
• Fully customizable colors - separate colors for bullish/bearish bodies, borders, and wicks
• Adjustable positioning - move the candle and labels to your preferred location
Max Volume Price Detection
• Identifies the exact price level with maximum volume within each bar
• Uses Lower Timeframe (LTF) data for precise volume analysis (Premium+ required)
• Simple mode fallback - works on all TradingView plans
• Previous max volume marker - displays previous bar's max volume as a reference dot
• Real-time calculation - updates as each bar forms
ATR Table
• Dynamic ATR-based stop levels - automatically calculates potential stop-loss levels
• Multiple smoothing methods - RMA, SMA, EMA, WMA
• Customizable multiplier - adjust for your risk tolerance
• Clean table display - shows ATR value, high stop, and low stop
PERFECT FOR
Day traders analyzing intrabar volume distribution
Swing traders wanting HTF context on lower timeframes
Volume profile traders looking for key support/resistance levels
Price action traders seeking high-probability entry zones
HOW TO USE
Volume Profile Analysis
POC often acts as a magnet for price. VAH/VAL are key support/resistance levels. High volume nodes indicate strong price acceptance, while low volume nodes suggest potential breakout zones.
HTF Candle Context
See daily range while trading on 5m-1h charts. Daily open often acts as pivot point. Daily high/low are key levels to watch.
Max Volume Price
Black line shows where most volume traded in each bar. Previous max volume (dot) helps identify institutional activity. Clusters of max volume create strong support/resistance. Can possibly indicate a Wick bounce
ATR Stops
Use ATR-based levels for logical stop placement. Adjust multiplier based on market volatility.
SETTINGS & CUSTOMIZATION
Positioning
Control the global offset to move both candle and profile together. Fine-tune with individual offsets for candle and profile spacing.
Volume Profile
Adjustable number of rows (50-500) for granular or simplified view. Customizable width and placement (left/right). Value Area percentage control. Full color customization for all volume components.
HTF Candle
Any timeframe selection (default: Daily). Full color customization for bull/bear candles. Adjustable candle width. Toggle OHLC labels on/off. Control label distance and line widths.
Max Volume Price
Choose between Simple (all plans) or LTF mode (Premium+). Auto or manual LTF resolution. Custom color and line width. Toggle current and previous markers independently.
TECHNICAL NOTES
Maximum 5000 bars lookback for volume calculations
Works on all timeframes
LTF max volume requires TradingView Premium or higher
Optimized for performance with efficient array operations
For best results, use on liquid instruments with reliable volume data
Most effective on intraday charts (5min-1hour) for day trading and scalping strategies
For Entertainment and information only
Created by midst

Daily/Weekly Swing Highs-Lows + Candle PatternsDescription
Daily/Weekly Swing Highs-Lows + Candle Patterns
This indicator plots the most recent Daily and Weekly Swing Highs and Lows (key support/resistance levels) using a simple and effective logic: a swing high/low is confirmed when the previous bar's extreme is higher/lower than both the current and the one before it.
Features:
• Daily Swing Highs/Lows (teal/maroon circles) – toggleable
• Weekly Swing Highs/Lows (blue/purple circles) – optional
• Visual separators for new daily and weekly bars (light background color)
• Daily candle pattern labels (optional):
- US = Up Swing (strong bullish continuation)
- DS = Down Swing (strong bearish continuation)
- IN = Inside Bar
- OUT = Outside Bar
• Daily close position labels (optional):
- P = Positive (close in upper 25% of the range)
- mP = minor Positive (50–75%)
- mN = minor Negative (25–50%)
- N = Negative (lower 25%)
All elements are fully customizable (colors, visibility) and work on any timeframe.
Best suited for intraday timeframes (1 min to 4 hours) where daily and weekly key levels provide important context for price action and reversals.
The optional "Trading session length" input is mainly useful for markets with shorter sessions (e.g., European indices) and does not affect swing detection.
Open-source, free to use and modify.
How to Use the Indicator + Practical Use Case
Key Settings (Inputs)
Trading session length (hours) → Default 8.5 h (useful for FTSEMIB, DAX, etc.). Leave it as is unless you trade a market with a different session length.
Daily Swing Levels → Show/Hide daily swing highs (teal) and lows (maroon).
Weekly Swing Levels → Usually keep off on intraday charts to avoid clutter (turn on for higher-timeframe context).
Daily Candle Patterns → Enable only if you want to see US/DS/IN/OUT labels on the daily close.
Close Position (P/mP/mN/N) → Enable if you want to quickly see how strong/weak the daily close was.
What You See on the Chart
Teal circles = Last confirmed daily swing high (resistance).
Maroon circles = Last confirmed daily swing low (support).
Blue/purple circles (if enabled) = Weekly swing high/low.
Light gray background = Start of a new trading day.
Purple background (if weekly enabled) = Start of a new week.
Small labels on daily close (if enabled):
- US = strong bullish day
- DS = strong bearish day
- IN = inside bar (consolidation)
- OUT = outside bar (expansion)
- P/mP/mN/N = how far the close was from the high/low of the day.
Best Timeframes 1 min to 240 min charts → Daily levels act as major support/resistance zones for intraday trading.
Avoid using on daily or higher charts (the logic is designed for intraday context).
Why this works well intraday:
The daily swing high/low levels are high-probability zones where institutions and algorithms often defend positions. On intraday charts, they act as “magnets” for price, giving you clean entries and exits with clear invalidation levels.
This indicator keeps your chart clean while providing exactly the context most intraday traders need: key daily levels + daily momentum context.

able FRVP Reversal# able FRVP Reversal - Complete User Guide
## 📌 Overview
**able FRVP Reversal** is a professional-grade Volume Profile indicator with an integrated reversal detection system. It combines Fixed Range Volume Profile (FRVP) analysis with a confluence-based reversal scoring system to identify high-probability turning points at key volume levels.
---
## ✨ Key Features
| Feature | Description |
|---------|-------------|
| **Session-Based Volume Profile** | Automatically resets at the beginning of each regular trading session |
| **POC (Point of Control)** | Highest volume price level - strongest support/resistance |
| **VAH (Value Area High)** | Upper boundary of the 70% value area - resistance zone |
| **VAL (Value Area Low)** | Lower boundary of the 70% value area - support zone |
| **Confluence Scoring System** | 5-point scoring system for reversal detection |
| **Smart Cooldown** | Prevents signal spam with customizable cooldown period |
| **Real-time Info Table** | Displays all key metrics in a retro-style dashboard |
---
## 🔧 Installation
1. Open TradingView and go to **Pine Editor**
2. Delete any existing code and paste the indicator code
3. Click **"Add to Chart"**
4. Configure settings as needed
---
## ⚙️ Settings Explained
### 📊 Volume Profile Settings
| Setting | Default | Description |
|---------|---------|-------------|
| **Number of Rows** | 50 | Resolution of the volume profile (more rows = finer detail) |
| **Value Area %** | 70 | Percentage of volume to include in Value Area (industry standard: 70%) |
| **Profile Width** | 40 | Visual width of the histogram on chart |
| **Show Histogram** | ✓ | Display volume histogram bars |
| **Show POC/VAH/VAL** | ✓ | Display the three key levels |
| **Show Labels** | ✓ | Display price labels for each level |
| **Extend Lines** | ✓ | Extend levels to the right of current price |
| **Extend Length** | 100 | How far to extend the lines (in bars) |
### 🔄 Reversal Detection Settings
| Setting | Default | Description |
|---------|---------|-------------|
| **Enable Reversal Detection** | ✓ | Turn reversal signals on/off |
| **Min Confluence Score** | 3 | Minimum score required to trigger signal (1-5) |
| **Cooldown Bars** | 10 | Minimum bars between signals to prevent spam |
#### Understanding Min Confluence Score:
- **Score 1-2**: Very sensitive, many signals (not recommended)
- **Score 3**: Balanced - good for most traders ⭐ Recommended
- **Score 4**: Conservative - fewer but higher quality signals
- **Score 5**: Very strict - only strongest reversals
### 🎨 Color Settings
All colors are fully customizable:
- **POC Line**: Default Gold (#FFD700)
- **VAH Line**: Default Coral Red (#FF6B6B)
- **VAL Line**: Default Teal (#4ECDC4)
- **Bullish Reversal**: Default Green (#00E676)
- **Bearish Reversal**: Default Red (#FF5252)
---
## 📖 How to Read the Indicator
### Volume Profile Histogram
```
█████████████ ← High volume = Strong S/R
████████ ← Medium volume
████ ← Low volume = Weak S/R
██
```
- **Darker/Longer bars** = More trading activity at that price
- **Inside Value Area** = Colored based on session direction (Bull/Bear)
- **Outside Value Area** = Muted gray color
### Key Levels
| Level | Color | Meaning |
|-------|-------|---------|
| **POC** | Yellow | Price with highest volume - Strongest magnet |
| **VAH** | Red | Upper resistance - Look for bearish reversals |
| **VAL** | Teal | Lower support - Look for bullish reversals |
---
## 🔄 Reversal Detection System
### How the Scoring System Works
The indicator uses a **5-point confluence scoring system**. Each condition adds 1 point:
#### 🟢 Bullish Reversal Score (at VAL)
| Condition | Points | Description |
|-----------|--------|-------------|
| Price at VAL Zone | +1 | Price is within VAL ± 0.2 ATR |
| Bullish Candle | +1 | Close > Open (green candle) |
| RSI Oversold | +1 | RSI < 35 |
| Rejection Wick | +1 | Lower wick > 1.5× body size |
| Failed Breakdown | +1 | Touched below VAL but closed above |
#### 🔴 Bearish Reversal Score (at VAH)
| Condition | Points | Description |
|-----------|--------|-------------|
| Price at VAH Zone | +1 | Price is within VAH ± 0.2 ATR |
| Bearish Candle | +1 | Close < Open (red candle) |
| RSI Overbought | +1 | RSI > 65 |
| Rejection Wick | +1 | Upper wick > 1.5× body size |
| Failed Breakout | +1 | Touched above VAH but closed below |
### Signal Quality Ratings
| Score | Rating | Meaning |
|-------|--------|---------|
| 5/5 | ★★★ | Excellent - Highest probability |
| 4/5 | ★★ | Good - High probability |
| 3/5 | ★ | Acceptable - Moderate probability |
| <3 | - | No signal triggered |
---
## 📋 Info Table Explained
```
╔═ able-REV ═╗ 15 ████████ SCR
─────────────────────────────────────
ZONE UPPER VA ▒▒▓▓████ ▲
POC 4272.680 ██████·· ▲
VAH 4322.745 ████···· ·
VAL 4264.977 ██████·· ·
═ SCORE ═════════════════════════════
BULL 0/5 ········ ·
BEAR 1/5 ░······· ·
RSI 49 ▒▒▓▓···· ·
◄SIGNAL► WAIT ········ ·
```
| Row | Description |
|-----|-------------|
| **ZONE** | Current price position relative to Value Area |
| **POC/VAH/VAL** | Price levels with distance indicators |
| **BULL Score** | Current bullish confluence score |
| **BEAR Score** | Current bearish confluence score |
| **RSI** | RSI value with OB/OS status |
| **SIGNAL** | Current signal status (BUY/SELL/WAIT) |
### Zone Types
| Zone | Meaning | Bias |
|------|---------|------|
| ABOVE VAH | Price broke above resistance | Bullish (but watch for rejection) |
| ⚠ AT VAH | Price testing resistance | Watch for bearish reversal |
| UPPER VA | Price in upper value area | Slight bullish bias |
| LOWER VA | Price in lower value area | Slight bearish bias |
| ⚠ AT VAL | Price testing support | Watch for bullish reversal |
| BELOW VAL | Price broke below support | Bearish (but watch for rejection) |
---
## 📈 Trading Strategies
### Strategy 1: VAH Rejection (Bearish Reversal)
**Setup:**
1. Price approaches or touches VAH (red dashed line)
2. BEAR score reaches 3+ (or your minimum setting)
3. REV signal appears above the candle
**Entry:**
- Enter SHORT on signal candle close
- Or wait for confirmation candle
**Stop Loss:**
- Above the signal candle high
- Or above VAH + 0.5 ATR
**Take Profit:**
- First target: POC (yellow line)
- Second target: VAL (teal line)
---
### Strategy 2: VAL Bounce (Bullish Reversal)
**Setup:**
1. Price approaches or touches VAL (teal dashed line)
2. BULL score reaches 3+ (or your minimum setting)
3. REV signal appears below the candle
**Entry:**
- Enter LONG on signal candle close
- Or wait for confirmation candle
**Stop Loss:**
- Below the signal candle low
- Or below VAL - 0.5 ATR
**Take Profit:**
- First target: POC (yellow line)
- Second target: VAH (red line)
---
### Strategy 3: POC Bounce
**Setup:**
1. Price pulls back to POC after trending
2. POC acts as support/resistance
3. Watch for reversal candle patterns
**Entry:**
- Long if bullish candle at POC from below
- Short if bearish candle at POC from above
**Stop Loss:**
- Other side of POC ± buffer
---
## ⚠️ Important Notes
### When Signals Work Best
✅ **High Probability Setups:**
- Score 4-5 with clear rejection wick
- RSI confirms (oversold for long, overbought for short)
- First test of VAH/VAL in the session
- Clear trend before reversal
❌ **Low Probability Setups:**
- Score barely meeting minimum (3/5)
- Multiple tests of same level (level weakening)
- Low volume/choppy market
- News events pending
### Risk Management Rules
1. **Never risk more than 1-2% per trade**
2. **Always use stop loss** - place beyond the level
3. **Wait for candle close** - don't enter on wick touches
4. **Respect the cooldown** - avoid overtrading
5. **Consider the trend** - counter-trend reversals are riskier
---
## 🔔 Alerts
The indicator includes built-in alerts:
| Alert | Trigger |
|-------|---------|
| VAL Bullish Reversal | BULL score meets minimum at VAL |
| VAH Bearish Reversal | BEAR score meets minimum at VAH |
### Setting Up Alerts:
1. Right-click on the chart
2. Select "Add Alert"
3. Choose "able FRVP Reversal" as condition
4. Select desired alert type
5. Configure notification method
---
## 💡 Pro Tips
1. **Combine with trend analysis** - Reversals in trend direction are more reliable
2. **Watch for confluence with other S/R** - If VAH/VAL aligns with round numbers, previous highs/lows, or fib levels, the level is stronger
3. **Volume confirmation** - Higher volume on reversal candle = stronger signal
4. **Time of day matters** - Reversals during active trading hours are more reliable
5. **Adjust sensitivity by market** - Volatile assets may need higher Min Confluence Score
6. **Use multiple timeframes** - Check if reversal level aligns with higher timeframe levels
---
## 🔧 Recommended Settings by Trading Style
| Style | Min Confluence | Cooldown | Best For |
|-------|----------------|----------|----------|
| Scalping | 3 | 5-7 | Quick trades, more signals |
| Day Trading | 3-4 | 10-15 | Balanced approach |
| Swing Trading | 4-5 | 20+ | Fewer, higher quality signals |
---
## ❓ Troubleshooting
| Issue | Solution |
|-------|----------|
| No signals appearing | Lower Min Confluence Score or check if market is ranging |
| Too many signals | Increase Min Confluence Score or Cooldown Bars |
| Levels not showing | Enable Show POC/VAH/VAL in settings |
| Histogram too wide/narrow | Adjust Profile Width setting |
---
## 📞 Support
For questions, suggestions, or bug reports, please contact the developer.
---
**Version:** 1.0
**Last Updated:** 2024
**Platform:** TradingView (Pine Script v6)

The Strat - Levels [rdjxyz]◆ OVERVIEW
The Strat - Levels dynamically displays key levels used in The Strat trading methodology, developed by Rob Smith. The level colors are dynamically determined by their Strat classification (1, 2 up, failed 2 up, 2 down, failed 2 down, 3)—making it easy to recognize higher timeframe Strat candle classifications from any lower timeframe.
◆ DETAILS
If you're unfamiliar with The Strat, there are 3 universal scenarios regarding candle behavior:
SCENARIO ONE
The 1 Bar - Inside Bar: A candle that doesn't take out the highs or the lows of the previous candle; aka consolidation.
SCENARIO TWO
The 2 Bar - Directional Bar: A candle that takes out one side of the previous candle; aka trending (or at least attempting to trend).
These can be broken down even further as follows:
2 Up: A candle that takes out the high of the previous candle and closes bullish
Failed 2 Up: A candle that takes out the high of the previous candle and closes bearish
2 Down: A candle that takes out the low of the previous candle and closes bearish
Failed 2 Down: A candle that takes out the low of the previous candle and closes bullish
SCENARIO THREE
The 3 Bar - Outside Bar: A candle that takes out both sides of the previous candle; aka broadening formation.
◇ HOW THE DYNAMIC LEVEL COLORING WORKS
PREVIOUS LEVELS
Previous Day High/Low
Previous Week High/Low
Previous Month High/Low
Previous Quarter High/Low
Previous Year High/Low
Each period's levels are compared to their previous period's levels and colored according to the 3 universal scenarios, which are fixed based on historical data. (No repainting)
CURRENT LEVELS
Current Day Open
Current Week Open
Current Month Open
Current Quarter Open
Current Year Open
Each current period's levels (high, low, and current price) are compared to the previous period's levels and current period's open on every tick—changing colors in real-time as their Strat classification changes. (Will repaint as price action evolves)
E.g. When a new day opens inside of the previous day's range (high/low) the Day Open line will be gray (default for inside bars). When the current day trades above the previous day's range, the Day Open line will become aqua (default for 2 up). If price trades back below the current day's open, the Day Open line will become fuchsia (default for failed 2 up). And if price trades below the previous day's range, the Day Open line will become dark purple (default for 3s).
◆ SETTINGS
Current Day Open
Previous Day High/Low
Current Week Open
Previous Week High/Low
Current Month Open
Previous Month High/Low
Current Quarter Open
Previous Quarter High/Low
Current Year Open
Previous Year High/Low
Strat Colors
Each Current Level Open has 4 inputs:
Show/Hide Checkbox
Line Style
Line Width
Label Offset (Integer)
Each Previous Level High/Low has 5 inputs:
Show/Hide High Checkbox
Show/Hide Low Checkbox
Line Style
Line Width
Label Offset (Integer)
And each Strat scenario can be custom colored:
1-Bar Color - Default Gray
2-Up Color - Default Aqua
Failed 2-Up Color - Default Fuchsia
2-Down Color - Default White
Failed 2-Down Color - Default Teal
3-Bar Color - Default Dark Purple
◆ USAGE
There are 3 ways to look at these levels:
Potential continuation (e.g. Previous Day's 2-Up High being broken by Current Day's Price)
Potential reversal (e.g. Previous Day's 2-Down High being broken by Current Day's Price)
Potential exhaustion risk (e.g. Previous Month's Low is broken by Current Day's Price but trades back up into the Previous Month's range)
It's best to use this indicator with a separate indicator that color codes your chart's candles according to their Strat Scenario (1, 2, 3) and use top-down analysis to gauge whether to view levels as a sign of continuation, reversal, or exhaustion risk.
◆ WRAP UP
As demonstrated, The Strat - Levels offers Strat Scenario color-coded key levels, making it easy to identify the previous period's Strat Scenario (1, 2-Up, Failed 2-Up, 2-Down, Failed 2-Down, or 3) without needing to manually plot levels or refer to higher timeframes.
◆ DISCLAIMER
This indicator is a tool for visual analysis and is intended to assist traders who follow The Strat methodology. As with any trading methodology, there's no guarantee of profits; trading involves a high degree of risk and you could lose all of your invested capital. Use of this indicator is not indicative of future results and does not constitute and should not be construed as investment advice. All trading decisions and investments made by you are at your own discretion and risk. Under no circumstances shall the author be liable for any direct, indirect, or incidental damages. You should only risk capital you can afford to lose.

[ArchLabs] Support & Resitance Levels Support & Resistance Levels — SR-v1.100
Smart, auto-managed zones for clean market structure
⸻
🔍 What this indicator does
This script automatically finds and maintains high-quality support & resistance zones on your chart, so you don’t have to keep redrawing levels by hand.
It:
• Detects major swing highs and lows (pivots)
• Builds support and resistance zones (not just thin lines)
• Filters out overlapping / redundant levels
• Tracks how price interacts with those zones in real time
• Marks and alerts:
• ✅ Breakouts
• 🚨 False breakouts
• 🔁 Retests
• Flips broken support → resistance and resistance → support automatically
You get a clean structural map of the market, continuously updated.
⸻
🧠 How levels are built (conceptually)
1. The indicator looks back over a configurable window and finds significant highs and lows (pivots).
2. From each confirmed pivot, it creates:
• A core level price (horizontal line)
• A price area around it (shaded zone), sized relative to recent price range/volatility
3. It then checks for overlaps between existing levels and new candidates:
• If a new level is too close to an existing one (within your overlap threshold), it gets discarded.
• This keeps only the most meaningful, non-redundant levels on the chart.
4. A cap of around 10 levels per side (support / resistance) keeps the view readable.
The result: a curated set of zones that actually matter, not a wall of lines.
⸻
🎨 Visuals on the chart
You’ll see:
• Support zones
• Line: bullish color (default green)
• Area: semi-transparent band below/around the line
• Resistance zones
• Line: bearish color (default red)
• Area: semi-transparent band above/around the line
Colors are customizable for:
• Level line
• Zone area
• Breakout highlight
• Retest label
This makes it easy to visually separate support vs resistance and quickly spot key reactions.
⸻
⚡ Dynamic behavior & level lifecycle
Each level goes through a natural “life cycle,” which the indicator tracks for you:
1. Active zone
• The level is valid and extended to the right as long as price stays “engaged” with it (using smoothed highs/lows to avoid noise).
2. Extension / pause
• When price pulls away from the level far enough, the extension can temporarily stop so the level doesn’t stretch indefinitely without interaction.
• If price comes back into the zone with meaningful action, the level can resume extension.
3. Break & role reversal
• When price cleanly breaks the level (based on smoothed price, not just a wick), the zone is:
• Stopped and locked in place
• Marked as broken
• Immediately cloned and flipped:
• Broken support becomes a new resistance zone at the same area.
• Broken resistance becomes a new support zone.
This gives you automatic role-reversal levels without manually redrawing anything.
⸻
🧷 Event tags & alerts
The indicator tracks three key interactions with each zone:
1. Breakouts (optional)
When price decisively breaks a level:
• A small breakout label appears on/near the level:
• Support broken → bearish breakout style
• Resistance broken → bullish breakout style
• An alert message is fired (if alerts are enabled on the script)
Use this to catch true structural breaks that may signal trend continuation or regime change.
⸻
2. False breakouts (optional)
False breakouts are marked when price:
• Wicks through a level, but
• Fails to close beyond it and quickly returns inside the zone
When detected:
• A 🚨 FB label appears at the level
• The label tracks with price while the false breakout is active
• An alert can fire each time this behavior is confirmed
This is very useful for reversal traders and anyone fading failed breakouts.
⸻
3. Retests (optional)
Retests are detected when:
• Price re-enters a zone after previously moving away from it
• The candle comes back into the area for the first time in this new approach
The script:
• Marks the retest with a “T” label in a distinct color for support vs resistance
• Brings that level to the top of the internal priority list, keeping fresh retests visually and logically “hot”
Traders often use these as high-probability reaction points (e.g., breakout → retest → continuation).
⸻
⚙️ Key settings
All inputs are grouped for clarity:
Support / Resistance Levels
• Pivots Lookback
Controls how far back the indicator looks for swing highs/lows.
• Higher value → fewer, stronger levels
• Lower value → more reactive, more levels
• Overlap Multiplier (Pips)
Sets how aggressively overlapping levels are merged/ignored.
• Higher value → fewer levels, more consolidation
• Lower value → more granular levels
• Auto Overlap
When enabled, the script automatically adjusts the overlap threshold based on timeframe:
• Intraday lower timeframes → tighter filtering
• Higher/intra-session → more appropriate scaling
This lets you drop the indicator on multiple timeframes without constantly retuning.
⸻
Level Event Toggles
• Breakout Labels & Alerts (on/off)
• False Breakout Labels & Alerts (on/off)
• Retest Labels & Alerts (on/off)
Turn on only what fits your style.
Scalpers might want all three; swing traders may prefer only breakouts + retests.
⸻
Support / Resistance Colors
Separate color groups for:
• Line & area of support levels
• Line & area of resistance levels
• Visual styling for breakouts
• Visual styling for retests
You can match your existing chart theme or build a dedicated SR layout.
⸻
📈 How to use it in your trading
Here are a few practical ways to integrate this indicator:
• Context map
Use it as a structural overlay on any symbol/timeframe to see where price is likely to react.
• Breakout + retest setups
• Wait for a level to break with a breakout label.
• Then watch for a T (retest) label into the flipped zone.
• Combine with your own confirmation (price action, volume, oscillators, etc.).
• Mean-reversion & fade trades
• Hunt for false breakout (FB) labels on key levels.
• These are often good spots to fade aggressive moves that lose momentum.
• Confluence builder
• Combine zones with trend tools, VR/DC, moving averages, or higher timeframe structure.
• A breakout/retest at a level that also lines up with higher TF structure can be especially meaningful.
⸻
✅ Summary
Support & Resistance Levels (SR-v1.100) is designed to be:
• Clean – no cluttered spaghetti of lines
• Adaptive – zones evolve with the market and flip roles automatically
• Actionable – breakout, false breakout, and retest events are clearly marked and alert-ready
• Flexible – works on any market and timeframe with simple, intuitive inputs
Drop it on your chart, tune the lookback & overlap to your style, and let it handle the heavy lifting of structural mapping while you focus on decisions.

TraderDemircan (Triz Global) Automatic Extend FibonacciDescription
What This Indicator Does:
This indicator automatically identifies the most significant swing low and swing high points within a customizable lookback period and plots comprehensive Fibonacci retracement and extension levels between them. Unlike manual Fibonacci tools, this script continuously updates the levels based on the most recent price action, making it ideal for traders who want to identify key support/resistance zones without constantly redrawing Fibonacci levels.
Key Features:
Automatic Swing Point Detection: Scans the specified lookback period to find the lowest low (starting point) and the highest high (ending point) to establish the Fibonacci range
Comprehensive Level Coverage: Plots 18 Fibonacci levels ranging from 0.0 (minimum) to 3.618 (maximum extension), including standard retracement levels (0.236, 0.382, 0.5, 0.618, 0.786) and popular extension levels (1.272, 1.414, 1.618, 2.0, 2.272, 2.382, 2.618, 3.0, 3.272, 3.618)
Visual Clarity: Each level is color-coded and can be individually toggled on/off for cleaner charts
Price and Percentage Labels: Shows both the actual price level and the Fibonacci percentage for easy reference
Flexible Display Options: Customize line width, style (solid/dashed/dotted), and extension direction
Dynamic Updates: Automatically recalculates levels as new price data becomes available
How It Works:
The indicator uses a left-to-right methodology, starting from the swing low (marked as 0.0 with a green diamond) and extending to the swing high (marked as 1.0 with a blue diamond). This approach follows natural price movement and makes the Fibonacci levels intuitive to read. The algorithm:
Identifies the lowest point within the lookback period (this becomes the 0.0 level)
Finds the highest point that occurred after the low point (this becomes the 1.0 level)
Calculates all retracement levels (0.0-1.0) and extension levels (above 1.0) based on this range
Plots horizontal lines with customizable styling and labels
How to Use:
For Retracement Trading: Watch for price reactions at key levels like 0.382, 0.5, and 0.618 (the Golden Ratio) during pullbacks in an uptrend
For Extension Targets: Use levels above 1.0 (especially 1.272, 1.414, and 1.618) to project potential profit targets
Adjust Sensitivity: Increase the "Pivot Sensibility" parameter for major swings only, or decrease it to capture more frequent price movements
Customize Lookback: Shorter periods (50-100 bars) work well for intraday trading, while longer periods (200-500 bars) suit swing trading and position trading
Settings:
Lookback Period: Controls how many candles back to search (10-500)
Pivot Sensibility: Determines the strength required to identify swing points (1-20)
Individual Level Toggles: Enable/disable any of the 18 Fibonacci levels
Visual Customization: Change colors, line thickness (1-5), and line style for each level
Label Options: Toggle price labels and percentage labels independently
Extension Controls: Choose to extend lines left, right, or both directions
What Makes This Original:
This indicator combines automatic swing detection with an extensive range of Fibonacci levels (18 total) that go well beyond the standard retracement tool. The left-to-right calculation methodology ensures logical level placement, while the comprehensive customization options allow traders to adapt the visual presentation to their specific trading style and chart setup.
Note: This indicator is designed for visual analysis and does not generate buy/sell signals. It's a tool to help identify potential support/resistance zones based on Fibonacci ratios. Always combine with other technical analysis methods and proper risk management.

Multi-Timeframe EMA Trend Dashboard with Volume and RSI Filters═══════════════════════════════════════════════════════════
MULTI-TIMEFRAME EMA TREND DASHBOARD
═══════════════════════════════════════════════════════════
OVERVIEW
This indicator provides a comprehensive view of trend direction across multiple timeframes using the classic EMA 20/50 crossover methodology, enhanced with volume confirmation and RSI filtering. It aggregates trend information from six timeframes into a single dashboard for efficient market analysis.
The indicator is designed for educational purposes and to assist traders in identifying potential trend alignments across different time horizons.
═══════════════════════════════════════════════════════════
FEATURES
═══════════════════════════════════════════════════════════
MULTI-TIMEFRAME ANALYSIS
• Monitors 6 timeframes simultaneously: 1m, 5m, 15m, 1H, 4H, 1D
• Each timeframe analyzed independently using request.security()
• Non-repainting implementation with proper lookahead settings
• Calculates overall trend strength as percentage of bullish timeframes
EMA CROSSOVER SYSTEM
• Fast EMA (default: 20) and Slow EMA (default: 50)
• Bullish: Fast EMA > Slow EMA
• Bearish: Fast EMA < Slow EMA
• Neutral: Fast EMA = Slow EMA (rare condition)
• Visual EMA plots with optional fill area
VOLUME CONFIRMATION
• Optional volume filter for crossover signals
• Compares current volume against moving average (default: 20-period SMA)
• Categorizes volume as: High (>1.5x average), Normal (>average), Low (70), oversold (<30), and neutral zones
• Used in quality score calculation
• Optional display toggle
SUPPORT & RESISTANCE DETECTION
• Automatic detection using highest/lowest over lookback period (default: 50 bars)
• Plots resistance (red), support (green), and mid-level (gray)
• Step-line style for clear visualization
• Optional display toggle
QUALITY SCORING SYSTEM
• Rates trade setups from 1-5 stars
• Considers: MTF alignment, volume confirmation, RSI positioning
• 5 stars: 4+ timeframes aligned + volume confirmed + RSI 50-70
• 4 stars: 4+ timeframes aligned + volume confirmed
• 3 stars: 3+ timeframes aligned
• 2 stars: Exactly 3 timeframes aligned
• 1 star: Other conditions
VISUAL DASHBOARD
• Clean table display (position customizable)
• Color-coded trend indicators (green/red/yellow)
• Extended statistics panel (toggleable)
• Shows: Trends, Strength, Quality, RSI, Volume, Price Distance
═══════════════════════════════════════════════════════════
TECHNICAL SPECIFICATIONS
═══════════════════════════════════════════════════════════
CALCULATIONS
Trend Determination per Timeframe:
• request.security() fetches EMA values with gaps=off, lookahead=off
• Compares Fast EMA vs Slow EMA
• Returns: 1 (bullish), -1 (bearish), 0 (neutral)
Trend Strength:
• Counts number of bullish timeframes
• Formula: (bullish_count / 6) × 100
• Range: 0% (all bearish) to 100% (all bullish)
Price Distance from EMA:
• Formula: ((close - EMA) / EMA) × 100
• Positive: Price above EMA
• Negative: Price below EMA
• Warning when absolute distance > 5%
ANTI-REPAINTING MEASURES
• All request.security() calls use lookahead=barmerge.lookahead_off
• Dashboard updates only on barstate.islast
• Historical bars remain unchanged
• Crossover signals finalize on bar close
═══════════════════════════════════════════════════════════
USAGE GUIDE
═══════════════════════════════════════════════════════════
INTERPRETING THE DASHBOARD
Timeframe Rows:
• Each row shows individual timeframe trend status
• Look for alignment (multiple timeframes same direction)
• Higher timeframes generally more significant
Strength Indicator:
• >66.67%: Strong bullish (4+ timeframes bullish)
• 33.33-66.67%: Mixed/choppy conditions
• <33.33%: Strong bearish (4+ timeframes bearish)
Quality Score:
• Higher stars = better confluence of factors
• 5-star setups have strongest multi-factor confirmation
• Lower scores may indicate weaker or conflicting signals
SUGGESTED APPLICATIONS
Trend Confirmation:
• Check if multiple timeframes confirm current chart trend
• Higher agreement = stronger trend confidence
• Use for position sizing decisions
Entry Timing:
• Wait for EMA crossover on chart timeframe
• Confirm with higher timeframe alignment
• Volume above average preferred
• RSI not in extreme zones
Divergence Detection:
• When lower timeframes diverge from higher
• May indicate trend exhaustion or reversal
• Requires additional confirmation
CUSTOMIZATION
EMA Settings:
• Adjust Fast/Slow lengths for different sensitivities
• Shorter periods = more responsive, more signals
• Longer periods = smoother, fewer signals
• Common alternatives: 10/30, 12/26, 50/200
Volume Filter:
• Enable for higher-quality signals (fewer false positives)
• Disable in always-liquid markets or for more signals
• Adjust MA length based on typical volume patterns
Display Options:
• Toggle EMAs, S/R levels, extended stats as needed
• Choose dashboard position to avoid chart overlap
• Adjust colors for visibility preferences
═══════════════════════════════════════════════════════════
ALERTS
═══════════════════════════════════════════════════════════
AVAILABLE ALERT CONDITIONS
1. Bullish EMA Cross (Volume Confirmed)
2. Bearish EMA Cross (Volume Confirmed)
3. Strong Bullish Alignment (4+ timeframes)
4. Strong Bearish Alignment (4+ timeframes)
5. Trend Strength Increasing (>16.67% jump)
6. Trend Strength Decreasing (>16.67% drop)
7. Excellent Trade Setup (5-star rating)
Alert messages use standard placeholders:
• {{ticker}} - Symbol name
• {{close}} - Current close price
• {{time}} - Bar timestamp
═══════════════════════════════════════════════════════════
LIMITATIONS & CONSIDERATIONS
═══════════════════════════════════════════════════════════
KNOWN LIMITATIONS
• Lower timeframe data may not be available on all symbols
• 1-minute data typically limited to recent history
• request.security() subject to TradingView data limits
• Dashboard requires screen space (may overlap on small screens)
• More complex calculations may affect load time on slower devices
NOT SUITABLE FOR
• Highly volatile/illiquid instruments (many false signals)
• News-driven markets during announcements
• Automated trading without additional filters
• Markets where EMA strategies don't perform well
DOES NOT PROVIDE
• Exact entry/exit prices
• Stop-loss or take-profit levels
• Position sizing recommendations
• Guaranteed profit signals
• Market predictions
═══════════════════════════════════════════════════════════
BEST PRACTICES
═══════════════════════════════════════════════════════════
RECOMMENDED USAGE
✓ Combine with price action analysis
✓ Use appropriate risk management
✓ Backtest on historical data before live use
✓ Adjust settings for specific market characteristics
✓ Wait for higher-quality setups in important trades
✓ Consider overall market context and fundamentals
NOT RECOMMENDED
✗ Using as standalone trading system without confirmation
✗ Trading every signal without discretion
✗ Ignoring risk management principles
✗ Trading without understanding the methodology
✗ Applying to unsuitable markets/timeframes
═══════════════════════════════════════════════════════════
EDUCATIONAL BACKGROUND
═══════════════════════════════════════════════════════════
EMA CROSSOVER STRATEGY
The Exponential Moving Average crossover is a classical trend-following technique:
• Golden Cross: Fast EMA crosses above Slow EMA (bullish signal)
• Death Cross: Fast EMA crosses below Slow EMA (bearish signal)
• Widely used since the 1970s in various markets
• More responsive than SMA due to exponential weighting
MULTI-TIMEFRAME ANALYSIS
Analyzing multiple timeframes helps traders:
• Identify alignment between short and long-term trends
• Reduce false signals from single-timeframe noise
• Understand market context across different horizons
• Make informed decisions about trade duration
VOLUME ANALYSIS
Volume confirmation adds reliability:
• High volume suggests institutional participation
• Low volume signals may indicate false breakouts
• Volume precedes price in many market theories
• Helps distinguish genuine moves from noise
═══════════════════════════════════════════════════════════
TECHNICAL IMPLEMENTATION
═══════════════════════════════════════════════════════════
CODE STRUCTURE
• Organized in clear sections with proper commenting
• Uses explicit type declarations (int, float, bool, color, string)
• Constants defined at top (BULLISH=1, BEARISH=-1, etc.)
• Functions documented with @function, @param, @returns
• Follows PineCoders naming conventions (camelCase variables)
PERFORMANCE OPTIMIZATION
• var keyword for table (created once, not every bar)
• Calculations cached where possible
• Dashboard updates only on last bar
• Minimal redundant security() calls
SECURITY IMPLEMENTATION
• Proper gaps and lookahead parameters
• No future data leakage
• Signals finalize on bar close
• Historical bars remain static
═══════════════════════════════════════════════════════════
VERSION INFORMATION
═══════════════════════════════════════════════════════════
Current Version: 2.0
Pine Script Version: 5
Last Updated: 2024
Developed by: Zakaria Safri
═══════════════════════════════════════════════════════════
SETTINGS REFERENCE
═══════════════════════════════════════════════════════════
EMA SETTINGS
• Fast EMA Length: 1-500 (default: 20)
• Slow EMA Length: 1-500 (default: 50)
VOLUME & MOMENTUM
• Use Volume Confirmation: true/false (default: true)
• Volume MA Length: 1-500 (default: 20)
• Show RSI Levels: true/false (default: true)
• RSI Length: 1-500 (default: 14)
PRICE ACTION FEATURES
• Show Price Distance: true/false (default: true)
• Show Key Levels: true/false (default: true)
• S/R Lookback Period: 10-500 (default: 50)
DISPLAY SETTINGS
• Show EMAs on Chart: true/false (default: true)
• Fast EMA Color: customizable (default: cyan)
• Slow EMA Color: customizable (default: orange)
• EMA Line Width: 1-5 (default: 2)
• Show Fill Between EMAs: true/false (default: true)
• Show Crossover Signals: true/false (default: true)
DASHBOARD SETTINGS
• Position: Top Left/Right, Bottom Left/Right
• Show Extended Statistics: true/false (default: true)
ALERT SETTINGS
• Alert on Multi-TF Alignment: true/false (default: true)
• Alert on Trend Strength Change: true/false (default: true)
═══════════════════════════════════════════════════════════
RISK DISCLAIMER
═══════════════════════════════════════════════════════════
This indicator is provided for educational and informational purposes only. It should not be considered financial advice or a recommendation to buy or sell any security.
IMPORTANT NOTICES:
• Past performance does not indicate future results
• All trading involves risk of capital loss
• No indicator guarantees profitable trades
• Always conduct independent research and analysis
• Use proper risk management and position sizing
• Consult a qualified financial advisor before trading
• The developer assumes no liability for trading losses
By using this indicator, you acknowledge that you understand these risks and accept full responsibility for your trading decisions.
═══════════════════════════════════════════════════════════
SUPPORT & CONTRIBUTIONS
═══════════════════════════════════════════════════════════
FEEDBACK WELCOME
• Constructive comments appreciated
• Bug reports help improve the indicator
• Feature suggestions considered for future versions
• Share your experience to help other users
OPEN SOURCE
This code is published as open source for the TradingView community to:
• Learn from the implementation
• Modify for personal use
• Understand multi-timeframe analysis techniques
If you find this indicator useful, please consider:
• Leaving a thoughtful review
• Sharing with other traders who might benefit
• Following for future updates and releases
═══════════════════════════════════════════════════════════
ADDITIONAL RESOURCES
═══════════════════════════════════════════════════════════
RECOMMENDED READING
• TradingView Pine Script documentation
• PineCoders community resources
• Technical analysis textbooks on moving averages
• Multi-timeframe trading strategy guides
• Risk management principles
RELATED CONCEPTS
• Trend following strategies
• Moving average convergence/divergence
• Multiple timeframe analysis
• Volume-price relationships
• Momentum indicators
═══════════════════════════════════════════════════════════
Thank you for using this indicator. Trade responsibly and continue learning!
═══════════════════════════════════════════════════════════

ZS Game Changer Pump & Dump DetectorZS GAME CHANGER PUMP AND DUMP DETECTOR - TOP 2 MOMENTUM TRACKER
Created by Zakaria Safri
An intelligent indicator specifically designed to identify and highlight the two most significant pump and dump candles within your selected lookback period. Perfect for traders who want to focus on the game-changing moves that truly matter in volatile markets like cryptocurrency, stocks, and forex.
CORE FEATURES
AUTOMATIC GAME CHANGER DETECTION
The indicator continuously scans your specified lookback period and automatically identifies the top 2 strongest pump candles and top 2 strongest dump candles. These game-changing candles are highlighted with distinctive gold labels and horizontal reference lines, making them instantly visible on your chart. Unlike other indicators that show every small move, this focuses exclusively on the market-moving moments that define trends and create opportunities.
INTELLIGENT PUMP AND DUMP CLASSIFICATION
Uses advanced percentage-based calculations to classify candles as pumps when price surges significantly upward and dumps when price plunges sharply downward. The detection system accounts for candle body size, wick proportions, and volume confirmation to ensure only legitimate momentum moves trigger signals. Customizable thresholds allow adaptation to any market volatility profile from calm stocks to wild altcoins.
ADVANCED WICK EXCLUSION FILTER
Eliminates false signals caused by candles with large wicks and small bodies. This filter focuses analysis exclusively on candles with substantial body sizes that indicate genuine directional conviction rather than temporary spikes followed by rejection. The body to candle ratio is fully adjustable to match your preferred signal quality standards.
VOLUME CONFIRMATION SYSTEM
Optional volume filter ensures detected pumps and dumps are backed by real market participation. The indicator compares current volume against a moving average and only triggers signals when volume exceeds your specified multiplier threshold. This eliminates low-volume noise and focuses on moves supported by institutional or crowd participation.
RALLY SEQUENCE DETECTION
Identifies and highlights consecutive sequences of pump or dump candles with colored background overlays. Green background indicates sustained buying pressure across multiple candles while red background shows sustained selling pressure. The rally detection system includes an optional one-miss allowance that prevents the sequence from breaking due to a single neutral candle.
HORIZONTAL REFERENCE LINES
Draws dashed lines from each game changer candle extending to the current bar, providing constant visual reference to the most significant support and resistance levels created by extreme momentum. The top game changer gets a thick dashed line while the second gets a dotted line for easy differentiation. Labels on the right side display the exact percentage move.
COMPREHENSIVE STATISTICS DASHBOARD
Real-time information panel showing current market status as pumping, dumping, or neutral along with the current candle percentage change. Displays the exact percentage values for top pump number 1, top pump number 2, top dump number 1, and top dump number 2. Shows running totals of all pumps and dumps detected since chart load. Tracks consecutive candle counts during active rally sequences.
TESTING AND VERIFICATION MODE
Built-in debug mode displays percentage change directly on each qualifying pump and dump candle, allowing instant verification that calculations are accurate. Shows which filters are currently active with a simple code in the dashboard. Helps traders understand exactly why certain candles qualified as game changers.
HOW THE GAME CHANGER DETECTION WORKS
SCANNING ALGORITHM
Every bar close, the indicator scans backward through your specified lookback period examining every candle's percentage change from its previous close. For bullish moves, it identifies the two candles with the largest positive percentage change that meet your threshold requirements. For bearish moves, it identifies the two candles with the largest negative percentage change meeting threshold requirements.
RANKING SYSTEM
Candles are ranked purely by their percentage move magnitude. The number 1 game changer is always the single strongest move in the lookback period. The number 2 game changer is the second strongest move. Rankings update dynamically as new candles form and old candles exit the lookback window.
VISUAL IDENTIFICATION
Game changer number 1 for both pumps and dumps receives a large gold label reading GAME CHANGER NUMBER 1 with zero transparency for maximum visibility. Game changer number 2 receives a slightly smaller gold label with partial transparency. The candle bars themselves are colored in gold instead of the standard green or red. Horizontal lines extend from the game changer price level to current bar.
FILTER APPLICATION
Only candles that pass your configured filters qualify for game changer consideration. If wick exclusion is enabled, candles with large wicks and small bodies are ignored. If volume confirmation is enabled, only candles with above-average volume qualify. This ensures game changers represent legitimate market moves rather than aberrations.
PRACTICAL APPLICATIONS
FOR CRYPTOCURRENCY TRADERS
Crypto markets experience extreme volatility with occasional massive pump and dump candles that define entire trends. This indicator instantly identifies which candles represent true market structure shifts versus normal noise. Use the game changer levels as key support and resistance for entries, exits, and stop placement. The top pump often marks the local high to watch for breakouts while the top dump marks the local low for reversal trades.
FOR DAY TRADERS
Intraday charts contain hundreds of candles but only a few truly matter for the session outcome. Game changer detection filters out 98 percent of candles to show you the 2 percent that drove the actual price movement. Enter trades on the side of the strongest recent game changer. Use game changer levels as magnet prices where algorithmic trading often returns.
FOR SWING TRADERS
On daily and four-hour timeframes, game changers represent major institutional activity or news-driven moves. The top dump often marks capitulation selling that creates reversal opportunities. The top pump often marks FOMO buying that creates resistance levels. Swing traders can build positions knowing these levels will be defended or tested multiple times.
FOR VOLATILITY ANALYSIS
Understanding which candles created the most volatility helps assess market risk. Multiple game changers clustered together indicate unstable choppy conditions. Game changers separated by many neutral candles indicate trending stable conditions. Use this context to adjust position sizing and stop distances appropriately.
FOR SUPPORT AND RESISTANCE TRADING
Game changer candles create the strongest support and resistance levels because they represent prices where massive volume transacted in short time periods. These levels have higher probability of holding on retest compared to arbitrary moving averages or pivot points. Trade bounces off game changer levels or breakouts through them.
RECOMMENDED SETTINGS BY MARKET
CRYPTOCURRENCY 15-MINUTE TO 1-HOUR CHARTS
Candle Size Threshold: 2.0 percent
Body to Candle Ratio: 0.5
Volume Multiplier: 1.5 times average
Game Changer Lookback: 100 bars
Extreme Threshold: 3.5 percent
Enable Wick Filter: Yes
Enable Volume Confirmation: Yes
Minimum Rally Candles: 3
STOCKS DAILY CHARTS
Candle Size Threshold: 1.0 percent
Body to Candle Ratio: 0.6
Volume Multiplier: 2.0 times average
Game Changer Lookback: 50 bars
Extreme Threshold: 2.5 percent
Enable Wick Filter: Yes
Enable Volume Confirmation: Yes
Minimum Rally Candles: 2
FOREX 1-HOUR TO 4-HOUR CHARTS
Candle Size Threshold: 0.5 percent
Body to Candle Ratio: 0.5
Volume Multiplier: Not applicable
Game Changer Lookback: 80 bars
Extreme Threshold: 1.0 percent
Enable Wick Filter: Yes
Enable Volume Confirmation: No
Minimum Rally Candles: 3
SCALPING 1-MINUTE TO 5-MINUTE CHARTS
Candle Size Threshold: 0.8 percent
Body to Candle Ratio: 0.4
Volume Multiplier: 1.2 times average
Game Changer Lookback: 50 bars
Extreme Threshold: 1.5 percent
Enable Wick Filter: No
Enable Volume Confirmation: Yes
Minimum Rally Candles: 2
WHAT IS INCLUDED
Automatic identification of top 2 pump candles
Automatic identification of top 2 dump candles
Gold colored game changer labels with size differentiation
Gold colored candle bars for game changers
Horizontal reference lines from game changers to current price
Regular pump and dump detection with green and red candles
Rally sequence detection with background highlighting
Extreme move detection and labeling system
Real-time statistics dashboard with all key metrics
Percentage change debug mode for verification
Volume confirmation filter with adjustable multiplier
Wick exclusion filter with adjustable body ratio
Customizable lookback period from 20 to 500 bars
Consecutive candle counter for rally tracking
Alert system for game changers, pumps, dumps, and rallies
Works on all timeframes from 1 minute to monthly
Compatible with stocks, forex, cryptocurrency, and futures
UNDERSTANDING GAME CHANGERS
WHAT MAKES A CANDLE A GAME CHANGER
A game changer is not just a large move but the largest move within context. In a volatile crypto market, a 5 percent pump might not rank in the top 2. In a stable stock, a 2 percent pump could be the number 1 game changer. The indicator adapts to your specific instrument and timeframe to find what truly matters in that context.
WHY FOCUS ON TOP 2 ONLY
Markets are driven by a small number of significant moves rather than the average of all moves. By focusing exclusively on the top 2 in each direction, traders can ignore noise and concentrate on the price levels that actually matter for support, resistance, and momentum. This creates clarity in decision making.
GAME CHANGERS AS MARKET STRUCTURE
The top pump often marks the recent high that bulls must break to continue uptrend. The top dump often marks the recent low that bears must break to continue downtrend. These become the key levels around which all other price action rotates. Understanding this structure is essential for profitable trading.
GAME CHANGERS AS SENTIMENT INDICATORS
Consecutive pump game changers signal strong bullish sentiment and FOMO conditions. Consecutive dump game changers signal fear and capitulation. Alternating pump and dump game changers signal indecision and range conditions. Read the pattern of game changers to gauge market psychology.
VERIFICATION AND TESTING
HOW TO VERIFY ACCURACY
Enable Show Debug Info on Chart in the Testing and Debug settings group. This displays the percentage change calculation directly on every qualifying pump and dump candle. Manually verify by calculating open minus close divided by close multiplied by 100. The debug percentage should match your manual calculation exactly.
HOW TO TEST FILTERS
Toggle wick exclusion filter on and off while watching how many candles qualify. With filter on, candles with long wicks and small bodies should disappear. Toggle volume confirmation on and off to see how low-volume candles get excluded. Adjust the thresholds and watch the real-time impact on signal count.
HOW TO VERIFY GAME CHANGERS
Look at your chart and visually identify which candle had the biggest green body in the lookback period. The game changer number 1 pump label should be on that exact candle. Repeat for the biggest red candle to verify game changer number 1 dump. The rankings should match your visual assessment.
LOOKBACK PERIOD EFFECTS
Decrease the lookback period to 20 bars and watch game changers update to only recent moves. Increase to 500 bars and watch game changers potentially change to older historic moves. The optimal lookback balances recency with significance. Too short misses important levels, too long includes irrelevant history.
DASHBOARD INFORMATION GUIDE
STATUS ROW
Shows PUMPING when current candle qualifies as a pump, DUMPING when current candle qualifies as a dump, or NEUTRAL when current candle does not meet threshold requirements. This updates in real-time on every bar close.
CURRENT CHANGE ROW
Displays the percentage change of the current candle from its previous close. Positive percentages indicate bullish candle, negative indicate bearish candle. This number may or may not meet your threshold to qualify as pump or dump.
TOP PUMP NUMBER 1
The highest positive percentage change found in your lookback period. This candle is marked with the large gold GAME CHANGER NUMBER 1 label below it. Shows N/A if no pumps exist in the lookback period.
TOP PUMP NUMBER 2
The second highest positive percentage change found in your lookback period. Marked with smaller gold GAME CHANGER NUMBER 2 label. Shows N/A if only one or zero pumps exist.
TOP DUMP NUMBER 1
The highest negative percentage change magnitude found in your lookback period. This candle is marked with the large gold GAME CHANGER NUMBER 1 label above it. Shows N/A if no dumps exist.
TOP DUMP NUMBER 2
The second highest negative percentage change magnitude found in your lookback period. Marked with smaller gold GAME CHANGER NUMBER 2 label. Shows N/A if only one or zero dumps exist.
TOTAL PUMPS
Running count of all pump candles detected since you loaded the indicator on this chart. This number continuously increases as new qualifying pumps form. Resets when you reload the chart.
TOTAL DUMPS
Running count of all dump candles detected since chart load. Increases as new qualifying dumps form and resets on chart reload.
CONSECUTIVE
Shows the current count of consecutive pump or dump candles during an active rally. Displays 3 UP during a 3-candle pump rally or 5 DN during a 5-candle dump rally. Shows 0 when no rally is active.
ALERT SYSTEM
GAME CHANGER DETECTED ALERT
Triggers whenever the current candle becomes one of the top 2 pumps or top 2 dumps. This is the highest priority alert indicating a market-moving event just occurred. Use this alert for immediate notification of significant opportunities.
PUMP DETECTED ALERT
Triggers on every candle that qualifies as a pump according to your threshold and filter settings. This includes regular pumps and extreme pumps but excludes game changers which have their separate alert. Use for general upward momentum monitoring.
DUMP DETECTED ALERT
Triggers on every candle that qualifies as a dump according to your settings. Includes regular and extreme dumps but excludes game changers. Use for general downward momentum monitoring.
PUMP RALLY STARTED ALERT
Triggers when consecutive pump candles reach your minimum rally threshold. Indicates the beginning of a sustained upward movement sequence. Use to catch trends early.
DUMP RALLY STARTED ALERT
Triggers when consecutive dump candles reach your minimum rally threshold. Indicates the beginning of a sustained downward movement sequence. Use for trend following or reversal timing.
ALERT MESSAGE FORMAT
All alerts include the ticker symbol and current price using TradingView placeholders. Messages are descriptive and specify which type of signal triggered. Alerts work with TradingView notification system including email, SMS, webhook, and app notifications.
TECHNICAL SPECIFICATIONS
CALCULATION METHODOLOGY
Percentage change calculated as current close minus previous close divided by previous close multiplied by 100. Body ratio calculated as absolute value of close minus open divided by high minus low. Volume elevation calculated as current volume divided by 20-period simple moving average of volume. Game changer ranking uses absolute value comparison across entire lookback array.
PERFORMANCE CHARACTERISTICS
Lightweight calculations optimized for speed on all timeframes. No repainting of signals ensuring all triggers are final on bar close. Variables properly scoped with var keyword for memory efficiency. Maximum bars back set to 500 to prevent excessive historical loading. Updates in real-time on every bar close without lag.
COMPATIBILITY
Works on all TradingView plans including free, pro, and premium. Compatible with stocks, forex, cryptocurrency, futures, indices, and commodities. Functions correctly on all timeframes from 1 second to monthly. No external data requests ensuring fast loading. Overlay true setting places directly on price chart.
RISK DISCLAIMER
This indicator is a technical analysis tool for identifying momentum and should not be used as the sole basis for trading decisions. Game changer levels can be broken during strong trends and are not guaranteed support or resistance. Pump and dump detection does not predict future price direction. Always use proper risk management with stop losses on every trade. Combine this indicator with other forms of analysis including fundamentals, market context, and risk assessment. Practice on demo accounts before live trading. Past performance of game changer signals does not guarantee future results. Trading carries substantial risk of loss and is not suitable for all investors. The creator is not responsible for trading losses incurred while using this tool.
SUPPORT AND UPDATES
Regular updates based on user feedback and market evolution. Built following PineCoders industry standards and best practices for code quality. Clean well-documented code structure for transparency and auditability. Optimized performance across all timeframes and instruments. Active development with continuous improvements and feature additions.
WHY CHOOSE ZS GAME CHANGER PUMP AND DUMP DETECTOR
Focuses on what matters by highlighting only the top 2 moves in each direction instead of cluttering your chart with every small fluctuation. Saves time by automatically identifying the most significant candles rather than requiring manual scanning. Provides clarity through visual gold labels and reference lines that make game changers unmistakable. Adapts to any market with customizable thresholds for volatility and volume. Eliminates noise with advanced wick and volume filters ensuring signal quality. Offers verification through debug mode proving calculations are accurate and trustworthy. Includes comprehensive statistics showing exact percentages and counts. Works everywhere across all markets, timeframes, and instruments without modification.
Transform your chart analysis by focusing exclusively on the game-changing moments that define trends and create opportunities.
Version 1.1 | Created by Zakaria Safri | Pine Script Version 5 | PineCoders Compliant

FSVZO | Lyro RSFSVZO | Lyro RS
This script is a technical analysis tool called the FSVZO, or Fourier Smoothed Volume Zone Oscillator. It is designed to analyze market momentum and trend strength by combining price and volume data with advanced smoothing techniques. The goal is to help identify potential trends, overbought/oversold conditions, and divergence signals in a clear visual format.
Understanding the Indicator's Components
The indicator plots a main oscillator line and several supporting elements on a separate pane below the chart.
The Main Oscillator: This is the primary, colored wave. Its movement and color are key to interpretation.
Trend Direction: The color shifts between bullish and bearish tones based on the momentum of the oscillator. This provides a quick visual reference for the prevailing short-term trend.
Key Levels: Horizontal lines mark significant levels such as +60, +85, -60, and -85. Movements above +60 or below -60 can indicate strong momentum, while approaches to the extreme levels (+85/-85) may suggest overbought or oversold conditions.
Divergence Detection: The indicator can plot labels ("ℝ" for Regular, "ℍ" for Hidden) on the oscillator to signal potential divergences. These occur when the indicator's direction differs from the price action on the main chart and can sometimes foreshadow reversals or continuations.
Moving Average (MA): A central moving average line, based on the oscillator, helps to smooth out the data further and can act as a dynamic support or resistance level within the indicator pane.
White Noise Filter (Optional): This feature displays a histogram that represents market noise. It can be toggled on or off. Analyzing the histogram's behavior may provide additional context on the stability or volatility of the current trend.
Dynamic Background: The background of the indicator pane can change color to highlight periods where the momentum is particularly strong, based on the position of the moving average.
Suggested Use and Interpretation
Traders might use this indicator in several ways:
Trend Identification: Observe the color and position of the main oscillator. A predominantly bullish-colored oscillator above the zero line may suggest an upward trend, while a bearish-colored one below zero may suggest a downward trend.
Signal Confirmation: Look for the oscillator to cross key levels (like +/-40 or +/-60) in the direction of a suspected trend as a confirmation signal.
Divergence Analysis: When the price makes a new high or low that is not confirmed by a new high or low on the FSVZO oscillator (a divergence), it can be a warning of potential weakness in the trend. The "ℝ" and "ℍ" labels help to identify these scenarios.
Extreme Readings: Readings near the +85 or -85 levels can indicate that a price move may be overextended, which could precede a pause or reversal.
Customization Options
The indicator includes settings groups that allow you to adjust its behavior and appearance:
FSVZO Settings: Adjust parameters like Length and Sensitivity to make the oscillator more or less responsive to market movements.
Signals & Display: Modify visual aspects such as Smooth Length and Glowing Amount, or toggle features like the dynamic background on and off.
Colors: Choose from several pre-set color palettes to suit your visual preferences.
⚠️Disclaimer
This indicator is a tool for technical analysis and does not provide guaranteed results. It should be used in conjunction with other analysis methods and proper risk management practices. The creators of this indicator are not responsible for any financial decisions made based on its signals.
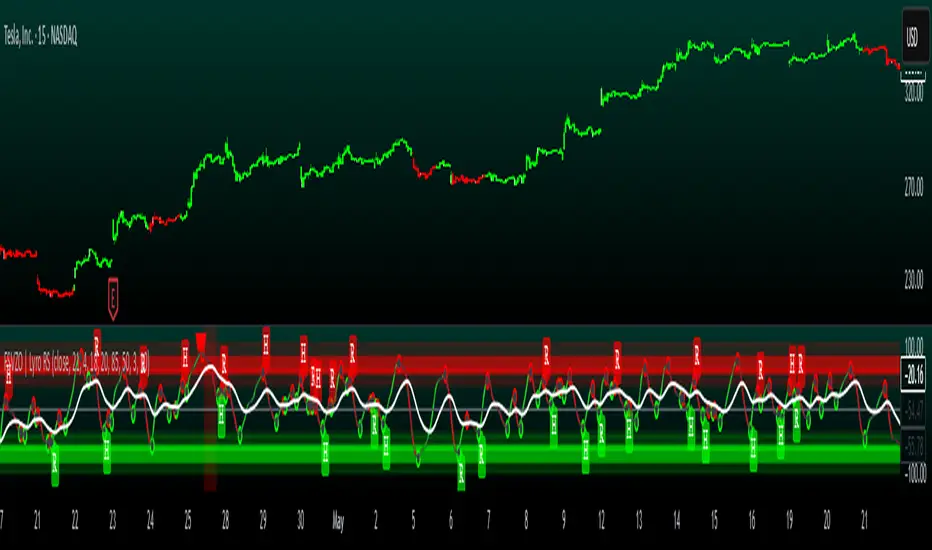
Gann Trading Strategy📈 Simple & Powerful Gann-Based Trading System
This indicator automatically calculates key Gann support and resistance levels based on W.D. Gann's mathematical principles. Simply input either the highest price (for bearish setups) or lowest price (for bullish setups), and the indicator automatically generates all trading levels.
🎯 Key Features:
Automatic Level Calculation - Just select High/Low price projection basis
Complete Trading Framework - Entry zone, 3 Take Profit levels, and Exit level
Visual Trading Zones - Color-coded zones around each level for better entry/exit timing
Smart Alerts - Get notified when price reaches key levels
Bullish & Bearish Setups - Works for both long and short trading strategies
Customizable Display - Show/hide levels, adjust colors, line styles, and zone widths
🚀 How to Use:
Select "Lowest Price" for bullish setup or "Highest Price" for bearish setup
Input the relevant high or low price from your analysis
The indicator automatically calculates and displays all trading levels
Use the green entry zone for entries, blue levels for take profits, red level for exits
📊 Perfect for:
Swing trading
Position sizing and risk management
Support/resistance analysis
Multi-timeframe analysis
Uses time-tested Gann principles to automatically find key price levels for trading.

Table Logic ExtractorTable Logic Extractor v2.0
Advanced multi-timeframe analysis with intelligent trade recommendations!
Overview:
This sophisticated indicator provides comprehensive market analysis through multiple technical indicators and timeframes. It combines EMA analysis, RSI momentum, MACD signals, Bollinger Bands, volume analysis, divergence detection, and intelligent trade recommendations with support/resistance distance calculations and trading style detection.
Key Features:
✅ Multi-Indicator Analysis - EMA, RSI, MACD, Bollinger Bands, Volume, ATR
✅ Multi-Timeframe Analysis - M1, M5, M15, M30 trend comparison
✅ Divergence Detection - Bullish and bearish divergence with strength calculation
✅ Support/Resistance Analysis - Distance calculations with Fibonacci levels
✅ Trading Style Detection - Trend, Range, Breakout, Scalping identification
✅ Intelligent Trade Signals - Style-based trade recommendations with confidence levels
✅ Risk Management - Stop Loss and Take Profit calculations
✅ Comprehensive Table - Real-time analysis with 14 different metrics
How It Works:
The indicator uses advanced analysis:
• Multi-Timeframe - M1, M5, M15, M30 trend analysis
• Style Detection - Automatic trading style identification
• S/R Analysis - Fibonacci-based support/resistance levels
• Weighted Scoring - EMA (2.0), RSI (1.5), MACD (1.5), BB (1.0), Volume (1.0)
• Intelligent Signals - Style-based trade recommendations
Trading Style Detection:
• TREND TRADING - Strong trend + aligned timeframes (Green)
• RANGE TRADING - Low volatility + sideways movement (Yellow)
• BREAKOUT TRADING - High volume + near levels (Orange)
• SCALPING - High volatility + quick moves (Red)
Information Table (14 Metrics):
Real-time display showing:
• ATR volatility with signal (HIGH/MED/LOW/NORMAL VOL)
• Divergence status with strength percentage
• S/R Distance with Fibonacci levels
• Stop Loss (2.0:1 ratio) and Take Profit 1 (1.5:1 ratio)
• Multi-Timeframe analysis (M1, M5, M15, M30)
• Scalping signals with confidence levels
• Current trend with strength percentage
• Intelligent trade recommendations
Trade Recommendations:
• TREND BUY/SELL - All timeframes aligned (High confidence)
• SHORT-TERM BUY/SELL - M5 signal only (Medium confidence)
• SCALPING BUY/SELL - M5 vs higher timeframes (Low confidence)
• WAIT - No clear signal (No confidence)
Support/Resistance Analysis:
• Fibonacci Levels: 23.6%, 38.2%, 50% retracements
• Distance Categories: Very Near (Red), Near (Orange), Medium (Yellow), Far (Green)
• ATR-based distance measurement
• Real-time proximity alerts
Scalping Detection:
Specialized signals based on:
• High volatility (ATR ratio > 1.5)
• Quick price moves (fast momentum)
• Volume confirmation (high volume spikes)
• RSI extremes (oversold/overbought)
Settings:
• EMA - Fast (9), Slow (21), Trend (50)
• RSI - Length (14), Overbought (70), Oversold (30)
• MACD - Fast (12), Slow (26), Signal (9)
• Bollinger Bands - Length (20), Multiplier (2.0)
• ATR - Length (14) for volatility measurement
• Volume Threshold - 1.5x average volume
• Divergence - Lookback (3), Threshold (0.5)
Best Practices:
🎯 Adapt strategy to detected trading style
📊 Use multi-timeframe analysis for confirmation
⚡ Monitor S/R distances for entry timing
🛡️ Always use calculated Stop Loss levels
🔍 Watch for divergence signals
📈 Follow intelligent trade recommendations
Pro Tips:
• Table provides all essential information in one place
• Trading style detection helps adapt your strategy
• S/R distance shows proximity to key levels
• Confidence levels indicate signal reliability
• Multi-timeframe alignment increases success rate
• Scalping signals work best in high volatility
Alerts:
• Trend Change Alert - "Trend changed across timeframes"
• Divergence Alert - "Divergence detected"
• Scalping Alert - "Scalping opportunity"
• Trade Signal Alert - "Trade recommendation available"
Version 2.0 Improvements:
• Advanced multi-timeframe analysis (M1, M5, M15, M30)
• Intelligent trading style detection
• Comprehensive support/resistance analysis
• Professional trade recommendations with confidence levels
• Scalping detection with specialized signals
• Risk management with calculated SL/TP levels
• 14-metric comprehensive information table
Created with ❤️ for the trading community
This indicator is free to use for both commercial and non-commercial purposes.

[GrandAlgo] Moving Averages Cross LevelsMoving Averages Cross Levels
Many traders watch for moving average crossovers – such as the golden cross (50 MA crossing above 200 MA) or death cross – as signals of changing trends. However, once a crossover happens, the exact price level where it occurred often fades from view, even though that level can be an important reference point. Moving Averages Cross Levels is an indicator that keeps those crossover price levels visible on your chart, helping you track where momentum shifts occurred and how price behaves relative to those key levels.
This tool plots horizontal line segments at the price where each pair of selected moving averages crossed within a recent window of bars. Each level is labeled with the moving average lengths (for example, “21×50” for a 21/50 MA cross) and is color-coded – green for bullish crossovers (short-term MA crossing above long-term MA) and red for bearish crossunders (short-term crossing below). By visualizing these crossover levels, you can quickly identify past trend change points and use them as potential support/resistance or decision levels in your trading. Importantly, this indicator is non-repainting – once a crossover level is plotted, it remains fixed at the historical price where the cross occurred, allowing you to continually monitor that level going forward. (As with any moving average-based analysis, crossover signals are lagging, so use these levels in conjunction with other tools for confirmation.)
Key Features:
✅ Multiple Moving Averages: Track up to 7 different MAs (e.g. 5, 8, 21, 50, 64, 83, 200 by default) simultaneously. You can enable/disable each MA and set its length, allowing flexible combinations of short-term and long-term averages.
✅ Selectable MA Type: Each average can be calculated as a Simple (SMA), Exponential (EMA), Volume-Weighted (VWMA), or Smoothed (RMA) moving average, giving you flexibility to match your preferred method.
✅ Auto Crossover Detection: The script automatically detects all crosses between any enabled MA pairs, so you don’t have to specify pairs manually. Whether it’s a fast cross (5×8) or a long-term cross (50×200), every crossover within the lookback period will be identified and marked.
✅ Horizontal Level Markers: For each detected crossover, a horizontal line segment is drawn at the exact price where the crossover occurred. This makes it easy to glance at your chart and see precisely where two moving averages intersected in the recent past.
✅ Labeled and Color-Coded: Each crossover line is labeled with the two MA lengths that crossed (e.g. “50×200”) for clear identification. Colors indicate crossover direction – by default green for bullish (positive) crossovers and red for bearish (negative) crossovers – so you can tell at a glance which way the trend shifted. (You can customize these colors in the settings.)
✅ Adjustable Lookback: A “Crosses with X candles” input lets you control how far back the script looks for crossovers to plot. This prevents your chart from getting cluttered with too many old levels – for example, set X = 100 to show crossovers from roughly the last 100 bars. Older crossover lines beyond this lookback window will automatically clear off the chart.
✅ Optional MA Plots: You can toggle the display of each moving average line on the chart. This means you can either view just the crossover levels alone for a clean look, or also overlay the MA curves themselves for additional context (to see how price and MAs were moving around the crossover).
✅ No Repainting or Hindsight Bias: Once a crossover level is plotted, it stays at that fixed price. The indicator doesn’t move levels around after the fact – each line is a true historical event marker. This allows you to backtest visually: see how price acted after the crossover by observing if it retested or respected that level later.
How It Works:
1️⃣ Add to Chart & Configure – Simply add the indicator to your chart. In the settings, choose which moving averages you want to include and set their lengths. For example, you might enable 21, 50, 200 to focus on medium and long-term crosses (including the golden cross), or turn on shorter MAs like 5 and 8 for quick momentum shifts. Adjust the lookback (number of bars to scan for crosses) if needed.
2️⃣ Visualization – The script continuously checks the latest X bars for any points where one MA crossed above or below another. Whenever a crossover is found, it calculates the exact price level at which the two moving averages intersected. On the last bar of your chart, it will draw a horizontal line segment extending from the crossover bar to the current bar at that price level, and place a label to the right of the line with the MA lengths. Green lines/labels signify bullish crossovers (where the first MA crossed above the second), and red lines indicate bearish crossunders.
3️⃣ On Your Chart – You will see these labeled levels aligned with the price scale. For example, if a 50 MA crossed above a 200 MA (bullish) 50 bars ago at price $100, there will be a green “50×200” line at $100 extending to the present, showing you exactly where that golden cross happened. You might notice price pulling back near that level and bouncing, or if price falls back through it, it could signal a failed crossover. The indicator updates in real-time: if a new crossover happens on the latest bar, a new line and label will instantly appear, and if any old cross moves out of the lookback range, its line is removed to keep the chart focused.
4️⃣ Customization – You can fine-tune the appearance: toggle any MA’s visibility, change line colors or label styles, and modify the lookback length to suit different timeframes. For instance, on a 1-hour chart you might use a lookback of 500 bars to see a few weeks of cross history, whereas on a daily chart 100 bars (about 4–5 months) may be sufficient. Adjust these settings based on how many crossover levels you find useful to display.
Ideal for Traders Who:
Use MA Crossovers in Strategy: If your strategy involves moving average crossovers (for trend confirmation or entry/exit signals), this indicator provides an extra layer of insight by keeping the price of those crossover events in sight. For example, trend-followers can watch if price stays above a bullish crossover level as a sign of trend strength, or falls below it as a sign of weakness.
Identify Support/Resistance from MA Events: Crossover levels often coincide with pivot points in market sentiment. A crossover can act like a regime change – the level where it happened may turn into support or resistance. This tool helps you mark those potential S/R levels automatically. Rather than manually noting where a golden cross occurred, you’ll have it highlighted, which can be useful for setting stop-losses (e.g. below the crossover price in a bullish scenario) or profit targets.
Track Multiple Averages at Once: Instead of focusing on just one pair of moving averages, you might be interested in the interaction of several (short, medium, and long-term trends). This indicator caters to that by plotting all relevant crossovers among your chosen MAs. It’s great for multi-timeframe thinkers as well – e.g. you could apply it on a higher timeframe chart to mark major cross levels, then drill down to lower timeframes knowing those key prices.
Value Clean Visualization: There are no flashing signals or arrows – just simple lines and labels that enhance your chart’s storytelling. It’s ideal if you prefer to make trading decisions based on understanding price interaction with technical levels rather than following automatic trade calls. Moving Averages Cross Levels gives you information to act on, without imposing any bias or strategy – you interpret the crossover levels in the context of your own trading system.

Crypto Perp Calc v1Advanced Perpetual Position Calculator for TradingView
Description
A comprehensive position sizing and risk management tool designed specifically for perpetual futures trading. This indicator eliminates the confusion of calculating leveraged positions by providing real-time position metrics directly on your chart.
Key Features:
Interactive Price Selection: Click directly on chart to set entry, stop loss, and take profit levels
Accurate Lot Size Calculation: Instantly calculates the exact position size needed for your margin and leverage
Multiple Entry Support: DCA into positions with up to 3 entry points with customizable allocation
Multiple Take Profit Levels: Scale out of positions with up to 3 TP targets
Comprehensive Risk Metrics: Shows dollar P&L, account risk percentage, and liquidation price
Visual Risk/Reward: Color-coded boxes and lines display your trade setup clearly
Real-time Info Table: All critical position data in one organized panel
Perfect for traders using perpetual futures who need precise position sizing with leverage.
---------
How to Use
Quick Start (3 Clicks)
1. Add the indicator to your chart
2. Click three times when prompted:
First click: Set your entry price
Second click: Set your stop loss
Third click: Set your take profit
3. Read the TOTAL LOTS value from the info table (highlighted in yellow)
4. Use this lot size in your exchange when placing the trade
Detailed Setup
Step 1: Configure Your Account
Enter your account balance (total USDT in account)
Set your margin amount (how much USDT to risk on this trade)
Choose your leverage (1x to 125x)
Select Long or Short position
Step 2: Set Price Levels
Main levels use interactive clicking (Entry, SL, TP)
For multiple entries or TPs, use the settings panel to manually input prices and percentages
Step 3: Read the Results
The info table shows:
TOTAL LOTS - The position size to enter on your exchange
Margin Used - Your actual capital at risk
Notional - Total position value (margin × leverage)
Max Risk - Dollar amount you'll lose at stop loss
Total Profit - Dollar amount you'll gain at take profit
R:R Ratio - Risk to reward ratio
Account Risk - Percentage of account at risk
Liquidation - Price where position gets liquidated
Step 4: Advanced Features (Optional)
Multiple Entries (DCA):
Enable "Use Multiple Entries"
Set up to 3 entry prices
Allocate percentage for each (must total 100%)
See individual lot sizes for each entry
Multiple Take Profits:
Enable "Use Multiple TPs"
Set up to 3 TP levels
Allocate percentage to close at each level (must total 100%)
View profit at each target
Visual Elements
Blue lines/labels: Entry points
Red lines/labels: Stop loss
Green lines/labels: Take profit targets
Colored boxes: Visual risk (red) and reward (green) zones
Info table: Can be positioned anywhere on screen
Alerts
Set price alerts for:
Entry zones reached
Stop loss approached
Take profit levels hit
Works with TradingView's alert system
Tips for Best Results
Always verify the lot size matches your intended risk
Check the liquidation price stays far from your stop loss
Monitor the account risk percentage (recommended: keep under 2-3%)
Use the warning indicators if risk exceeds margin
For quick trades, use single entry/TP; for complex strategies, use multiple levels
Example Workflow
Find your trade setup using your analysis
Add this indicator and click to set levels
Check risk metrics in the table
Copy the TOTAL LOTS value
Enter this exact position size on your exchange
Set alerts for key levels if desired
This tool bridges the gap between TradingView charting and exchange execution, ensuring your position sizing is always accurate when trading with leverage.
Disclaimer, this was coded with help of AI, double check calculations if they are off.

Enhanced 4H Candle Countdown & High/Low IndicatorBy profitgang
This Pine Script indicator provides real-time tracking of 4-hour timeframe levels with an integrated countdown timer, designed to help traders monitor key support and resistance zones.
Key Features
📊 Visual Elements
4H High/Low Lines: Clear visualization of previous 4-hour candle high and low levels
Range Fill: Subtle background fill between high and low for better context
Mid-Level Line: Shows the middle point of the 4H range
Position Indicator: Visual cue showing current price position within the range
⏰ Countdown Timer
Real-time countdown to next 4H candle close
Customizable table position (9 different locations)
Adjustable text size (6 size options from Tiny to Huge)
Distance calculations showing percentage distance from key levels
🎯 Signal Generation
Long signals when price crosses above 4H low
Short signals when price crosses below 4H high
RSI confluence filter to reduce false signals
Background highlighting for active signals
TradingView alerts compatible
⚙️ Customization Options
Toggle all features on/off independently
Custom colors for all elements
Table positioning (top/middle/bottom + left/center/right)
Text size selection for optimal readability
Alert notifications for level breaks and updates
How It Works
The indicator fetches the previous 4-hour candle's high and low values and displays them as horizontal lines on your current timeframe chart. It continuously calculates the time remaining until the current 4H candle closes and presents this information in a clean, customizable table.
Use Cases
Swing Trading: Identify key 4H support and resistance levels
Intraday Trading: Monitor when new 4H levels will be established
Risk Management: Calculate distance from key levels for position sizing
Multi-timeframe Analysis: Combine with lower timeframe setups
Educational Purpose
This indicator is designed for educational and analytical purposes to help traders understand price action relative to higher timeframe levels. It provides clear visual feedback about market structure and timing.
Settings Groups
Display Settings: Toggle features, positioning, and sizing
Colors: Customize all visual elements
Signal Settings: Configure alert conditions and confluence filters
Compatibility
Works on all timeframes (recommended for 1m to 1H charts)
Compatible with all instruments
Includes proper alert functionality for automated notifications
Optimized for both light and dark themes
This indicator does not provide financial advice. Always conduct your own research and risk management before making trading decisions.

DTLLC Time & PriceDTLLC Time and Price with Signals
This indicator is built for traders who understand ICT concepts and want a structured, visual way to align time-based price action with key market levels. By combining customizable trading windows, breakout logic, and daily reference points, it helps you identify high-probability trade opportunities while filtering out market noise.
Key Features
1. Dual Custom Time Ranges (Kill Zones)
Set two independent time ranges per day (start/end hour and minute).
Each range identifies the highest high and lowest low within its window.
Built-in breakout detection generates buy/sell signals when price moves beyond these levels.
2. Volatility Filtering
Adjustable volatility threshold based on True Range relative to ATR.
Filters out low-quality signals during choppy, low-volatility conditions.
3. ATR-Based Stop Loss
Custom ATR length and stop-loss multiplier settings.
Automatically plots ATR-based stop levels for triggered trades.
4. Daily Key Levels
Plots Previous Day High, Previous Day Low, and Midnight Open continuously on the chart.
Useful for spotting breakout and reversal opportunities in line with ICT market structure concepts.
5. Liquidity & Engulfing Candle Highlights
Highlights potential liquidity grab zones (yellow candles) when significant highs/lows are set within your lookback period.
Detects bullish (green) and bearish (red) engulfing patterns for added confluence.
6. Visual & Signal Tools
Buy/Sell signals plotted directly on chart (separate colors for Range 1 and Range 2). Continuous plotting of reference levels to maintain market context throughout the session.
Example Use Case:
A common ICT-inspired reversal setup:
Wait for price to sweep the Previous Day’s High or Low during your chosen time range.
Look for a buy or sell signal with volatility confirmation.
Manage risk using the ATR-based stop-loss plot.
Disclaimer: This script is for educational purposes only and is not financial advice. Trade responsibly and always test strategies before applying them in live markets.

Supply/Demand Zones - Fixed v3 (Cross YES Only)This Pine Script indicator creates Supply/Demand Zones with specific filtering criteria for TradingView. Here's a comprehensive description:
Supply/Demand Zones -(Cross YES Only)
Core Functionality
Session-Based Analysis: Identifies and visualizes price ranges during user-defined time sessions
Cross Validation Filter: Only displays zones when the "Cross" condition is met (Open and Close prices cross the mid-range level)
Real-Time Monitoring: Tracks price action during active sessions and creates zones after session completion
Key Features
Time Range Configuration
Customizable session hours (start/end time with minute precision)
Timezone support (default: Europe/Bucharest)
Flexible scheduling for different trading sessions
Visual Elements
Range Border: Dotted outline showing the full session range (High to Low)
Key Levels: Horizontal lines for High, Low, and Mid-range levels
Sub-Range Zones: Shaded areas showing Open and Close price zones
Percentage Labels: Display the percentage of range occupied by Open/Close zones
Active Session Background: Blue background highlighting during active sessions
Smart Filtering System
Cross Condition: Only creates zones when:
Open < Mid AND Close > Mid (bullish cross), OR
Open > Mid AND Close < Mid (bearish cross)
This filter ensures only significant price movements that cross the session's midpoint are highlighted
Customization Options
Display Controls: Toggle visibility for borders, lines, zones, and labels
Color Schemes: Full color customization for all elements
Transparency Settings: Adjustable transparency for zone fills
Text Styling: Configurable label colors and information display
Technical Specifications
Maximum capacity: 500 boxes, 500 lines, 200 labels
Overlay indicator (draws directly on price chart)
Bar-time based positioning for accurate historical placement
Use Cases
Supply/Demand Trading: Identify key price levels where institutions may have interest
Session Analysis: Understand price behavior during specific trading hours
Breakout Detection: Focus on sessions where price crosses significant levels
Support/Resistance: Use range levels for future trade planning
What Makes It Unique
The "Cross YES Only" filter ensures that only meaningful price sessions are highlighted - those where the market shows directional bias by crossing from one side of the range to the other, indicating potential institutional interest or significant market sentiment shifts.

Previous Day OHLC# Previous Day OHLC Levels Indicator
## Overview
The Previous Day OHLC indicator is a simple yet powerful tool that plots the Open, High, Low, and Close levels from previous trading sessions. This indicator helps traders identify key support and resistance levels based on historical price action, making it easier to spot potential reversal zones and breakout levels.
## Key Features
### 📊 **Previous Day OHLC Levels**
- Displays the Open, High, Low, and Close prices from 1-5 days ago
- Lines automatically extend to the right for easy visualization
- Updates daily to show the most relevant levels
### 🎨 **Fully Customizable Styling**
- **Individual Line Colors**: Choose unique colors for each OHLC level
- **Line Styles**: Select from Solid, Dashed, or Dotted lines for each level
- **Line Width**: Adjust thickness from 1-4 pixels for better visibility
- **Price Labels**: Display actual price values on each line with customizable sizing
### ⚙️ **Flexible Settings**
- **Lookback Period**: Choose to display levels from 1-5 days ago (maximum safety limit)
- **Label Control**: Toggle price labels on/off and adjust their size
- **Performance Optimized**: Clean code that won't slow down your charts
## How to Use
1. **Add to Chart**: Apply the indicator to any timeframe chart
2. **Customize Settings**: Adjust colors, styles, and lookback period to your preference
3. **Identify Levels**: Use the plotted lines as potential support/resistance zones
4. **Trade Setup**: Look for price reactions at these key levels for entry/exit signals
## Best Practices
- **Day Trading**: Use 1-day lookback for intraday support/resistance
- **Swing Trading**: Extend lookback to 2-5 days for broader context
- **Multi-Timeframe**: Combine with other timeframe analysis for confirmation
- **Risk Management**: Use these levels for stop-loss and take-profit placement
## Color Coding (Default)
- **Open**: Blue - Starting price of the previous session
- **High**: Green - Highest price reached
- **Low**: Red - Lowest price reached
- **Close**: Orange - Final price of the session
## Why This Indicator Works
Previous day OHLC levels are among the most watched price points by professional traders. These levels often act as:
- **Support/Resistance**: Price tends to react at these historical levels
- **Breakout Confirmation**: Strong moves beyond these levels can signal trend continuation
- **Reversal Zones**: Price often bounces from these key levels
- **Psychological Levels**: Market participants remember these important price points
## Technical Specifications
- **Pine Script Version**: v6
- **Overlay**: Yes (plots directly on price chart)
- **Performance**: Optimized for smooth chart operation
- **Compatibility**: Works on all timeframes and instruments
Perfect for traders of all experience levels who want to incorporate previous day levels into their technical analysis toolkit!
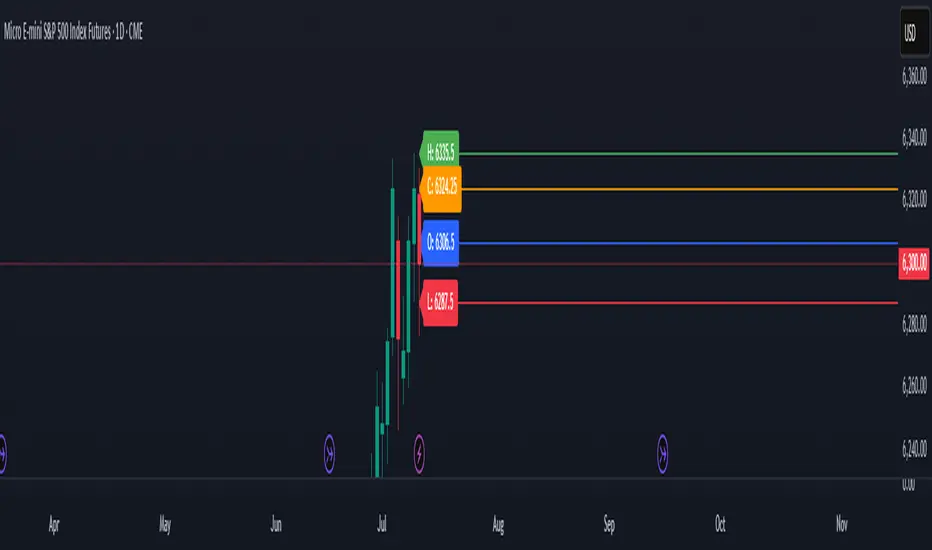
Session Range ProjectionsSession Range Projections
Purpose & Concept:
Session Range Projections is a comprehensive trading tool that identifies and analyzes price ranges during user-defined time periods. The indicator visualizes high-probability reversal zones and profit targets by projecting Fibonacci levels from custom session ranges, making it ideal for traders who focus on time-based market structure analysis.
Key Features & Calculations:
1. Custom Time Range Analysis
- Define any time period for range calculation - from traditional sessions (Asian, London, NY) to custom periods like opening ranges, hourly ranges, or 4-hour blocks
- Automatically captures the highest and lowest prices within your specified timeframe
- Supports multiple timezone selections for global market analysis
- Flexible enough for intraday scalping ranges or longer-term swing trading setups
2. Premium & Discount Zones
- Automatically divides the range into premium (above 50%) and discount (below 50%) zones
- Visual differentiation helps identify institutional buying and selling areas
- Color-coded boxes clearly mark these critical price zones
3. Optimal Trade Entry (OTE) Zones
- Highlights the 79-89% retracement zone in premium territory
- Highlights the 11-21% retracement zone in discount territory
- These zones represent high-probability reversal areas based on institutional order flow concepts
4. Fibonacci Projections
- Projects 11 customizable Fibonacci extension levels from the range extremes
- Levels extend both above and below the range for symmetrical analysis
- Each level can be individually toggled and color-customized
- Default levels include common retracement ratios: -0.5, -1.0, -2.0, -2.33, -2.5, -3.0, -4.0, -4.5, -6.0, -7.0, -8.0
How to Use:
Set Your Time Range: Input your desired session start and end times (24-hour format)
Select Timezone: Choose the appropriate timezone for your trading session
Customize Display: Toggle various visual elements based on your preferences
Monitor Price Action: Watch for reactions at projected levels and OTE zones
Set Alerts: Configure sweep alerts for when price breaks above/below range extremes
Input Parameters Explained:
Time Range Settings
Range Start/End Hour & Minute: Define your analysis period
Time Zone: Ensure accurate session timing across different markets
Visual Settings
Range Box: Toggle the premium/discount zone visualization
Horizontal Lines: Customize high/low line appearance
Internal Range Levels: Show/hide equilibrium and OTE zones
Labels: Configure text display for key levels
Fibonacci Projections: Enable/disable extension levels
Display Settings
Historical Ranges: Show up to 10 previous session ranges
Alert Type: Choose between high sweep, low sweep, or both
Trading Applications:
Session-Based Trading: Analyze specific market sessions (Asian, London, New York, opening ranges, hourly ranges)
Reversal Trading: Identify high-probability reversal zones at OTE levels
Breakout/Reversal Trading: Monitor range breaks/reversals with built-in sweep alerts
Risk Management: Use Fibonacci projections as profit targets or rejection areas
Multi-Timeframe Analysis: Apply to any timeframe for various trading styles
Important Notes:
This indicator is for educational purposes only and should not be considered financial advice
Past performance does not guarantee future results
Always use proper risk management when trading
The indicator automatically manages historical data to maintain chart performance

Price Map Profile [BigBeluga]An advanced volume-based tool designed to map out how trading activity is distributed across price levels. It combines dynamic volume profiling with structural pivot detection to highlight key levels of interest in the market — including hidden support/resistance zones and dominant liquidity areas.
Unlike traditional volume profiles locked to fixed sessions, this indicator continuously processes historical bars to build a real-time "map" of volume distribution. It intelligently reveals where buyers and sellers were most active, helping traders pinpoint high-impact zones with clarity.
🔵 KEY FEATURES
Creates a volume map profile by scanning price action over a defined lookback window (`length`).
Divides price vertically into volume bins (default: 100) and aggregates either total volume or bar count per bin.
Bins are plotted as horizontal zones extending to the right of the chart — wider offset means more volume at that price.
Each zone is color-coded using gradients to represent volume magnitude:
- Below average volume = cool tones (blue/teal)
- Above average volume = warm tones (red/orange)
The highest volume bin is highlighted with a red label showing the exact volume, helping to identify strong price agreement.
Detects pivot highs and lows using a 15-bar swing method, marking them as potential S/R levels.
If a pivot level is located inside a low-volume zone (volume < average), it is emphasized with a dashed line and label .
Pivot line color matches direction:
- High pivots = yellow
- Low pivots = aqua
The volume of the bin containing the pivot is shown alongside the pivot, providing volume context for the structural level.
Filters out nearby duplicate pivots using ATR-based distance checks to ensure clean and non-redundant signals.
🔵 HOW TO USE
Use the wide red zones as liquidity and consolidation areas where price may stall, reverse, or absorb volume.
Pivot-based dashed lines within low-volume zones highlight hidden support/resistance levels where price may react sharply.
Combine this indicator with trend or order flow tools to validate reversal or breakout setups .
Switch between Volume and Frequency modes to adapt to the type of data your asset provides.
🔵 CONCLUSION
The Price Map Profile transforms raw volume into an actionable visual map. By aligning volume depth with key market structure levels, it helps traders identify where market participants are most active — and where hidden inefficiencies lie. Ideal for traders seeking precision entries, dynamic S/R zones, and deeper volume structure insight.

Easy MA SignalsEasy MA Signals
Overview
Easy MA Signals is a versatile Pine Script indicator designed to help traders visualize moving average (MA) trends, generate buy/sell signals based on crossovers or custom price levels, and enhance chart analysis with volume-based candlestick coloring. Built with flexibility in mind, it supports multiple MA types, crossover options, and customizable signal appearances, making it suitable for traders of all levels. Whether you're a day trader, swing trader, or long-term investor, this indicator provides actionable insights while keeping your charts clean and intuitive.
Configure the Settings
The indicator is divided into three input groups for ease of use:
General Settings:
Candlestick Color Scheme: Choose from 10 volume-based color schemes (e.g., Sapphire Pulse, Emerald Spark) to highlight high/low volume candles. Select “None” for TradingView’s default colors.
Moving Average Length: Set the MA period (default: 20). Adjust for faster (lower values) or slower (higher values) signals.
Moving Average Type: Choose between SMA, EMA, or WMA (default: EMA).
Show Buy/Sell Signals: Enable/disable signal plotting (default: enabled).
Moving Average Crossover: Select a crossover type (e.g., MA vs VWAP, MA vs SMA50) for signals or “None” to disable.
Volume Influence: Adjust how volume impacts candlestick colors (default: 1.2). Higher values make thresholds stricter.
Signal Appearance Settings:
Buy/Sell Signal Shape: Choose shapes like triangles, arrows, or labels for signals.
Buy/Sell Signal Position: Place signals above or below bars.
Buy/Sell Signal Color: Customize colors for better visibility (default: green for buy, red for sell).
Custom Price Alerts:
Custom Buy/Sell Alert Price: Set specific price levels for alerts (default: 0, disabled). Enter a non-zero value to enable.
Set Up Alerts
To receive notifications (e.g., sound, popup, email) when signals or custom price levels are hit:
Click the Alert button (alarm clock icon) in TradingView.
Select Easy MA Signals as the condition and choose one of the four alert types:
MA Crossover Buy Alert: Triggers on MA crossover buy signals.
MA Crossover Sell Alert: Triggers on MA crossover sell signals.
Custom Buy Alert: Triggers when price crosses above the custom buy price.
Custom Sell Alert: Triggers when price crosses below the custom sell price.
Enable Play Sound and select a sound (e.g., “Bell”).
Set the frequency (e.g., Once Per Bar Close for confirmed signals) and create the alert.
Analyze the Chart
Moving Average Line: Displays the selected MA with color changes (green for bullish, red for bearish, gray for neutral) based on price position relative to the MA.
Buy/Sell Signals: Appear as shapes or labels when crossovers or custom price levels are hit.
Candlestick Colors: If a color scheme is selected, candles change color based on volume strength (high, low, or neutral), aiding in trend confirmation.
Why Use Easy MA Signals?
Easy MA Signals is designed to simplify technical analysis while offering advanced customization. It’s ideal for traders who want:
A clear visualization of MA trends and crossovers.
Flexible signal generation based on MA crossovers or custom price levels.
Volume-enhanced candlestick coloring to identify market strength.
Easy-to-use settings with tooltips for beginners and pros alike.
This script is particularly valuable because it combines multiple features into one indicator, reducing chart clutter and providing actionable insights without overwhelming the user.
Benefits of Easy MA Signals
Highly Customizable: Supports SMA, EMA, and WMA with adjustable lengths.
Offers multiple crossover options (VWAP, SMA10, SMA20, etc.) for tailored strategies.
Custom price alerts allow precise targeting of key levels.
Volume-Based Candlestick Coloring: 10 unique color schemes highlight volume strength, helping traders confirm trends.
Adjustable volume influence ensures adaptability to different markets.
Flexible Signal Visualization: Choose from various signal shapes (triangles, arrows, labels) and positions (above/below bars).
Customizable colors improve visibility on any chart background.
Alert Integration: Built-in alert conditions for crossovers and custom prices support sound, email, and app notifications.
Easy setup for real-time trading decisions.
User-Friendly Design: Organized input groups with clear tooltips make configuration intuitive.
Suitable for beginners and advanced traders alike.
Example Use Cases
Swing Trading with MA Crossovers:
Scenario: A trader wants to trade Bitcoin (BTC/USD) on a 4-hour chart using an EMA crossover strategy.
Setup:
Set Moving Average Type to EMA, Length to 20.
Set Moving Average Crossover to “MA vs SMA50”.
Enable Show Buy/Sell Signals and choose “arrowup” for buy, “arrowdown” for sell.
Select “Emerald Spark” for candlestick colors to highlight volume surges.
Usage: Buy when the EMA20 crosses above the SMA50 (green arrow appears) and volume is high (dark green candles). Sell when the EMA20 crosses below the SMA50 (red arrow). Set alerts for real-time notifications.
Scalping with Custom Price Alerts:
Scenario: A day trader monitors Tesla (TSLA) on a 5-minute chart and wants alerts at specific support/resistance levels.
Setup:
Set Custom Buy Alert Price to 150.00 (support) and Custom Sell Alert Price to 160.00 (resistance).
Use “labelup” for buy signals and “labeldown” for sell signals.
Keep Moving Average Crossover as “None” to focus on price alerts.
Usage: Receive a sound alert and label when TSLA crosses 150.00 (buy) or 160.00 (sell). Use volume-colored candles to confirm momentum before entering trades.
When NOT to Use Easy MA Signals
High-Frequency Trading: Reason: The indicator relies on moving averages and volume, which may lag in ultra-fast markets (e.g., sub-second trades). High-frequency traders may need specialized tools with real-time tick data.
Alternative: Use order book or market depth indicators for faster execution.
Low-Volatility or Sideways Markets:
Reason: MA crossovers and custom price alerts can generate false signals in choppy, range-bound markets, leading to whipsaws.
Alternative: Use oscillators like RSI or Bollinger Bands to trade within ranges.
This indicator is tailored more towards less experienced traders. And as always, paper trade until you are comfortable with how this works if you're unfamiliar with trading! We hope you enjoy this and have great success. Thanks for your interested in Easy MA Signals!
