Cari skrip untuk "kdj"

KDJ Indicator - @iamaltcoinThis indicator is a mimic of the same used by bitcoinwisdom.
There seems to be several different formulas to calculate KDJ, however, i have yet to find this one on tradingview.
The background color is green when J>D and red when J

KDJ Indicator with RSI FilterThe KDJ indicator is a technical analysis tool used by traders to identify potential buy and sell signals in financial markets. It is an extension of the Stochastic Oscillator, which consists of two lines, %K and %D, that move within a range of 0 to 100. The KDJ indicator introduces a third line, called %J, which is derived from the %K and %D lines. The KDJ indicator is primarily used to identify overbought and oversold conditions, as well as potential trend reversals.
Here's a brief overview of the KDJ indicator's components:
%K line: It is calculated by comparing the current closing price to the range of high and low prices over a specific period (usually 9 days).
%D line: It is a moving average of the %K line
%J line: It is calculated using the %K and %D lines
The KDJ indicator generates buy signals when the %K line crosses above the %D line and sell signals when the %K line crosses below the %D line. Additionally, when the %J line is above 100, it suggests that the asset is overbought, and when the %J line is below 0, it suggests that the asset is oversold. Traders often use these overbought and oversold signals to identify potential trend reversals.
I have taken KDJ script from and added RSI filter and alerts with and without RSI filter.
I was requested to create this script with alerts. And here it is. I have added alerts. And, I have added abilities to turn on and off the RSI filters from settings.
KDJ [JoseMetal]============
ENGLISH
============
- Description:
This indicator is a modification of the common KDJ, as you may know the KDJ is just a Stochastic (K+D) with an extra line which is J, the J line can be used as "movement strength" filter and also for overbought and oversold conditions anticipating the K and D.
In this particular modification I've tested many different settings to find the best possible ones, it also has customizable MA type for the calculation and a histogram calculated with the difference between J and D, this is useful to spot divergences and determine trend strength easily, the histogram has a smooth option to make it even more clearer.
- Visual:
So you have K and D from the Stochastic (green and red lines) as well as the J line (white).
Then you have the histogram to show the difference between J and D, the histogram has a similar color scale as a MACD to determine the strength of the trend easily, lighter = stronger, darker = weaker, there are 2 default customizable color setups by the way.
Crossovers between lines (which generates LONG and SHORT entries) are presented with a DOT (green for long and red for short).
Background color also changes, green for bullish, red for bearish, crossovers also marks the background color even more.
- Customization:
As usual in my indicators, everything is customizable, you can pick yours, settings, colors, figures etc.
- Usage and recommendations:
I've tested many different setting setups, for now, the best are the default (14, 21, 21) for the KDJ and (7) for the histogram smooth, 20 and 80 for oversold and overbought levels.
Histogram is great to spot divergences, I recommend to wait for a divergence on a 4H timeframe and wait for the LONG or SHORT signal to appear to enter a trade in the divergence direction.
Enjoy!
============
ESPAÑOL
============
- Descripción:
Éste indicador es una modificación del KDJ común, como sabrás el KDJ es solo un estocástico (K+D) con una línea extra que es la J, la línea J puede ser usada como filtro de "fuerza de movimiento" y también para condiciones de sobrecompra y sobreventa anticipando la K y la D.
En esta modificación en particular he probado muchas configuraciones diferentes para encontrar las mejores posibles, también tiene un tipo de MA personalizable para el cálculo y un histograma calculado con la diferencia entre J y D, esto es útil para detectar divergencias y determinar la fuerza de la tendencia fácilmente, el histograma tiene una opción suave para hacerlo aún más claro.
- Visual:
Por lo tanto, tenemos por un lado la K y D del estocástico (líneas verde y roja), así como la línea J (blanco).
Luego tenemos el histograma para mostrar la diferencia entre J y D, el histograma tiene una escala de colores similar a la del MACD para determinar la fuerza de la tendencia fácilmente, más claro = más fuerte, más oscuro = más débil, hay 2 escalas de color personalizables por defecto.
Los cruces entre líneas (que generan entradas LARGAS y CORTAS) se presentan con un PUNTO (verde para LARGO y rojo para CORTO).
El color de fondo también cambia, verde para alcista, rojo para bajista, los cruces también resaltan el color de fondo aún más.
- Personalización:
Como es habitual en mis indicadores, todo es personalizable, puedes elegir los tuyos, ajustes, colores, figuras, etc.
- Uso y recomendaciones:
He probado muchas configuraciones diferentes, por ahora, las mejores son las predeterminadas (14, 21, 21) para el KDJ y (7) para el histograma suave, 20 y 80 para los niveles de sobreventa y sobrecompra.
El histograma es excelente para detectar divergencias, recomiendo esperar una divergencia en un marco de tiempo de 4H y esperar a que aparezca la señal de LARGO o CORTO para entrar en una operación en la dirección de la divergencia.
¡Que lo disfrutéis!

KDJ-RSI Buy/Sell Signal ver. 1It is an indicator combining the RSI indicator and KDJ indicator.
Buy signal will triggers when:
RSI signal positioning below 25
J value crosses below 0
Sell signal will triggers when:
RSI signal positioning above 85
J value crosses above 100
***********
Please take note that this indicator may be not accurate for every chart in the crypto market, but it is most appropriate to use it in BTC/USDT charts, mainly for 1h, 4h, and 1d candles. Not recommended to use it for 1m or 15m leverage trades, this indicator might be altered by FOMO sentiment.

KDJ stochastic indicatorThis is a special calculation of KDJ indicator. As you may know this is based on stochastic indicator. Stochastic indicator is a method to normalize a trending time serie (here price). the calculation of stochastic itself is a built in function in pine but it is straight forward:
In sudo code:
RSV for n days=(Cn-Ln)/(Hn-Ln)×100
In which, Cn is the closing price on the nth day; Ln is the lowest price in n days; Hn is the highest price in n days.
To calculate other indices K, D and J we use this formulas:
K = (2/3) * K + (1/3) * RSV
D = (2/3) * D + (1/3) * K
J = 3 * K - 2 * D
As you can see it is a recursive calculation. It means any value of the indices are affected by it's own previous value (and I'm passionate about recursive functions!) It may concern you that in the initial calculation there is no previous value and you are right. For the initial values we use value of 50 because it is an oscillator and the mean value is always 50 so we replace the first NAs with 50 using nz() function in pine.
After doing this calculations we reach to the smoothing section. I used simple moving averages, you may replace it with other more advanced smoothing techniqes like EMA or ALMA.
After I wrote this indicator I saw that it is a good indicator for reading divergences. As you can see I showed couple of these divergences to you on the chart. Notice that I analyzed divergence between price and J (very light green) line and not to K or D. I really appreciate any suggestion on this indicator and hope to improve it. The other ones present in the public library wasn't good and they differ a lot in the calculation and also the graphics doesn't look good.
Be free to change the parameter i saw these parameter are good to daily Bitcoin chart.


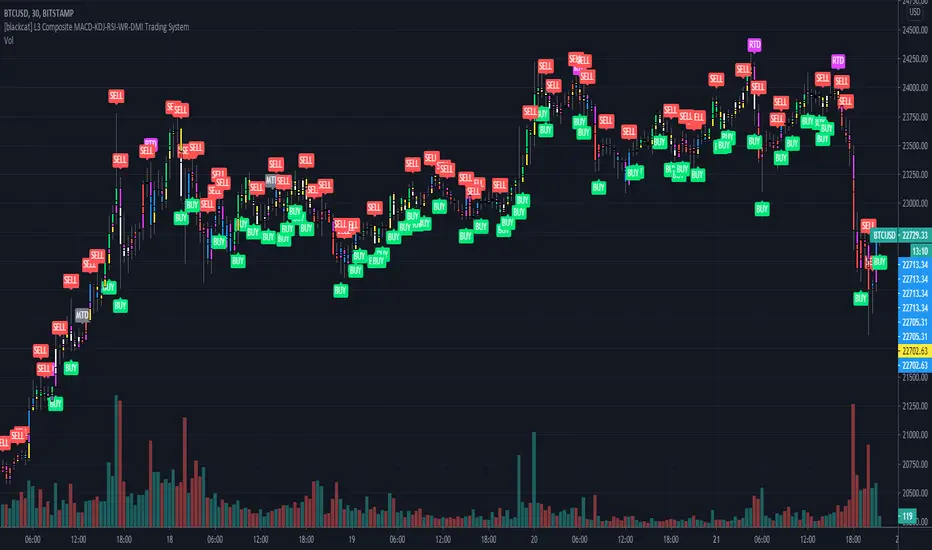
[blackcat] L3 Composite MACD-KDJ-RSI-WR-DMI Trading SystemLevel: 3
Background
The moving average convergence / divergence (MACD) indicator is a pulse oscillator that is mainly used to trade trends. Although it is an oscillator, it is not typically used to identify overbought or oversold conditions. It appears in the diagram as two lines that oscillate without limits. The crossing of the two lines provides trading signals similar to a system with two moving averages.
The KDJ indicator is a technical indicator used to analyze and predict changes in stock performance and the price patterns of a traded asset. The KDJ indicator is also known as the random index. It is a very useful technical indicator that is most commonly used in short term stock market trend analysis. KDJ is a derived form of the Stochastic Oscillator Indicator with the only difference that an additional line is called the J-line. Values of% K and% D indicate whether the security is overbought (over 80) or oversold (under 20). The moments when% K exceeds% D are the moments to sell or buy. The J line represents the deviation of the% D value from% K. The value of J can exceed for the% K and% D lines on the graph.
The Relative Strength Index (RSI) developed by J. Welles Wilder is a pulse oscillator that measures the speed and change of price movements. The RSI hovers between zero and 100. Traditionally, the RSI is considered overbought when it is above 70 and oversold when below 30. Signals can be generated by looking for divergences and error fluctuations.
Williams% R, also known as the Williams Percent Range, is a type of momentum indicator that moves between 0 and -100 and measures overbought and oversold levels. The Williams% R can be used to find entry and exit points in the market. The indicator is very similar to the stochastic oscillator and is used in the same way.
The Directional Movement Index (DMI) is an indicator developed by J. Welles Wilder in 1978 to determine in which direction asset prices are moving. The indicator does this by comparing previous highs and lows and drawing two lines: a positive movement line (+DI) and a negative movement line (-DI). The optional third line is called "Directional Movement (DX)" and it shows the difference between the two lines. When +DI is higher than -DI, the upward pressure on the price is greater than the downward pressure. If -DI is higher than +DI, the price will have greater downward pressure. This indicator can help traders assess the trend direction. Crosses between lines are sometimes used as buying and selling signals.
Function
L3 Composite MACD-KDJ-RSI-WR-DMI Trading System is a simple trading system composed of MACD-KDJ-RSI-WR-DMI together. It can produce 6 types of long entries and 3 types of short entries. It utilizes divergence effect from MACD, KDJ and RSI to detect trend reversal. 6 types of Bottom and top divergence labels are displayed in the chart together with "BUY" and "SELL".
NOTE:In order to make the actual label of the chart more clear, this script does not add stop loss and take profit functions and according labels.
Signal
b1~b3 ---> MACD, KDJ, RSI bottom divergence signal respectively, which hint bull trend may start soon.
d1~d3 ---> MACD, KDJ, RSI top divergence signal respectively, which hint bear trend may start soon.
longentry1~6 ---> with composite indicators together, 6 types of long entry signal are produced.
shortentry1~3 ---> with composite indicators together, 3 types of short entry signal are produced.
Pros and Cons
Pros:
1. excellent open-close, long-short entry signal generation with multiple powerful indicators
2. indicator resonance can help to promote the confidence level of signal and divergence alerts
Cons:
1. integration of multiple indicators is not deeply optimized. fake signal may be produced without filtering schemes
2. no range filter is added
Remarks
To celebrate number of followers exceeds 100. This is my first L3 script published.
Readme
In real life, I am a prolific inventor. I have successfully applied for more than 60 international and regional patents in the past 12 years. But in the past two years or so, I have tried to transfer my creativity to the development of trading strategies. Tradingview is the ideal platform for me. I am selecting and contributing some of the hundreds of scripts to publish in Tradingview community. Welcome everyone to interact with me to discuss these interesting pine scripts.
The scripts posted are categorized into 5 levels according to my efforts or manhours put into these works.
Level 1 : interesting script snippets or distinctive improvement from classic indicators or strategy. Level 1 scripts can usually appear in more complex indicators as a function module or element.
Level 2 : composite indicator/strategy. By selecting or combining several independent or dependent functions or sub indicators in proper way, the composite script exhibits a resonance phenomenon which can filter out noise or fake trading signal to enhance trading confidence level.
Level 3 : comprehensive indicator/strategy. They are simple trading systems based on my strategies. They are commonly containing several or all of entry signal, close signal, stop loss, take profit, re-entry, risk management, and position sizing techniques. Even some interesting fundamental and mass psychological aspects are incorporated.
Level 4 : script snippets or functions that do not disclose source code. Interesting element that can reveal market laws and work as raw material for indicators and strategies. If you find Level 1~2 scripts are helpful, Level 4 is a private version that took me far more efforts to develop.
Level 5 : indicator/strategy that do not disclose source code. private version of Level 3 script with my accumulated script processing skills or a large number of custom functions. I had a private function library built in past two years. Level 5 scripts use many of them to achieve private trading strategy.
[blackcat] L2 Leading KDJ Candle IndicatorLevel: 2
Background
The KDJ oscillator display consists of 3 lines (K, D and J - hence the name of the display) and 2 levels. K and D are the same lines you see when using the stochastic oscillator. The J line in turn represents the deviation of the D value from the K value. The convergence of these lines indicates new trading opportunities. Just like the Stochastic Oscillator, oversold and overbought levels correspond to the times when the trend is likely to reverse.
Function
L2 Leading KDJ Candle Indicator use candles to indicate KD relationship. E.g. yellow candles for bull (K>=D) and fuchsia candles for bear (K=D and fuchsia for K KDJ K value
d --> KDJ D value
buysig --> KD buy signal in green triangle
selsig --> KD sell signal in red triangle
leadingline --> colorful leading line for KDJ
Pros and Cons
Pros:
1. Candle height can indicates the strength of trend and different colors are used for indicating KD relationship
2. a leading line is added as aux method to confirm KDJ signal
Cons:
1. It may satruate for extreme conditions of long and short as described in the chart, which is inherent KDJ shortcoming.
2. Not accurate for long and short entries and need filtering out noise and fake signal.
Remarks
More direct to observe and confirm trend with the leading line.
Readme
In real life, I am a prolific inventor. I have successfully applied for more than 60 international and regional patents in the past 12 years. But in the past two years or so, I have tried to transfer my creativity to the development of trading strategies. Tradingview is the ideal platform for me. I am selecting and contributing some of the hundreds of scripts to publish in Tradingview community. Welcome everyone to interact with me to discuss these interesting pine scripts.
The scripts posted are categorized into 5 levels according to my efforts or manhours put into these works.
Level 1 : interesting script snippets or distinctive improvement from classic indicators or strategy. Level 1 scripts can usually appear in more complex indicators as a function module or element.
Level 2 : composite indicator/strategy. By selecting or combining several independent or dependent functions or sub indicators in proper way, the composite script exhibits a resonance phenomenon which can filter out noise or fake trading signal to enhance trading confidence level.
Level 3 : comprehensive indicator/strategy. They are simple trading systems based on my strategies. They are commonly containing several or all of entry signal, close signal, stop loss, take profit, re-entry, risk management, and position sizing techniques. Even some interesting fundamental and mass psychological aspects are incorporated.
Level 4 : script snippets or functions that do not disclose source code. Interesting element that can reveal market laws and work as raw material for indicators and strategies. If you find Level 1~2 scripts are helpful, Level 4 is a private version that took me far more efforts to develop.
Level 5 : indicator/strategy that do not disclose source code. private version of Level 3 script with my accumulated script processing skills or a large number of custom functions. I had a private function library built in past two years. Level 5 scripts use many of them to achieve private trading strategy.

[blackcat] L2 KDJ Trading SystemLevel: 2
Background
The KDJ oscillator display consists of 3 lines (K, D and J - hence the name of the display) and 2 levels. K and D are the same lines you see when using the stochastic oscillator. The J line in turn represents the deviation of the D value from the K value. The convergence of these lines indicates new trading opportunities. Just like the Stochastic Oscillator, oversold and overbought levels correspond to the times when the trend is likely to reverse.
Function
L2 KDJ Trading System provides long and short entries for trading.
Key Signal
k --> KDJ K value
d --> KDJ D value
j --> KDJ J value
shortentry --> short entry signal
longentry1 --> long entry signal without confirmation
syn --> long entry signal with confirmation
Pros and Cons
Pros:
1. Candle height can indicates the strength of trend and different colors are used for indicating KD relationship
2. Exact short and long entries are disclosed
Cons:
1. It may satruate for extreme conditions of long and short as described in the chart, which is inherent KDJ shortcoming
Remarks
Another algorithm for KDJ trading with exact short and long entries
Readme
In real life, I am a prolific inventor. I have successfully applied for more than 60 international and regional patents in the past 12 years. But in the past two years or so, I have tried to transfer my creativity to the development of trading strategies. Tradingview is the ideal platform for me. I am selecting and contributing some of the hundreds of scripts to publish in Tradingview community. Welcome everyone to interact with me to discuss these interesting pine scripts.
The scripts posted are categorized into 5 levels according to my efforts or manhours put into these works.
Level 1 : interesting script snippets or distinctive improvement from classic indicators or strategy. Level 1 scripts can usually appear in more complex indicators as a function module or element.
Level 2 : composite indicator/strategy. By selecting or combining several independent or dependent functions or sub indicators in proper way, the composite script exhibits a resonance phenomenon which can filter out noise or fake trading signal to enhance trading confidence level.
Level 3 : comprehensive indicator/strategy. They are simple trading systems based on my strategies. They are commonly containing several or all of entry signal, close signal, stop loss, take profit, re-entry, risk management, and position sizing techniques. Even some interesting fundamental and mass psychological aspects are incorporated.
Level 4 : script snippets or functions that do not disclose source code. Interesting element that can reveal market laws and work as raw material for indicators and strategies. If you find Level 1~2 scripts are helpful, Level 4 is a private version that took me far more efforts to develop.
Level 5 : indicator/strategy that do not disclose source code. private version of Level 3 script with my accumulated script processing skills or a large number of custom functions. I had a private function library built in past two years. Level 5 scripts use many of them to achieve private trading strategy.

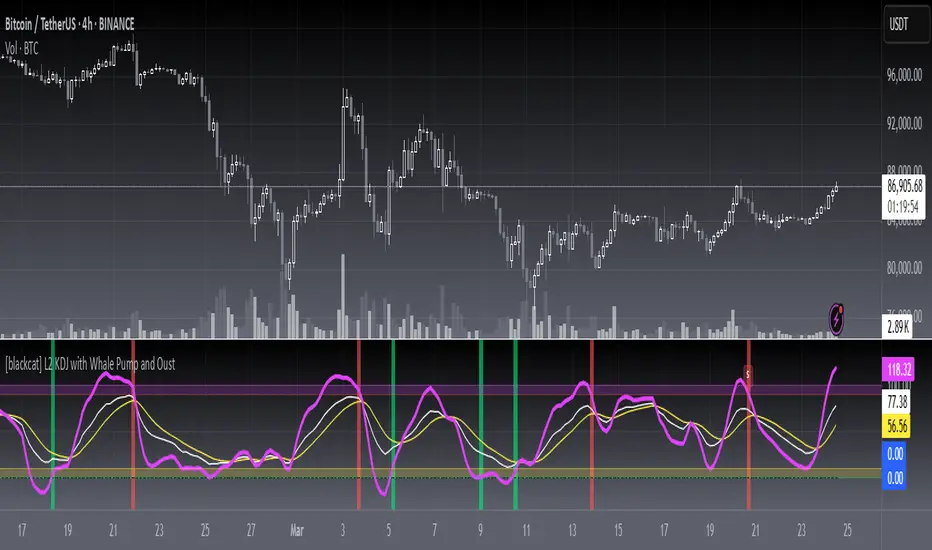
[blackcat] L2 KDJ with Whale Pump and OustLevel: 2
Background
One of the biggest differences between cryptocurrency and traditional financial markets is that cryptocurrency is based on blockchain technology. Individual investors can discover the direction of the flow of large funds through on-chain transfers. These large funds are often referred to as Whale. Whale can have a significant impact on the price movements of cryptocurrencies, especially Bitcoin . Therefore, how to monitor Whale trends is of great significance both in terms of fundamentals and technical aspects.
The KDJ oscillator display consists of 3 lines (K, D and J - hence the name of the display) and 2 levels. K and D are the same lines you see when using the stochastic oscillator. The J line in turn represents the deviation of the D value from the K value. The convergence of these lines indicates new trading opportunities. Just like the Stochastic Oscillator, oversold and overbought levels correspond to the times when the trend is likely to reverse.
Function
L2 KDJ with Whale Pump and Oust is a composite indicator that combines both KDJ and Whale Pump and Oust detector. By virtue of this, fake signal of KDJ can be filtered out to some degree.
Key Signal
whalepump --> whale buy behavior will be detected and displayed in green histograms
oust --> after whale buy behavior, there usually a oust action from whale to drive out profitable orders to reduce the selling pressure of subsequent pull ups. This oust will be detected and displayed in red histograms
k --> k value of a stochastic oscillator
d --> d value of a stochastic oscillator
j --> the deviation of the d value from the d value of a stochastic oscillator
Pros and Cons
Pros:
1. filter out KDJ fake signal by introducing whale pump/oust detector
2. J value can be used to detect overbought and oversold regions
Cons:
1. It works better in small time frame and sideways. Extreme long or short conditions may cause KDJ staturate.
2. It can only indicate in current time frame, larger time frame trend info is missing.
Remarks
An improved version of L2 KDJ with Whale Pump Detector by adding oust function. Works fine in 15mins time frame.
Readme
In real life, I am a prolific inventor. I have successfully applied for more than 60 international and regional patents in the past 12 years. But in the past two years or so, I have tried to transfer my creativity to the development of trading strategies. Tradingview is the ideal platform for me. I am selecting and contributing some of the hundreds of scripts to publish in Tradingview community. Welcome everyone to interact with me to discuss these interesting pine scripts.
The scripts posted are categorized into 5 levels according to my efforts or manhours put into these works.
Level 1 : interesting script snippets or distinctive improvement from classic indicators or strategy. Level 1 scripts can usually appear in more complex indicators as a function module or element.
Level 2 : composite indicator/strategy. By selecting or combining several independent or dependent functions or sub indicators in proper way, the composite script exhibits a resonance phenomenon which can filter out noise or fake trading signal to enhance trading confidence level.
Level 3 : comprehensive indicator/strategy. They are simple trading systems based on my strategies. They are commonly containing several or all of entry signal, close signal, stop loss, take profit, re-entry, risk management, and position sizing techniques. Even some interesting fundamental and mass psychological aspects are incorporated.
Level 4 : script snippets or functions that do not disclose source code. Interesting element that can reveal market laws and work as raw material for indicators and strategies. If you find Level 1~2 scripts are helpful, Level 4 is a private version that took me far more efforts to develop.
Level 5 : indicator/strategy that do not disclose source code. private version of Level 3 script with my accumulated script processing skills or a large number of custom functions. I had a private function library built in past two years. Level 5 scripts use many of them to achieve private trading strategy.
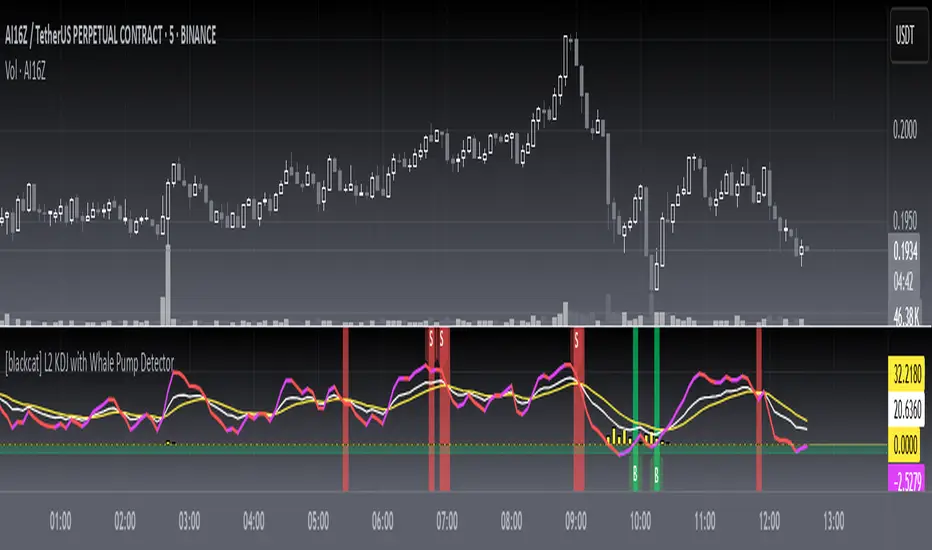
L2 KDJ with Whale Pump DetectorLevel: 2
Background
One of the biggest differences between cryptocurrency and traditional financial markets is that cryptocurrency is based on blockchain technology. Individual investors can discover the direction of the flow of large funds through on-chain transfers. These large funds are often referred to as Whale. Whale can have a significant impact on the price movements of cryptocurrencies, especially Bitcoin . Therefore, how to monitor Whale trends is of great significance both in terms of fundamentals and technical aspects.
The KDJ oscillator display consists of 3 lines (K, D and J - hence the name of the display) and 2 levels. K and D are the same lines you see when using the stochastic oscillator. The J line in turn represents the deviation of the D value from the K value. The convergence of these lines indicates new trading opportunities. Just like the Stochastic Oscillator, oversold and overbought levels correspond to the times when the trend is likely to reverse.
Function
L2 KDJ with Whale Pump Detector is a composite indicator that combines both KDJ and Whale Pump Detector. By virtue of this, fake signal of KDJ can be filtered out to some degree.
Key Signal
whalepump --> whale buy behavior will be detected and displayed in yellow histograms
k --> k value of a stochastic oscillator
d --> d value of a stochastic oscillator
j --> the deviation of the d value from the d value of a stochastic oscillator
Pros and Cons
Pros:
1. filter out KDJ fake signal by introducing whale buy/pump detector
2. J value can be used to detect overbought and oversold regions
Cons:
1. It works better in small time frame and sideways. Extreme long or short conditions may cause KDJ staturate.
2. It can only indicate in current time frame, larger time frame trend info is missing.
Remarks
Composite KDJ+Whale Pump Detector. Works fine in 15mins time frame.
Readme
In real life, I am a prolific inventor. I have successfully applied for more than 60 international and regional patents in the past 12 years. But in the past two years or so, I have tried to transfer my creativity to the development of trading strategies. Tradingview is the ideal platform for me. I am selecting and contributing some of the hundreds of scripts to publish in Tradingview community. Welcome everyone to interact with me to discuss these interesting pine scripts.
The scripts posted are categorized into 5 levels according to my efforts or manhours put into these works.
Level 1 : interesting script snippets or distinctive improvement from classic indicators or strategy. Level 1 scripts can usually appear in more complex indicators as a function module or element.
Level 2 : composite indicator/strategy. By selecting or combining several independent or dependent functions or sub indicators in proper way, the composite script exhibits a resonance phenomenon which can filter out noise or fake trading signal to enhance trading confidence level.
Level 3 : comprehensive indicator/strategy. They are simple trading systems based on my strategies. They are commonly containing several or all of entry signal, close signal, stop loss, take profit, re-entry, risk management, and position sizing techniques. Even some interesting fundamental and mass psychological aspects are incorporated.
Level 4 : script snippets or functions that do not disclose source code. Interesting element that can reveal market laws and work as raw material for indicators and strategies. If you find Level 1~2 scripts are helpful, Level 4 is a private version that took me far more efforts to develop.
Level 5 : indicator/strategy that do not disclose source code. private version of Level 3 script with my accumulated script processing skills or a large number of custom functions. I had a private function library built in past two years. Level 5 scripts use many of them to achieve private trading strategy.
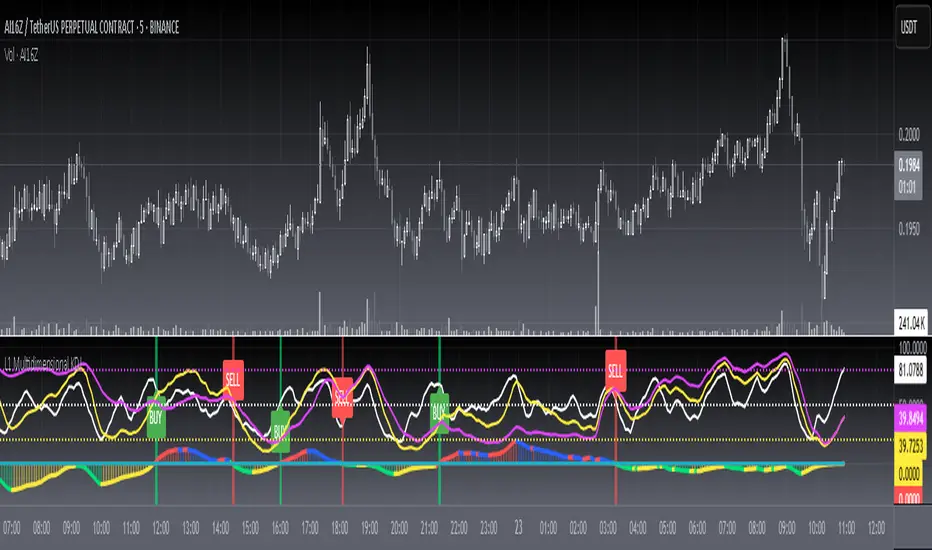
L1 Multidimensional KDJLevel: 1
Background
The KDJ oscillator display consists of 3 lines (K, D and J - hence the name of the display) and 2 levels. K and D are the same lines you see when using the stochastic oscillator. The J line in turn represents the deviation of the D value from the K value. The convergence of these lines indicates new trading opportunities. Just like the Stochastic Oscillator, oversold and overbought levels correspond to the times when the trend is likely to reverse.
Function
L1 Multidimensional KDJ utilizes multiple KDJ modeling across multiple time frames. In this instance, it covers three time frames as day, week and month. Although it is named like that, one can deduce and use it in small time frames e.g. 15mins (day), 60mins (week) and 4H (month) because KDJ oscillator is commonly used for small time frames across various markets.
Key Signal
kd --> day K value
kw --> week K value
km --> month K value
dd --> day D value
dw --> week D value
dm --> month D value
divergence --> divergence among day, week, month D values
resonance --> all three time frame D values are in the same direction
Pros and Cons
Pros:
1. Enable multidimensional KDJ,especially D value comparisons
2. divergence and resoanance among different time frame KDJ can be disclosed
Cons:
1. It may satruate for extreme conditions of long and short.
2. Not accurate for long and short entries by resonance effect.
Remarks
Bring about multiple time frames into consideration of KDJ is novel.
Readme
In real life, I am a prolific inventor. I have successfully applied for more than 60 international and regional patents in the past 12 years. But in the past two years or so, I have tried to transfer my creativity to the development of trading strategies. Tradingview is the ideal platform for me. I am selecting and contributing some of the hundreds of scripts to publish in Tradingview community. Welcome everyone to interact with me to discuss these interesting pine scripts.
The scripts posted are categorized into 5 levels according to my efforts or manhours put into these works.
Level 1 : interesting script snippets or distinctive improvement from classic indicators or strategy. Level 1 scripts can usually appear in more complex indicators as a function module or element.
Level 2 : composite indicator/strategy. By selecting or combining several independent or dependent functions or sub indicators in proper way, the composite script exhibits a resonance phenomenon which can filter out noise or fake trading signal to enhance trading confidence level.
Level 3 : comprehensive indicator/strategy. They are simple trading systems based on my strategies. They are commonly containing several or all of entry signal, close signal, stop loss, take profit, re-entry, risk management, and position sizing techniques. Even some interesting fundamental and mass psychological aspects are incorporated.
Level 4 : script snippets or functions that do not disclose source code. Interesting element that can reveal market laws and work as raw material for indicators and strategies. If you find Level 1~2 scripts are helpful, Level 4 is a private version that took me far more efforts to develop.
Level 5 : indicator/strategy that do not disclose source code. private version of Level 3 script with my accumulated script processing skills or a large number of custom functions. I had a private function library built in past two years. Level 5 scripts use many of them to achieve private trading strategy.
[blackcat] L1 Colorful KDJLevel: 1
Background
The KDJ oscillator display consists of 3 lines (K, D and J - hence the name of the display) and 2 levels. K and D are the same lines you see when using the stochastic oscillator. The J line in turn represents the deviation of the D value from the K value. The convergence of these lines indicates new trading opportunities. Just like the Stochastic Oscillator, oversold and overbought levels correspond to the times when the trend is likely to reverse.
Function
L1 Colorful KDJ use alma() and color to indicate k, d, j trend directions and use candles for j value indication of buy and sell points.
Key Signal
k --> k value of a stochastic oscillator
d --> d value of a stochastic oscillator
j --> the deviation of the d value from the d value of a stochastic oscillator
Pros and Cons
Pros:
1. filter out KDJ fake signal by introducing alma()
2. J value can be used to detect overbought and oversold regions
Cons:
1. It works better in small time frame and sideways. Extreme long or short conditions may cause KDJ staturate.
2. It can only indicate in current time frame, larger time frame trend info is missing.
Remarks
NA
Readme
In real life, I am a prolific inventor. I have successfully applied for more than 60 international and regional patents in the past 12 years. But in the past two years or so, I have tried to transfer my creativity to the development of trading strategies. Tradingview is the ideal platform for me. I am selecting and contributing some of the hundreds of scripts to publish in Tradingview community. Welcome everyone to interact with me to discuss these interesting pine scripts.
The scripts posted are categorized into 5 levels according to my efforts or manhours put into these works.
Level 1 : interesting script snippets or distinctive improvement from classic indicators or strategy. Level 1 scripts can usually appear in more complex indicators as a function module or element.
Level 2 : composite indicator/strategy. By selecting or combining several independent or dependent functions or sub indicators in proper way, the composite script exhibits a resonance phenomenon which can filter out noise or fake trading signal to enhance trading confidence level.
Level 3 : comprehensive indicator/strategy. They are simple trading systems based on my strategies. They are commonly containing several or all of entry signal, close signal, stop loss, take profit, re-entry, risk management, and position sizing techniques. Even some interesting fundamental and mass psychological aspects are incorporated.
Level 4 : script snippets or functions that do not disclose source code. Interesting element that can reveal market laws and work as raw material for indicators and strategies. If you find Level 1~2 scripts are helpful, Level 4 is a private version that took me far more efforts to develop.
Level 5 : indicator/strategy that do not disclose source code. private version of Level 3 script with my accumulated script processing skills or a large number of custom functions. I had a private function library built in past two years. Level 5 scripts use many of them to achieve private trading strategy.

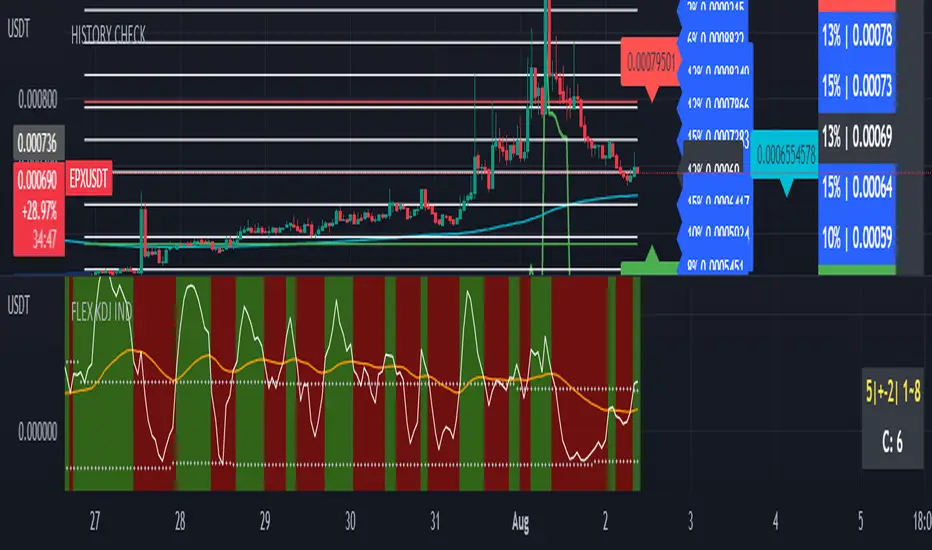
FLEX KDJ INDHi Dears!
Here you have this ability to define different methods to aquire high and low bonds in KDJ indicator.
Thses Topologies are available in Popup menu and could be defined by user:
- "AVG" : Use average of cashed data in both High and low Bond
- "MEDIAN" : Use median of cashed data in both High and low Bond
- "MAX" : Use Max of cashed data in both High and low Bond
- "MIN" : Use Min of cashed data in both High and low Bond
- "WIDE" : Use Max of cashed data in High and Min of them for low Bond
- "NARROW" : Use Min of cashed data in High and Max of them for low Bond
- "FIX" : Use predefined constant values by user in 'Max BOND' and 'Min BOND'
- "GAUSS" Use statistical standard deviation method and 'Mult. Max BOND' and 'Mult. Min BOND' to calculate High and low Bond.
In "LEFT RANGE" and "RIGHT RANGE" you can define the range which be used to find pivot and extremum points in calculation of highest and lowest LONG-TERM KDJ Line.
'MEMORY' is the size of cash that you want to collect the extracted data from extreimum points for highest and lowest LONG-TERM-KDJ. If overflowing from this point the oldest value would be kicked from cash.
Other parts are same in KDJ Indicators.
Enjoy trading!
Shakib.
+ JMA KDJ with RSI OB/OS SignalsSo, what is the KDJ indicator? If you're familiar with the Stochastic, then you'll know that the two oscillating lines are called the 'K' and 'D' lines. Now you know that this is some sort of implementation of the Stochastic. But, then, what is the J? The 'J' is simply the measure of convergence/divergence of the 'K' and 'D' lines, and the 'J' crossing the 'K' and 'D' lines is representational of the 'K' and 'D' lines themselves crossing. Is this an improvement over simply using the Stochastic as it is? Beats me. I don't use the Stochastic. I stumbled upon the KDJ while surfing around the web, and it sounded cool, so I thought I'd look at it. I do like it a bit more as the 'J' line being far overextended from the other two (usually into overbought/sold territory) does give a clear visual representation of the divergence of the 'K' and 'D' lines, which you might not notice otherwise. So, from that perspective I suppose it is nicer.
But let's get to the good stuff now, shall we? What did I do here?
Well, first thing you're wondering is why there are only two lines when based on my explanation (or your previous experience with the indicator) there should be three. I found this script here on TV, by x4random, who took the 'K' and 'D' lines and made an average of them, so there is only one line instead of the two. So, fewer lines on the indicator, but still the same usefulness. It was in older TV code, so I took it to version4 and cleaned up the code slightly. His indicator included the RSI ob/os plots, and I thought this was neat (even though the RSI being os/ob doesn't tell you much except that the trend is strong, and you should be buying pullback or selling rallies) so I kept them in. His indicator was also the most visually appealing one that I saw on here, so that attracted me too. Credit to x4random for the indicator, though.
Aside from code cleanup and adding the usual bells and whistles (which I will get to) the big thing I did here was change is RMA that he was using for the 'K' and 'D' lines to a Jurik MA's, which smooth a lot of the noise of other moving averages while maintaining responsiveness. This eliminates noise (false signals) while keeping the signals of significance. It took me a while to figure out how to substitute the JMA for the RMA, but thanks to QuantTherapy's "Jurik PPO" indicator I was able to nail down the implementation. One thing you might notice is that there is no input to change signal length. I fiddled with this for a time before sticking to using the period, instead of the signal (thus eliminating the use of the signal input altogether), length to generate the 'K' and 'D' calculations. To make any adjustments other than the period length use the Jurik Power input. You can use the phase input as well, but it has much less of an effect.
Everything else I changed is pretty much cosmetic.
Candle coloring with the option to color candles based on either the 'J' line or the 'KD' line.
color.from_gradients with color inputs to make it beautiful (this is probably my best looking indicator, imo)
plots for when crosses occur (really wish there was a way to plot these over candlesticks! If anyone has any suggestions I'd love to see!)
I think that's about it. Alerts of course.
Enjoy!
Below is a comparison chart of my JMA implementation to the original RMA script.
You can see how much smoother the JMA version is. Both of these had the default period of 55 set, and the JMA version is using the default settings, while the original version is using a length of 3 for the signal line.

[blackcat] L1 Digitized KDJLevel: 1
Background
This is a simple model for digitized KDJ
Function
Lime for bull and Red for bear with digitized candles.
Key Signal
lime candle --> bull
red candle --> bear
blue candle --> watch
yellow candle --> long entry
fuchsia candle --> overbought
Remarks
Feedbacks are appreciated.
Readme
In real life, I am a prolific inventor. I have successfully applied for more than 60 international and regional patents in the past 12 years. But in the past two years or so, I have tried to transfer my creativity to the development of trading strategies. Tradingview is the ideal platform for me. I am selecting and contributing some of the hundreds of scripts to publish in Tradingview community. Welcome everyone to interact with me to discuss these interesting pine scripts.
The scripts posted are categorized into 5 levels according to my efforts or manhours put into these works.
Level 1 : interesting script snippets or distinctive improvement from classic indicators or strategy. Level 1 scripts can usually appear in more complex indicators as a function module or element.
Level 2 : composite indicator/strategy. By selecting or combining several independent or dependent functions or sub indicators in proper way, the composite script exhibits a resonance phenomenon which can filter out noise or fake trading signal to enhance trading confidence level.
Level 3 : comprehensive indicator/strategy. They are simple trading systems based on my strategies. They are commonly containing several or all of entry signal, close signal, stop loss, take profit, re-entry, risk management, and position sizing techniques. Even some interesting fundamental and mass psychological aspects are incorporated.
Level 4 : script snippets or functions that do not disclose source code. Interesting element that can reveal market laws and work as raw material for indicators and strategies. If you find Level 1~2 scripts are helpful, Level 4 is a private version that took me far more efforts to develop.
Level 5 : indicator/strategy that do not disclose source code. private version of Level 3 script with my accumulated script processing skills or a large number of custom functions. I had a private function library built in past two years. Level 5 scripts use many of them to achieve private trading strategy.


KDJ / Connectable [Azullian]Enhance your analysis with our KDJ. Oscillate through buying and selling signals seamlessly, identifying potential reversals with accuracy.
This connectable KDJ indicator is part of an indicator system designed to help test, visualize and build strategy configurations without coding. Like all connectable indicators , it interacts through the TradingView input source, which serves as a signal connector to link indicators to each other. All connectable indicators send signal weight to the next node in the system until it reaches either a connectable signal monitor, signal filter and/or strategy.
█ UNIFORM SETTINGS AND A WAY OF WORK
Although connectable indicators may have specific weight scoring conditions, they all aim to follow a standardized general approach to weight scoring settings, as outlined below.
■ Connectable indicators - Settings
• 🗲 Energy: Energy applies an ATR multiplier to the plotted shapes on the chart. A higher value plots shapes farther away from the candle, enhancing visibility.
• ☼ Brightness: Brightness determines the opacity of the shape plotted on the chart, aiding visibility. Indicator weight also influences opacity.
• → Input: Use the input setting to specify a data source for the indicator. Here you can connect the indicator to other indicators.
• ⌥ Flow: Determine where you want to receive signals from:
○ Both: Weights from this indicator and the connected indicator will apply
○ Indicator only: Only weights from this indicator will apply
○ Input only: Only weights from the connected indicator will apply
• ⥅ Weight multiplier: Multiply all weights in the entire indicator by a given factor, useful for quickly testing different indicators in a granular setup.
• ⥇ Threshold: Set a threshold to indicate the minimum amount of weight it should receive to pass it through to the next indicator.
• ⥱ Limiter: Set a hard limit to the maximum amount of weight that can be fed through the indicator.
■ Connectable indicators - Weight scoring settings
▢ Weight scoring conditions
• SM – Signal mode: Enable specific conditions for weight scoring
○ All: All signals will be scored.
○ Entries only: Only entries will score.
○ Exits only: Only exits will score.
○ Entries & exits: Both entries and exits will score.
○ Zone: Continuous scoring for each candle within the zone.
• SP – Signal period: Defines a range of candles within which a signal can score.
• SC - Signal count: Specifies the number of bars to retrospectively examine and score.
○ Single: Score for a single occurrence
○ All occurrences: Score for all occurrences
○ Single + Threshold: Score for single occurrences within the signal period (SP)
○ Every + Threshold: Score for all occurrences within the signal period (SP)
▢ Weight scoring direction
• ES: Enter Short weight
• XL: Exit long weight
• EL: Enter Long weight
• XS: Exit Short weight
▢ Weight scoring values
• Weights can hold either positive or negative scores. Positive weights enhance a particular trading direction, while negative weights diminish it.
█ KDJ - INDICATOR SETTINGS
■ Main settings
• Enable/Disable Indicator: Toggle the entire indicator on or off.
• S - Source: Choose an alternative data source for the KDJ calculation.
• T - Timeframe: Select an alternative timeframe for the KDJ calculation.
• P - Period: Define the number of bars or periods used in the KDJ calculation.
• SL - Signal line: Adjust the smoothing factor for the KDJ's J line. This not only offers clearer buy/sell cues by reducing market noise but also determines the precise points for potential crossovers and crossunders.
■ Scoring functionality
• The KDJ scores long entries when the J line crosses over the signal (SL) line.
• The KDJ scores long exits when the J line crosses under the signal (SL) line after a prior crossover.
• The KDJ scores long zones the entire time the J line is above the signal (SL) line.
• The KDJ scores short entries when the J line crosses under the signal (SL) line.
• The KDJ scores short exits when the J line crosses over the signal (SL) line after a prior crossunder.
• The KDJ scores short zones the entire time the J line is below the signal (SL) line.
█ PLOTTING
• Standard: Symbols (EL, XS, ES, XL) appear relative to candles based on set conditions. Their opacity and position vary with weight.
• Conditional Settings: A larger icon appears if global conditions are met. For instance, with a Threshold(⥇) of 12, Signal Period (SP) of 3, and Scoring Condition (SC) set to "EVERY", an KDJ signaling over two times in 3 candles (scoring 6 each) triggers a larger icon.
█ USAGE OF CONNECTABLE INDICATORS
■ Connectable chaining mechanism
Connectable indicators can be connected directly to the signal monitor, signal filter or strategy , or they can be daisy chained to each other while the last indicator in the chain connects to the signal monitor, signal filter or strategy. When using a signal filter you can chain the filter to the strategy input to make your chain complete.
• Direct chaining: Connect an indicator directly to the signal monitor, signal filter or strategy through the provided inputs (→).
• Daisy chaining: Connect indicators using the indicator input (→). The first in a daisy chain should have a flow (⌥) set to 'Indicator only'. Subsequent indicators use 'Both' to pass the previous weight. The final indicator connects to the signal monitor, signal filter, or strategy.
■ Set up this indicator with a signal filter and strategy
The indicator provides visual cues based on signal conditions. However, its weight system is best utilized when paired with a connectable signal filter, signal monitor, or strategy .
Let's connect the KDJ to a connectable signal filter and a strategy :
1. Load all relevant indicators
• Load KDJ / Connectable
• Load Signal filter / Connectable
• Load Strategy / Connectable
2. Signal Filter: Connect the KDJ to the Signal Filter
• Open the signal filter settings
• Choose one of the three input dropdowns (1→, 2→, 3→) and choose : KDJ / Connectable: Signal Connector
• Toggle the enable box before the connected input to enable the incoming signal
3. Signal Filter: Update the filter signals settings if needed
• The default settings of the filter enable EL (Enter Long), XL (Exit Long), ES (Enter Short) and XS (Exit Short).
4. Signal Filter: Update the weight threshold settings if needed
• All connectable indicators load by default with a score of 6 for each direction (EL, XL, ES, XS)
• By default, weight threshold (TH) is set at 5. This allows each occurrence to score, as the default score in each connectable indicator is 1 point above the threshold. Adjust to your liking.
5. Strategy: Connect the strategy to the signal filter in the strategy settings
• Select a strategy input → and select the Signal filter: Signal connector
6. Strategy: Enable filter compatible directions
• Set the signal mode of the strategy to a compatible direction with the signal filter.
Now that everything is connected, you'll notice green spikes in the signal filter representing long signals, and red spikes indicating short signals. Trades will also appear on the chart, complemented by a performance overview. Your journey is just beginning: delve into different scoring mechanisms, merge diverse connectable indicators, and craft unique chains. Instantly test your results and discover the potential of your configurations. Dive deep and enjoy the process!
█ BENEFITS
• Adaptable Modular Design: Arrange indicators in diverse structures via direct or daisy chaining, allowing tailored configurations to align with your analysis approach.
• Streamlined Backtesting: Simplify the iterative process of testing and adjusting combinations, facilitating a smoother exploration of potential setups.
• Intuitive Interface: Navigate TradingView with added ease. Integrate desired indicators, adjust settings, and establish alerts without delving into complex code.
• Signal Weight Precision: Leverage granular weight allocation among signals, offering a deeper layer of customization in strategy formulation.
• Advanced Signal Filtering: Define entry and exit conditions with more clarity, granting an added layer of strategy precision.
• Clear Visual Feedback: Distinct visual signals and cues enhance the readability of charts, promoting informed decision-making.
• Standardized Defaults: Indicators are equipped with universally recognized preset settings, ensuring consistency in initial setups across different types like momentum or volatility.
• Reliability: Our indicators are meticulously developed to prevent repainting. We strictly adhere to TradingView's coding conventions, ensuring our code is both performant and clean.
█ COMPATIBLE INDICATORS
Each indicator that incorporates our open-source 'azLibConnector' library and adheres to our conventions can be effortlessly integrated and used as detailed above.
For clarity and recognition within the TradingView platform, we append the suffix ' / Connectable' to every compatible indicator.
█ COMMON MISTAKES, CLARIFICATIONS AND TIPS
• Removing an indicator from a chain: Deleting a linked indicator and confirming the "remove study tree" alert will also remove all underlying indicators in the object tree. Before removing one, disconnect the adjacent indicators and move it to the object stack's bottom.
• Point systems: The azLibConnector provides 500 points for each direction (EL: Enter long, XL: Exit long, ES: Enter short, XS: Exit short) Remember this cap when devising a point structure.
• Flow misconfiguration: In daisy chains the first indicator should always have a flow (⌥) setting of 'indicator only' while other indicator should have a flow (⌥) setting of 'both'.
• Hide attributes: As connectable indicators send through quite some information you'll notice all the arguments are taking up some screenwidth and cause some visual clutter. You can disable arguments in Chart Settings / Status line.
• Layout and abbreviations: To maintain a consistent structure, we use abbreviations for each input. While this may initially seem complex, you'll quickly become familiar with them. Each abbreviation is also explained in the inline tooltips.
• Inputs: Connecting a connectable indicator directly to the strategy delivers the raw signal without a weight threshold, meaning every signal will trigger a trade.
█ A NOTE OF GRATITUDE
Through years of exploring TradingView and Pine Script, we've drawn immense inspiration from the community's knowledge and innovation. Thank you for being a constant source of motivation and insight.
█ RISK DISCLAIMER
Azullian's content, tools, scripts, articles, and educational offerings are presented purely for educational and informational uses. Please be aware that past performance should not be considered a predictor of future results.

KDJ Divergence Indicator(Regular & Hidden)📌 中文介绍
KDJ 背离指标(副图版,支持 Regular & Hidden)
这是一个基于 KDJ 指标 的背离检测工具,可以在副图中直观显示 Regular 背离(顶背离/底背离) 和 Hidden 背离(隐藏顶/隐藏底)。
功能特点:
可选计算基线:支持以 J 值 或 K 值 作为背离判定依据。
多种背离类型:
Regular Bullish(底背离):价格创新低,但指标不创新低 → 可能反弹。
Regular Bearish(顶背离):价格创新高,但指标不创新高 → 可能回落。
Hidden Bullish(隐藏底背离):价格不创新低,但指标创新低 → 可能延续上涨。
Hidden Bearish(隐藏顶背离):价格不创新高,但指标创新高 → 可能延续下跌。
连线显示:在副图用线条连接前后两个背离点,帮助更直观地发现趋势变化。
自定义选项:
可选择是否显示 Regular / Hidden 背离。
可调整回溯范围(左侧/右侧/最大最小)。
可自定义颜色和信号样式。
报警提醒:背离出现时会触发报警。
适合:
波段交易者寻找趋势反转。
短线交易者捕捉关键拐点。
技术分析结合 KDJ 的交易策略。
📌 English Introduction
KDJ Divergence Indicator (Sub-Chart, Regular & Hidden Supported)
This is a KDJ-based divergence detection tool, plotted in a sub-window, that highlights Regular Divergences (Bullish/Bearish) and Hidden Divergences (Hidden Bullish/Hidden Bearish).
Key Features:
Selectable Oscillator Line: Choose between J or K line as the basis for divergence detection.
Divergence Types:
Regular Bullish: Price makes a lower low, but oscillator makes a higher low → potential rebound.
Regular Bearish: Price makes a higher high, but oscillator makes a lower high → potential drop.
Hidden Bullish: Price holds higher low, but oscillator makes a lower low → potential trend continuation upward.
Hidden Bearish: Price holds lower high, but oscillator makes a higher high → potential trend continuation downward.
Line Connections: Draws connecting lines between divergence points for better visual clarity.
Customizable Settings:
Enable/disable Regular & Hidden divergences.
Adjustable left/right lookback and range filters.
Custom colors and shapes for signals.
Alert Ready: Alerts trigger when divergences are detected.
Best for:
Swing traders spotting trend reversals.
Short-term traders catching turning points.
Technical analysts using KDJ-based strategies.
KDJ Max-Distance (K-D vs K-J)This indicator measures the maximum divergence between K and its related lines (D or J) in the KDJ stochastic system.
KEY CONCEPT:
- Calculates two distances: |K-D| and |K-J|
- Outputs whichever distance is larger
- Shows which component (D or J) is most diverged from K at any given time
CALCULATION:
1. Standard KDJ: K (fast), D (K smoothed), J (3K - 2D)
2. Distance K-D: momentum between fast and slow lines
3. Distance K-J: captures extreme divergence
4. Output: max(|K-D|, |K-J|) or signed version
INTERPRETATION:
• High positive values: K strongly above both D and J (strong upward momentum)
• High negative values: K strongly below both D and J (strong downward momentum)
• Near zero: K aligned with D/J (consolidation or reversal zone)
• Background color shows which is dominant: Teal=K-D, Orange=K-J
USE CASES:
- Identify extreme momentum conditions
- Spot divergence exhaustion
- Confirm trend strength
- Filter ranging vs trending markets
SETTINGS:
- Signed mode: preserves direction (positive/negative)
- Absolute mode: shows pure distance magnitude
- Adjustable guide levels for visual reference
