5-Minute YEN Pivot Bars 1.0The 5-Minute YEN Pivot Bars indicator is designed to identify and highlight low-range pivot bars on 5-minute charts, specifically tailored for Yen-based pairs (e.g., GBPJPY, USDJPY). By focusing on precise pip thresholds, this tool helps traders detect potential pivot points within specific trading sessions, while avoiding inside bars and other noise often seen in low-volatility conditions. This can be particularly useful for trend traders and those looking to refine their entry points based on intraday reversals.
Key Features:
- Customized Pip Thresholds for Yen Pairs:
The indicator is pre-configured for Yen pairs, where 1 pip is typically represented by 0.01. It applies these thresholds:
- Limited Range: 4 pips or less between open and close prices.
- High/Low Directionality: At least 3 pips from the close/open to the bar's high or low.
- Open/Close Proximity: 4 pips or less between open and close.
- Inside Bar Tolerance: A tolerance of 3 pips for inside bars, helping reduce false signals from bars contained within the previous bar's range.
- Session-Specific Alerts:
- The indicator allows you to enable alerts for the European Session (6:00-12:00), American Session (12:00-17:00), and London Close (17:00-20:00). You can adjust these times based on your own trading hours or timezone preferences via a time-shift setting.
- Receive real-time alerts when a valid bullish or bearish pivot bar is identified within the chosen sessions, allowing you to respond to potential trade opportunities immediately.
- Time Shift Customization:
- Adjust the "Time Shift" parameter to account for different time zones, ensuring accurate session alignment regardless of your local time.
How It Works:
1. Pivot Bar Identification:
The indicator scans for bars where the difference between the open and close is within the "Limited Range" threshold, and both open and close prices are close to either the high or the low of the bar.
2. Directional Filtering:
It requires the bar to show strong directional bias by enforcing an additional distance between the open/close levels and the opposite end of the bar (high/low). Only bars with this directional structure are considered for highlighting.
3. Exclusion of Inside Bars:
Bars that are completely contained within the range of the previous bar are excluded (inside bars), as are consecutive inside bars. This filtering is essential to avoid marking bars that typically indicate consolidation rather than potential pivot points.
4. Session Alerts:
When a valid pivot bar appears within the selected sessions, an alert is triggered, notifying the trader of a potential trading signal. Bullish and bearish signals are differentiated based on whether the close is near the high or low.
How to Use:
- Trend Reversals: Use this indicator to spot potential trend reversals or pullbacks on a 5-minute chart, especially within key trading sessions.
- Entry and Exit Points: Highlighted bars can serve as potential entry points for traders looking to capitalize on short-term directional changes or continuation patterns.
- Combine with Other Indicators: Consider pairing this tool with momentum indicators or trendlines to confirm the signals, providing a comprehensive analysis framework.
Default Parameters:
- Limited Range: 4 Pips
- High/Low Directionality: 3 Pips
- Open/Close Proximity: 4 Pips
- Inside Bar Tolerance: 3 Pips
- Session Alerts: Enabled for European, American, and London Close sessions
- Time Shift: Default 6 (adjustable to align with different time zones)
This indicator is specifically optimized for Yen pairs on 5-minute charts due to its pip calculation.
Cari skrip untuk "indicators"

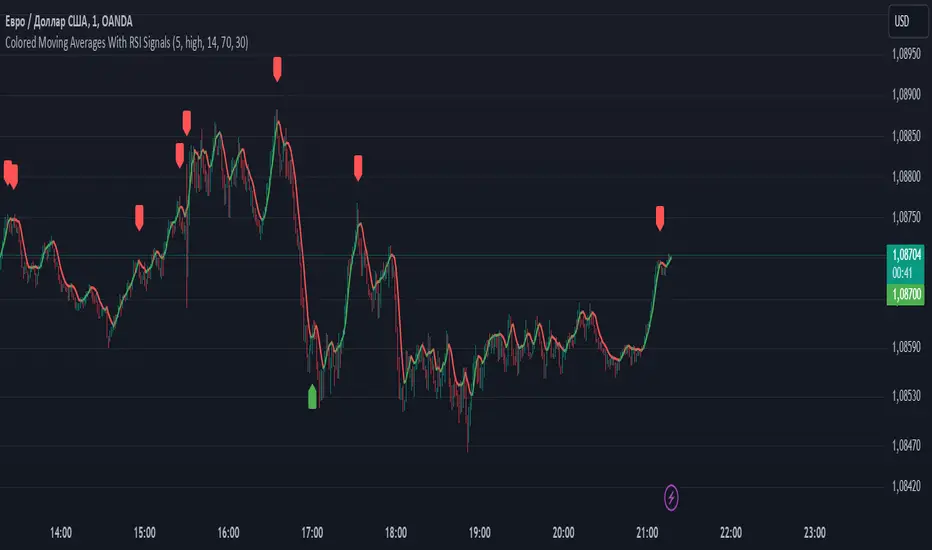
Colored Moving Averages With RSI SignalsMoving Average (MA):
Helps to determine the overall market trend. If the price is above the MA, it may indicate an uptrend, and if below, a downtrend.
In this case, a Simple Moving Average (SMA) is used, but other types can be applied as well.
Relative Strength Index (RSI):
This is an oscillator that measures the speed and changes of price movements.
Values above 70 indicate overbought conditions (possible sell signal), while values below 30 indicate oversold conditions (possible buy signal).
Purpose of This Indicator:
Trading Signals: The indicator generates "Buy" and "Sell" signals based on the intersection of the price line and the moving average, as well as RSI values. This helps traders make more informed decisions.
Signal Filtering: Using RSI in combination with MA allows for filtering false signals since it considers not only the current trend but also the state of overbought or oversold conditions.
How to Use:
For Short-Term Trading: Traders can use buy and sell signals to enter trades based on short-term market fluctuations.
In Combination with Other Indicators: It can be combined with other indicators for a more comprehensive analysis (e.g., adding support and resistance levels).
Overall, this indicator helps traders respond more quickly and accurately to changes in market conditions, enhancing the chances of successful trades.
Indicator SELL UBScript Name: UB Sell Indicator based on 10Y Volume and Trend
Description: This indicator uses the 10-year interest rate (10Y1!) volume and price data to generate sell signals on the UB contract. When the 10Y1! volume exceeds a fixed threshold and the 10Y1! price is rising, a sell signal is issued to help traders anticipate bearish moves on the UB.
Features:
10Y1! Volume: Identifies periods of high volume.
10Y1! Price: Detects bullish trends in the 10Y1!.
Sell Signals: Displays red arrows to indicate selling opportunities on UB when conditions are met.
Visual Indicators: Colors and arrows for easy signal interpretation.
Parameters:
Fixed Volume Threshold: 114 (modifiable as needed).
Moving Average Period: 10 (to calculate the 10Y1! price trend).
Usage:
Watch for red arrows to identify selling opportunities on UB.
Combine with other analyses and indicators for a complete trading strategy.
Author: Jm Smeers
Publication Date: 26/10/2024

[ETH] Optimized Trend Strategy - Lorenzo SuperScalpStrategy Title: Optimized Trend Strategy - Lorenzo SuperScalp
Description:
The Optimized Trend Strategy is a comprehensive trading system tailored for Ethereum (ETH) and optimized for the 15-minute timeframe but adaptable to various timeframes. This strategy utilizes a combination of technical indicators—RSI, Bollinger Bands, and MACD—to identify and act on price trends efficiently, providing traders with actionable buy and sell signals based on market conditions.
Key Features:
Multi-Indicator Approach:
RSI (Relative Strength Index): Identifies overbought and oversold conditions to time market entries and exits.
Bollinger Bands: Acts as a dynamic support and resistance level, helping to pinpoint precise entry and exit zones.
MACD (Moving Average Convergence Divergence): Detects momentum changes through bullish and bearish crossovers.
Signal Conditions:
Buy Signal:
RSI is below 45 (indicating an oversold condition).
Price is near or below the lower Bollinger Band.
MACD bullish crossover occurs.
Sell Signal:
RSI is above 55 (indicating an overbought condition).
Price is near or above the upper Bollinger Band.
MACD bearish crossunder occurs.
Trade Execution Logic:
Long Trades: Opened when a buy signal flashes. If there’s an open short position, it is closed before opening a long.
Short Trades: Opened when a sell signal flashes. If there’s an open long position, it is closed before opening a short.
The strategy also ensures a minimum number of bars between consecutive trades to avoid rapid trading in choppy conditions.
Pyramiding Support:
Up to 3 consecutive trades in the same direction are allowed, enabling traders to scale into positions based on strong signals.
Visual Indicators:
RSI Levels: Dotted lines at 45 and 55 for quick reference to oversold and overbought levels.
Buy and Sell Signals: Visual markers on the chart indicate where trades are executed, ensuring clarity on entry and exit points.
Best Used For:
Swing Trading & Scalping: While optimized for the 15-minute timeframe, this strategy works across various timeframes, making it suitable for both short-term scalping and swing trading.
Crypto Trading: Tailored for Ethereum but effective for other cryptocurrencies due to its dynamic indicator setup.

Multiple SMA, EMA, and VWAP CrossoversMultiple SMA, EMA, and VWAP Crossovers with Alerts
Overview : The "Multiple SMA, EMA, and VWAP Crossovers" script is designed for traders who want to monitor various simple moving averages (SMAs), exponential moving averages (EMAs), and the volume-weighted average price (VWAP) to identify potential buy and sell opportunities. This script allows you to visualize key moving averages on your chart and create custom alerts for specific crossover events.
Detail s: This script plots the following moving averages:
Simple Moving Averages (SMA): 5, 10, 20, 50, 100, 200, and 325 periods
Exponential Moving Average (EMA): 9 periods
Volume-Weighted Average Price (VWAP)
It includes options to display these moving averages and set alerts for their crossovers.
Available Crossovers:
20/50 SMA, 20/100 SMA, 20/200 SMA, 20/325 SMA
50/100 SMA, 50/200 SMA, 50/325 SMA
100/200 SMA, 100/325 SMA
200/325 SMA
VWAP/20 SMA, VWAP/50 SMA, VWAP/100 SMA, VWAP/200 SMA, VWAP/325 SMA
Optional Lines to Add to the Chart:
9 EMA, 5 SMA, 10 SMA, 20 SMA, 50 SMA, 100 SMA, 200 SMA, 325 SMA, VWAP
How to Use:
Enable Indicators: Use the input options to select which SMAs, EMA, and VWAP you want to display on your chart.
Set Alerts: Choose the specific crossover events you want to monitor. For example, you can set an alert for the 20/50 SMA crossover or the VWAP/100 SMA crossover.
Monitor the Chart: The script will plot the selected moving averages on your chart. When a selected crossover event occurs, an alert will be triggered, notifying you of the potential trade opportunity.
Usage Tips:
Trending Market: Use the buy and sell alerts in trending markets where the moving averages can help confirm the direction of the trend.
Key Support and Resistance Levels: Combine crossover alerts with key support and resistance levels for more reliable trading signals.
Volume Confirmation: Ensure there is sufficient volume to support the crossover signals, indicating stronger momentum behind the move.
When NOT to Use Buy and Sell Alerts:
Low Volume: Avoid using buy and sell alerts during periods of low trading volume, as the signals may be less reliable.
Market Noise: Be cautious in highly volatile markets where frequent crossovers might generate false signals.
Sideways Market: In a sideways or range-bound market, crossover signals can result in multiple whipsaws, leading to potential losses.
Why Use This Script? This script provides a comprehensive tool for traders to monitor multiple moving averages and VWAP crossovers efficiently. It allows you to customize alerts based on your trading strategy and helps you make informed decisions by visualizing key technical indicators on your chart.
Legal Disclaimer: The information provided by this script is for educational and informational purposes only and should not be considered financial advice. The developer of this script is not responsible for any financial losses incurred from using this script.

Liquidity Analysis with Volume, ATR, and Chaikin Oscillator
Script Name: Liquidity Analysis with Volume, ATR, and Chaikin Oscillator
Description: This script analyzes market liquidity using three key indicators: Volume, ATR (Average True Range), and the Chaikin Oscillator. Based on the combination of these indicators, the script identifies three market conditions and visually highlights them with background colors:
High Liquidity Uptrend (Green Background):
Occurs when volume is high, ATR is above the threshold, and the Chaikin Oscillator is positive. This indicates strong liquidity with an upward trend in the market.
Alert: "High Liquidity Uptrend detected."
High Liquidity Downtrend (Red Background):
Occurs when volume is high, ATR is above the threshold, and the Chaikin Oscillator is negative. This signals strong liquidity but with a downward market trend.
Alert: "High Liquidity Downtrend detected."
Low Liquidity Stagnant Market (Yellow Background):
Occurs when volume is low, and ATR is below the threshold. This suggests a market with low liquidity and minimal price movement, indicating a range or stagnant phase.
Alert: "Low Liquidity Stagnant market detected."
Input Settings Panel:
Volume Threshold: This value sets the minimum volume required to determine high liquidity. If the volume is above this value, it is considered "high volume."
ATR Length: Defines the number of periods used to calculate ATR. The higher the value, the more smoothed the ATR calculation.
ATR Threshold: This sets the minimum ATR value required to signal a market with significant volatility. If ATR is above this value, the market is considered to have high volatility.
These settings allow you to fine-tune the script based on the characteristics of the asset being analyzed.
スクリプト名: 出来高、ATR、チャイキンオシレーターを用いた流動性分析
説明: このスクリプトは、出来高、ATR(平均真値幅)、およびチャイキンオシレーターという3つの主要な指標を用いて市場の流動性を分析します。これらの指標の組み合わせに基づいて、3つの市場状況を特定し、背景色で視覚的にハイライトします。
流動性が高い上昇相場(背景色:緑):
出来高が高く、ATRがしきい値を超え、チャイキンオシレーターがプラスの場合に発生します。これは、強い流動性と市場の上昇トレンドを示します。
アラート: 「高流動性の上昇トレンドが検出されました。」
流動性が高い下降相場(背景色:赤):
出来高が高く、ATRがしきい値を超え、チャイキンオシレーターがマイナスの場合に発生します。これは、強い流動性を伴う下降トレンドを示します。
アラート: 「高流動性の下降トレンドが検出されました。」
流動性が低い停滞相場(背景色:黄色):
出来高が低く、ATRがしきい値以下の場合に発生します。これは流動性が低く、価格変動が少ない、レンジまたは停滞フェーズを示しています。
アラート: 「低流動性の停滞相場が検出されました。」
設定パネルの入力項目:
出来高のしきい値: 高流動性を判定するために必要な最小の出来高を設定します。この値を超える場合、「高出来高」と見なされます。
ATRの期間: ATRを計算する際に使用される期間数を定義します。値が大きいほど、ATRの計算が滑らかになります。
ATRのしきい値: しきい値を超えた場合に市場に大きなボラティリティがあると判断します。この値を上回るATRであれば、ボラティリティが高いと見なされます。
これらの設定により、分析対象の資産の特性に応じてスクリプトを調整できます。

ADX with Alerts for Strong Trending ConditionsMad Props to Chat GPT. Basically, this thing lets you set alerts on the ADX being Above 20 AND the Positive or Negative Directional Movement Line being Above the ADX. Useful for being alerted when a strong trend is in place to look for the pullback.
Description
The ADX with Custom Alerts indicator is designed to assist traders in identifying trends and potential trading opportunities based on the Average Directional Index (ADX) and Directional Indicators (DI+ and DI-). This tool provides a clear visual representation of market strength and directional movement, enhancing decision-making in trading.
Features
ADX Calculation:
The ADX measures the strength of a trend, regardless of its direction. The indicator calculates the ADX using a configurable length and a smoothing parameter, allowing traders to customize it based on their trading preferences.
Directional Indicators:
DI+: Represents bullish momentum.
DI-: Represents bearish momentum.
The indicator plots both DI+ and DI- alongside the ADX to give a complete picture of market direction.
Alert Conditions:
The indicator includes custom alert conditions that notify traders when:
Condition 1: The ADX rises above the defined threshold (default set at 20) and DI+ is above the ADX, indicating potential bullish momentum.
Condition 2: The ADX rises above the defined threshold and DI- is above the ADX, indicating potential bearish momentum.
Visual Representation:
The ADX line is plotted in blue, with the DI+ line in green and the DI- line in red.
A dotted horizontal line represents the ADX threshold, providing a clear visual cue for trend strength.
Background Highlighting:
The indicator uses background coloring to enhance visual analysis:
Green shading indicates when DI+ is above the ADX, suggesting bullish conditions.
Red shading indicates when DI- is above the ADX, suggesting bearish conditions.
Customizable Parameters:
Traders can adjust the length of the ADX calculation, the smoothing factor, and the threshold level to suit their trading strategies and timeframes.
Usage
This indicator is particularly useful for traders looking to:
Identify strong trends and potential entry points based on trend strength.
Make informed decisions using alerts that signal important market conditions.
Enhance their trading strategies with clear visual cues and customizable parameters.

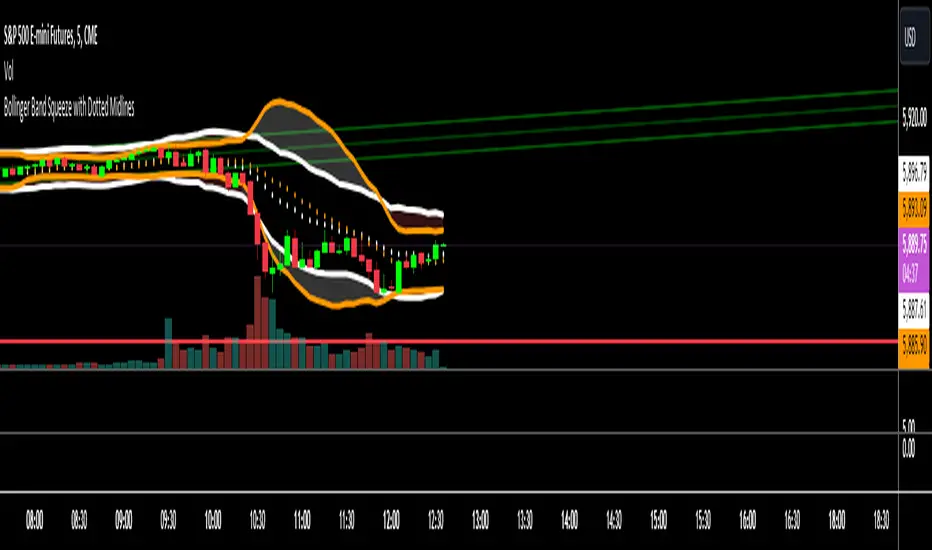
Bollinger Band Squeeze with Dotted MidlinesBollinger Band Squeeze with Dotted Midlines
Overview:
The Bollinger Band Squeeze with Dotted Midlines indicator is a powerful tool designed to identify periods of low volatility in the market, known as "squeeze" conditions, which often precede significant price movements. By combining Bollinger Bands and Keltner Channels, this indicator highlights when the market is consolidating and prepares traders for potential breakouts.
Key Features:
• Squeeze Detection: The indicator fills the area between the Bollinger Bands and Keltner Channels with a semi-transparent red color when both the upper and lower Bollinger Bands are within the Keltner Channels. This visual cue signifies a squeeze condition.
• Dynamic Color Filling: When the Bollinger Bands move outside the Keltner Channels, the fill color changes to a semi-transparent white, indicating the end of the squeeze and the potential start of increased volatility.
• Enhanced Visual Clarity:
o Upper and Lower Bands: The upper and lower lines of both the Bollinger Bands and Keltner Channels are plotted with increased thickness (3pt) for better visibility.
o Midlines with Dotted Effect: The middle lines (50% lines) for both the Bollinger Bands and Keltner Channels are plotted as dotted lines using circles with a thinner line width (1pt), providing a clear yet unobtrusive reference point.
Indicator Components:
1. Bollinger Bands (Orange Lines):
o Upper Bollinger Band: Calculated as the moving average plus a multiple of the standard deviation.
o Lower Bollinger Band: Calculated as the moving average minus a multiple of the standard deviation.
o Middle Bollinger Band: The simple moving average (SMA) of the closing price.
2. Keltner Channels (White Lines):
o Upper Keltner Channel: Calculated as the exponential moving average (EMA) plus a multiple of the average true range (ATR).
o Lower Keltner Channel: Calculated as the EMA minus a multiple of the ATR.
o Middle Keltner Channel: The EMA of the closing price.
3. Squeeze Condition Fill:
o Red Fill (40% Opacity): Indicates a squeeze condition where the Bollinger Bands are entirely within the Keltner Channels.
o White Fill (40% Opacity): Indicates normal market conditions where the Bollinger Bands have moved outside the Keltner Channels.
How to Use:
1. Identifying Squeeze Conditions:
o Look for Red Filled Areas: When you see the area between the Bollinger Bands and Keltner Channels filled in semi-transparent red, it signals a squeeze condition. This means the market is experiencing low volatility and may be preparing for a significant move.
2. Preparing for Potential Breakouts:
o Monitor for Fill Color Changes: A transition from red to white fill suggests that the squeeze is ending, and volatility is increasing. Traders often interpret this as a potential opportunity for a breakout in either direction.
3. Utilizing Midlines:
o Reference Midlines for Trend Direction: The dotted midlines provide insight into the overall trend. Crossing of the price above or below these lines can offer additional confirmation for trading decisions.
Customization Options:
• Bollinger Bands Settings:
o Length: Default is 20 periods. Adjust to change the sensitivity of the bands.
o Multiplier: Default is 2.0. Modify to increase or decrease the band width based on standard deviation.
• Keltner Channels Settings:
o Length: Default is 20 periods. Alter to adjust the responsiveness of the channels.
o Multiplier: Default is 1.5. Change to widen or narrow the channels based on average true range.
Advantages:
• Visual Clarity: Enhanced line thickness and semi-transparent fills make it easy to spot key market conditions at a glance.
• Early Warning System: By identifying squeeze conditions, traders can anticipate potential breakouts and plan their strategies accordingly.
• Flexible Application: Suitable for various timeframes and trading styles, including day trading, swing trading, and position trading.
Limitations:
• False Signals: Like all technical indicators, it may produce false signals, especially in choppy or range-bound markets.
• Should Be Used with Other Indicators: For better accuracy, it's recommended to use this indicator in conjunction with other technical analysis tools and not as a standalone signal generator.
Conclusion:
The Bollinger Band Squeeze with Dotted Midlines indicator is a valuable addition to any trader's toolkit. By effectively highlighting periods of consolidation and potential breakout points, it aids in making informed trading decisions. The visual enhancements improve usability, allowing traders to quickly interpret market conditions and respond appropriately.
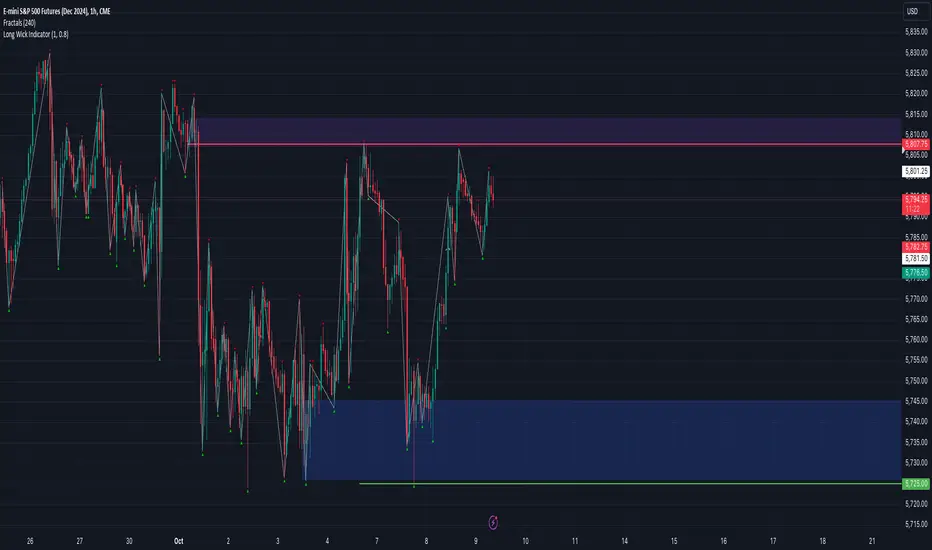
Long Wick Indicator
This indicator identifies and highlights candles with long wicks, which can be useful for various trading strategies.
Key Features:
1. Timeframe Limitation:
- Optional feature to limit the indicator to specific timeframes
- User can set a maximum timeframe (default: 5 minutes)
2. Customizable Wick-to-Body Ratio:
- User-defined minimum ratio for wick length to body length (default: 0.8)
3. Customizable Visual Indicators:
- Triangles appear above or below candles with long wicks (user can change triangles to another symbol)
- Yellow triangle pointing up: long bottom wick
- Yellow triangle pointing down: long top wick
Functionality:
- Calculates body size and wick sizes for each candle
- Compares wick sizes to body size using the user-defined ratio
- Plots indicators only if the current timeframe is within the specified limit (if enabled)
Usage:
Add this indicator to your TradingView chart to identify potential setups.
Customization:
Users can adjust the wick-to-body ratio and timeframe limitations in the indicator settings to suit their trading style and strategy.
Volume-Supported Linear Regression Trend TableThe "Volume-Supported Linear Regression Trend Table" (VSLRT Table) script helps traders identify buy and sell opportunities by analyzing price trends and volume dynamics across multiple timeframes. It uses linear regression to calculate the trend direction and volume strength, visually representing this data with color-coded signals on the chart and in a table. Green signals indicate buying opportunities, while red signals suggest selling, with volume acting as confirmation of trend strength. Traders can use these signals for both short and long positions, with additional risk management and multi-timeframe validation to enhance the strategy.
------------------------------------------------------------------------------
To use the "Volume-Supported Linear Regression Trend Table" (VSLRT Table) script in a trading strategy, you would incorporate it into your decision-making process to identify potential buy and sell opportunities based on the trend and volume dynamics. Here’s how you could apply it for trading:
1. Understanding the Key Elements:
Trend Direction (Slope of Price): The script uses linear regression to assess the trend direction of the price. If the price slope is positive, the asset is likely in an uptrend; if it's negative, the asset is in a downtrend.
Volume-Backed Signals: The buy or sell signal is not only based on the price trend but also on volume. Volume is crucial in validating the strength of a trend; large volume often indicates strong interest in a direction.
2. Interpreting the Table and Signals:
The table displayed at the bottom-right of your TradingView chart gives you a clear overview of the trends across different timeframes:
Trend Colors:
Green hues (e.g., ccol11, ccol12, etc.): Indicate a buying trend supported by volume.
Red hues (e.g., ccol21, ccol22, etc.): Indicate a selling trend supported by volume.
Gray: Indicates weak or unclear trends where no decisive direction is present.
Buy/Sell Signals:
The script plots triangles on the chart:
Upward triangle below the bar signals a potential buy.
Downward triangle above the bar signals a potential sell.
3. Building a Trading Strategy:
Here’s how you can incorporate the script’s information into a trading strategy:
Buy Signal (Long Entry):
Look for green triangles (indicating a buy signal) below a bar.
Confirm that the trend color in the table for the relevant timeframe is green, which shows that the buy signal is supported by strong volume.
Ensure that the price is in an uptrend (positive slope) and that volume is increasing on upward moves, as this indicates buying interest.
Execute a long position when these conditions align.
Sell Signal (Short Entry):
Look for red triangles (indicating a sell signal) above a bar.
Confirm that the trend color in the table for the relevant timeframe is red, which shows that the sell signal is supported by strong volume.
Ensure that the price is in a downtrend (negative slope) and that volume is increasing on downward moves, indicating selling pressure.
Execute a short position when these conditions align.
Exiting the Trade:
Exit a long position when a sell signal (red triangle) appears, or when the trend color in the table shifts to red.
Exit a short position when a buy signal (green triangle) appears, or when the trend color in the table shifts to green.
4. Multi-Timeframe Confirmation:
The script provides trends across multiple timeframes (tf1, tf2, tf3), which can help in validating your trade:
Short-Term Trading: Use shorter timeframes (e.g., 3, 5 minutes) for intraday trades. If both short and medium timeframes align in trend direction (e.g., both showing green), it strengthens the signal.
Longer-Term Trading: If you are trading on a higher timeframe (e.g., daily or weekly), confirm that the lower timeframes align with your intended trade direction.
5. Adding Risk Management:
Stop-Loss: Place stop-losses below recent lows (for long trades) or above recent highs (for short trades) to minimize risk.
Take Profit: Consider taking profit at key support/resistance levels or based on a fixed risk-to-reward ratio (e.g., 2:1).
Example Strategy Flow:
For Long (Buy) Trade:
Signal: A green triangle appears below a candle (Buy signal).
Trend Confirmation: Check that the color in the table for your selected timeframe is green, confirming the trend is supported by volume.
Execute Long: Enter a long trade if the price is trending upward (positive price slope).
Exit Long: Exit when a red triangle appears above a candle (Sell signal) or if the trend color shifts to red in the table.
For Short (Sell) Trade:
Signal: A red triangle appears above a candle (Sell signal).
Trend Confirmation: Check that the color in the table for your selected timeframe is red, confirming the trend is supported by volume.
Execute Short: Enter a short trade if the price is trending downward (negative price slope).
Exit Short: Exit when a green triangle appears below a candle (Buy signal) or if the trend color shifts to green in the table.
6. Fine-Tuning:
Backtesting: Before trading live, use TradingView’s backtesting features to test the strategy on historical data and optimize the settings (e.g., length of linear regression, timeframe).
Combine with Other Indicators: Use this strategy alongside other technical indicators (e.g., RSI, MACD) for better confirmation.
In summary, the script helps identify trends with volume support, giving more confidence in buy/sell decisions. Combining these signals with risk management and multi-timeframe analysis can create a solid trading strategy.

The Bar Counter Trend Reversal Strategy [TradeDots]Overview
The Bar Counter Trend Reversal Strategy is designed to identify potential counter-trend reversal points in the market after a series of consecutive rising or falling bars.
By analyzing price movements in conjunction with optional volume confirmation and channel bands (Bollinger Bands or Keltner Channels), this strategy aims to detect overbought or oversold conditions where a trend reversal may occur.
🔹How it Works
Consecutive Price Movements
Rising Bars: The strategy detects when there are a specified number of consecutive rising bars (No. of Rises).
Falling Bars: Similarly, it identifies a specified number of consecutive falling bars (No. of Falls).
Volume Confirmation (Optional)
When enabled, the strategy checks for increasing volume during the consecutive price movements, adding an extra layer of confirmation to the potential reversal signal.
Channel Confirmation (Optional)
Channel Type: Choose between Bollinger Bands ("BB") or Keltner Channels ("KC").
Channel Interaction: The strategy checks if the price interacts with the upper or lower channel lines: For short signals, it looks for price moving above the upper channel line. For long signals, it looks for price moving below the lower channel line.
Customization:
No. of Rises/Falls: Set the number of consecutive bars required to trigger a signal.
Volume Confirmation: Enable or disable volume as a confirmation factor.
Channel Confirmation: Enable or disable channel bands as a confirmation factor.
Channel Settings: Adjust the length and multiplier for the Bollinger Bands or Keltner Channels.
Visual Indicators:
Entry Signals: Triangles plotted on the chart indicate potential entry points:
Green upward triangle for long entries.
Red downward triangle for short entries.
Channel Bands: The upper and lower bands are plotted for visual reference.
Strategy Parameters:
Initial Capital: $10,000.
Position Sizing: 80% of equity per trade.
Commission: 0.01% per trade to simulate realistic trading costs.
🔹Usage
Set up the number of Rises/Falls and choose whether if you want to use channel indicators and volume as the confirmation.
Monitor the chart for triangles indicating potential entry points.
Consider the context of the overall market trend and other technical factors.
Backtesting and Optimization:
Use TradingView's Strategy Tester to evaluate performance.
Adjust parameters to optimize results for different market conditions.
🔹 Considerations and Recommendations
Risk Management:
The strategy does not include built-in stop-loss or take-profit levels. It's recommended to implement your own risk management techniques.
Market Conditions:
Performance may vary in different market environments. Testing and adjustments are advised when applying the strategy to new instruments or timeframes.
No Guarantee of Future Results:
Past performance is not indicative of future results. Always perform due diligence and consider the risks involved in trading.

ATR Bands with ATR Cross + InfoTableOverview
This Pine Script™ indicator is designed to enhance traders' ability to analyze market volatility, trend direction, and position sizing directly on their TradingView charts. By plotting Average True Range (ATR) bands anchored at the OHLC4 price, displaying crossover labels, and providing a comprehensive information table, this tool offers a multifaceted approach to technical analysis.
Key Features:
ATR Bands Anchored at OHLC4: Visual representation of short-term and long-term volatility bands centered around the average price.
OHLC4 Dotted Line: A dotted line representing the average of Open, High, Low, and Close prices.
ATR Cross Labels: Visual cues indicating when short-term volatility exceeds long-term volatility and vice versa.
Information Table: Displays real-time data on market volatility, calculated position size based on risk parameters, and trend direction relative to the 20-period Smoothed Moving Average (SMMA).
Purpose
The primary purpose of this indicator is to:
Assess Market Volatility: By comparing short-term and long-term ATR values, traders can gauge the current volatility environment.
Determine Optimal Position Sizing: A calculated position size based on user-defined risk parameters helps in effective risk management.
Identify Trend Direction: Comparing the current price to the 20-period SMMA assists in determining the prevailing market trend.
Enhance Decision-Making: Visual cues and real-time data enable traders to make informed trading decisions with greater confidence.
How It Works
1. ATR Bands Anchored at OHLC4
Average True Range (ATR) Calculations
Short-Term ATR (SA): Calculated over a 9-period using ta.atr(9).
Long-Term ATR (LA): Calculated over a 21-period using ta.atr(21).
Plotting the Bands
OHLC4 Dotted Line: Plotted using small circles to simulate a dotted line due to Pine Script limitations.
ATR(9) Bands: Plotted in blue with semi-transparent shading.
ATR(21) Bands: Plotted in orange with semi-transparent shading.
Overlap: Bands can overlap, providing visual insights into changes in volatility.
2. ATR Cross Labels
Crossover Detection:
SA > LA: Indicates increasing short-term volatility.
Detected using ta.crossover(SA, LA).
A green upward label "SA>LA" is plotted below the bar.
SA < LA: Indicates decreasing short-term volatility.
Detected using ta.crossunder(SA, LA).
A red downward label "SA LA, then the market is considered volatile.
Display: Shows "Yes" or "No" based on the comparison.
b. Position Size Calculation
Risk Total Amount: User-defined input representing the total capital at risk.
Risk per 1 Stock: User-defined input representing the risk associated with one unit of the asset.
Purpose: Helps traders determine the appropriate position size based on their risk tolerance and current market volatility.
c. Is Price > 20 SMMA?
SMMA Calculation:
Calculated using a 20-period Smoothed Moving Average with ta.rma(close, 20).
Logic: If the current close price is above the SMMA, the trend is considered upward.
Display: Shows "Yes" or "No" based on the comparison.
How to Use
Step 1: Add the Indicator to Your Chart
Copy the Script: Copy the entire Pine Script code into the TradingView Pine Editor.
Save and Apply: Save the script and click "Add to Chart."
Step 2: Configure Inputs
Risk Parameters: Adjust the "Risk Total Amount" and "Risk per 1 Stock" in the indicator settings to match your personal risk management strategy.
Step 3: Interpret the Visuals
ATR Bands
Width of Bands: Wider bands indicate higher volatility; narrower bands indicate lower volatility.
Band Overlap: Pay attention to areas where the blue and orange bands diverge or converge.
OHLC4 Dotted Line
Serves as a central reference point for the ATR bands.
Helps visualize the average price around which volatility is measured.
ATR Cross Labels
"SA>LA" Label:
Indicates short-term volatility is increasing relative to long-term volatility.
May signal potential breakout or trend acceleration.
"SA 20 SMMA?
Use this to confirm trend direction before entering or exiting trades.
Practical Example
Imagine you are analyzing a stock and notice the following:
ATR(9) Crosses Above ATR(21):
A green "SA>LA" label appears.
The info table shows "Yes" for "Is ATR-based price volatile."
Position Size:
Based on your risk parameters, the position size is calculated.
Price Above 20 SMMA:
The info table shows "Yes" for "Is price > 20 SMMA."
Interpretation:
The market is experiencing increasing short-term volatility.
The trend is upward, as the price is above the 20 SMMA.
You may consider entering a long position, using the calculated position size to manage risk.
Customization
Colors and Transparency:
Adjust the colors of the bands and labels to suit your preferences.
Risk Parameters:
Modify the default values for risk amounts in the inputs.
Moving Average Period:
Change the SMMA period if desired.
Limitations and Considerations
Lagging Indicators: ATR and SMMA are lagging indicators and may not predict future price movements.
Market Conditions: The effectiveness of this indicator may vary across different assets and market conditions.
Risk of Overfitting: Relying solely on this indicator without considering other factors may lead to suboptimal trading decisions.
Conclusion
This indicator combines essential elements of technical analysis to provide a comprehensive tool for traders. By visualizing ATR bands anchored at the OHLC4, indicating volatility crossovers, and providing real-time data on position sizing and trend direction, it aids in making informed trading decisions.
Whether you're a novice trader looking to understand market volatility or an experienced trader seeking to refine your strategy, this indicator offers valuable insights directly on your TradingView charts.
Code Summary
The script is written in Pine Script™ version 5 and includes:
Calculations for OHLC4, ATRs, Bands, SMMA:
Uses built-in functions like ta.atr() and ta.rma() for calculations.
Plotting Functions:
plotshape() for the OHLC4 dotted line.
plot() and fill() for the ATR bands.
Crossover Detection:
ta.crossover() and ta.crossunder() for detecting ATR crosses.
Labeling Crossovers:
label.new() to place informative labels on the chart.
Information Table Creation:
table.new() to create the table.
table.cell() to populate it with data.
Acknowledgments
ATR and SMMA Concepts: Built upon standard technical analysis concepts widely used in trading.
Pine Script™: Leveraged the capabilities of Pine Script™ version 5 for advanced charting and analysis.
Note: Always test any indicator thoroughly and consider combining it with other forms of analysis before making trading decisions. Trading involves risk, and past performance is not indicative of future results.
Happy Trading!

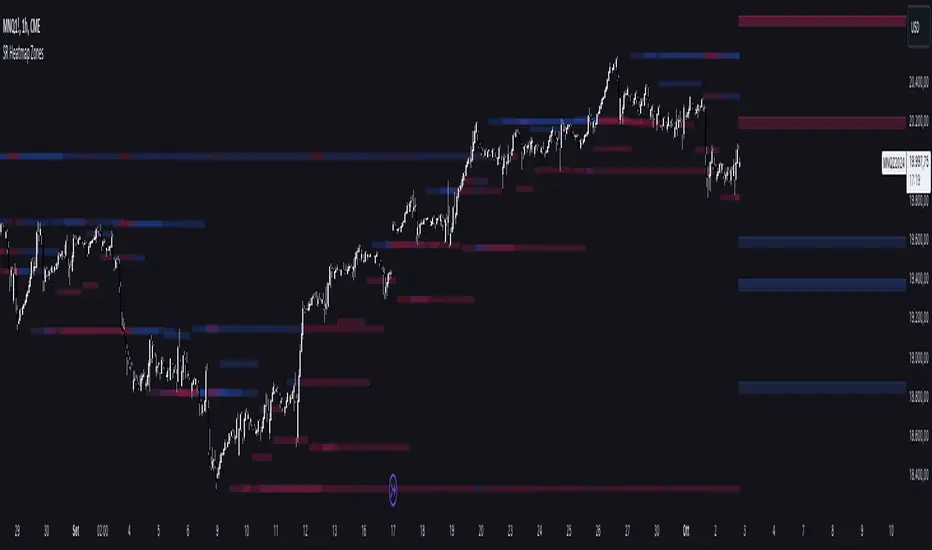
Support and Resistance HeatmapThe "Support and Resistance Heatmap" indicator is designed to identify key support and resistance levels in the price action by using pivots and ATR (Average True Range) to define the sensitivity of zone detection. The zones are plotted as horizontal lines on the chart, representing areas where the price has shown significant interaction. The indicator features a customizable heatmap to visualize the intensity of these zones, making it a powerful tool for technical analysis.
Features:
Dynamic Support and Resistance Zones:
Identifies potential support and resistance areas based on price pivots.
Zones are defined by ATR-based thresholds, making them adaptive to market volatility.
Customization Options:
Heatmap Visualization: Toggle the heatmap on/off to view the strength of each zone.
Sensitivity Control: Modify the zone sensitivity with the ATR Multiplier to increase or decrease zone detection precision.
Confirmations: Set how many touches a level needs before it is confirmed as a zone.
Extended Zone Visualization:
Option to extend the zones for better long-term visibility.
Ability to limit the number of zones displayed to avoid clutter on the chart.
Color-Coded Zones:
Color-coded zones help differentiate between bullish (support) and bearish (resistance) levels, providing visual clarity for traders.
Heatmap Integration:
Gradient-based color changes on levels show the intensity of touches, helping traders understand which zones are more reliable.
Inputs and Settings:
1. Settings Group:
Length:
Determines the number of bars used for the pivot lookback. This directly affects how frequently new zones are formed.
Sensitivity:
Controls the sensitivity of the zone calculation using ATR (Average True Range). A higher value will result in fewer, larger zones, while a lower value increases the number of detected zones.
Confirmations:
Sets the number of price touches needed before a level is confirmed as a support/resistance zone. Lower values will result in more zones.
2. Visual Group:
Extend Zones:
Option to extend the support and resistance lines across the chart for better visibility over time.
Max Zones to Display (maxZonesToShow):
Limits the maximum number of zones shown on the chart to avoid clutter.
3. Heatmap Group:
Show Heatmap:
Toggle the heatmap display on/off. When enabled, the script visualizes the strength of the zones using color intensity.
Core Logic:
Pivot Calculation:
The script identifies support and resistance zones by using the pivotHigh and pivotLow functions. These pivots are calculated using a lookback period, which defines the number of candles to the left and right of the pivot point.
ATR-Based Threshold:
ATR (Average True Range) is used to create dynamic zones based on volatility. The ATR acts as a buffer around the identified pivot points, creating zones that are more flexible and adaptable to market conditions.
Merging Zones:
If two zones are close to each other (within a certain threshold), they are merged into a single zone. This reduces overlapping zones and gives a cleaner visual representation of significant price levels.
Confirmation Mechanism:
Each time the price touches a zone, the confirmation counter for that zone increases. The more confirmations a zone has, the more reliable it is. Zones are only displayed if they meet the required number of confirmations as specified by the user.
Color Gradient:
Zones are color-coded based on the number of confirmations. A gradient is used to visually represent the strength of each zone, with stronger zones being more vividly colored.
Heatmap Visualization:
When the heatmap is enabled, the color intensity of the zones is adjusted based on the proximity of the price to the zone and the number of touches the zone has received. This helps traders quickly identify which zones are more critical.
How to Use:
Identifying Support and Resistance Zones:
After adding the indicator to your chart, you will see horizontal lines representing key support (bullish) and resistance (bearish) levels. These zones are dynamically updated based on price action and pivots.
Adjusting Zone Sensitivity:
Use the "ATR Multiplier" to fine-tune how sensitive the indicator is to price fluctuations. A higher multiplier will reduce the number of zones, focusing on more significant levels.
Using Confirmations:
The more times a price interacts with a zone, the stronger that zone becomes. Use the "Confirmations" input to filter out weaker zones. This ensures that only zones with enough interaction (touches) are plotted.
Activating the Heatmap:
Enabling the heatmap will provide a color-coded visual representation of the strength of the zones. Zones with more price interactions will appear more vividly, helping you focus on the most significant areas.
Best Practices:
Combine with Other Indicators:
This support and resistance indicator works well when combined with other technical analysis tools, such as oscillators (e.g., RSI, MACD) or moving averages, for better trade confirmations.
Adjust Sensitivity Based on Market Conditions:
In volatile markets, you may want to increase the ATR multiplier to focus on more significant support and resistance zones. In calmer markets, decreasing the multiplier can help you spot smaller, but relevant, levels.
Use in Different Time Frames:
This indicator can be used effectively across different time frames, from intraday charts (e.g., 1-minute or 5-minute charts) to longer-term analysis on daily or weekly charts.
Look for Confluences:
Zones that overlap with other indicators, such as Fibonacci retracements or key moving averages, tend to be more reliable. Use the zones in conjunction with other forms of analysis to increase your confidence in trade setups.
Limitations and Considerations:
False Breakouts:
In highly volatile markets, there may be false breakouts where the price briefly moves through a zone without a sustained trend. Consider combining this indicator with momentum-based tools to avoid false signals.
Sensitivity to ATR Settings:
The ATR multiplier is a key component of this indicator. Adjusting it too high or too low may result in too few or too many zones, respectively. It is important to fine-tune this setting based on your specific trading style and market conditions.
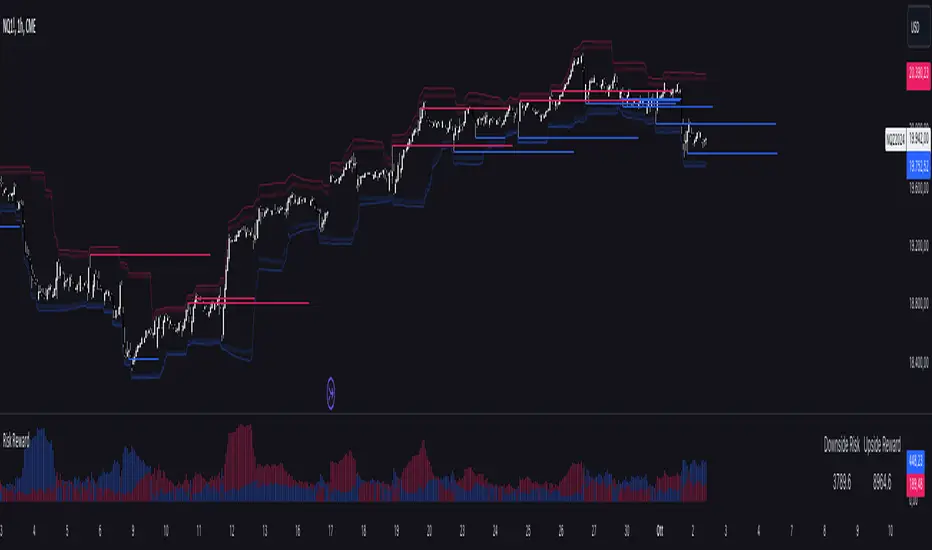
Risk RewardThe Risk Reward indicator, developed by OmegaTools, is a versatile technical tool designed to help traders visualize and evaluate potential reward and risk levels in their trades. By comparing recent price action against moving averages and volatility deviations, it calculates a range-weighted assessment of upside reward and downside risk. It provides a clear, color-coded visual representation of these potential ranges, along with critical support and resistance levels to aid in trade decision-making. This indicator is ideal for traders seeking to optimize their risk-reward ratio and make informed trade management decisions.
Features
Reward and Risk Visualization: Provides a histogram showing the relative potential of upside reward versus downside risk based on current price action.
Dynamic Support and Resistance Levels: Calculates and plots key price levels based on extreme of historical volatility, helping traders to identify important price zones.
Trade Size Customization: Users can adjust the trade size, and the indicator will calculate and display the estimated risk and reward in monetary terms based on the contract value.
Adaptive Volatility Extensions: Automatically adjusts extension lines based on volume, helping traders anticipate future price ranges and potential breakouts or breakdowns.
Customizable Visuals: Allows users to personalize the color scheme for bullish and bearish scenarios, making the chart more intuitive and user-friendly.
User Guide
Trade Size (size): Adjust the trade size in units (default is 1). This parameter impacts the risk and reward calculation shown in the summary table.
Length (lnt): Set the length for the exponential moving average (EMA) and the highest/lowest price calculations. This length determines the sensitivity of the indicator.
Different Visual (down): A boolean input to adjust the method for calculating downside risk. When set to true, it uses a different visual scheme.
Bullish Color (upc): Customize the color of the bullish (upside) histogram and support levels.
Bearish Color (dnc): Customize the color of the bearish (downside) histogram and resistance levels.
Plots
First Probability: Displays a histogram representing the higher value between reward and risk. It is colored according to whether the upside or downside is greater, providing a clear signal for potential trade direction.
Second Probability: A secondary histogram plot that visualizes the lower value between reward and risk, offering an additional perspective on the trade’s risk-reward balance.
Low Level/High Level: Displays dynamic support and resistance levels based on historical price data and volatility deviations.
Extension Lines: Visualize potential future price levels using volatility-adjusted projections. These lines help traders anticipate where price could move based on current conditions.
On-Chart Labels and Risk-Reward Table:
Risk and Reward Calculations: The indicator calculates the monetary value of downside risk and upside reward based on the provided trade size, volatility measures, and price movements.
Risk/Reward Table: Displayed directly on the chart, showing the downside risk and upside reward in easy-to-understand numerical values. This helps traders quickly assess the feasibility of a trade.
How It Works:
Moving Average Comparison: The indicator first calculates the 21-period (default) exponential moving average (EMA). It then compares the current price against this moving average to determine whether the market is in a bullish or bearish phase.
Deviation Calculation: It calculates the average deviation between the price and the EMA for both bullish and bearish movements, which is used to establish dynamic support and resistance levels.
Risk-Reward Calculation: Based on the highest and lowest price levels over the set period and the calculated deviations, it determines the potential upside reward and downside risk. The reward is calculated as the distance between the current price and the upper resistance levels, while the risk is determined as the distance to the lower support levels.
Visual Representation
The indicator plots histograms representing the relative magnitude of potential reward and risk.
Support and resistance levels are dynamically plotted on the chart using circles and lines, helping traders easily spot key areas of interest.
Extension lines are drawn to visualize potential future price levels based on current volatility.
Risk/Reward Table: This feature displays the calculated monetary risk and reward based on the trade size. It updates dynamically with price changes, offering a constant reference point for traders to evaluate their trade setup.
Practical Application
Identify Entry Points: Use the dynamic support and resistance levels to identify ideal trade entry points. The histogram helps determine whether the potential reward justifies the risk.
Risk Management: The calculated downside risk provides traders with an objective view of where to place stop-loss levels, while the upside reward aids in setting profit targets.
Trade Execution: By visually assessing whether reward outweighs risk, traders can make more informed decisions on trade execution, with the risk-reward ratio clearly displayed on the chart.
Best Practices:
Use Alongside Other Indicators: While this indicator offers a powerful standalone tool for assessing risk and reward, it works best when combined with other trend or momentum indicators for confirmation.
Adjust Inputs Based on Market Conditions: Adjust the length and trade size inputs depending on the asset being traded and the time horizon, as different assets may require different sensitivity settings.
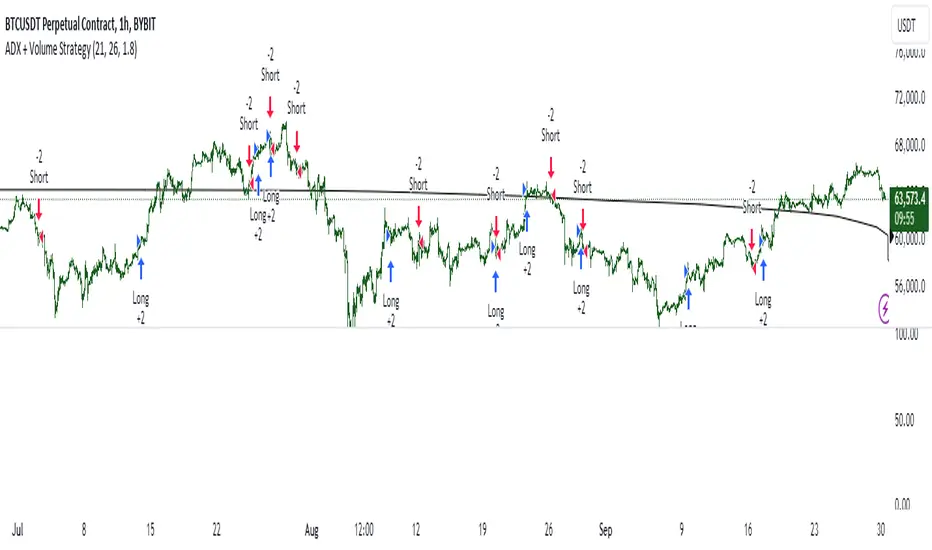
ADX + Volume Strategy### Strategy Description: ADX and Volume-Based Trading Strategy
This strategy is designed to identify strong market trends using the **Average Directional Index (ADX)** and confirm trading signals with **Volume**. The idea behind the strategy is to enter trades only when the market shows a strong trend (as indicated by ADX) and when the price movement is supported by high trading volume. This combination helps filter out weaker signals and provides more reliable entries into positions.
### Key Indicators:
1. **ADX (Average Directional Index)**:
- **Purpose**: ADX is a technical indicator that measures the strength of a trend, regardless of its direction (up or down).
- **Usage**: The strategy uses ADX to determine whether the market is trending strongly. If ADX is above a certain threshold (default is 25), it indicates that a strong trend is present.
- **Directional Indicators**:
- **DI+ (Directional Indicator Plus)**: Indicates the strength of the upward price movement.
- **DI- (Directional Indicator Minus)**: Indicates the strength of the downward price movement.
- ADX does not indicate the direction of the trend but confirms that a trend exists. DI+ and DI- are used to determine the direction.
2. **Volume**:
- **Purpose**: Volume is a key indicator for confirming the strength of a price movement. High volume suggests that a large number of market participants are supporting the movement, making it more likely to continue.
- **Usage**: The strategy compares the current volume to the 20-period moving average of the volume. The trade signal is confirmed if the current volume is greater than the average volume by a specified **Volume Multiplier** (default multiplier is 1.5). This ensures that the trade is supported by strong market participation.
### Strategy Logic:
#### **Entry Conditions:**
1. **Long Position** (Buy):
- **ADX** is above the threshold (default is 25), indicating a strong trend.
- **DI+ > DI-**, signaling that the market is trending upward.
- The **current volume** is greater than the 20-period average volume multiplied by the **Volume Multiplier** (e.g., 1.5), indicating that the upward price movement is backed by sufficient market activity.
2. **Short Position** (Sell):
- **ADX** is above the threshold (default is 25), indicating a strong trend.
- **DI- > DI+**, signaling that the market is trending downward.
- The **current volume** is greater than the 20-period average volume multiplied by the **Volume Multiplier** (e.g., 1.5), indicating that the downward price movement is backed by strong selling activity.
#### **Exit Conditions**:
- Positions are closed when the opposite signal appears:
- **For long positions**: Close when the short conditions are met (ADX still above the threshold, DI- > DI+, and the volume condition holds).
- **For short positions**: Close when the long conditions are met (ADX still above the threshold, DI+ > DI-, and the volume condition holds).
### Parameters:
- **ADX Period**: The period used to calculate ADX (default is 14). This controls how sensitive the ADX is to price movements.
- **ADX Threshold**: The minimum ADX value required for the strategy to consider the market trend as strong (default is 25). Higher values focus on stronger trends.
- **Volume Multiplier**: This parameter adjusts how much higher the current volume needs to be compared to the 20-period moving average for the signal to be valid. A value of 1.5 means the current volume must be 50% higher than the average volume.
### Example Trade Flow:
1. **Long Trade Example**:
- ADX > 25, confirming a strong trend.
- DI+ > DI-, confirming that the trend direction is upward.
- The current volume is 50% higher than the 20-period average volume (multiplied by 1.5).
- **Action**: Enter a long position.
2. **Short Trade Example**:
- ADX > 25, confirming a strong trend.
- DI- > DI+, confirming that the trend direction is downward.
- The current volume is 50% higher than the 20-period average volume.
- **Action**: Enter a short position.
### Strengths of the Strategy:
- **Trend Filtering**: The strategy ensures that trades are only taken when the market is trending strongly (confirmed by ADX) and that the price movement is supported by high volume, reducing the likelihood of false signals.
- **Volume Confirmation**: Using volume as confirmation provides an additional layer of reliability, as volume spikes often accompany sustained price moves.
- **Dual Signal Confirmation**: Both trend strength (ADX) and volume conditions must be met for a trade, making the strategy more robust.
### Weaknesses of the Strategy:
- **Limited Effectiveness in Range-Bound Markets**: Since the strategy relies on strong trends, it may underperform in sideways or non-trending markets where ADX stays below the threshold.
- **Lagging Nature of ADX**: ADX is a lagging indicator, which means that it may confirm the trend after it has already begun, potentially leading to late entries.
- **Volume Requirement**: In low-volume markets, the volume multiplier condition may not be met often, leading to fewer trade opportunities.
### Customization:
- **Adjust the ADX Threshold**: You can raise the threshold if you want to focus only on very strong trends, or lower it to capture moderate trends.
- **Adjust the Volume Multiplier**: You can change the multiplier to be more or less strict. A higher multiplier (e.g., 2.0) will require a stronger volume spike to confirm the signal, while a lower multiplier (e.g., 1.2) will allow more trades with weaker volume confirmation.
### Summary:
This ADX and Volume strategy is ideal for traders who want to follow strong trends while ensuring that the trend is supported by high trading volume. By combining a trend strength filter (ADX) and volume confirmation, the strategy aims to increase the probability of entering profitable trades while reducing the number of false signals. However, it may underperform in range-bound markets or in markets with low volume.
MTF Squeeze Analyzer - [tradeviZion]MTF Squeeze Analyzer
Multi-Timeframe Squeeze Pro Analyzer Tool
Overview:
The MTF Squeeze Analyzer is a comprehensive tool designed to help traders monitor the TTM Squeeze indicator across multiple timeframes in a streamlined and efficient manner. Built with Pine Script™ version 5, this indicator enhances your market analysis by providing detailed insights into squeeze conditions and momentum shifts, enabling you to make more informed trading decisions.
Key Features:
1. Multi-Timeframe Monitoring:
Comprehensive Coverage: Track squeeze conditions across multiple timeframes, including 1-minute, 5-minute, 15-minute, 30-minute, 1-hour, 2-hour, 4-hour, and daily charts.
Squeeze Counts: Keep count of the number of consecutive bars the price has been within each squeeze level (low, mid, high), helping you assess the strength and duration of consolidation periods.
2. Dynamic Table Display:
Customizable Appearance: Adjust table position, text size, and colors to suit your preferences.
Color-Coded Indicators: Easily identify squeeze levels and momentum shifts with intuitive color schemes.
Message Integration: Features rotating messages to keep you engaged and informed.
3. Alerts for Key Market Events:
Squeeze Start and Fire Alerts: Receive notifications when a squeeze starts or fires on your selected timeframes.
Custom Squeeze Count Alerts: Set thresholds for squeeze counts and get alerted when these levels are reached, allowing you to anticipate potential breakouts.
Fully Customizable: Choose which alerts you want to receive and tailor them to your trading strategy.
4. Momentum Analysis:
Momentum Oscillator: Visualize momentum using a histogram that changes color based on momentum shifts.
Detailed Insights: Determine whether momentum is increasing or decreasing to make more strategic trading decisions.
How It Works:
The indicator is based on the TTM Squeeze concept, which identifies periods of low volatility where the market is "squeezing" before a potential breakout. It analyzes the relationship between Bollinger Bands and Keltner Channels to determine squeeze conditions and uses linear regression to calculate momentum.
1. Squeeze Levels:
No Squeeze (Green): Market is not in a squeeze.
Low Compression Squeeze (Gray): Mild consolidation, potential for a breakout.
Mid Compression Squeeze (Red): Moderate consolidation, higher breakout potential.
High Compression Squeeze (Orange): Strong consolidation, significant breakout potential.
2. Squeeze Counts:
Tracks the number of consecutive bars in each squeeze condition.
Helps identify how long the market has been consolidating, providing clues about potential breakout timing.
3. Momentum Histogram:
Upward Momentum: Shown in aqua or blue, indicating increasing or decreasing upward momentum.
Downward Momentum: Displayed in red or yellow, representing increasing or decreasing downward momentum.
Using Alerts:
Stay ahead of market movements with customizable alerts:
1. Enable Alerts in Settings:
Squeeze Start Alert: Get notified when a new squeeze begins.
Squeeze Fire Alert: Be alerted when a squeeze ends, signaling a potential breakout.
Squeeze Count Alert: Set a specific number of bars for a squeeze condition, and receive an alert when this count is reached.
2. Set Up Alerts on Your Chart:
Click on the indicator name and select " Add Alert on MTF Squeeze Analyzer ".
Choose your desired alert conditions and customize the notification settings.
Click " Create " to activate the alerts.
How to Set It Up:
1. Add the Indicator to Your Chart:
Search for " MTF Squeeze Analyzer " in the TradingView Indicators library.
Add it to your chart.
2. Customize Your Settings:
Table Display:
Choose whether to show the table and select its position on the chart.
Adjust text size and colors to enhance readability.
Timeframe Selection:
Select the timeframes you want to monitor.
Enable or disable specific timeframes based on your trading strategy.
Colors & Styles:
Customize colors for different squeeze levels and momentum shifts.
Adjust header and text colors to match your chart theme.
Alert Settings:
Enable alerts for squeeze start, squeeze fire, and squeeze counts.
Set your preferred squeeze type and count threshold for alerts.
3. Interpret the Data:
Table Information:
The table displays the squeeze status and counts for each selected timeframe.
Colors indicate the type of squeeze, making it easy to assess market conditions at a glance.
Momentum Histogram:
Use the histogram to gauge the strength and direction of market momentum.
Observe color changes to identify shifts in momentum.
Why Use MTF Squeeze Analyzer ?
Enhanced Market Insight:
Gain a deeper understanding of market dynamics by monitoring multiple timeframes simultaneously.
Identify potential breakout opportunities by analyzing squeeze durations and momentum shifts.
Customizable and User-Friendly:
Tailor the indicator to fit your trading style and preferences.
Easily adjust settings without needing to delve into the code.
Time-Efficient:
Save time by viewing all relevant squeeze information in one place.
Reduce the need to switch between different charts and timeframes.
Stay Informed with Alerts:
Never miss a critical market movement with fully customizable alerts.
Focus on other tasks while the indicator monitors the market for you.
Acknowledgment:
This tool builds upon the foundational work of John Carter , who developed the TTM Squeeze concept. It also incorporates enhancements from LazyBear and Makit0 , providing a more versatile and powerful indicator. MTF Squeeze Analyzer extends these concepts by adding multi-timeframe analysis, squeeze counting, and advanced alerting features, offering traders a comprehensive solution for market analysis.
Note: Always practice proper risk management and test the indicator thoroughly to ensure it aligns with your trading strategy. Past performance is not indicative of future results.
Trade smarter with TradeVizion—unlock your trading potential today!

Charan_Trading_IndicatorCharan_Trading_Indicator Overview:
The Charan_Trading_Indicator combines several technical analysis tools, including Bollinger Bands, RSI (Relative Strength Index), VWAP (Volume-Weighted Average Price), and ATR (Average True Range), to provide buy and sell signals. The script incorporates multiple strategies, such as crack snap setups, overbought/oversold levels, and trend continuation indicators, all tailored for precise market entry and exit points.
Key Components:
RSI (Relative Strength Index):
The indicator uses RSI to detect overbought (RSI > 70) and oversold (RSI < 30) market conditions.
Alerts are triggered when prices are within the specified buy/sell range and RSI crosses these thresholds.
Bollinger Bands:
Bollinger Bands are calculated based on a configurable moving average and standard deviation.
The script identifies potential buy signals when the price dips below the lower Bollinger Band and recovers, and sell signals when the price exceeds the upper Bollinger Band and retraces.
Crack Snap Strategies:
The indicator incorporates multiple variations of the crack snap strategy:
Buy Signals: Triggered when price opens below the lower Bollinger Band and closes above it, alongside certain conditions in previous candles.
Sell Signals: Triggered when price opens above the upper Bollinger Band and closes below it, with similar candle patterns.
Variations such as 3-candle (3C) and 4-candle (4C) versions refine the crack snap setups for more robust signals.
Isolated Candle Conditions:
The indicator tracks isolated candles, where the entire candle lies above or below the Bollinger Bands, to identify potential reversal points.
Trend Continuation Signals:
Conditions based on the candle range and previous highs/lows allow the indicator to generate signals for trend continuation:
Buy signals when price breaks above the previous two highs.
Sell signals when price breaks below the previous two lows.
VWAP (Volume-Weighted Average Price):
The indicator integrates VWAP to give additional support and resistance levels, ensuring signals align with volume trends.
ATR-Based Stop Loss:
For both buy and sell conditions, the script plots stop-loss levels based on the ATR (Average True Range), giving dynamic risk management levels.
Buy/Sell Ranges:
The user can set minimum and maximum price ranges for buy and sell signals, ensuring that the indicator only generates alerts within desired price ranges.
How It Works:
Buy Signals: The script generates buy signals based on multiple conditions, including the crack snap strategy, oversold RSI levels, and trend continuation setups. When these conditions are met, green triangles appear below the price bars, and an alert is triggered.
Sell Signals: Sell signals are triggered when the opposite conditions are met (overbought RSI, crack snap sell setups, trend breaks), and red triangles appear above the price bars.
Visual Indicators: The script plots upper and lower Bollinger Bands, stop loss levels, and VWAP on the chart, providing a comprehensive view of market conditions and support/resistance levels.
This indicator is versatile, combining multiple technical tools for robust decision-making in trading. It generates alerts, plots visual markers, and integrates risk management, making it a well-rounded tool for technical analysis.
This indicator is versatile, combining multiple technical tools for robust decision-making in trading. It generates alerts, plots visual markers, and integrates risk management, making it a well-rounded tool for technical analysis.

[ROC3] Rate of Change Candle ColorROC is a statistical indicator which tracks how much a security's price has changed over a certain period, showing whether momentum is picking up or slowing down. It’s a handy tool because it helps traders spot trend changes and understand how strong a trend is.
My ROC3 indicator will color the candlesticks based on the Rate of Change (ROC) and its Exponential Moving Average (EMA). This indicator helps traders visually identify bullish and bearish trends by applying color to the candles, making it easier to spot momentum shifts and trend changes.
How It Works:
Rate of Change (ROC): Calculates the percentage change in the price over a specified number of bars. This indicator measures the speed at which price changes.
EMA of ROC: Applies an Exponential Moving Average to the ROC values to provide a smoothed benchmark. The EMA helps to reduce noise and make trend identification more reliable.
Coloring Logic:
Bullish Candles (Green): When the current ROC is higher than the EMA of the ROC.
Bearish Candles (Red): When the current ROC is lower than the EMA of the ROC.
Settings:
ROC Length (Default: 60): The number of bars used to calculate the Rate of Change. Adjust this parameter to change the sensitivity of the ROC calculation.
ROC EMA Length (Default: 7): The number of bars used to calculate the Exponential Moving Average of the ROC. This length determines how smooth the EMA is. A shorter length reacts faster to price changes, while a longer length provides a smoother, slower response.
How to Use:
Apply the Indicator: Add the Rate of Change Candle Color indicator to your TradingView chart.
Interpret the Colors:
Green Candles: Indicate bullish momentum. The current ROC is greater than its EMA, suggesting upward pressure.
Red Candles: Indicate bearish momentum. The current ROC is less than its EMA, suggesting downward pressure.
Adjust Settings: Customize the ROC Length and ROC EMA Length based on your trading strategy. Shorter ROC lengths may capture more short-term trends, while longer lengths provide a broader view.
Combine with Other Indicators: Use the in conjunction with other technical indicators or chart patterns to enhance your trading analysis.
Example Use Case:
Trend Confirmation: Use the color changes to confirm bullish or bearish trends. Green candles can confirm uptrends, while red candles may signal downtrends or potential reversals.
Momentum Analysis: Monitor how frequently the ROC crosses above or below its EMA to gauge momentum strength and make informed trading decisions.
Note:
This indicator is designed to assist with trend analysis and should be used as part of a broader trading strategy. Always conduct your own research and analysis before making trading decisions.
Cherio...

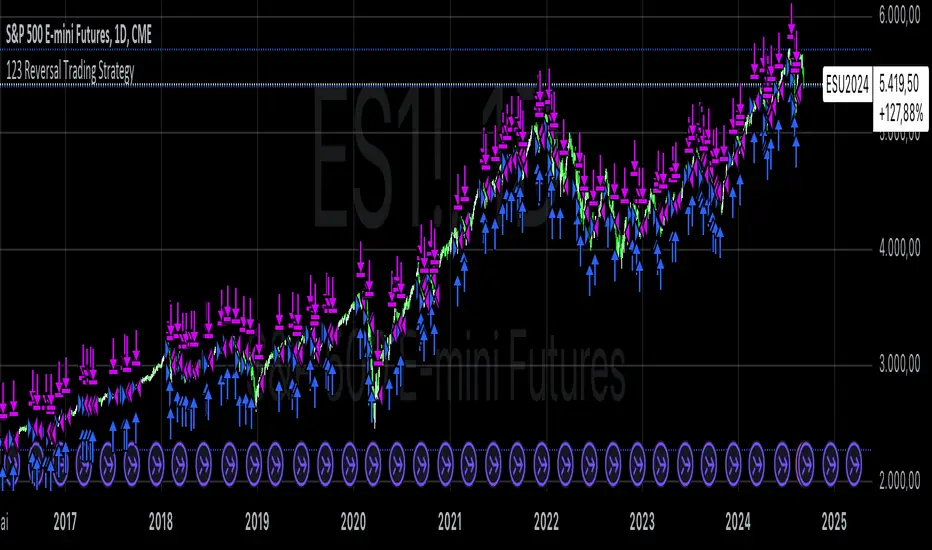
123 Reversal Trading StrategyThe 123 Reversal Trading Strategy is a technical analysis approach that seeks to identify potential reversal points in the market by analyzing price patterns. This Pine Script™ code implements a version of this strategy, and here’s a detailed description:
Strategy Overview
Objective: The strategy aims to identify bullish reversal patterns using the 123 pattern and manage trades with a specified holding period and a 20-day moving average as an additional exit condition.
Key Components:
Holding Period: The number of days to hold a trade is adjustable, with the default set to 7 days.
Moving Average: A 200-day simple moving average (SMA) is used to determine an exitcondition based on the price crossing this average.
Pattern Recognition:
Condition 1: The low of the current day must be lower than the low of the previous day.
Condition 2: The low of the previous day must be lower than the low from three days ago.
Condition 3: The low two days ago must be lower than the low from four days ago.
Condition 4: The high two days ago must be lower than the high three days ago.
Entry Condition: All four conditions must be met for a buy signal.
Exit Condition: The position is closed either after the specified holding period or when the price reaches or exceeds the 200-day moving average.
Relevant Literature
Graham, B., & Dodd, D. L. (1934). Security Analysis. This classic work introduces fundamental analysis and technical analysis principles which are foundational to understanding patterns like the 123 reversal.
Murphy, J. J. (1999). Technical Analysis of the Financial Markets. Murphy provides an extensive overview of technical indicators and chart patterns, including reversal patterns similar to the 123 pattern.
Elder, A. (1993). Trading for a Living. Elder discusses various trading strategies and technical analysis techniques that complement the understanding of reversal patterns and their application in trading.
Risks and Considerations
Pattern Reliability: The 123 reversal pattern, like many technical patterns, is not foolproof. It can generate false signals, especially in volatile or trending markets. This may lead to losses if the pattern does not play out as expected.
Market Conditions: The strategy may perform differently under various market conditions. In strongly trending markets, reversal patterns might not be as reliable.
Lagging Indicators: The use of the 200-day moving average as an exit condition can be considered a lagging indicator. This means it reacts to price movements with a delay, which might result in late exits and missed profit opportunities.
Holding Period: The fixed holding period of 7 days may not be optimal for all market conditions or stocks. It is essential to adjust the holding period based on market dynamics and individual stock behavior.
Overfitting: The parameters used (like the number of days and moving average length) are set based on historical data. Overfitting can occur if these parameters are tailored too specifically to past data, leading to reduced performance in future scenarios.
Conclusion
The 123 Reversal Trading Strategy is designed to identify potential market reversals using specific conditions related to price lows and highs. While it offers a structured approach to trading, it is essential to be aware of its limitations and potential risks. As with any trading strategy, it should be tested thoroughly in various market conditions and adjusted according to the individual trading style and risk tolerance.
Median Supertrend | viResearchMedian Supertrend | viResearch
Conceptual Foundation and Innovation
The "Median Supertrend" indicator, developed by viResearch, offers a unique approach to identifying trends by combining a median-based smoothing mechanism with a modified Supertrend calculation. Unlike the traditional Supertrend, which relies solely on price data, this version calculates a median percentile of the closing price over a specified length, resulting in a more accurate representation of underlying trends.
Technical Composition and Calculation
The "Median Supertrend" enhances the conventional Supertrend formula by introducing improvements to minimize lag and improve responsiveness to market volatility.
Median Smoothing:
The script uses the 50th percentile of the closing price over a user-defined period to provide a smoother representation of price movements, reducing the influence of short-term price spikes or dips for more stable trend analysis.
Supertrend Calculation:
The indicator applies the Average True Range (ATR) to determine the upper and lower trend bands, which are then shifted above or below the smoothed price (median) by a multiple of the ATR, customizable by users to adjust sensitivity.
Trend Logic:
The script uses the upper and lower bands to detect whether the price is trending upwards or downwards and introduces persistence logic to prevent excessive shifting of the bands during consolidating market phases. This mechanism ensures that once the trend changes, the bands adjust smoothly rather than oscillating with each price movement.
Directional Analysis:
Based on price action relative to the trend bands, a directional variable (d) is computed to track whether the price crosses above or below these bands, signaling uptrends or downtrends. The script also includes events to detect transitions from bullish to bearish trends and vice versa, with the option to set alerts for timely decision-making.
Features and User Inputs
The "Median Supertrend" offers several customizable parameters to suit different trading styles:
Supertrend Length: Defines the period used to calculate the smoothing, allowing users to adjust the indicator's sensitivity based on market conditions.
Multiplier: Controls how far the trend bands are placed from the median price. Traders can increase the multiplier for less frequent trend changes or decrease it for more sensitive detection.
Median Length: Governs the length over which the median price is calculated, providing further customization to balance responsiveness and stability.
Practical Applications
The "Median Supertrend" is particularly useful in markets with rapid trend reversals and high volatility, offering an effective way to filter out noise and capture significant trend changes promptly.
Key Uses:
Trend Following: The indicator's primary function is to identify prevailing trends and guide traders in aligning with the market's direction, with its smoothing mechanism helping to ensure reliable trend signals.
Trend Reversal Detection: By tracking crossovers and crossunders relative to the Supertrend bands, the indicator helps traders detect potential reversals early, making it valuable in fast-moving markets.
Strategic Positioning: With adjustable sensitivity and real-time alerts, the "Median Supertrend" can adapt to a variety of trading strategies, from scalping to longer-term trend-following.
Advantages and Strategic Value
The "Median Supertrend" offers advantages over traditional trend indicators:
Reduced Noise: Median smoothing reduces noise from extreme price movements, ensuring more reliable trend signals.
Customizability: With adjustable length and multiplier settings, the indicator allows traders to fine-tune its sensitivity for different market conditions.
Responsiveness: Median-based smoothing, coupled with the ATR, provides a more responsive and adaptive measure of trend direction, particularly valuable in volatile markets.
Summary and Usage Tips
The "Median Supertrend" indicator is a potent tool for capturing market trends with increased precision and reduced lag. It combines the best features of traditional Supertrend indicators with the added stability of median-based smoothing, making it highly effective in volatile markets. Traders are encouraged to experiment with the length and multiplier settings to optimize the indicator for their specific trading strategies, while alerts and visual cues further enhance its utility.
Please keep in mind the following text: Backtests are based on past results and are not indicative of future performance.
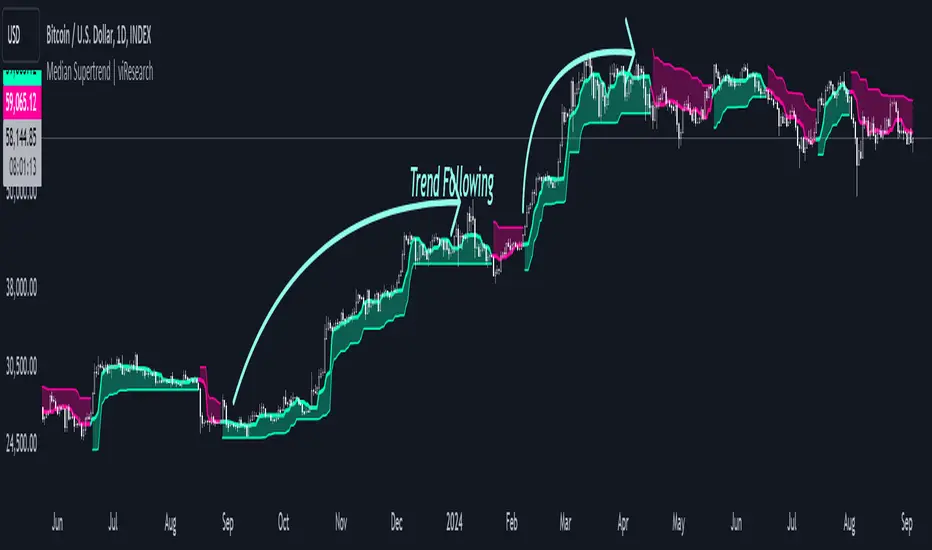
MTF - Quantum Fibonacci ATR/ADR Levels & Targets**Indicator Overview:**
The *Quantum Fibonacci Wave Mechanics* indicator is a powerful tool designed to help traders identify dynamic support, resistance, and target levels based on the Average True Range (ATR) and Average Daily Range (ADR). This indicator leverages Fibonacci ratios to calculate precise entry and target levels, providing a comprehensive approach to market analysis.
**Key Features:**
- **Dynamic ATR/ADR Levels:** Automatically calculate and plot ATR and ADR-based support and resistance levels, offering insight into market volatility and potential reversal zones.
- **Fibonacci-Based Entry Levels:** Calculate Fibonacci entry levels using the 0.618 ratio, helping traders find optimal points to enter trades.
- **Customizable Target Levels:** Set up to three target levels based on Fibonacci ratios (1.618, 2.618, 3.618), allowing for precise trade management.
- **Stop Loss Lines:** Plot stop loss lines derived from ATR and ADR calculations, ensuring risk is managed effectively.
- **EMA Integration:** Optionally plot an Exponential Moving Average (EMA) line for additional trend confirmation.
- **Customizable Color Settings:** Adjust the colors of all levels and signals to fit your charting preferences.
- **Bar Coloring Based on Signals:** Automatically color bars based on the latest buy or sell signal for easier visual identification.
- **Label Display for Key Levels:** Display labels on the chart for important levels such as entry points, target levels, and stop loss lines.
**How Users Can Benefit:**
This indicator is ideal for traders who want to blend the precision of Fibonacci analysis with the robustness of ATR/ADR calculations. Whether you're a day trader looking for short-term entry points or a swing trader seeking reliable support and resistance levels, this indicator offers a versatile toolset for enhancing your trading decisions.
**Customization Instructions:**
The *Quantum Fibonacci Wave Mechanics* indicator is highly customizable to suit different trading styles and preferences. Below is a guide on how to adjust the settings:
1. **General Settings:**
- **ADR Length:** Define the lookback period for calculating the ADR.
- **EMA Length:** Set the period for the Exponential Moving Average (EMA).
- **Timeframe:** Select the timeframe for which the levels will be calculated (e.g., daily, weekly).
2. **Display Settings:**
- **Show ATR Levels:** Toggle the display of ATR-based support and resistance levels.
- **Show ADR Levels:** Toggle the display of ADR-based support and resistance levels.
- **Show EMA Line:** Toggle the display of the EMA line.
- **Show Stop Loss Lines:** Display stop loss levels derived from ATR and ADR.
- **Show Middle Level Line:** Show the middle level between buy and sell stop loss lines.
- **Show Fibonacci Entry Levels:** Enable the display of Fibonacci-based entry levels.
- **Show Entry Signals:** Plot buy and sell signals based on the crossover of the entry levels.
- **Show Target Levels:** Display up to three target levels for both buy and sell signals.
- **Color Bars Based on Last Signal:** Automatically color bars according to the last signal (buy or sell).
3. **Fibonacci Settings:**
- **Entry Ratio (Fibonacci):** Adjust the Fibonacci ratio used for calculating entry levels (default is 0.618).
- **Target Ratios (Fibonacci):** Set the Fibonacci ratios for up to three target levels (default ratios are 1.618, 2.618, and 3.618).
4. **Color Settings:**
- **Support Levels:** Customize the color of the support lines.
- **Resistance Levels:** Customize the color of the resistance lines.
- **Stop Loss Levels:** Set the color for stop loss lines (default is red).
- **Buy Target Levels:** Set the color for buy target levels (default is white).
- **Sell Target Levels:** Set the color for sell target levels (default is yellow).
5. **Label Display Settings:**
- **Show Labels for The Levels:** Toggle the display of labels for the various levels on the chart.
**Usage Tips:**
- **Combining with Other Indicators:** Use this indicator in conjunction with other technical indicators such as RSI, MACD, or Bollinger Bands to confirm signals.
- **Adjusting to Different Timeframes:** Customize the `timeframeInput` to analyze different market conditions, from intraday to long-term trading.
- **Risk Management:** Utilize the stop loss levels to manage risk effectively, ensuring your trades are protected against adverse market movements.
**Disclaimer:**
*This indicator is provided for educational purposes only and should not be considered financial advice. Trading in financial markets involves risk, and past performance does not guarantee future results. Always conduct your own research and consult with a licensed financial advisor before making any trading decisions. The creator of this indicator is not responsible for any financial losses that may occur from using this tool.*

Double CCI Confirmed Hull Moving Average Reversal StrategyOverview
The Double CCI Confirmed Hull Moving Average Strategy utilizes hull moving average (HMA) in conjunction with two commodity channel index (CCI) indicators: the slow and fast to increase the probability of entering when the short and mid-term uptrend confirmed. The main idea is to wait until the price breaks the HMA while both CCI are showing that the uptrend has likely been already started. Moreover, strategy uses exponential moving average (EMA) to trail the price when it reaches the specific level. The strategy opens only long trades.
Unique Features
Dynamic stop-loss system: Instead of fixed stop-loss level strategy utilizes average true range (ATR) multiplied by user given number subtracted from the position entry price as a dynamic stop loss level.
Configurable Trading Periods: Users can tailor the strategy to specific market windows, adapting to different market conditions.
Double trade setup confirmation: Strategy utilizes two different period CCI indicators to confirm the breakouts of HMA.
Trailing take profit level: After reaching the trailing profit activation level scrip activate the trailing of long trade using EMA. More information in methodology.
Methodology
The strategy opens long trade when the following price met the conditions:
Short-term period CCI indicator shall be above 0.
Long-term period CCI indicator shall be above 0.
Price shall cross the HMA and candle close above it with the same candle
When long trade is executed, strategy set the stop-loss level at the price ATR multiplied by user-given value below the entry price. This level is recalculated on every next candle close, adjusting to the current market volatility.
At the same time strategy set up the trailing stop validation level. When the price crosses the level equals entry price plus ATR multiplied by user-given value script starts to trail the price with EMA. If price closes below EMA long trade is closed. When the trailing starts, script prints the label “Trailing Activated”.
Strategy settings
In the inputs window user can setup the following strategy settings:
ATR Stop Loss (by default = 1.75)
ATR Trailing Profit Activation Level (by default = 2.25)
CCI Fast Length (by default = 25, used for calculation short term period CCI
CCI Slow Length (by default = 50, used for calculation long term period CCI)
Hull MA Length (by default = 34, period of HMA, which shall be broken to open trade)
Trailing EMA Length (by default = 20)
User can choose the optimal parameters during backtesting on certain price chart.
Justification of Methodology
Before understanding why this particular combination of indicator has been chosen let's briefly explain what is CCI and HMA.
The Commodity Channel Index (CCI) is a momentum-based technical indicator used in trading to measure a security's price relative to its average price over a given period. Developed by Donald Lambert in 1980, the CCI is primarily used to identify cyclical trends in a security, helping traders to spot potential buying or selling opportunities.
The CCI formula is:
CCI = (Typical Price − SMA) / (0.015 × Mean Deviation)
Typical Price (TP): This is calculated as the average of the high, low, and closing prices for the period.
Simple Moving Average (SMA): This is the average of the Typical Prices over a specific number of periods.
Mean Deviation: This is the average of the absolute differences between the Typical Price and the SMA.
The result is a value that typically fluctuates between +100 and -100, though it is not bounded and can go higher or lower depending on the price movement.
The Hull Moving Average (HMA) is a type of moving average that was developed by Alan Hull to improve upon the traditional moving averages by reducing lag while maintaining smoothness. The goal of the HMA is to create an indicator that is both quick to respond to price changes and less prone to whipsaws (false signals).
How the Hull Moving Average is Calculated?
The Hull Moving Average is calculated using the following steps:
Weighted Moving Average (WMA): The HMA starts by calculating the Weighted Moving Average (WMA) of the price data over a period square root of n (sqrt(n))
Speed Adjustment: A WMA is then calculated for half of the period n/2, and this is multiplied by 2 to give more weight to recent prices.
Lag Reduction: The WMA of the full period n is subtracted from the doubled n/2 WMA.
Final Smoothing: To smooth the result and reduce noise, a WMA is calculated for the square root of the period n.
The formula can be represented as:
HMA(n) = WMA(WMA(n/2) × 2 − WMA(n), sqrt(n))
The Weighted Moving Average (WMA) is a type of moving average that gives more weight to recent data points, making it more responsive to recent price changes than a Simple Moving Average (SMA). In a WMA, each data point within the selected period is multiplied by a weight, with the most recent data receiving the highest weight. The sum of these weighted values is then divided by the sum of the weights to produce the WMA.
This strategy leverages HMA of user given period as a critical level which shall be broken to say that probability of trend change to the upside increased. HMA reacts faster than EMA or SMA to the price change, that’s why it increases chances to enter new trade earlier. Long-term period CCI helps to have an approximation of mid-term trend. If it’s above 0 the probability of uptrend increases. Short-period CCI allows to have an approximation of short-term trend reversal from down to uptrend. This approach increases chances to have a long trade setup in the direction of mid-term trend when the short-term trend starts to reverse.
ATR is used to adjust the strategy risk management to the current market volatility. If volatility is low, we don’t need the large stop loss to understand the there is a high probability that we made a mistake opening the trade. User can setup the settings ATR Stop Loss and ATR Trailing Profit Activation Level to realize his own risk to reward preferences, but the unique feature of a strategy is that after reaching trailing profit activation level strategy is trying to follow the trend until it is likely to be finished instead of using fixed risk management settings. It allows sometimes to be involved in the large movements. It’s also important to make a note, that script uses HMA to enter the trade, but for trailing it leverages EMA. It’s used because EMA has no such fast reaction to price move which increases probability not to be stopped out from any significant uptrend move.
Backtest Results
Operating window: Date range of backtests is 2022.07.01 - 2024.08.01. It is chosen to let the strategy to close all opened positions.
Commission and Slippage: Includes a standard Binance commission of 0.1% and accounts for possible slippage over 5 ticks.
Initial capital: 10000 USDT
Percent of capital used in every trade: 100%
Maximum Single Position Loss: -4.67%
Maximum Single Profit: +19.66%
Net Profit: +14897.94 USDT (+148.98%)
Total Trades: 104 (36.54% win rate)
Profit Factor: 2.312
Maximum Accumulated Loss: 1302.66 USDT (-9.58%)
Average Profit per Trade: 143.25 USDT (+0.96%)
Average Trade Duration: 34 hours
These results are obtained with realistic parameters representing trading conditions observed at major exchanges such as Binance and with realistic trading portfolio usage parameters.
How to Use
Add the script to favorites for easy access.
Apply to the desired timeframe and chart (optimal performance observed on 2h BTC/USDT).
Configure settings using the dropdown choice list in the built-in menu.
Set up alerts to automate strategy positions through web hook with the text: {{strategy.order.alert_message}}
Disclaimer:
Educational and informational tool reflecting Skyrex commitment to informed trading. Past performance does not guarantee future results. Test strategies in a simulated environment before live implementation

Position Size CalculatorThe Position Size Calculator (PSC) is a comprehensive tool designed to assist traders in managing their trades risk by accurately calculating the optimal position size based on account settings, trade levels, and risk management parameters. This indicator helps traders make informed decisions by providing critical information about potential profit and loss , risk-reward ratio (RRR) , and position size (PS) .
█ Key Features
• Customizable Account Settings: Define your account size , currency , risk tolerance , and commission structure to personalize the calculations.
• Real-Time Trade Levels: Easily input your entry , stop loss , and take profit prices directly on the chart for immediate calculations.
• Visual Indicators: Clearly see your entry, stop loss, and take profit levels with customizable colors and labels.
• Comprehensive Position Information: View detailed information about your position, including potential profit and loss , risk-reward ratio , and position size .
• Currency Conversion: Automatically convert prices to your account currency, making it easy to manage trades in different markets.
• Hide Metrics : Choose which metrics to display to avoid emotional influence on your trading decisions (e.g., hiding PnL).
█ Conclusion
The Position Size Calculator is an essential tool for traders looking to optimize their trading strategies and manage risk effectively . By providing detailed calculations and visual indicators, this tool helps you make informed decisions, improving your overall trading performance.
█ Important
• Ensure that your stop loss and take profit levels are correctly set relative to your entry price to avoid errors.
• The default commission setting considers both entry and exit commissions. Adjust accordingly if only one commission is applicable.
Consider using this tool to manage every trade risk correctly and prevent significant drawdowns.
Hope you like it. Happy trading!
