HTF Power of Three°Power of Three ( PO3 ) is one of the many concepts introduced by the Inner Circle Trader and inspired by Larry Williams.
The PO3 represents a three staged Smart Money campaign: Accumulation , Manipulation , and Distribution .
ICT traders assume that this pattern represents how any candle is built.
“This is applicable to every time measurement, as long as you have a beginning time, the highest value, the lowest value, and an ending in terms of measuring time.”
Consider the development of a Bullish Candle over Time:
– Candle Open (initial value price, prior to dynamic imbalance)
– Accumulation of longs around the opening price
– Manipulation where short liquidity is engineered and long liquidity is neutralized
– Range Expansion (dynamic price imbalance)
– Distribution pairing long exits with pending buy interest
– Candle Close (ending value price, post dynamic imbalance)
The same goes for the development of Bearish Candles, in reverse.
The HTF Power of Three° Indicator allows to monitor the selected Higher Timeframe Candle in real time:
– See where its Open, High, and Low are in the current lower resolution with high precision
– Know when it's supposed to Close by monitoring its own countdown (if below 1D)
– Note its Low to High range to gain a deeper understanding of LTF market profiles
– Study and backtest PO3 in Replay Mode with ease
– Trade PO3 with confidence without needing multiple layouts
This becomes very useful when studying, and especially using, PO3. One can use this as a tool to build narrative, as well as spotting important institutional levels.
You can also monitor more than one HTF PO3 at the time by stacking multiple instances of the indicator:
This works on any timeframe, even the seconds charts!
Note: if you select too high of a PO3 timeframe while on LTF you might receive an error due to TrandingView's data availability on that chart – this can also depend on your TradingView Plan.
Cari skrip untuk "imbalance"

AG FX - INSTITUTIONAL ORDER BLOCKSThis Indicator will help you to find some potential bullish and bearish block.
This indicator, only provides just the the potentials ORDER BLOCKS followed by imbalances.
Forms of using this indicator:
- Plotting the ORDER BLOCKS CANDLES with the color that you prefer
- Plotting the zones given with the ORDER BLOCKS
- Both of them
Indicator Parameters:
- Customizable Candles colors
- Customizable Boxes colors
- Customizable amount of boxes displayed
PD: I just prefer the first one so i can get a clean chart, but it´s up to you.
Inner Circle Trader Institutional ORDER BLOCKS FOREX Theory
Today we are talking about the infamous ORDER BLOCKS by ICT forex trading Strategy. Order Blocks have proven to be a very effective tool in trading as they allow traders to gain high reward with low risk trades.
What is an Order Block? - The Order Block is a specific price range or candle where institutions will be buying or selling against the retail trend/dump money.
Institutions leave order blocks for themselves to trade at a later stage. They will reverse the price to a previous order and then driving the price hard in the direction of the trend (The real institutional trend).
These order blocks we can also call them specific levels of either going Long or Short. If an order block is violated or broken, it now qualifies as a Breaker, meaning Price will retest back to that order block. Sometimes we call it a failed order block.
Types of OBs:
i. Bullish Order Block (BUB)
ii. Bearish Order Block (BEB)
Bullish and Bearish Engulfing Patterns auto detectionThis simple indicator detects automatically most important bullish and bearish candlestick patterns formations. Used to locate potential supply and demand imbalances.
Copyright 2017 Alfonso Moreno www.set-and-forget.com

Navigator Volume Profil FixedLong Term Investing
Day Trading
Navigator Volume Profile Fixed (Fixed + Current Session)
**Navigator Volume Profile Fixed** plots a horizontal volume profile on your chart using a **fixed timeframe anchor** (ex: Daily) and optionally overlays a **live “current” profile** for the active session/period.
It’s designed to help you quickly see where volume is building (acceptance) vs. thinning out (rejection), and to identify the key reference levels traders watch most: **PoC, VAH, and VAL**.
### What it plots
**Fixed Volume Profile (anchored to a timeframe)**
Builds a completed profile each time the selected anchor timeframe rolls over (ex: each new day on a Daily anchor).
**Current Volume Profile (live)**
Continuously updates the developing profile for the current anchor period (optional toggle).
**Point of Control (PoC)**
Highlights the single price level with the highest traded volume.
**Value Area (VAH / VAL)**
Plots the Value Area boundaries using a configurable percentage (default **68%**), and visually differentiates the value area from the rest of the profile.
Key settings
* **Enable Fixed VP**: turn the fixed/anchored profile on/off
* **Timeframe Anchor**: choose the profile reset period (ex: 1D)
* **Show Current Fixed VP**: show/hide the developing (current) profile
* **Number of Rows**: controls profile resolution (price “bins”)
* **Profile Width (%)** and **Bar Thickness**: visual scaling controls
* **PoC + Value Area toggles**: show/hide PoC and VA boundaries
* **Extend PoC Line**: optionally extend the PoC into the future
How to use it (practical)
* Treat **PoC** as the most accepted price for the anchored period.
* Use **VAH/VAL** as reference boundaries for balance vs. imbalance.
* Compare **Fixed** vs **Current** profiles to see whether volume is migrating higher/lower during the session and where price is building acceptance.
**Note:** This script draws using TradingView line objects and is optimized to stay within platform limits while maintaining a clean profile display.

KIMATIX FVG/IFVG/BPRProfessional Fair Value Gap & Imbalance Toolkit
The KIMATIX FVG/IFVG/BPR indicator is a precision tool designed to identify institutional inefficiencies in price:
Fair Value Gaps (FVG), Inverse Fair Value Gaps (IFVG) and Balanced Price Ranges (BPR) — clean, minimal and non-repainting.
This indicator is built for scalpers, intraday traders and smart-money traders who want to trade where price is most likely to react, not where indicators lag.
What this indicator shows
Fair Value Gaps (FVG)
Detects bullish and bearish FVGs using strict 3-candle imbalance logic
Highlights areas where price moved too fast, leaving inefficient structure
Ideal for:
Continuation trades
Pullback entries
Reaction zones after impulse moves
Color-coded
🟢 Bullish FVG
🔴 Bearish FVG
Inverse Fair Value Gaps (IFVG)
Automatically detects when an FVG is invalidated
Marks the same zone as an Inverse FVG
Extremely useful for:
Failed structure setups
Reversal trades
Stop-hunt & liquidity traps
Color-coded
🟡 IFVG (invalidation zone)
Balanced Price Range (BPR)
Detects overlapping bullish & bearish FVGs
Highlights price areas where buying and selling pressure are balanced
These zones often act as:
High-probability reaction areas
Compression zones before expansion
Premium intraday decision levels
Color-coded
🔵 BPR (balanced price range)
Smart, Clean & Non-Repainting
Non-repainting
Only the last 3 active zones are shown → no clutter
Boxes extend forward with a manual cap (user-controlled)
Designed for 1m – 15m execution, works on all markets
Futures, Crypto, FX, Indices, Stocks
How professionals use it
Combine FVGs with:
VWAP
Session highs/lows
Volume Profile (POC / VAH / VAL)
Market structure (BOS / displacement)
Use IFVGs to spot failed smart-money narratives
Use BPRs as decision zones, not blind entries
This indicator does not give buy/sell signals.
It shows you where trades make sense — execution is up to you.
Best use cases
Scalping (1m–3m)
Intraday trading (5m–15m)
Smart-money concepts
Liquidity-based trading
News reactions & stop runs
Learn how to trade it properly
This indicator is part of the KIMATIX Trading Framework.
More education, live examples & full system:
kimatixtrading.com

STOXWAY Financial Chaos Index Opt.Beta STOXWAY – Financial Chaos Index(Opt)Beta
A Complete Market Chaos & Trend Stability Scanner for Option Traders**
STOXWAY – Financial Chaos Index(Opt)Beta is a uniquely engineered indicator designed for traders who want to understand when the market is stable, when it is turning chaotic, and when option trades become high-risk or high-probability.
Unlike traditional volatility indicators that rely only on ATR or VIX-style readings, FCI combines four independent market forces into a single score:
1️⃣ Volatility Pulse (ATR Stress)
Measures sudden bursts in price movement that usually shake option buyers & sellers.
2️⃣ Trend Gap Displacement
Checks how fast EMAs are separating, revealing trend strength or trend exhaustion.
3️⃣ RSI Momentum Shift
Quantifies how far momentum has moved from equilibrium.
4️⃣ Liquidity Stress (Range vs Average Range)
Identifies if volatility is coming from liquidity expansion or from imbalance.
These four components are blended into a 0–100 Financial Chaos Index (FCI) that updates every candle.
🎯 Why This Indicator Is Unique
STOXWAY – Financial Chaos Index(Opt)Beta is not a duplication of any existing TradingView script.
It uses:
✔ Custom volatility pulse formula
✔ Custom EMA-gap trend displacement model
✔ Custom momentum scoring
✔ Custom liquidity stress algorithm
✔ Custom chaos zones (40 / 60 / 75 / 90)
✔ A smooth background that changes with chaos intensity
✔ A built-in Safe/Aggressive entry logic
No other indicator on TradingView uses this exact method or combination, which makes its behaviour truly original.
🚀 What It Helps Traders See Instantly
🟢 Low Chaos (0–40)
Market is stable → Option trades behave normally → Good for trend continuation.
🟡 Moderate Chaos (40–60)
Market is heating up → Avoid over-leveraging.
🟠 High Chaos (60–75)
Trend may reverse or accelerate suddenly → Use caution.
🔴 Extreme Chaos (75–90+)
Highly unstable conditions → Great for scalpers but dangerous for positional traders.
The background color shifts smoothly across the chart, making chaos levels immediately visible without reading numbers.
📘 Integrated Safe & Aggressive Entry Model
The indicator includes optional signal logic:
SAFE ENTRIES (Low Chaos Phase)
✔ FCI < 60
✔ RSI > 65 for buys
✔ SMA crossover confirmation
These highlight cleaner, high-probability moves.
AGGRESSIVE ENTRIES (High Chaos Phase)
✔ FCI > 60
✔ Suitable only for quick scalps
✔ Useful when momentum bursts occur in options
🧠 Why Traders Must Use This
✔ Helps avoid trades during dangerous volatility spikes
✔ Helps identify when market structure becomes fragile
✔ Helps options traders choose between “safe” and “aggressive” setups
✔ Helps avoid SL hits caused by sudden chaos
✔ Helps time exits when instability rises
✔ Helps find trend continuation phases with low noise
Most traders lose because they cannot see hidden instability.
This indicator exposes that instability clearly, candle by candle.
⚠️ Disclaimer
This tool is designed for market analysis and educational purposes.
It does not guarantee accuracy, profits, or future performance.
All trades should be confirmed with risk management and personal judgment.

The Reaper WhistleThe Reaper Whistle is a high-precision RSI momentum system engineered for scalpers and intraday traders.
It combines a customizable RSI with a dynamic moving average signal line to detect micro-shifts in momentum, early reversals, and continuation setups with extreme speed.
The indicator includes five key zones used by liquidity and SMC-style traders:
• Strong Sell (90) – Extreme momentum exhaustion
• Sell (80) – Overextension area
• TP Zone (50) – Momentum balance / decision point
• Buy (20) – Discount area
• Strong Buy (10) – Extreme sell-side exhaustion
By tracking how RSI interacts with its MA inside these zones, traders can identify high-probability sniper entries on the 1m, 3m, and 5m charts.
⸻
⭐ HOW IT WORKS (Quick Breakdown)
• RSI Period: defines momentum sensitivity
• MA Period: smooths RSI noise and clarifies direction shifts
• MA Type: SMA, EMA, or WMA for different reaction speeds
• Crossovers: show momentum flips or trend continuation
• Zones: filter out weak signals and highlight only premium setups
⸻
⚡ STRATEGY EXAMPLES
1️⃣ Liquidity Sweep Reversal (Most Powerful Setup)
Use case: Gold, NAS100, NQ, US30
1. Price sweeps a previous high/low
2. RSI spikes into Strong Sell (90) or Strong Buy (10)
3. RSI crosses its MA back inside the zone
4. Enter on candle confirmation
5. TP at the next imbalance, VWAP, or volume cluster
This setup catches V-shaped reversals and trap plays.
⸻
2️⃣ Trend Continuation Pullback
Use case: Trending markets
1. Identify trend direction (EMA 200, structure, etc.)
2. Wait for RSI to pull back to the TP (50) zone
3. Watch for RSI crossing its MA in trend direction
4. Enter with trend
5. TP at previous swing high/low
This setup filters out weak pullbacks and catches clean momentum continuation.
⸻
3️⃣ Breakout Confirmation
Use case: Range breakouts, opening range breaks
1. Price breaks a consolidation high/low
2. RSI holds above Sell (80) in uptrend or below Buy (20) in downtrend
3. RSI crosses its MA with momentum
4. Enter breakout
5. TP at HTF zone or liquidity target
Perfect for fast markets like NAS100 and Bitcoin.
⸻
4️⃣ Divergence + Whistle Flip
Use case: Slow markets or pre-session moves
1. Look for bullish or bearish RSI divergence
2. Wait for RSI to cross the MA in direction of divergence
3. Enter once momentum confirms
4. TP at imbalance, FVG, or mid-range
This increases divergence accuracy dramatically.
⸻
🔥 RECOMMENDED SETTINGS
• Scalping (1m–3m):
• RSI: 5
• MA: 3
• Type: EMA
• Intraday 5m–15m:
• RSI: 7–14
• MA: 5
• Type: SMA
⸻
⭐ WHO IT’S BUILT FOR
• Liquidity + SMC traders
• Scalpers who need fast confirmation
• Traders who want clean, simple entries
• Beginners who want visual guidance
• Professionals who want momentum precision
The Reaper Whistle is intentionally designed for speed, clarity, and reliability — no clutter, no lag, just pure momentum read.
— Created by TheTrendSniper (ChartReaper)
“When the market whispers… the Reaper whistles.”

LHAMA MTF Structure & Fibs [LTS]Overview
LHAMA MTF Structure & Fibs is a multi-purpose market structure toolkit that combines current-timeframe structure, higher-timeframe structure, Imbalance/FVG-based order blocks, and automatic Fibonacci retracements into a single chart overlay.
Current-Timeframe Structure
The indicator first maps current-timeframe market structure using swing highs and lows based on a user-defined pivot length (“Time-Horizon”):
Labels swing points as HH , HL , LH , and LL .
Draws BOS (Break of Structure) when price breaks beyond a prior swing.
Optionally identifies CHoCH (Change of Character) when a break occurs against the previous direction.
Lets you choose whether BOS/CHoCH confirmation uses closes or wicks .
Provides options to show/hide swing labels, choose line style (solid/dashed/dotted), and configure bullish/bearish colors.
Higher-Timeframe (HTF) Structure
On top of the local structure, the script builds a higher-timeframe structure map and projects it onto your active chart:
Aggregates price into HTF “bars” (e.g., 4h structure on a 5m chart).
Detects HTF pivots with their own pivot length setting.
Draws HTF BOS/CHoCH lines and labels back on the lower timeframe.
Lets you choose wick vs close confirmation for HTF breaks.
Optional “ pending ” HTF levels: lines extended from the latest HTF swing highs/lows that remain “waiting” until price breaks them.
This is designed to make it easier to see how intraday price is moving relative to the dominant higher-timeframe trend.
Order Blocks (Imbalance/FVG-Based)
The indicator detects simple bullish and bearish order blocks based on fair value gaps and prior sweeps:
Identifies bullish/bearish FVGs together with a sweep of a previous low/high.
Creates colored boxes anchored to an “anchor” candle and extends them forward.
Marks boxes as “broken” when price trades inside or through the opposite side.
Broken blocks can have reduced emphasis (more transparent, dashed border) and can optionally be deleted.
Show Nearest Only mode highlights only the closest active bullish and bearish blocks to reduce chart clutter.
Periodic cleanup removes very old boxes to maintain chart responsiveness.
Automatic Fibonacci Levels
The script can draw up to five customizable Fibonacci retracement levels using the HTF structure logic:
Measures swings using HTF pivots and extremes.
Historical mode : measures between two confirmed pivots in one direction.
Live mode : starts from the last confirmed pivot and tracks the evolving extreme; if price reverses through that pivot, measurement can flip to track the new leg.
Each Fib level has its own on/off toggle, ratio value, and color.
Draws a main swing line plus retracement lines projected slightly into the future.
Key Inputs & Customization
Market Structure (Current TF)
Pivot length (“Time-Horizon”).
BOS confirmation: candle close or wicks.
BOS/CHoCH line style and width.
Swing labels on/off and global label size.
Bullish/bearish colors.
Market Structure (HTF)
HTF timeframe selection.
Separate pivot length for HTF swings.
Close vs wick confirmation for HTF breaks.
HTF swing labels and CHoCH labels on/off.
Pending HTF levels: style, color, and visibility.
Order Block Settings
Bullish/bearish box colors and border width.
Maximum number of boxes to display.
Optional deletion of broken blocks.
“Show Nearest Only” filter to highlight the closest active zones.
Max bars to backscan for the anchor candle.
Cleanup frequency for removing very old boxes.
Fibonacci Settings
Show/hide auto Fibs.
Historical vs Live tracking mode.
Five user-defined ratios with individual toggles and colors.

Trading Playbook Panel (SMC + EW + Sniper)🔥 What This Script Does
The indicator creates a visual floating panel containing:
1. HTF Bias Framework (H4 → H1 → M15)
Guides you through determining trend, liquidity direction, imbalance zones, and institutional order flow.
2. Valid Setup Models
Covers both:
Continuation setups (displacement → OTE → FVG entry)
Reversal setups (liquidity sweep → CHoCH → retest)
3. 5-Minute Sniper Entry Checklist
Ensures high-precision entries with:
Liquidity sweep
CHoCH
Displacement
FVG formation
Retest entry
Strict invalidation rules
This is the exact logic used in prop-firm and institutional trading models.
4. Stop-Loss & Invalidation Rules
Built with institutional logic:
SL beyond liquidity sweep
SL beyond invalidation swing
Works for both BUY and SELL setups.
5. Multi-Stage Take Profit Mapping
Including:
Internal liquidity
Equal highs/lows
Imbalance
Opposite OB
HTF draw
Designed for partials + runners.
6. Risk-Management System
A complete discipline structure:
0.5–2% risk per setup
Max daily loss
Max trades per day
Stop-after-loss rule
No chasing / no mid-range entries
7. Pre-Trade Checklist
A professional assessment framework to verify trade quality.
8. Trading Psychology Principles
Reinforces mindset, discipline, and patience.
⭐ Who This Script Is For
This tool is ideal for:
SMC traders
ICT style traders
Elliott Wave traders
Scalpers & intraday traders
Prop-firm challengers
Anyone wanting to follow a repeatable, rules-based system
It keeps you consistent, structured, and focused on the highest-probability setups.
🧠 Why This Script Works
Most traders lose because they:
Enter impulsively
Skip rules
Don’t analyze multi-timeframe structure
Enter without liquidity confirmation
Use random entry zones
This script eliminates that.
It forces a clear, step-by-step process:
1️⃣ Top-down bias
2️⃣ Liquidity location
3️⃣ Sweep → CHoCH → Displacement
4️⃣ Refined 5M entry
5️⃣ Strict SL & TP rules
It removes emotion and replaces it with pure process.
⚙️ Customizable
Move the panel anywhere on the chart
Change panel colors
Change text colors
Perfect for dark or light mode
🎯 Summary
This is not a trading signal indicator.
This is your rulebook, your discipline engine, and your playbook — right on your chart.
It keeps you aligned with the highest-probability setups used by advanced SMC and EW traders.
Use it before every trade.
Trade like a professional — every day.

BEGGALKey Features and Concepts
1. Order Block (OB) Identification (Pivots)
The core of the indicator relies on Pivot Point detection (ta.pivothigh/ta.pivotlow) over a specified Pivot Length (e.g., 5 bars).
Bullish OB (Demand Zone): Identified at a valid low pivot point, with the zone boundary defined between the pivot low (low ) and the open/close average (hl2 ) of the pivot bar.
Bearish OB (Supply Zone): Identified at a valid high pivot point, with the zone boundary defined between the pivot high (high ) and the open/close average (hl2 ) of the pivot bar.
2. Advanced Strength Filters (Momentum & Volume)
The indicator applies strict filters to ensure only powerful, high-quality zones are drawn:
Momentum (ATR) Filter: Checks if the candle that created the OB has a range (high - low) greater than the Average True Range (ATR) multiplied by the Momentum Threshold. This filters for impulsive, strong candles.
Volume Imbalance Filter (SMC Confirmation): If enabled, it requires the volume of the OB-creating candle to be higher than the volume of candles surrounding it (checked over the Volume Imbalance Lookback period). This confirms institutional activity in the zone creation.
Structure Break Filter (BOS/CHoCH): If enabled, the OB is only considered valid if it is created after a Break of Structure (BOS) or Change of Character (CHoCH). This validates the zone according to market structure rules (e.g., a Bearish OB must be preceded by a break of a significant swing low).
3. Dynamic Zone Management
Zone Narrowing (enable_narrowing): This feature dynamically adjusts the boundaries of an Order Block after it has been touched. If a candle wick tests the zone without fully mitigating it, the zone boundary is moved inward to the point where the test occurred, narrowing the zone and making it a more precise entry point (Dynamic OB concept).
Mitigation/Removal: Once price action (either the candle's wick or close, based on the Mitigation Method setting) breaches the outermost boundary of the zone, the Order Block is considered mitigated (broken) and is removed from the chart to clear clutter.
4. Risk Categorization
The indicator tracks and draws up to a user-defined number of OBs (Bullish/Bearish OB Count). These are categorized by their index:
Index 0 (Closest): Categorized as High Risk Zone.
Index 1: Categorized as Medium Risk Zone.
Index 2 and beyond: Categorized as Low Risk Zone. The user can toggle the visibility for each of these risk categories.
5. Integrated Risk/Reward (RR) Setup
For the High Risk Zone (Index 0), once the zone is touched, the indicator displays a complete trade setup:
Entry: Assumed at the Average Price of the Order Block.
Stop Loss (SL): Placed at the protective boundary of the OB (the top for a Sell Zone, the bottom for a Buy Zone). The risk area is colored with the RR Risk Zone Background.
Take Profit (TP): Calculated based on the user-defined Risk/Reward Ratio (e.g., 2.0 for 1:2 RR). The reward area is colored with the RR Reward Zone Background.
The RR boxes and price labels (TP/SL) are drawn with a configurable RR Box Width (Bars).
6. Alerts
The indicator includes built-in Pine Script alerts that trigger when the price enters an unmitigated zone, notifying the user of the Risk Level (High, Medium, or Low), the zone's boundaries, and the price.

RSI Volume Order BlocksOverview
This script builds structured order blocks using a combination of RSI pivots, price structure, and optional volume/ATR-based scaling.
It is designed to create a clean, explainable map of support/resistance levels that respond only to meaningful momentum shifts rather than small, insignificant oscillations.
Core Idea
Traditional order blocks rely solely on price highs/lows, which often produces excessive or noisy zones.
This model instead:
Detects pivot highs/lows on the RSI (controlled by RSI Length and Sensitivity).
Generates bearish order blocks from RSI pivot highs and bullish order blocks from RSI pivot lows.
Allows the user to choose whether blocks are based on candle bodies or the full candle range.
Optionally filters blocks so that:
bearish OBs form only when RSI is above an overbought threshold,
bullish OBs form only when RSI is below an oversold threshold.
The resulting zones represent areas of momentum exhaustion and imbalance rather than random price fluctuations.
Volume–ATR Height Mode
The script offers two approaches for block height:
1. Price Candle Mode
Block height equals either:
the candle body, or
the full high–low range of the pivot bar.
2. Volume–ATR Mode
Block height is adaptively scaled using:
ATR (ATR Length for Height),
relative volume compared to a baseline (Volume Baseline Length),
a global height multiplier.
This makes zones thicker when the pivot candle had both higher volatility and above-average volume, and thinner when market participation was lower.
Lifespan and Mitigation
Each block extends forward in time until price mitigates it.
Mitigation Method: Close
Bearish OB is removed when a candle closes above its top.
Bullish OB is removed when a candle closes below its bottom.
Mitigation Method: Wick
Bearish OB is removed when a wick breaks above the top.
Bullish OB is removed when a wick breaks below the bottom.
Additional controls:
Maximum number of stored OBs per side.
Maximum number of displayed OBs per side.
Overlap filtering to avoid redundant zone stacking.
Main Inputs (Summary)
RSI Length – standard RSI lookback.
RSI OB Sensitivity – pivot aggressiveness (higher = fewer, stronger pivots).
Overbought/Oversold Levels – thresholds for optional filters.
RSI Filter –
bearish OB only if RSI > overbought,
bullish OB only if RSI < oversold.
Order Block Style – candle body or full range.
Mitigation Method – close-based or wick-based.
OB Height Mode – price candle or volume–ATR scaling.
Volume Baseline Length, ATR Length for Height, Height Scale – parameters for adaptive height mode.
Show Bullish / Bearish OBs – toggles for each side.
Color settings for zone visualization.
How to Use
Typical workflows include:
Using higher-timeframe OB zones as structural support/resistance, then refining entries on lower timeframes.
Watching for price reactions inside thick Volume–ATR zones, which may indicate areas of strong participation.
Combining this tool with trend filters, volume metrics, or price action confirmation (e.g., rejection wicks or engulfing patterns).
This script does not generate automated entries/exits; it is a contextual mapping tool designed to highlight where meaningful imbalance likely originated and where reactions may occur.
Notes
Works on any symbol and timeframe available on TradingView.
Most effective when combined with disciplined risk management and a defined trading plan.
Provided for research, chart analysis, and backtesting.
Disclaimer
This tool is for educational and informational purposes only.
It does not constitute financial advice or a recommendation to buy or sell any asset.
Always perform your own analysis and manage risk appropriately.

OXE MTF Support/Resistance+Demand/Supply Zone ArsenalOXE MTF Support/Resistance + Demand/Supply Zones Indicator
Your Complete Multi-Timeframe Zone Arsenal
This professional-grade indicator transforms your chart into a zone confluence powerhouse, simultaneously tracking high-probability price reaction areas across 5 timeframes (Daily, H4, H1, M15, M5) – giving you the institutional edge you need to dominate the markets.
🎯 What It Is
A sophisticated dual-system zone detector that identifies both:
Classic Support/Resistance levels using pivot point detection
Smart Money Demand/Supply zones triggered by Break-of-Structure (BOS) confirmations
Unlike basic S/R indicators, this tool employs institutional methodology – capturing order blocks and imbalance zones where smart money is positioned, not just where price bounced.
⚡ Core Capabilities
Multi-Timeframe Mastery
Track up to 5 timeframes simultaneously without switching charts
Identify confluence zones where multiple timeframe levels align
Customize which timeframes to display for clean, focused analysis
Intelligent Zone Management
Automatic zone validation – tracks when zones flip from resistance→support or supply→demand
Invalid zone filtering – hide broken/invalidated zones to focus only on active opportunities
Configurable zone limits – control the number of zones per timeframe (up to 8 each)
Smart Money Detection
BOS-confirmed zones – only marks demand/supply after break-of-structure confirmation
Precise zone timing – captures the exact candle that created the imbalance
Visual differentiation – dashed borders distinguish demand/supply from traditional S/R
Professional Dashboard
Real-time zone counter – shows active zones per timeframe at a glance
Filter status indicators – tracks which validation filters are enabled
Color-coded timeframe labels – instant visual organization
💰 How This Transforms Your Trading
1. Find High-Probability Entries
Enter trades at zones where multiple timeframes converge – when H4 demand aligns with Daily support, you've found institutional backing.
2. Stay on the Right Side of the Market
The zone flipping system shows you when market structure changes – a supply zone that flips to demand tells you the narrative has shifted bullish.
3. Eliminate Guesswork
No more wondering "is this level still valid?" The automatic invalidation tracking removes subjectivity – zones are either active (tradeable) or broken (ignored).
4. Scale Your Timeframe Analysis
Whether you're scalping M5 or swing trading Daily, access all relevant zones without the mental overhead of switching between charts and manually tracking levels.
5. Trade Like Institutions
By combining pivot-based S/R with BOS-confirmed order blocks, you're seeing where retail AND institutional money is positioned – giving you the complete picture.
🔥 Perfect For
Day traders seeking M15/H1 confluence for precise entries
Scalpers needing M5 zones with higher-timeframe confirmation
Swing traders looking for Daily/H4 zone alignment for position trades
ICT/SMC practitioners combining order blocks with traditional analysis
Any trader who values clean, validated, multi-timeframe zones over cluttered charts

🟡 GOLD 4H HUD v12 — Time-Safe Nuclear Edition🟡 GOLD 4H HUD v12 — Time-Safe Nuclear Edition
A full–scale Smart Money Concepts (SMC) analytics engine designed exclusively for XAUUSD on the 4-Hour timeframe.
This script combines market structure, liquidity, displacement, order blocks, imbalance, volume profile, SMT divergence, and institutional behavior modeling into a single unified HUD.
Built with a time-safe architecture, all structural elements (OB/FVG/Sweep) are stored by timestamp to minimize repainting and preserve event integrity.
📌 Core Features (12 Modules + Full HUD)
1 — Market Structure Engine
Automatically detects:
HH / HL / LH / LL
BOS (Break of Structure)
MSS (Market Structure Shift)
CHOCH (Change of Character)
Real swing pivots & trend state
2 — Sweep Engine (Liquidity Grab Detection)
Identifies institutional liquidity grabs:
Break + reclaim of highs/lows
ATR-filtered invalidation
Displacement-backed sweeps
3 — Time-Safe FVG Engine
Detects Bullish/Bearish Fair Value Gaps
ATR-tolerant FVG logic
Automatic right-extension
Auto-delete when filled or invalid
4 — Time-Safe Order Block Engine
Demand & Supply OB detection
Strength classification (Weak vs Strong)
FVG-overlap confirmation
Timestamp-locked (non-repainting)
5 — Volume Profile Engine (HVN / LVN / POC)
Real-time micro-profile:
High Volume Node (HVN)
Low Volume Node (LVN)
Point of Control (POC)
6 — SMT Engine (Gold vs DXY Divergence)
Smart Money Divergence built-in:
Bullish SMT
Bearish SMT
Directional confirmation with zero lag
7 — Displacement Engine
Measures institutional impulse:
Body-based impulse detection
Multi-leg continuation signals
FVG continuation moves
Generates displacement score
8 — Premium / Discount Model
Auto-classifies price into:
Discount (Buy zone)
Premium (Sell zone)
9 — SMC Trend Engine (Score-Based)
Combines 10+ factors:
Structure
FVG
OB power
Displacement
POC positioning
SMT conditions
Outputs:
BULL / BEAR / RANGE
Full scoring system
10 — Institutional Imbalance Model (IMB Engine)
Combines:
PD zones
Sweep direction
Displacement
SMT
OB strength
CHOCH/MSS
A complete institutional bias filter.
11 — Entry Engine (Signal Fusion Model)
Entry conditions fuse:
Sweep
CHOCH
Displacement
OB strength
FVG alignment
SMT confirmation
Also outputs:
Suggested SL/TP
Entry score
12 — Trendline Engine
Auto-draws:
HL → HL bullish trendlines
LH → LH bearish trendlines
+ Full Nuclear HUD
Displays:
Market structure
Trend direction
SMT / CHOCH / MSS
FVG / OB zones
HVN / LVN / POC
Liquidity strength
Entry model
Liquidity Magnet direction
SL/TP map
A complete institutional dashboard in one place.
⚠ Usage Requirement
This script is designed ONLY for the 4H timeframe.
✨ Summary
GOLD 4H HUD v12 — Time-Safe Nuclear Edition
is not just an indicator.
It is a full institutional-grade SMC analysis system, built specifically for Gold.
If you trade XAUUSD on the 4H timeframe —
this is your complete market intelligence HUD

Institutional Flow Engine (IFE) v1.7 PROInstitutional Flow Engine (IFE) v1.7 PRO — Description
The Institutional Flow Engine (IFE) is an intraday market-flow framework built around liquidity behavior, session timing and structural shifts. Instead of combining public indicators, IFE uses its own unified engine that monitors:
• Accumulation ranges formed during the early session
• Liquidity events when price reaches key levels and rejects
• Structural shifts based on pivot swings
• Momentum confirmation after structural breaks
• Higher-timeframe inefficiency zones (price speed / imbalance areas)
• Session-specific conditions for Core Session and Expansion Session
The objective is to provide a logical roadmap of how price transitions from accumulation → manipulation → expansion during the trading day.
--------------------------------------------------------------------
1. Session Framework
IFE operates using three phases:
1. Asia Accumulation Phase
- Builds the core accumulation range
- Builds an extended reference range used later by the Expansion Session
2. Pre-Core Phase
- Tracks a local intraday range before the main session
- Detects liquidity taps or sweeps of this range
3. Core Session (London)
- Primary signal window where the engine evaluates directional intent
4. Expansion Session (New York)
- Secondary session logic for continuation or reversal during the afternoon
--------------------------------------------------------------------
2. Liquidity Events and Key Levels
IFE identifies multiple types of liquidity behavior:
• Sweeps of the Asia accumulation range
• Sweeps of the extended reference range
• Sweeps of the pre-session intraday range
• Equal-high and equal-low clusters that attract price and later reject
A liquidity event is confirmed when price trades beyond a key level and then returns back into the range.
Users can decide whether:
• Liquidity events are required for signals
• Only the side where liquidity was taken should be traded
• Both sides can be considered
--------------------------------------------------------------------
3. Structural Shifts and Momentum Confirmation
The engine monitors local structure using pivot-based swing points. A directional shift occurs when price closes beyond a previous swing level.
This shift is validated only if accompanied by a momentum candle (a body significantly larger than recent average).
The user can select aggressive, standard, or defensive confirmation modes.
These momentum-based signals are independent from zone-based signals.
--------------------------------------------------------------------
4. Inefficiency / Imbalance Zones (Higher Timeframe Mapping)
IFE maps areas where price moved too quickly (inefficiency zones) on a higher timeframe.
These zones:
• Are detected using multiple gap-based models
• Have a maximum lifetime
• Are invalidated if price fully trades through
• Are visualized with dynamic boxes extended forward
Optional signal conditions allow:
• Tap + rejection within an active zone
• Session window confirmation
• Liquidity-based directional filters
--------------------------------------------------------------------
5. Equilibrium Filters (Optional)
IFE calculates an equilibrium level for each session based on the midpoint of either:
• The Asia accumulation range, or
• The most recent structural swing range
Users can restrict signals so that:
• Shorts only trigger above equilibrium
• Longs only trigger below equilibrium
This helps avoid entries in the inefficient half of the range.
--------------------------------------------------------------------
6. Signal Types
There are two main signal types inside each session:
1. Zone-Based Signals
- Price interacts with an active inefficiency zone
- Liquidity event is confirmed
- Price rejects the zone
- Session window is active
2. Momentum-Based Signals
- A structural shift is confirmed
- A momentum candle supports the move
- Liquidity/equilibrium conditions are met
- Session window is active
Long and short signals are plotted clearly on the chart with directional labels.
--------------------------------------------------------------------
7. Alerts
IFE includes alerts for:
• Zone-based long/short signals
• Momentum-based long/short signals
• Core Session events
• Expansion Session events
Each alert matches the exact visual signal on chart.
--------------------------------------------------------------------
8. Practical Use
IFE is designed for:
• Major indices (NAS100, ES, DAX)
• FX majors
• High-liquidity crypto pairs
Recommended workflow:
1. Observe how the Asia range forms initial liquidity.
2. Watch for liquidity grabs before the main session.
3. Use inefficiency zones as primary interest areas.
4. Use session timing as the main filter.
5. Apply your own risk management alongside the signals.
IFE is a structural mapping tool intended for experienced traders. It does not constitute financial advice.

FCPO MASTER v6 – Sideway + Breakout + OB + FVG (TUPLE SAFE)TL;DR cepat
1. Gunakan M5 untuk entry & OB/FVG confirmation.
2. Gunakan M15 untuk confirm trend/false breakout.
3. Gunakan H1 untuk bias arah (overall market).
4. Entry hanya bila signal + OB/FVG/candle rejection (script buatkan).
5. SL 5–8 tick, TP 10–25 tick ikut setup (sideway vs breakout).
6. Follow checklist setiap trade — jangan lompat.
________________________________________
Setup awal (1–2 min)
1. Pasang script FCPO Sideway MASTER – OB + Imbalance + Confirmation di TradingView.
2. Timeframes: buka M5, M15, H1 (susun 3 chart atau 1 chart multi-timeframe).
3. Input default: ATR14, Breakout Buffer 5 tick, RangeLen 20, ADX14, TP12, SL8. (Kau boleh tweak nanti).
4. Aktifkan alerts pada BUY Confirm / SELL Confirm / Sideway Buy / Sideway Sell.
________________________________________
Step-by-step trading process
1) Mulakan dengan H1 — tentukan bias HTF
• Lihat H1 untuk jawapan: Trend Up / Down / Sideway.
• Rule ringkas:
o ADX H1 > 20 + price above H1 EMA → bias Bull
o ADX H1 > 20 + price below H1 EMA → bias Bear
o ADX H1 < 20 → market HTF sideway (no strong bias)
Kenapa: H1 bagi kau idea “kalau breakout pada M5, patut follow atau tolak”.
________________________________________
2) Pergi ke M15 — confirm trend & valid breakout
• M15 kena setuju dengan idea breakout.
o Untuk strong breakout: M15 kena tunjuk candle close di atas/bawah range + volume naik.
o Kalau M5 breakout tapi M15 tak setuju (M15 masih sideway) → treat as fakeout. Jangan masuk.
________________________________________
3) M5 — cari entry & confirmation (OB/FVG + candle)
• M5 adalah tempat kau buat keputusan masuk.
• Tunggu script keluarkan Sideway Buy/Sell atau Breakout Buy/Sell.
• CONFIRM entry mesti ada sekurang-kurangnya 1 dari:
o Bull/Bear Order Block searah signal (script detect).
o FVG / Imbalance zone dipenuhi & price retest.
o Candle rejection (pinbar / bearish/bullish engulfing) pada zone.
Jika tiada confirmation → no trade.
________________________________________
4) Checklist sebelum tekan Buy/Sell (MUST)
• H1 bias tidak melawan trade (prefer sama arah).
• M15 confirm breakout / trend or neutral.
• Script keluarkan signal (sideway or breakout).
• OB or FVG atau candle rejection ada.
• ATR kenaikan jika breakout (untuk breakout trade).
• Volume spike jika breakout.
• Risk:SL <= 2% akaun (position sizing).
Kalau semua ticked → boleh entry.
________________________________________
5) Setting SL / TP & position sizing
• Sideway (scalp): SL = 5–8 tick, TP = 8–12 tick.
• Breakout (trend): SL = 8–12 tick, TP = 15–25+ tick (trail later).
• Position sizing: Risk per trade 1–2%.
o Lot size = (Account Risk RM × 1 tick value) / (SL ticks × tickValue) — (kalau kau gunakan fixed tick value, adjust ikut lot).
(Script tunjuk SL & TP label — follow itu.)
________________________________________
6) Entry types
• A. Sideway Reversal (M5)
o Signal: Sideway Buy / Sideway Sell
o Confirm: OB/FVG or rejection candle at range bottom/top
o Trade: scalp target 8–12 tick, tight SL 5–8 tick
• B. Breakout (M5 entry, M15 confirm)
o Signal: Breakout Buy/Sell (Strong)
o Confirm: ATR expanding + volume spike + M15 alignment
o Trade: trend follow, TP 15–25 tick, trailing stop active
• C. Retest Entry
o Breakout happens, price returns to retest range / OB / FVG → wait for rejection candle then enter. Safer.
________________________________________
7) Trailing & exit rules
• Jika useTrail = true script plots trailing stop (ATR × multiplier).
• Exit rules:
1. Hit TP → close.
2. Hit SL → close.
3. If trailing stop hit → close.
4. If opposing confirmed signal muncul (e.g., SELL confirm while long) → consider close early.
5. If H1 bias flips strongly vs trade → tighten stop or close.
________________________________________
8) Multiple signals & scaling
• Never add to losing position (no averaging down).
• If want scale-in on confirmed trend: add 1 partial size after price moves +10–12 tick in favor and shows continuation candle + no bearish OB/FVG.
• Keep aggregated risk within your max (2–3%).
________________________________________
9) Example trade walkthrough (concrete)
• RangeHigh = 4065, RangeLow = 4035 (contoh).
• Market sideway M5.
Case A — Sideway Sell:
1. Price touches 4064–4065, script shows sidewaySell.
2. Lihat OB: ada bear OB zone di 4062–4066 → confirm.
3. Candle rejection (bearish pinbar) muncul → enter SELL M5.
4. Set SL = 5 tick above rangeHigh = 4070, TP = 10 tick → 4055.
5. Trail jika price turun > 8 tick: aktifkan trailing.
6. Close at TP or trail/SL.
Case B — Breakout Buy:
1. Price closes above 4065 + 5 tick buffer = 4070 on M5. Script shows trueBreakUp.
2. M15 shows candle close above M15 resistance + volume spike → confirm.
3. Enter BUY, SL = 8 tick below entry, TP initial 20 tick, trail with ATR×1.5.
4. Move stop to breakeven after +10 tick, scale out half at +12 tick, leave rest to trail.
________________________________________
10) Journal & review
• Semua trade: record entry time, TF, reason (which confirmations), SL/TP, result, lesson.
• Weekly review: check which confirmation worked best (OB vs FVG vs candle) and tweak settings.
________________________________________
11) Tweaks / optimisations cepat
• Jika terlalu banyak false sideway signals → kurangkan touchDist ke 2 tick.
• Kalau fakeout breakout banyak → tambah tickBuf ke 6–8.
• Nak lebih konservatif → cuma trade breakout yang juga setuju M15.
________________________________________
12) Alerts & execution (practical)
• Pasang alert pada BUY Confirm / SELL Confirm (script).
• Kalau kau guna broker yang support one-click order, siap sediakan template order (SL/TP default).
• Kalau manual, bila alert masuk: buka M5, cepat confirm OB/FVG & candle rejection → entry.
________________________________________
Quick reference table (handy)
• TF utama entry: M5
• Confirm mid-TF: M15
• Bias HTF: H1
• Sideway SL/TP: SL 5–8, TP 8–12
• Breakout SL/TP: SL 8–12, TP 15–25+
• Mandatory confirmation: (Script signal) + (OB or FVG or candle)

Flow Dynamics Pro [ChartNation]Flow Dynamics Pro - Institutional Order Flow Zones
Detect high-probability institutional rejection zones with advanced volume analysis and confluence scoring.
Flow Dynamics Pro identifies institutional order flow zones where smart money enters and defends positions. Unlike traditional order blocks or supply/demand indicators, this tool combines multiple confirmation factors into a single confluence score, helping you focus on the highest-quality setups.
🎯 KEY FEATURES
Institutional Zone Detection
Volume spike analysis (customizable threshold)
Rejection wick detection (upper/lower wick ratios)
Market structure validation (swing high/low alignment)
Multi-factor confluence scoring (0-100 scale)
Visual Volume Distribution
Bull/bear volume split displayed inside each zone
See the exact buying vs selling pressure at institutional levels
Percentage breakdowns for quick analysis
Toggle on/off based on preference
Smart Zone Management
Automatic zone invalidation when broken with volume
Zone test tracking (shows how many times zones held)
Visual strengthening (borders thicken after successful tests)
Overlap prevention (maintains minimum spacing between zones)
Maximum zone limit (keeps chart clean)
Confluence Scoring System
Zones are scored 0-100 based on:
Volume Strength (30 points) - How significant was the volume spike
Market Structure (25 points) - Alignment with swing points
Zone Quality (25 points) - Wick ratio and pressure imbalance
Size Quality (20 points) - Optimal zone size relative to ATR
Zones are categorized as:
⚡ PREMIUM (80+) - Highest quality setups
🔥 STRONG (60-79) - Solid institutional zones
✓ MODERATE (40-59) - Valid but lower confluence
Timeframe Adaptive
Automatically adjusts detection sensitivity based on timeframe:
On 1H and lower: Stricter requirements (reduces noise)
On 4H and higher: Standard sensitivity (catches major zones)
Works on all timeframes from 1-minute to Monthly
Multi-Timeframe Context
Display higher timeframe zones for broader market context
Customizable HTF timeframe selection
Dashed visualization to distinguish from current timeframe zones
Comprehensive Alerts
Premium zone created (score 80+)
Price entering zone
Price exiting zone
Zone tested successfully
Zone invalidated
⚙️ SETTINGS OVERVIEW
Detection Settings
Volume Spike Threshold (default: 1.2x)
Minimum Wick Ratio (default: 0.3)
Structure Validation toggle
Detection Lookback period
Invalidation Settings
Require volume for invalidation (toggle)
Invalidation volume threshold (default: 1.2x)
Customizable to match your trading style
Display Settings
Maximum zones to display (default: 8)
Show/hide labels
Show/hide volume data
Volume distribution toggle
Label size adjustment (Small/Normal/Large)
Minimum zone spacing % (prevents overlaps)
Minimum confluence score filter (default: 55)
Visual Customization
Bullish zone color and opacity
Bearish zone color and opacity
Border colors
Multi-timeframe zone colors
📊 HOW TO USE
For Swing Traders (4H, Daily)
Focus on PREMIUM zones (score 80+)
Look for zones with multiple successful tests
Enter on retests with confirmation
Use HTF zones for broader context
For Intraday Traders (1H, 15m)
Use higher confluence minimum (60-65)
Increase zone spacing to reduce clutter
Focus on zones with clear volume distribution
Combine with price action for entries
Zone Test Interpretation
Tested 0x: Fresh zone, untested
Tested 1-2x: Gaining strength
Tested 3+x: Highly defended level (thicker borders)
Volume Distribution Guide
80%+ on one side: Strong directional bias
60-70% dominance: Moderate bias
50-50 split: Contested area, use caution
🔧 BEST PRACTICES
Combine with trend: Trade zones in direction of higher timeframe trend
Wait for confirmation: Don't enter blindly at zone touch
Respect invalidation: When zones break with volume, they're done
Use confluence scores: Prioritize scores 70+ for highest win rate
Manage spacing: Adjust spacing % if chart feels cluttered
Check timeframe: Lower timeframes may need stricter settings
🎓 UNDERSTANDING THE INDICATOR
What are Institutional Zones?
Areas where large players (institutions, market makers, smart money) have entered positions and actively defend them. These show up as:
High volume rejection wicks
Multiple tests that hold
Clear buying/selling pressure imbalance
Why Confluence Scoring?
Not all zones are equal. The 0-100 scoring system helps you quickly identify which zones have the most confirmation factors aligned, saving time and improving trade selection.
Why Zone Spacing Matters
Too many overlapping zones create analysis paralysis. The spacing filter ensures you see only distinct, meaningful levels.
📈 TECHNICAL DETAILS
Indicator Type: Overlay
Max Boxes: 500
Max Labels: 500
Pine Script Version: 6
Real-time Updates: Yes
Alerts: 5 types available
Repainting: Zones finalize on bar close
🚀 GET STARTED
Add indicator to chart
Adjust confluence minimum (55-65 recommended)
Set volume threshold for your instrument (1.2-1.5)
Customize colors to match your theme
Enable alerts for your preferred signals
Trade with proper risk management
💡 TIPS
Start with default settings and adjust based on results
Higher timeframes = more reliable zones
Premium zones (80+) have best risk/reward
Tested zones (3+) show strong institutional defense
Use zone invalidation as stop-loss reference
Flow Dynamics Pro is part of the ChartNation indicator suite - delivering institutional-grade tools for serious traders.

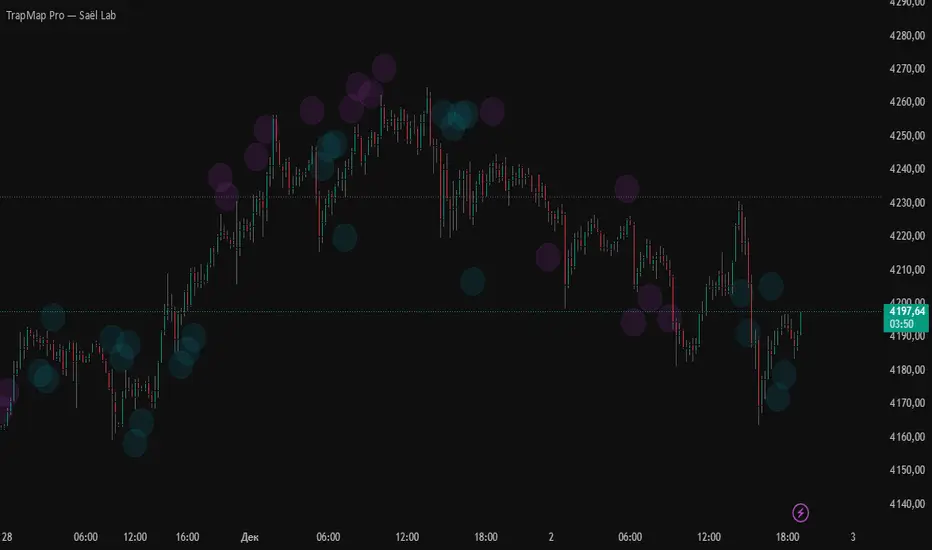
TrapMap Pro — Saël LabTrapMap PRO — Saël Lab
TrapMap PRO — Saël Lab
TrapMap PRO is an extended visual version of TrapMap Basic,
built on the same concept of imbalance between movement energy
and the actual price result.
The logic is fully identical to the Basic version.
TrapMap PRO does not change the algorithm — only the presentation.
Main Difference in PRO
PRO uses a cloud-based visualization that:
• highlights traps softly and minimally,
• avoids clutter from labels and text,
• makes imbalance zones visible “from the corner of your eye” and intuitively readable,
• keeps the chart clean and calm even during active market phases.
Two Types of Traps
1) EnergyTrap — strong internal effort, weak price result
Appears when the market shows internal activity:
• accelerated impulse,
• rising pressure,
• a sequence of “live” bars,
• many small-sized trades.
…but the price barely reacts.
Often signals:
• absorbed liquidity,
• blocked breakout attempts,
• false internal strength,
• presence of a larger participant holding the move.
2) PriceTrap — large price move with weak internal structure
Price travels far beyond the norm:
• sharp push,
• long candles,
• movement above expected ATR.
…but the internal structure is weak:
• few trades but large in size,
• low acceleration,
• insufficient pressure for a true impulse.
Typical cases:
• trend exhaustion,
• manipulative spikes,
• stop-runs,
• momentum “on empty”, without actual support.
Where TrapMap PRO is Useful
• early detection of manipulation,
• separating genuine impulses from fake ones,
• more precise recognition of false breakouts,
• identifying structural weakness zones.
Works on all markets and timeframes.
© Saël Lab
Created through the dialogue of analysis and intelligence.
Delta+CVD&CVD CandlesDelta + CVD & CVD Candles
Order-flow indicator combining Delta (Ask–Bid), Cumulative Volume Delta (CVD), and a unique CVD-based synthetic candle system. Shows buy/sell pressure, volume aggressiveness, and momentum shifts with optional Delta histogram, CVD line, and CVD+Delta combined candles. Useful for scalping, intraday trading, divergence detection, and understanding buyer/seller dominance.
________________________________________
📘 Overview
The Delta + CVD & CVD Candles Indicator combines multiple order-flow tools into one clean visual package. It displays:
• Delta (Ask–Bid) to measure aggressive buying/selling
• Cumulative Volume Delta (CVD) to track accumulated pressure
• Combined CVD Candles showing synthetic candles built entirely from order-flow data
This indicator helps traders read market intent, find momentum shifts, and detect absorption or hidden buying/selling without needing Level-2 data.
________________________________________
📊 Features
1. Delta (Ask-Bid) Histogram
Shows buying vs selling pressure per candle.
• Green = Buyers (Ask > Bid)
• Red = Sellers (Bid > Ask)
2. CVD (Cumulative Delta) Line
Tracks whether buyers or sellers dominate over time.
Useful for spotting divergences and trend strength.
3. Delta + CVD Combined Candles
Synthetic candles built from order-flow:
• Candle body = change in CVD
• Wicks = size of Delta imbalance
• Colors = green (bullish), red (bearish)
These candles reveal aggressive buying/selling much more clearly than price candles.
________________________________________
🛠 Inputs & Options
• Show/Hide Delta Histogram
• Show/Hide CVD Line
• Show/Hide Combined CVD Candles
• Bull Color
• Bear Color
• CVD Line Color
________________________________________
📈 How to Trade With It
• Rising CVD + bullish Delta → Strong up momentum
• Falling CVD + bearish Delta → Strong down momentum
• Price HH but CVD failing → Bearish divergence
• Price LL but CVD not making LL → Bullish divergence
• Long wick in combined candle → High imbalance (aggressive buyers/sellers)
Great for scalping, day trading, and momentum confirmation.
________________________________________
⚠️ Notes
• Uses TradingView’s volume feed (not Level-2 depth).
• Works on all markets and timeframes.
• Volume accuracy depends on exchange data.
________________________________________
✔️ Recommended Use-Cases
• Intraday trading
• Volume/Delta analysis
• Divergence trading
• Identifying exhaustion and absorption
• Understanding buyer/seller strength visually
________________________________________
👤 Credits
Paraskumarpatel5026@gmail.com
________________________________________

Market Maker EngineThe Core Concept: "Weighted Probability"
Most indicators just look for one thing (like lines crossing). This indicator is different. It acts like a judge scoring a gymnastics competition. It looks at 5 different factors simultaneously and assigns points to them.
It only gives you a CALL or PUT signal if the total confidence score is 80% or higher.
The "Brain"; Scoring Trades
1. Smart Money Concept; (30pts)
What it looks for: ICT Fair Value Gaps (FVG).
Why: This is the most heavily weighted factor because it identifies where institutions (banks/hedge funds) have left a "footprint" of aggressive buying or selling.
Logic: If price creates a gap that isn't filled by the next candle, it signals a strong imbalance.
2.Volume Anomalies (25 Points)
What it looks for: Is the volume statistically unusual? (Z-Score > 2.0).
Why: Retail traders trade with standard volume. "Smart Money" trades with massive volume spikes.
Logic: If volume is 2x higher than the average and price is moving in your direction, it adds 25 points.
3.Momentum Alignment (20 Points)
What it looks for: RSI and MACD working together.
Why: You don't want to catch a falling knife.
Logic:
Bull: RSI > 50 AND MACD Line > Signal Line.
Bear: RSI < 50 AND MACD Line < Signal Line.
4.Trend Filter (15 Points)
What it looks for: The 50-period Exponential Moving Average (EMA).
Why: "The trend is your friend."
Logic: It checks if the price is simply above (Bullish) or below (Bearish) the 50 EMA.
5.The "Squeeze" (10 Points)
What it looks for: Bollinger Bands contracting inside Keltner Channels.
Why: This signals "pent-up energy." When volatility gets low (squeeze), a violent explosive move usually follows.
HOW TO READ AND USE THIS INDICATOR
🟢 GREEN ARROW (CALL): The algorithm is at least 80% confident that price is going UP. (Structure + Volume + Momentum are aligned).
🔴 RED ARROW (PUT): The algorithm is at least 80% confident that price is going DOWN.
🟡 YELLOW CANDLES: These are "Whale Alerts." The volume on this specific candle is statistically abnormal. Even if there is no arrow, pay attention—big money is active here.
⚫ BLACK SCOREBOARD: On the very last candle, you will see a text box (e.g., Bull: 65%). This shows you the live calculation. If you see it climbing (40%... 60%... 75%...), a signal might be imminent.
Recommend Strategy;
This script should be favorable to Day Trade
Timeframe: Stick to the 10-minute or 15-minute chart. (The noise on the 1-minute might trigger false 80% scores).
The "Yellow" Rule: If you see a Yellow Candle without an arrow, wait. It means volume is high, but the trend/structure isn't ready yet.
Exit Strategy: Since this is an entry indicator, you should look to take profits at the next logical Support/Resistance level or when the Momentum (RSI) reverses.

TrapMap Basic — Saël LabTrapMap — Saël Lab (Basic Edition)
Short Description (Final English Version)
TrapMap — Saël Lab
A structural imbalance detector that identifies two opposite forms of mismatch between internal movement energy and the actual price result.
When impulse strength and price displacement do not align, a trap is formed.
Why there are two types of traps
Imbalance can appear in both directions.
1) EnergyTrap — high energy, low price movement
The market shows strong internal activity:
– many trades but small in size,
– growing impulse, acceleration, local pressure,
– overall flow that normally should push the market.
Yet the price barely moves.
This often indicates:
• absorbed liquidity,
• fake strength,
• failed breakout attempts,
• resistance from a larger participant.
2) PriceTrap — strong price move, weak underlying energy
Price moves an unusually large distance relative to ATR:
– a sharp push,
– fast displacement over several bars.
But the internal structure is weak:
– few trades, but with larger size,
– low impulse acceleration,
– insufficient pressure to justify the move.
This behavior suggests:
• exhaustion of the current move,
• manipulative spikes,
• stop-runs,
• false momentum without supporting flow.
Core Logic
TrapMap analyzes:
• normalized impulse energy (speed × strength),
• trade structure (many small vs few large trades),
• ATR-based displacement,
• comparison of energy vs result across a multi-bar window,
• directional context of the attempted move.
A trap forms when the outcome is inconsistent with the effort,
or the move is not supported by internal energy.
Use Cases
• detecting false breakouts,
• filtering weak impulses,
• identifying manipulation zones,
• spotting trend exhaustion,
• analyzing uncertainty around local highs and lows.
Works on all markets and timeframes.
© Saël Lab
Created through the dialogue of analysis and intelligence.

Ultimate S&D (Pro Edition)**Institutional Supply & Demand (Auto-Cleaning & Freshness Tracking)**
This indicator is designed for Price Action and Futures traders who require a clean, objective view of Institutional Supply and Demand zones. unlike standard indicators that clutter the chart with historic levels, this script focuses on **"Smart Mitigation"**—automatically removing zones that have been invalidated to keep your chart pristine.
### Key Features:
**1. 🏦 Institutional Imbalance Detection**
The script identifies **ERC (Extended Range Candles)** and momentum shifts to locate true institutional interest. It automatically marks the "Base" preceding the explosive move as a valid zone.
**2. 🧹 Smart Auto-Invalidation (Clean Chart Logic)**
Most S&D indicators leave old, broken zones on the chart. This script actively monitors price action:
* **Supply Zones:** Automatically deleted if price breaks above the zone's high.
* **Demand Zones:** Automatically deleted if price breaks below the zone's low.
* **Result:** You only see active, defendable levels.
**3. 🔄 Zone Freshness Tracking (Fresh vs. Tested)**
Visual cues help you gauge the probability of a setup:
* **Fresh Zones:** Solid borders with darker colors. (High Probability)
* **Tested Zones:** Once price touches a zone but holds, the zone turns **Dashed** and lighter in color, labeled as "(Tested)". (Lower Probability / Caution required)
**4. 🏷️ Dynamic Timeframe Labeling**
Zones are automatically labeled with the chart's timeframe (e.g., "1H Demand", "15m Supply"), making it perfect for Multi-Timeframe Analysis (MTF) and sharing screenshots.
**5. 🔔 Integrated Alerts**
Never miss an entry. You can set alerts to trigger the moment price enters a Fresh or Tested zone.
---
### ⚙️ Settings Guide:
* **Imbalance Strength:** Controls how strict the filter is. Higher values (e.g., 4.0) only show the strongest institutional moves. Lower values (e.g., 2.0) show more local zones.
* **Lookback Period:** How many bars are used to calculate average volatility.
* **Zone Extension:** How far the boxes extend to the right (auto-limited to prevent clutter).
### 🎯 How to use:
Recommended for use as a "Confluence Tool." Use your daily bias and trend analysis first, then use this script to identify precise entry zones on 1H, 15m, or 5m charts.
*For educational purposes only. Trade responsibly.*
