Range Projections [TFO]The purpose of this indicator is to see how often price reached certain standard deviations from a selected time range. The inspiration for this was to study ICT (Inner Circle Trader) concepts regarding the Central Bank Dealer’s Range (CBDR), which is 2:00 pm - 8:00 pm New York local time according to ICT Core Content. However, the idea and data collection could certainly be applied to any range of time.
The main settings of this indicator are session time, range type, and the standard deviation filter. The session time is the window of price that will be utilized for range projections. The range type can be either body or wick (on the current timeframe). The standard deviation filter is used to eliminate sessions whose ranges (from high to low) are greater than the desired/input number of standard deviations from all available session ranges.
In this example, the time range is set to 16:00 - 20:00, or the time between the New York session close and the Asia session open. Our standard deviations are set to 1, 2, 2.5, and 4. Now, by taking this session’s price range and extrapolating these extensions from the initial range, we can use these levels to see if and how price interacts with them before the next 16:00 - 20:00 session.
Furthermore, we can enable the Data Table to analyze how often price trades to these levels for the sessions that are deemed valid (determined by the standard deviation filter). This time our standard deviations are set to 1, 2, 3, and 4.
This concept can theoretically be applied to any window of time. ICT has mentioned that, in instances where the CBDR is too large, the Asia range may be used instead. We can observe that the indicator behaves the same way when we change the session to the Asia range, 20:00 - 00:00.
Cari skrip untuk "ict"

Liquidity Engulfing & Displacement [MsF]Japanese below / 日本語説明は英文の後にあります。
-------------------------
*This indicator is based on upslidedown's "Liquidity Engulfing Candles ". It's a very cool indicator. thank you.
It has 2 functions: show the Liquidity Engulfing on HTF and candle color change when displacement occurs.
=== Function description ===
1. Liquidity Engulfing on HTF
This indicator gives Liquidity Engulfing signals not only for the current candle, but also for H4 and H1 on HTF.
You can use that a bullish engulfing on H1 is a BOS on m5 and on H4 is a BOS on m15. It uses the theory of stop hunt from ICT.
Also, It's possible to fire alert.
2. Displacement
Change the color display of the candlesticks when a bullish candleStick or bearish candleStick is attached. Furthermore, by enabling the "Require FVG" option, you can easily discover the FVG (Fair Value Gap). It is a very useful function for ICT trading.
When H1 candle takes liquidity from one side and moves with an explosive move to the other side of the previous candle (displacement), it creates break of market structure on M5. Entry on discount FVG or OTE with stop loss at or below the stop hunt wick.
=== Parameter description ===
- Liquidity engulfing candles(LEC) SETTING
- Show H1 LEC … Whether to show LEC for H1
- Show H4 LEC … Whether to show LEC for H4
- Show Current LEC … Whether to show LEC for current timeframe
- Apply Stop Hunt Wick Filter … Require candle wick into prior candle retracement zone
- Apply Close Filter … Require LL/HH on candle in order to print a valid engulfing signal
- DISPLACEMENT SETTING
- Require FVG … Draw only when FVG occurs
- Displacement Type … Displacement from open to close? or from high to low?
- Displacement Length … Period over which to calculate the standard deviation
- Displacement Strength … The larger the number, the stronger the displacement detected
-------------------------
2つの機能があります: 上位足のLiquidity engulfing(流動性獲得)を表示することと、大きな変位が発生したときにローソク足の色を変更することです。
=== 機能説明 ===
1. 上位足のLiquidity engulfing
このインジケーターは、現在のローソク足だけでなく、上位足の H4 および H1 に対してもLiquidity engulfingシグナルを提供します。
H1はm5、H4はm15での使用を推奨します。これはICTのストップハント理論を活用しています。また、アラートを発することも可能です。
2. 変位(DISPLACEMENT)
大きな陽線、陰線を付けた場合に、そのローソク足をカラー表示を変更します。
さらに"Require FVG"オプションを有効にすることで、FVG(Fair Value Gap)を容易に発見することができます。ICTトレードにを行うにあたり大変有用な機能となっています。
=== パラメータの説明 ===
- Liquidity engulfing candles(LEC) SETTING
- Show H1 LEC … H1のLECを表示するかどうか
- Show H4 LEC … H4のLECを表示するかどうか
- Show Current LEC … 現在の期間の LEC を表示するかどうか
- Apply Stop Hunt Wick Filter … ハラミ足、もしくは包み足になっている場合のみに検知させる
- Apply Close Filter … 1つ前のローソクよりも終値で超えていた場合のみに検知させる
- DISPLACEMENT SETTING
- Require FVG … FVG発生時のみ描画する
- Displacement Type … openからcloseまでの変位か?highからlowまでの変位か?
- Displacement Length … 標準偏差を計算する期間
- Displacement Strength … 変位の強さ(数字が大きいほど強い変位を検出)

Market Profile @joshuuuTime is fractal. Every candle has an open, low, high and closing price.
Depending on what timeframe you are on, some opening prices could be more interesting than others.
This indicator tracks, which timeframe you are currently on and displays different things accordingly, so that the chart is never messy.
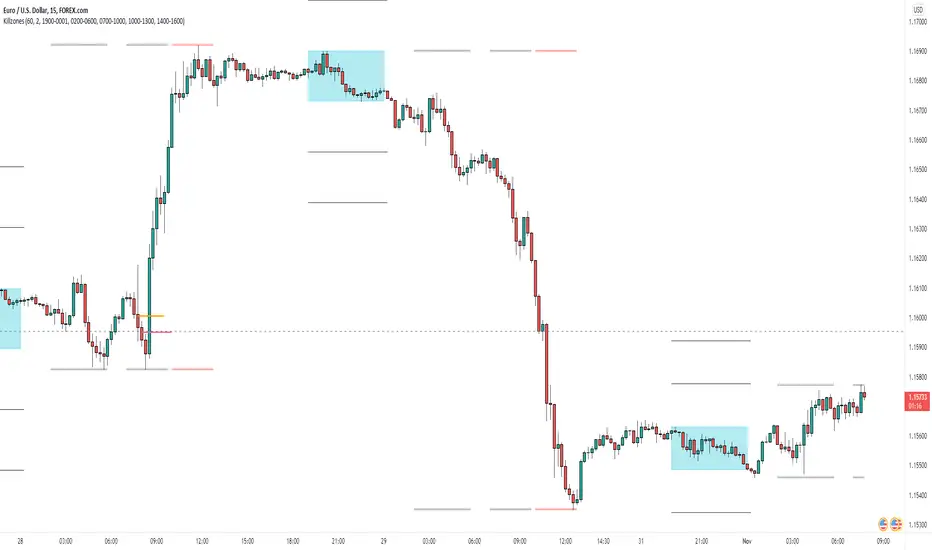
Below the hourly timeframe, the indicator highlights ICT Killzones, times of the day where most volume occurs and price moves the "cleanest". There are different versions to display those sessions in the settings.
From the hourly timeframe up to the daily timeframe, the indicator shows the "Weekly Profile". It plots the weekly opening line, can highlight daily highs and lows and daily opens and shows the name of the days on the chart.
On the daily timeframe, the indicator switches to a monthly profile. It shows the monthly open, weekly highs/lows AND it shows another concept taught by ICT, the IPDA Lookback.
ICT teaches that especially the last 20, 40 and 60 days PD Arrays and Highs/Lows are important and this indicator highlights those lookback windows accordingly.
The indicator has a lot of settings to make it allow maximum individuality.

NWOG & Dynamic Event Horizon°The ICT concept of New Week Opening Gaps (NWOG) is simply an imbalance that manifests at each Week Opening time. This gap in price is formed by the Close on Friday at 5PM EST and the open of Sunday at 6PM EST.
According to ICT's studies, this gap in price holds a lot of significance when it comes to price action, acting as a magnet or a point of reference during the week (and following weeks).
The Event Horizon (EH) is simply the midpoint between two of these NWOGs. The EH can be very useful to determine where price is drawn towards from a liquidity perspective. If price reaches this level it is probable that it will continue to the next NWOG, as explained by ICT himself.
In my own studies I have noticed that price also tends to respect and use the Optimal Trade Entry (OTE) levels drawn from both NWOGs in question. OTE levels are nothing but fibonacci 0.79 – 0.705 – 0.68 levels.
I decided to put all of these into an indicator that dynamically selects the most relevant NWOG Dealing Range and plots their EH and OTE levels automatically.
Available Alerts:
– Cross Below Event Horizon
– Cross Above Event Horizon
– New NWOG Range Established
Important Remarks:
– Note that although these work on all timeframes, the lower in resolution one goes, the less gaps will be available due to data availability.
– This indicator works on charts that have the NWOG already present in chart (i.e. no crypto assets, unless one looks at CME crypto futures such as BTC1! and ETH1!).
– The dollar index's NWOGs have a slightly different timestamp, however this has been taken care of and will allow to be plotted ONLY for the TVC:DXY ticker.
TrandingView struggles to display the indicator correctly for the default view, check out its accurate appearance here:

Smart Money Concepts(v0.01) - SoldiSmart Money Concepts
We are very pleased to be releasing our latest addition to the Soldi tools, called Smart Money Concepts. What this indicator was built to be is a guideline and tool to help a trader develop the mental mind state of a Smart Money Trader. Picking up on the digital footprints that they might have missed! This is our first iteration of this tool but we have so so much more coming to bring to this tool! So much that we might need to release 2 scripts to be able to efficiently fit it all in. As always Soldi/MMCFX always try to raise the bar on what is possible with PineScript and what advanced concepts we can bring to the retail market with ease, this project was insanely fun trying to get together and we spent a lot of months talking with and doing sessions with very well versed traders who only specialize and solely trade live with Smart Money/ICT Concepts. After many months of talking with and working with these traders we believe we have put together a very unique tool that any SMC trader would love to have in their tool belt.
What is Smart Money Concepts?
Smart Money Concepts (SMC) is the practice of trying to track the digital footprints left by Market Makers and large money traders like Institutional bodies and brokers. I believe this concept was originally developed by Inner Circle Trading (ICT), who has some great great content for free on YouTube. To my knowledge he was the father of the concepts being taken mainstream to retail individuals. Since then, there has been many other who have released content on these theories. For the sake of congruency we have only developed these tools based off the knowledge and practices taught by ICT.
What is Included within this tool?
What is currently Included with this tool are the following.
Market Structure - This includes Break of Structures (BOS) and Change of Characters (CHoCH), It was really important for us to define the different shifts that SMC traders track and follow so we built a unique customizable system that allows the traders to track these Market Structure shifts in real-time. Part of this module includes the option to plot the High/Low labels, by putting this settings on you will mark out the swing points as their respective Higher High(HH), High Low(HL), Lower Low(LL) and Lower High(LH) . This feature is a great way to help familiarize yourself with spotting these instances, there is a slight lag due to the nature of the calculations for tracking the Swing Points. By default we track 4 left bars and 4 right bars, on the 5th bar if the swing point returns true you will see the label plot itself. If you have a higher bar count you will need to wait till x+1 to see the label be plotted. eg. 7 bar count on the left and right, you will need to wait till the 8th bar to see the label be plotted.
By changing the bar counts you also change how the Market Structure module picks up the Market shifts (BOS/CHoCH)
4 bar left, 4 bar right example:
7 bar left, 7 bar right example:
Liquidity Sweep - This part of the Market Structure module is still being worked on and built out, this feature is meant to help a trader identify potential liquidity sweeps that have taken place past or present by switching the bar color to the user defined color (default yellow). There are many different types of liquidity sweeps that can take place and we are still working on the different profiles of these! More profiles will be added to the the updates in the future to help identify these potential trade areas
Liquidity Sweep example:
Trend Bars - This part of the Market Structure module helps traders identify structure trends based on the breaks of existing structure. Again this will shift as you play with the bar count settings, low bar count will identify faster swing points and shifts where as higher bar counts will identify longer term structures. By having this setting on it will change the bar colors to Red(Bearish) or Blue(Bullish) by default, we recommend to change your candles border settings to make this more visible.
7 bar left, 7 bar right. With High Low Labels and Trend Bars
Fair Value Gaps - This module will track the Fair Value Gaps and Imbalances that will take place in real-time. Once the final candle closes it will plot the FVG. Unlike other FVG indicators on TradingView we hold and store ALL the FVG's that take place, other indicators will only hold on to x amount of the FVG's and as new ones enter the list the old ones get bumped out. We didn't like this idea, so what we did was instead store all of the FVG's but create a threshold to where they would be plotted, eg. if you set the threshold to 4% it will only show you the FVG's within a 4% range from the current price. This way you still have access to all the data with out compromising but it helps you focus on the current data at hand.
Fair Value Gap/Imbalance - 3% threshold example
Fair Value Gap/Imbalance - 8% threshold example
Order Blocks - This was an especially interesting module to build, just like the FVG's we found that a lot if not all the authors on TradingView haven't actually been coming close to tracking and plotting true ICT style Order blocks. We set out to change that though, again through a unique approach we have built this Order Block indicator. To also comment on the other scripts out there that claim to track Order Blocks, not a SINGLE script mentions anything about Validated Order Blocks , which was especially important to all the SMC traders I have talked to and had help from building this indicator. Just like the FVG piece this also has a 'threshold' plot, but not only that it gives you the option to look at "No Validation" and "Validated" Order Blocks. With soon another style of Validation to choose from. If you choose the "Validated" option the script will actively seek Order Blocks that have a POI/liquidity sitting above it. I also want to make it clear that based on your bar count settings the order blocks will differ, as they are also based from structure breaks!
Order Blocks with "No Validation" example
Order Blocks with "Validation" example
Advanced Session Tracking - We always seek to out do what has been done and what we have already done, that being said we built our Advanced Session Tracking module to follow each user define Session's Open, High, Low, Close, Liquidity threshold and extend that into the next session . As per our last KillZone indicator we also included the Forward Plotting feature which will plot the defined sessions 24 hours in advance vs only showing you real time. Many if not all Session tracking tools on TradingView only show you real-time and in the past when the define sessions are but we find that to be a very silly practice because as SMC traders you know how important it is the relation between time and price. Instead of reacting to the sessions you and prepare for the sessions ahead of time anticipating when price might react to time.
note: There is a small bug with tracking the crypto based sessions, this is working to be fixed for the next update, check the release notes to see when the fix occurs
Session Background plots with forward plotting example
Session Backgrounds with High/Lows and Liquidity range example
What is to come with the updates?
We are always looking to improve anything, even if it is just a fraction better. That is why we are continuing to work with our SMC traders to refine the concepts, profiles, coding as well as the logic behind the calculations.
Here is a list of what we are planning and working on to be released in the updates to come!
Intra-Day Profiling - Each day has a profile, what we want to achieve is to track and predict these profiles
Liquidity Scanner - There are different types of liquidity that form and we want to be able to find and track these
Smart Trend Alerts - We want to combine quant methods into SMC to provide high probability trade ideas
User Suggestions - We are always open to work with the community to bring features they want
If it's not Soldi, it isn't money

AsianRange and KillZonesAsia Range Shadow Box and ICT Killzones
If you watch ICT on youtube you will know what to do with this :-)
I had found a lot of great ideas but none of them completely had what I was personally looking for so I put all of the great ideas I had found and added my own twist to it.
I wanted a easily customizable indicator that did the following
- Showed the Asia Range (customizable time)
- Allowed Asia range high and low to be extended
- Fill the asia range or just have it outlined
- The ability to have 4 customizable zones (default to ICT kill zones) but you can make them whatever you want
- Ability to turn off various zones if you want (Maybe you just want a New York Session and thats it)
I also place a "Max timeframe to display" - Personally I don't want this showing on anything over a 60min chart so you can adjust that parameter (in minutes) to your liking.
This was also fully converted to pine v4
I hope in a future revision to take use of the new "box" feature to get a cleaner box around Asia session.
NWOG/NDOG [NINE Θ]Overview
A professional-grade indicator for detecting and visualizing New Week Opening Gaps (NWOGs) and New Day Opening Gaps (NDOGs), essential concepts in ICT (Inner Circle Trader) methodology and analysis.
What Are Opening Gaps?
Opening gaps represent price inefficiencies created between trading sessions. When one session closes and the next session opens at a different price, the resulting "gap" creates a zone of unfilled orders and potential liquidity. These gaps often act as magnets for price, providing high-probability trading opportunities as the market seeks to rebalance these inefficiencies.
NWOG (New Week Opening Gap)
The gap between Friday's close and Sunday's open. These weekly imbalances are significant because they represent the collective repositioning of institutional traders over the weekend. NWOGs frequently serve as major support/resistance zones that can influence price action for days or even weeks. Due to their larger timeframe context, NWOGs typically carry more weight than daily gaps.
NDOG (New Day Opening Gap)
The gap between one session's close and the next session's open. Daily gaps occur more frequently than weekly gaps, offering more regular trading setups. While individually less significant than NWOGs, NDOGs provide valuable intraday reference points and often fill within the same trading session.
Features In Depth
Gap Detection & Visualization
The indicator automatically identifies and plots opening gaps as they form in real-time.
Automatic Detection: The indicator monitors session transitions and instantly identifies when a gap forms between the previous close and current open. NWOGs are detected on Sunday opens, while NDOGs are detected at each new daily session open (excluding Sundays, which are reserved for NWOG detection).
Bullish vs Bearish Classification: Each gap is automatically classified based on its direction:
Bullish Gap (Gap Up): Current open is higher than previous close, indicates overnight buying pressure
Bearish Gap (Gap Down): Current open is lower than previous close, indicates overnight selling pressure
The indicator uses distinct color schemes for bullish and bearish gaps, making it easy to identify gap direction at a glance. Current/most recent gaps use the "new" color settings, while historical gaps use the standard color settings.
Historical Tracking: Track up to 20 gaps of each type simultaneously. The "Historical Count" setting controls how many gaps remain visible on your chart. Older gaps are automatically removed as new ones form, keeping your chart clean while maintaining relevant historical context.
Visual Customization:
Toggle gap boundary lines (HIGH/LOW) on or off independently from the background fill
Choose line styles: solid (⎯⎯⎯), dashed (----), or dotted (····)
Adjust line thickness from 1-4 pixels
Enable/disable background fill with customizable transparency
Set colors independently for current vs historical gaps
Consequent Encroachment (C.E.)
The Consequent Encroachment represents the 50% midpoint of a gap — a critical level in ICT methodology.
Why C.E. Matters: In smart money concepts, the C.E. level represents the point of maximum efficiency within an imbalance. Price often gravitates toward this level as it seeks to rebalance the gap. Many traders use C.E. as their primary target when trading gap fills, or as a key level for entries and stop placement.
C.E. Display Options:
Independent color settings for current vs historical gaps
Separate line style and thickness controls
Can be shown/hidden independently from gap boundaries
Quarter Levels (25% and 75%): For traders who want additional precision, the indicator offers optional quarter levels at 25% and 75% of the gap range. These levels can serve as:
Partial profit targets
Scaling entry points
Additional support/resistance zones within the gap
Fill Tracking & Percentage
The indicator provides sophisticated fill tracking to monitor how much of each gap has been "filled" by subsequent price action.
How Fill Percentage Works:
For bullish gaps (gap up): Measures how far price has retraced DOWN from the gap's high toward its low
For bearish gaps (gap down): Measures how far price has retraced UP from the gap's low toward its high
The fill percentage updates in real-time as price moves through the gap zone, giving you instant feedback on gap fill progress.
Fill Detection Methods:
Wicks: Uses the full candle range (high/low) — more sensitive, detects fills earlier
Bodies: Uses only open/close prices — more conservative, requires stronger commitment
Visual Fill Indicators: The fill percentage is displayed with intuitive symbols:
〇 0-24% filled — Gap is largely untouched
◔ 25-49% filled — Minor fill in progress
◑ 50-74% filled — C.E. level has been reached
◕ 75-99% filled — Gap nearly complete
⬤ 100% filled — Gap fully filled
Hide Filled Gaps: Enable this option to automatically remove gaps from your chart once they reach 100% fill. This keeps your chart focused on active, unfilled gaps that still represent potential trading opportunities.
Projection Levels
When price breaks out of a gap zone, projection levels provide potential targets based on the gap's size.
How Projections Work: Once price closes above a gap's high (for upward projections) or below a gap's low (for downward projections), the indicator calculates extension levels using the gap's range as a measuring unit. These projections function similarly to Fibonacci extensions but are anchored to the gap's dimensions.
Projection Direction:
Upward Projections: Triggered when price closes above the gap's high — levels project above the gap
Downward Projections: Triggered when price closes below the gap's low — levels project below the gap
Customizable Multipliers: Define your own projection levels using the "Projection Levels" input. Enter comma-separated values representing multiples of the gap size:
Default: 0.5,1,2,2.5
Example custom: 0.618,1,1.618,2,2.618 (Fibonacci-based)
Each value creates a projection line at that multiple of the gap range
Projection Display Options:
Side: Display projections on the Left (extending back from gap formation) or Right (extending forward)
Color, Style, Thickness: Full visual customization
Labels: Show multiplier values at each projection level
"Extend Until Tapped" Feature: When enabled (Left side only), projection lines stop extending once price touches them. This creates a visual record of which levels have been reached and when, helping you track projection performance over time. Untapped projections continue extending until they're reached.
Labels & Formatting
Comprehensive labeling options help you quickly identify and reference gaps on your chart.
Label Format Options:
Gap Type: Simple label showing "NWOG" or "NDOG"
Gap Type + Date: Includes the full date with day of week (e.g., "NWOG Monday, November 3, 2025")
Gap Type + Date + Filled Percent: Adds the fill percentage and symbol (e.g., "NWOG Monday, November 3, 2025 ")
Label Positioning:
When Show Levels is ON: Separate labels appear at the HIGH and LOW boundaries
When Show Levels is OFF: A single label appears at the C.E. (midpoint) level
Label Customization:
Text size: Tiny, Small, Normal, or Large
Text color and background color (set background transparency to 100 for no background)
Tooltips provide detailed information including all price levels and fill percentage
Hide Historical Labels: Enable this option to hide labels and projection text on all gaps except the most recent. Lines remain visible, but text clutter is reduced — useful when tracking many historical gaps.
Status Table
An optional summary table provides at-a-glance information about all active gaps.
Table Contents: For each active gap, the table displays:
Gap Type: NWOG or NDOG with date
HIGH: Upper boundary of the gap
LOW: Lower boundary of the gap
C.E.: Consequent Encroachment (50% level)
% Filled: Current fill percentage with visual symbol
Display Settings:
Position: 9 positions available (Top/Middle/Bottom × Left/Center/Right)
Size: Tiny, Small, or Normal text
Gap Count: Control how many NWOGs and NDOGs appear in the table (1-3 each)
Adaptive Theming: The table automatically detects your chart's background color and adjusts text colors for optimal readability on both light and dark themes.
Smart Filtering: The table only shows unfilled gaps (or gaps not hidden by the "Hide Filled" setting), keeping the display focused on actionable information.
Alert System
Stay informed of key gap events without constantly monitoring your charts.
Gap Formation Alerts: Receive an alert the moment a new gap is detected. The alert includes:
Gap direction (Bullish/Bearish)
Gap type (NWOG/NDOG)
Symbol name
Example: "Bullish NWOG formed on AMEX:SPY "
Gap Filled Alerts: Get notified when a gap reaches 100% fill. This is valuable for:
Confirming trade targets have been reached
Identifying when gaps are no longer active reference points
Example: "NWOG filled on AMEX:SPY "
Projection Level Alerts: Receive alerts when price reaches your defined projection levels. Each level only alerts once, preventing spam. Useful for:
Taking profits at projection targets
Identifying extended moves beyond the gap
Example: "NWOG 2x projection reached on AMEX:SPY "
General Settings
Gap Offset: Controls how many bars the gap lines extend to the right of the current candle (0-15 bars). A higher offset keeps labels and lines visible further into the future, while a lower offset keeps the display tighter to current price action.
Tips
NWOG Priority: NWOGs typically hold more significance than NDOGs due to their weekly timeframe. When NWOG and NDOG levels conflict, consider giving more weight to the NWOG.
Unfilled Historical Gaps: Gaps from days or weeks ago can still influence current price action. Don't ignore older unfilled gaps — they often become relevant when price returns to those zones.
Session Context: Pay attention to which session created the gap. Gaps formed during high-volume sessions (like NYSE open) may carry more significance than gaps from lower-volume periods.
Gap Size Matters: Larger gaps represent more significant imbalances and often provide stronger support/resistance. Smaller gaps may fill quickly and offer less reliable levels.
Clean Chart Option: Use "Hide Historical Labels" combined with the status table to maintain a clean chart while still having access to all gap information.
Requirements
Intraday Timeframes Only: This indicator works exclusively on intraday timeframes (minutes, hours). Gap detection requires session open/close data that is only available on intraday charts.
Sufficient Historical Data: Ensure your chart has enough historical bars loaded for accurate gap tracking, especially if using higher historical count settings.
Session-Based Markets: The indicator is optimized for markets with distinct trading sessions (stocks, futures, forex). 24/7 markets like crypto may show fewer or different gap patterns.
Disclaimer
For Educational and Informational Purposes Only
This indicator is provided as a technical analysis tool for educational and informational purposes only. It is not intended as, and should not be construed as, financial advice, investment advice, trading advice, or any other type of advice.
No Guarantees: Past performance of any trading strategy, indicator, or methodology is not indicative of future results. The identification of gaps, projections, and fill levels does not guarantee that price will behave in any predicted manner. Markets are inherently unpredictable, and no technical indicator can accurately predict future price movements.
Risk Warning: Trading financial instruments involves substantial risk of loss and is not suitable for all investors. You should carefully consider your investment objectives, level of experience, and risk appetite before trading. Never trade with money you cannot afford to lose.
Not Financial Advice: The creator of this indicator (NINE) is not a licensed financial advisor, broker, or dealer. Nothing in this indicator or its documentation should be interpreted as a recommendation to buy, sell, or hold any financial instrument.
Your Responsibility: You are solely responsible for your own trading decisions. Always conduct your own research and due diligence before making any trading or investment decisions. Consider consulting with a qualified financial professional before trading.
No Liability: The creator assumes no responsibility or liability for any errors, inaccuracies, or omissions in this indicator or its documentation. The creator shall not be held liable for any losses, damages, or costs arising from the use or inability to use this indicator.

PD Array Matrix [NINE Θ]PD Array Matrix
A comprehensive ICT-based indicator that combines multiple Premium/Discount Array concepts into a single, unified tool for Smart Money analysis.
Overview
PD Array Matrix provides traders with institutional-grade market structure analysis by integrating key ICT (Inner Circle Trader) concepts. This indicator automatically identifies and displays critical price levels, imbalances, and divergences that smart money uses to execute trades.
Key Features
Change in State of Delivery (CISD)
Automatically detects shifts in market delivery, signaling potential reversals or continuation setups.
Bullish and Bearish detection with directional filtering
Confirmation arrows for visual clarity
Wick-based invalidation for precise risk management
Customizable line styles, colors, and label formats
Order Blocks
Identifies institutional order flow zones where significant buying or selling occurred.
Box or Line display styles
Filter by direction: Both, Bullish, Bearish, or CISD Direction
CISD Direction mode only shows Order Blocks that align with the current market bias
Automatic invalidation when price mitigates the zone
Market Structure Levels
Tracks key liquidity levels that institutional traders target.
Minor Levels: Intermediate swing highs/lows (Buyside/Sellside)
Major Levels: Significant swing points with higher timeframe relevance
Automatic fill detection with optional historical display
Customizable display modes: Label Only, Price Only, Both, or Minimalistic
Fair Value Gaps (FVGs)
Detects price imbalances created by aggressive market moves.
Three display styles: Normal, Minimalist, and Classic
Optional Volume Imbalance detection (body-to-body gaps)
50% Consequent Encroachment line
Proximity-based display showing FVGs closest to current price
Inversion Fair Value Gaps (IFVGs)
Identifies when price inverts through an existing FVG, flipping its directional bias.
Automatic conversion from FVG to IFVG on body close
Configurable lookback period to filter old inversions
Independent display controls from regular FVGs
Invalidation tracking when price closes through the zone
Higher Timeframe FVGs
Displays Fair Value Gaps from higher timeframes on your current chart.
Auto Timeframe selection based on your chart
Manual timeframe override option
Seamless integration with lower timeframe analysis
SMT Divergences
Detects Smart Money Tool divergences between correlated instruments.
Auto SMT Mode: Automatically selects correlated pairs for:
Index Futures (NQ, ES, YM, RTY)
Metals (GC, SI, PL)
Energy (CL, RB, NG)
Forex Majors
Crypto (BTC, ETH)
Manual symbol selection for custom pairs
Dual symbol comparison for confluence
Automatic invalidation tracking
Session Filters
Limit all setups to specific trading sessions.
Two configurable session windows
Multiple timezone support
Applies to: FVGs, IFVGs, CISDs, Order Blocks, and SMTs
Active on timeframes ≤ 1 hour
Customization
Every component offers extensive customization:
Individual toggle controls for each feature
Color settings for bullish/bearish elements
Multiple line styles (Solid, Dashed, Dotted)
Label size and position options
Transparency controls
Historical display limits
This indicator is for educational and informational purposes only. It does not constitute financial advice. Past performance is not indicative of future results. Always conduct your own analysis and manage risk appropriately.

TTP IFVG Signals With EMA /ICT Gold scalpingThis script uses original logic and alerting rules. in Japan
finding ICT IFVG and EMA conditions.
#IFVG, Forex, ICT, EMA, Scalping, Indicator
This indicator automatically finds IFVG (Imbalance / Fair Value Gap) zones and gives you a buy or sell signal when price comes back and breaks out through that gap.
It also draws a colored box over the gap so you can see the zone visually, and it raises alerts when a new signal appears.
High-level logic:
On every bar, the script looks back up to “IFVG_GapBars” bars.
For each offset i it checks a 3-candle pattern:
– If the low of the newer candle is above the high of the older candle: bullish FVG (price jumped up, leaving a gap).
– If the high of the newer candle is below the low of the older candle: bearish FVG (price jumped down, leaving a gap).
When a valid FVG is found:
– For a bullish FVG it looks for a later close that breaks down through that gap (sell signal).
– For a bearish FVG it looks for a later close that breaks up through that gap (buy signal).
– A moving-average trend filter must agree (downtrend for sells, uptrend for buys).
– It checks that price has not already “filled” the gap before the breakout.
If all conditions are satisfied, it:
– Sets signal_dir = 1 for a buy, or -1 for a sell.
– Draws a box from the original FVG bar to the bar just before the breakout (extended a bit to the right), between the gap high and gap low.
– Plots an ▲ label for buys or ▼ label for sells.
– Triggers the corresponding alert conditions.
Now the parameters:
PipSizeMultilier (PipSizeManual)
Multiplies the symbol’s minimum tick size (syminfo.mintick).
It is used when converting “MinFVG_Pips” into an actual price distance.
If you feel the indicator is too sensitive (too many small gaps), you can increase this multiplier to effectively require a larger price difference.
TickSize
Internal value = syminfo.mintick * PipSizeMultiplier.
This is the actual price step the script uses as a “pip” when checking minimum gap size.
FVG Search Lookback (IFVG_GapBars)
How many bars back from the current bar the script will scan for a 3-candle FVG pattern.
Larger value = it can find older FVGs, but loop cost is higher.
Min FVG Size (Pips/Points) (MinFVG_Pips)
Minimum allowed size of the gap, measured in “pips/points” using TickSize.
If the vertical distance between the gap high and gap low is smaller than this, the gap is ignored.
0.0 means “no size filter” (every FVG is allowed).
FVG Epsilon (Price Units) (FVG_EpsPoints)
Tolerance for the FVG detection.
It is subtracted/added in the condition that checks “low > old high” or “high < old low”.
0.0 means strict gap (no overlap at all). A small positive epsilon allows tiny overlaps to still count as a gap.
Show IFVG Zones (ShowZones)
If true, the script draws a box over the IFVG zone when a signal is confirmed.
If false, no boxes are drawn; you only see the ▲ / ▼ markers and alerts.
Buy Zone Color (ZoneColorBuy)
Fill color and border color for boxes created from bearish FVGs that later produce a buy signal.
Sell Zone Color (ZoneColorSell)
Fill color and border color for boxes created from bullish FVGs that later produce a sell signal.
Box Extension (Bars) (BoxExtension)
How many extra bars to extend the right side of the box beyond the breakout bar.
The internal right coordinate is “bar_index - 1 + BoxExtension”.
Increase this if you want the zone to visually extend further into the future.
MA Period (MA_Period)
Lookback length of the moving average used as a trend filter.
MA Type (MA_Kind)
Type of moving average: “SMA” or “EMA”.
If SMA is chosen, the script uses ta.sma; if EMA, it uses ta.ema.
Moving-average filter behavior:
For sell signals (from bullish FVG): MA must be sloping down (MA < MA ) and price must be below MA.
For buy signals (from bearish FVG): MA must be sloping up (MA > MA ) and price must be above MA.
If these conditions are not satisfied, the FVG is ignored even if the gap and breakout conditions are met.
Signals and alerts:
signal_dir = 1 → buy signal, ▲ label below the bar, “IFVG Buy Alert” / “IFVG Buy/Sell Alert” can fire.
signal_dir = -1 → sell signal, ▼ label above the bar, “IFVG Sell Alert” / “IFVG Buy/Sell Alert” can fire.
signal_dir = 0 → no new signal on this bar.
In short:
This indicator finds 3-candle IFVG gaps, filters them by size and trend, waits for a clean breakout through the gap, draws a box on the original gap zone, and gives you a clear buy or sell signal plus alerts.

Quarterly Theory (Lé Modél) 🧪 [Ultimate +] | cephxsQUARTERLY THEORY (LÉ MODÉL) 🧪
SSMT + Timed Structural Swing Points + Alerts
This is mostly types using voice typing so the punctuation might be off.
This indicator uses public domain information based on a trading system called "Quarterly Theory" by TraderDaye & ICT. All concepts are freely available educational material that's been around for years. I just built a tool to visualize it properly.
WHAT IS THIS?
Alright so basically this is my attempt (pretty good attempt I'd say) at building the ultimate quarterly theory tool. It tracks multiple timeframe cycles (monthly, weekly, daily, 90m, and micro) and detects when correlated assets are diverging from each other at key swing points. That's the SSMT (sequential smt) part otherwise called an Offset Divergence either in an Accumulation/distribution phase of price.
On top of that, it finds timed structural swing points with their exact formation times, detects liquidity purges, and confirms change in state of delivery (CISD) through orderblock reclaims. Everything is wrapped in a pretty comprehensive alert system so you can actually trade off this stuff without staring at charts 24/7.
CORE FEATURES
Multi-Cycle SSMT Detection: tracks divergences across 5 nested cycles - monthly, weekly, daily, 90m, and micro. each cycle has its own visibility gates so you're only seeing what's relevant to your chart timeframe. They are also customizable so you are not restricted to what I think is best; nevertheless, hard gates are put in place to prevent unnecessary data calls too far back into history to allow users of all plans to use without errors (Bar data limits)
Timed Swing Points: every pivot high/low gets timestamped. you'll see exactly when the swing formed - super useful for macro window analysis (those :00-:10 and :50-:00 minute windows).
Liquidity Purges: automatically detects when price sweeps a previous swing high/low and reverses. shows both the sweep level and confirmation.
CISD (Change In State of Delivery): finds the stretch candle at pivots and waits for price to reclaim it. that's your delivery change confirmation.
Auto Asset Detection: just throw it on any chart and it figures out the correlated assets for you. works with indices ( CME_MINI:NQ1! , CME_MINI:ES1! , CBOT_MINI:YM1! ), forex majors ( FOREXCOM:EURUSD , FOREXCOM:GBPUSD ), metals ( FOREXCOM:XAUUSD , FOREXCOM:XAGUSD ), crypto, and more.
Normal + Hidden Divergences: normal divergence is when extremes diverge between assets. hidden divergence uses body closes instead of wicks - sometimes catches moves that normal misses.
Comprehensive Alert System: atomic alerts for individual events, preset combos for multi-confluence setups, and a custom "alert kitchen" to build your own conditions.
Each of these features can be visually disabled individually while the logic is still computed and alerts still function without bother.
THE CYCLES EXPLAINED
quarterly theory breaks time down into nested fractal cycles. each cycle divides into 4 quarters (Q1, Q2, Q3, Q4) where Q2 is typically expansion/displacement:
Monthly Cycle: tracks the 4 weeks of the month. best viewed on 4H charts and above
Weekly Cycle: Mon-Tue-Wed-Thu-Fri as the 5 "quarters". best on 1H charts.
Daily Cycle: the trading day split into 4 sessions (asia, london, ny am, ny pm). best on 15m.
90m Cycle: 6 x 90-minute windows throughout the day. best on 3-5m charts.
Micro Cycle: 22.5-minute quarters within each 90m block. 1m charts only.
Tried to implement a new Quarterly Cycle, will defer that to a later update.
VISIBILITY GATES
the indicator automatically shows/hides cycles based on your chart timeframe. here's how it works:
Auto Mode (recommended):
Micro: 1m only
90m: 3m-5m
Daily: 15m only
Weekly: 1H only
Monthly: 4H only
Extended Mode (more flexibility):
Micro: 1m-3m
90m: 1m-30m
Daily: 5m-1H
Weekly: 15m-4H
Monthly: 4H-1D
you can also set custom ranges or just show everything with "All" mode.
INPUTS BREAKDOWN
Visual Preset
All Features: shows everything - SSMT, time labels, CISD, purges
SSMT + TIME + CISD: hides purge lines for cleaner charts
SSMT + CISD: hides time labels too
SSMT Only: just the divergence lines, nothing else
SSMT Plots (Section 2)
Extreme Detection Mode: "Normal" uses wick extremes, "Hidden" uses body closes, "All" shows both
Per-Cycle Toggles: enable/disable each cycle independently with custom colors
Label Styling: choose between "Cycle + Asset", "Cycle" only, or "Asset" only labels
Pivot Detection (Section 3)
Sensitivity: controls how many bars on each side to confirm a swing (default: 2)
Maximum Points: limits how many pivots are displayed
Pivot Labels (Section 4)
Show Time Labels: displays the exact timestamp of each swing
Key Times Only: only shows labels for swings in macro windows (:00-:10, :24-:36, :50-:59)
Macro Colors: special highlighting for pivots during macro windows
Purge Detection (Section 5-6)
Pending Timeout: how many bars a purge can wait for confirmation before being discarded
Strict Key Time: requires both the sweep AND confirmation to be in key time windows
Dotted Line Offset: how far the confirmation line extends past the reversal candle
CISD Detection (Section 7-8)
Size Filter: filters out tiny orderblocks using ATR-based sizing. options from "Really Small" (shows most) to "Juicy" (only big ones)
Pending Timeout: bars before an unconfirmed CISD expires
Exhaustive Mode: shows all valid CISDs instead of limiting to max count
ALERT SYSTEM
this is where it gets powerful. three tiers of alerts:
Atomic Alerts (individual events):
Swing High/Low formed
Bearish/Bullish Purge confirmed
CISD Confirmed/Pending
Purge + CISD Combo
Preset Combos (multi-confluence):
M/W/D/90/Micro SSMT + CISD: fires when SSMT divergence is active AND CISD confirms in matching direction
Require Matching Purge: adds purge to the combo requirement
Stacked Alerts: triggers when 2+ cycles align simultaneously
Alert Kitchen (custom builder):
build your own combo by selecting:
Which SSMT cycle (with direction: bullish/bearish/any)
Whether CISD is required
Whether matching purge is required
Purge tolerance (how close the purge pivot needs to be)
Session Filter:
all alerts can be filtered to only fire during specific sessions:
Asia: 18:00-00:00 ET
London: 02:00-05:00 ET
NY AM: 08:30-12:00 ET
NY PM: 13:30-16:00 ET
Custom time ranges
AUTO ASSET DETECTION
the indicator uses the AssetCorrelation library to automatically figure out which assets to compare. here's what it supports:
US Indices: CME_MINI:NQ1! , CME_MINI:ES1! , CBOT_MINI:YM1! (or micros MNQ/MES/MYM)
Forex Majors: FOREXCOM:EURUSD , FOREXCOM:GBPUSD vs TVC:DXY
Metals: FOREXCOM:XAUUSD , FOREXCOM:XAGUSD , Copper
Energy: CL (crude), RB (gasoline), HO (heating oil)
Crypto: BTC, ETH, TOTAL3 as triad
EU Indices: GER40, EU50, UK100, ESP35
you can also disable auto mode and manually configure your own asset triads/dyads.
STATUS BAR
optional horizontal bar showing which SSMT cycles are currently active. displays M | W | D | 90m | Micro with color coding:
Blue = bullish divergence active
Red = bearish divergence active
Gray = neutral (no divergence)
Purple = both directions active simultaneously (sandwich)
RECOMMENDED USAGE
start with "Auto" timeframe gating - it shows the right cycles for your chart
focus on cycles that align with your trading style (scalpers: 90m/micro, swing: daily/weekly)
use CISD confirmation before entries - divergence alone isn't enough (at least for me)
Pair with True Opens to align properly (This is a trading model in itself)
set up preset alerts for your main setup (e.g., "D SSMT + CISD" on 15m chart)
filter alerts to your active trading session to reduce noise
TIMEFRAME CHEAT SHEET
1m: Micro cycle + 90m context
3-5m: 90m cycle + Daily context
15m: Daily cycle + Weekly context
1H: Weekly cycle + Monthly context
4H: Monthly cycle only
FAQ
why don't i see any SSMT lines?
check your timeframe gating mode. if you're on a 15m chart with "Auto" mode, you'll only see Daily cycle. switch to "Extended" or "All" to see more cycles.
what's the difference between normal and hidden divergence?
normal uses wick highs/lows, hidden uses body closes. hidden can catch divergences that wicks miss, but it's also noisier.
Why do some CISDs not confirm?
the stretch candle needs to be reclaimed by price within the timeout window. if price never comes back to that level, the CISD expires.
can i use this on stocks?
technically yes, but you'll need to manually configure your asset pairs since auto-detection focuses on futures/forex/crypto.
DISCLAIMER
this is an educational tool, not financial advice. quarterly theory, SSMT, and all related concepts are based on publicly available information from TraderDaye and ICT methodology on X with a touch of my own discoveries too.
past performance doesn't guarantee future results. always use proper risk management and never trade more than you can afford to lose. the indicator is provided as-is with no guarantees.
do your own backtesting before using this in live markets.
CREDITS
Quarterly Theory concepts: TraderDaye & ICT
AssetCorrelation library: fstarcapital
Development: cephxs & fstarcapital community
CHANGELOG
Ultimate +: added Alert Kitchen, stacked cycle alerts, session filtering, status bar, size-filtered CISD
Pro +: added hidden divergences, added sweep detection/plots, auto asset detection, preset combos
Base: initial release with core SSMT and pivot time labels
No form of this Library is to be sold in any capacity as part of any service / indicator on the TradingView Platform or elsewhere by anyone else but me.
Otherwise it is completely free to use in private and public open/closed source indicators.
Sidenote: 3rd upload because I'm trying to get the thumbnail right :(
Made with ❤️ from cephxs

Đại Ka 3 ATR BandsĐại Ka 3 ATR Bands – The ultimate single-slot indicator that replaces three separate ATR plots.
Designed specifically for ICT/SMC traders in 2025:
• Light red band (±0.5 ATR) → fake moves, Judas Swing, Turtle Soup zone
• Gray band (±1.0 ATR) → normal price action
• Light green band (±2.0 ATR) → real displacement zone → Silver Bullet, SFT, high-probability entries
How to use:
– Price stuck inside red band → expect reversal/fakeout
– Price breaks and closes outside green band + volume spike → enter aggressively in that direction (85%+ win-rate inside Killzones)
Default ATR(14), subtle fills for instant visual filtering of real vs fake moves.
Perfect companion for Order Blocks, FVG, Breaker Blocks and NY/London Killzones.
Free forever – coded with love by Đại Ka & Vietnamese ICT crew.

PIPSTA - Sniper - ICT Advancedpipsta sniper is a multi-asset ict-inspired indicator designed for intraday traders who follow liquidity concepts, london sweeps, and new york kill zone execution. it works across nq/es futures, gold/xauusd, and forex pairs using adaptive logic and dynamic thresholds so the behaviour fits each market naturally. the focus is simple: track liquidity, identify sweeps, wait for the kill zone window, and trigger clean automated setups.
the indicator monitors asian, london, and pre-market sessions using new york time. it records each session’s high and low, updates them in real time, and draws them on the chart. these levels reset at the start of every trading day. london highs and lows are especially important: when price breaks past a london level by a defined threshold specific to the asset, the indicator marks it as a sweep. once a sweep occurs, the level label updates, colours change, and the info panel reflects the sweep status. this gives traders clear structure for liquidity bias.
the new york kill zone (9:35–9:55 am et) is highlighted on the chart. this is the only zone where trade signals are allowed. the indicator waits for price to show either a spike-fade reversal after a sweep or a momentum breakout after a sweep. spike-fade signals appear when price forms a short-term extreme and reverses at the close of the bar, while breakout signals appear when price breaks a recent 10-bar range with direction aligned to liquidity taken earlier in the morning. both require a prior london sweep to avoid random entries.
when a signal is triggered, the tool automatically sets up entry, stop, and target levels. the entry happens at the bar close. the target and stop distances adjust based on which asset you selected (futures, gold, forex). the script draws the entry line, take-profit line, stop line, and also places a marker showing buy or sell direction. a trade table appears on the bottom right of the chart showing the signal type, entry price, stop distance, target distance, and real-time risk-to-reward ratio. if alerts are enabled, the trader will receive notifications for entry, stop hit, target hit, and automatic exit at 10:00 am et.
the built-in info panel provides live trading context:
• asset type currently selected
• session status (asian, london, pre-market, ny open, kill zone, etc)
• london sweep status (high swept, low swept, or both)
• current new york time displayed in am/pm format
• active sweep threshold and target parameters
• next expected market event such as asian open, london open, pre-market, ny open, kill zone start, session exit, or rth close
this gives traders a structured, real-time look at the market environment so they always know where they are within the trading day.
recommended usage:
• ensure the correct asset type is selected
• wait for london sweeps to occur (high, low, or both)
• watch for setups only inside the kill zone between 9:35 and 9:55 am et
• use the provided entry, stop, and target levels or refine according to your own risk rules
• always close trades by 10:00 am et since the morning algorithmic behaviour tapers off
• keep position sizing reasonable and follow your own risk management
important notes:
• the script does not place trades for you; it only signals
• it is tuned for intraday behaviour in the new york morning session
• performance outside the kill zone is intentionally limited
• sweep detection uses simplified logic for reliability and speed
• signals work best when combined with your own higher-timeframe bias or personal confirmation
this indicator is ideal for traders who follow ict concepts, smart money models, liquidity sweeps, kill zone execution, and structured session trading. it provides clean visuals, automated signals, and a complete on-screen trade model, making it easy to follow institutional trading behaviour without overcomplicating the chart.

Custom Horizontal Lines | Trade Symmetry📊 Custom Horizontal Lines
🔍 Overview
The Custom Horizontal Lines is a precision utility designed for traders who perform manual higher-timeframe analysis and want to preserve their marked price levels directly on the chart.
It doesn’t calculate or detect anything automatically — instead, it acts as your personal level memory, preserving your analyzed zones and reference prices throughout the session.
Ideal for traders who manually mark the High, Low, Open, Close, Mean Thresholds, and Quarter Levels of Order Blocks, Fair Value Gaps, Inversion Fair Value Gaps and Wicks before the trading day begins.
⚙️ Key Features
✅ Manual Level Entry — Input your analyzed price levels (OB, FVG, WICK,etc) directly into the indicator settings.
✅ Preserved Levels — Once entered, your lines stay visible and consistent — even after switching symbols, timeframes, or reloading the chart.
✅ Supports All Level Types — Store any kind of manually defined level: OB highs/lows, FVG boundaries, Wicks, Mean Thresholds, Quarter levels, or custom reference prices.
✅ Clean Visualization — Customize line color, style, and labels for easy visual organization.
✅ Session-Ready Workflow — Built for pre-market preparation — enter your HTF levels once, and trade around them all day.
✅ No Auto Calculations — 100% manual by design — ensuring only your analyzed levels are shown, exactly as you defined them.
💡 How to Use
Open the indicator’s settings and manually enter those price values.
The indicator will plot and preserve those exact levels on your chart.
Switch to your lower timeframe and observe how price reacts around them — without ever needing to redraw.
🎯 Why It’s Useful
Keeps your HTF levels organized and persistent across sessions.
Saves time by avoiding redrawing.
Fits perfectly into ICT / Smart Money trading workflows.
Ensures full manual control and precision over what’s displayed on your chart.
🧩 Ideal For
ICT and Smart Money traders
Institutional-style manual analysts
Traders marking Mean Thresholds, or Quarter Levels of OBs, FVGs, Wicks etc
Anyone who wants a clean, reliable way to preserve their manual analysis

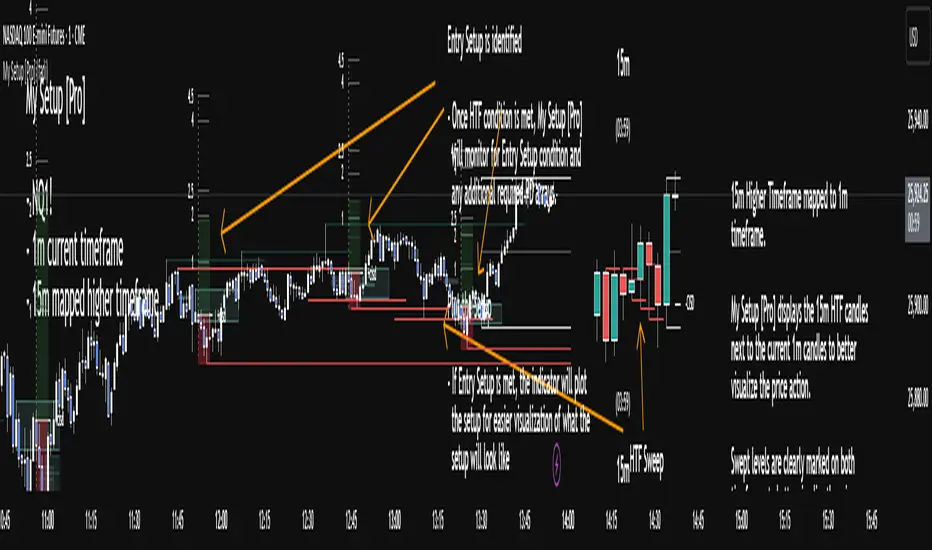
My setup [Pro] (fadi)My Setup is a powerful TradingView indicator that visualizes your trading strategy, helping you find high-probability setups with precision and discipline. It combines Higher Timeframe (HTF) context with Lower Timeframe (LTF) entries on a single chart, streamlining your trading process.
What It Does
Tracks your chosen timeframe and its paired higher timeframe for custom trade setups, so you don’t have to stay glued to the screen.
Plots clear Entry, Stop Loss, and Take Profit levels when your conditions align.
Customizes to your strategy with HTF triggers (e.g., sweeps, liquidity grabs) and LTF entries (e.g., Order Blocks, FVGs, Breakers).
Ensures discipline by only showing setups that meet all your rules, eliminating emotional trading and FOMO.
Backtest your edge by visualizing past setups to refine entries, stops, and confluences.
How It Works
Set Your HTF Trigger: Choose a market event like a sweep of a high/low, pivot point, or liquidity grab on the paired higher timeframe (e.g., 1H for a 5m chart).
Define Your LTF Entry: Select your entry model from a range of institutional concepts, such as Order Block, Fair Value Gap (FVG), Inverted FVG (iFVG), Breaker Block, Unicorn Model, and more, on the chart’s timeframe.
Add Confluence Filters: Stack conditions like requiring an FVG + Breaker for higher-probability setups.
See It on Your Chart: When a setup forms, it’s instantly plotted with Entry, Stop Loss, and Take Profit levels based on your Risk-to-Reward ratio.
Key Features
Multi-Timeframe Sync: Pair your chart’s timeframe (e.g., 5m) with a higher timeframe (e.g., 1H) for seamless analysis.
Institutional Tools: Supports a comprehensive suite of ICT concepts, including Order Blocks, FVGs, iFVGs, Breakers, Unicorn Model, and additional entry models.
Custom Risk Management: Set your Stop Loss and Take Profit levels with fixed R:R or measured moves using large range of entry and stop levels.
Session Filtering: Limit setups to specific trading sessions (e.g., London, New York) with timezone support.
Visual Clarity: Displays HTF candles and key levels on your chart for context, with customizable colors and styles.
Alerts: Get notified the moment a valid setup appears, even on live candles.
Who It’s For
Traders who want to systematize their ICT-based strategy on a single chart.
Those seeking to trade with discipline and avoid impulsive decisions.
Anyone looking to backtest and optimize their setups with clear, visual feedback.
Busy traders who need a tool to track their chart while they focus on life.
Why Choose My Setup ?
Save Time: Let the indicator track your chart and its paired timeframe.
Trade Confidently: Only take A+ setups that match your exact rules.
Learn and Improve: Analyze historical setups to refine your strategy.
Disclaimer of Warranties and Limitation of Liability for [My Setup ]
Please read this disclaimer carefully before using the [My Setup ] indicator (hereafter referred to as "the Software").
1. No Financial Advice
The Software is provided for educational and informational purposes only. The data, calculations, and signals generated by the Software are not, and should not be interpreted as, financial advice, investment advice, trading advice, or a recommendation or solicitation to buy, sell, or hold any security or financial instrument.
2. Assumption of Risk You acknowledge that trading and investing are inherently risky activities that carry a high potential for significant financial loss. All actions you take in the market, including but not limited to trade execution and risk management, are your sole responsibility. You agree to use the Software at your own sole risk. The creator shall not be held responsible or liable for any financial losses or damages you may incur as a result of using the Software.
3. No Warranty; "AS IS" Provision
The Software is provided "AS IS" and "AS AVAILABLE", without any warranties of any kind, either express or implied. The creator disclaims all warranties, including, but not limited to, implied warranties of merchantability, fitness for a particular purpose, accuracy, timeliness, completeness, and non-infringement.
The creator does not warrant that the Software will be error-free, uninterrupted, secure, or free of bugs, viruses, or other harmful components. You acknowledge that software is never wholly free from defects, and you are responsible for implementing your own procedures for data accuracy and security.
4. Limitation of Liability
TO THE MAXIMUM EXTENT PERMITTED BY APPLICABLE LAW, IN NO EVENT SHALL THE CREATOR, FADI ZEIDAN, BE LIABLE FOR ANY CLAIM, DAMAGES, OR OTHER LIABILITY, WHETHER IN AN ACTION OF CONTRACT, TORT, OR OTHERWISE, ARISING FROM, OUT OF, OR IN CONNECTION WITH THE SOFTWARE OR THE USE OR OTHER DEALINGS IN THE SOFTWARE.
This limitation of liability applies to any and all damages, including but not limited to:
Direct, indirect, incidental, special, consequential, or exemplary damages.
Loss of profits, revenue, data, or use.
Financial losses resulting from trading decisions made based on the Software.
Damages arising from software defects, interruptions, or inaccuracies.
5. Indemnification
You agree to indemnify, defend, and hold harmless the creator, Fadi Zeidan, from and against any and all claims, liabilities, damages, losses, or expenses, including reasonable attorneys' fees and costs, arising out of or in any way connected with your access to or use of the Software.
6. Acknowledgment and Agreement
By accessing, installing, or using the [My Setup ] indicator, you acknowledge that you have read, understood, and agree to be bound by the terms of this disclaimer. If you do not agree with these terms, you must not use the Software.
Fair Value Gap + VI + FP_FVGThe Ultimate Fair Value Gap Indicator that you need.
Based on ICT's updated definition post 2022, if volume imbalances exists, we have to include the VI as part of the FVG.
As of 2025, ICT has introduced the suspension block - which is a FVG that has VI on both sides of the candle. This indicator shows the suspension block via the border.
Inclusive of HTF and current TF.
First Presented FVG is also included with the option to toggle current day and historical days.

Bardhi's ICT Killzone & PivotsThis indicator is a complete ICT-style session and liquidity toolkit designed for precision trading. It automatically marks the most important trading windows (“Killzones”) and provides powerful tools for tracking price action around them.
Key Features:
Killzones: Automatically plots Asia, London, and New York (AM, Lunch, PM) sessions with customizable colors, transparency, and labels.
Session Highs, Lows & Midpoints: Dynamic lines for killzone highs/lows, optional midpoints, and alerts when levels are broken.
Range Statistics: Displays the real-time range of each session plus rolling averages in a customizable table.
Day / Week / Month Levels: Plots opens, highs, lows, and separators for higher-timeframe reference points with optional alerts.
Custom Opening Prices: Define up to 8 custom open lines (e.g., True Day Open, 06:00, 10:00) with cutoff times.
Vertical Timestamp Lines: Highlight important intraday times such as news events or personal strategy triggers.
Day-of-Week Labels: Clean labels for each day, with the option to hide weekends.
Full Customization: Adjustable label sizes, colors, line styles, transparency, and drawing limits.
Why Use It?
This tool combines killzone sessions, pivots, higher-timeframe opens/highs/lows, and range statistics into one clean, automated package. It saves time drawing manually, keeps charts organized, and helps traders apply ICT concepts consistently.

STOCK EXCHANGE + SILVER BULLET FRAMESThis script is an updated version of the " NY/LDN/TOK Stock Exchange Opening Hours " script.
Objective
Displays global stock exchange sessions (New York, London, Tokyo) with session frames, highs/lows, and opening lines. Includes ICT Silver Bullet windows (NY, London, Tokyo) with configurable shading. Past sessions are frozen at close, ongoing sessions update dynamically until closure, and upcoming sessions are pre-drawn. Fully customizable with options for weekends, labels, padding, opacity, and individual session toggles.
It is designed to help traders quickly interpret market context, liquidity zones, and session-based price behavior.
Main Features
Past sessions (historical data)
• Session Frames:
• Each box is frozen at the session’s close.
• The left edge aligns with the opening time, while the right edge is fixed at the closing time.
• The top and bottom reflect the highest and lowest prices during the session.
• Session Labels:
• Names (NY, LDN, TOK) displayed above the frame, aligned left, in the same color as the frame.
• Opening Lines:
• Vertical dotted lines mark the start of each session.
Ongoing and upcoming sessions (live market)
• Dynamic Session Frames:
• The right edge is locked at the future close time.
• The top and bottom update in real time as new highs and lows form.
• Labels and Lines:
• The session label is visible above the active frame.
• Opening lines are drawn as soon as the session begins.
Silver Bullet Time Windows (ICT concept)
• Highlights key liquidity windows within sessions:
• New York: 10:00–11:00 and 14:00–15:00
• London: 08:00–09:00
• Tokyo: 09:00–10:00
• Silver Bullet zones are shaded with configurable opacity (default 5%).
Customization and Options
• Enable or disable individual sessions (NY, London, Tokyo).
• Toggle weekend display (frames and Silver Bullets).
• Adjust label size, padding, and text visibility.
• Control frame opacity (default 0%).
• Optimized memory management with automatic pruning of old graphical objects.

SMC Pro - Smart Money Concepts🎯 SMC Pro - Complete Smart Money Concepts Trading System with Trade Alerts
The Most Comprehensive SMC/ICT Indicator Built for Real Traders
After extensive research into what retail and prop firm traders actually need, I've created SMC Pro - a complete Smart Money Concepts indicator that solves the biggest problems with existing SMC tools.
🚀 What Makes This Different:
✅ COMPLETE TRADE SETUP ALERTS - Not just structure breaks! Get full trade setups with:
* Entry, Stop Loss & Target Prices
* Risk/Reward Calculations
* 5-Point Confluence Scoring
* Visual Trade Labels on Chart
✅ INTELLIGENT FILTERING - No more chart spam:
* Minimum structure size filter (ATR-based)
* Minimum bars between signals
* Volume confirmation for order blocks
* Clean, actionable signals only
📊 Core Features:
1. Market Structure Analysis
* Break of Structure (BOS) with smart filtering
* Change of Character (CHoCH) detection
* Clear directional bias identification
* Prevents excessive signal clustering
2. Order Blocks
* Volume-confirmed institutional zones
* Automatic mitigation tracking
* Entry points for trade setups
3. Fair Value Gaps
* ATR-based size filtering
* Automatic fill detection
* Confluence factor for trades
4. Liquidity Zones
* Buy-side & Sell-side liquidity mapping
* Sweep detection with alerts
* Target zones for trades
5. Risk Management Integration
* Automatic R:R calculation
* Position sizing guidance
* Minimum R:R filtering (default 2:1)
🎯 5-Point Trade Confluence System:
1. Market structure alignment
2. Recent structure break (BOS/CHoCH)
3. Order block at current price
4. Fair value gap support
5. Liquidity target available
Minimum score of 3/5 required for trade alerts (adjustable)
⚙️ Smart Settings:
* Swing Length: 10 (default) - adjust for sensitivity
* Min Bars Between Signals: 20 - prevents clustering
* Min Structure Size: 1.0 ATR - filters noise
* Min Confluence Score: 3/5 - quality control
* Target R:R: 2:1 minimum - proper risk management
📱 Alert Types:
* 🎯 Trade Setup Alerts - Complete entry/exit plans
* ✅ Structure Breaks - BOS & CHoCH notifications
* 📊 Order Block Touch - Price at key zones
* 💧 Liquidity Sweeps - Stop hunts detected
💡 Pro Tips:
* Start with default settings
* Use on 15m+ timeframes for cleaner signals
* Increase confluence requirement for prop firm trading
* Enable volume confirmation for higher quality OBs
* Dashboard shows real-time setup status
🔧 If You Get Too Many Signals:
* Increase Swing Length to 15-20
* Increase Min Bars Between to 30-50
* Increase Min Structure Size to 1.5 ATR
* Raise Min Confluence Score to 4 or 5
This indicator is the result of solving real problems traders face with SMC/ICT concepts. It's designed to give you clean, actionable trade setups - not just mark up your chart with zones.
Built with Pine Script v6 for maximum performance and reliability.
Trade with confluence. Trade with confidence. Trade smart. 🎯

Silver BulletSilver Bullet is a trading tool built for finding cleaner, higher-probability setups. It focuses on key windows of market movement and adds helpful tools like daily range levels and candlestick patterns.
Whether you’re trading breakouts or reversals, Silver Bullet gives you a clearer view of the market and more confidence in your setups.
⸻
🔹 Trading Setup #1: Macro Time
The Macro Time setting offers two modes: Macro Bullet and Silver Bullet. Both help traders focus on specific times when the market tends to deliver clean moves.
• Macro Bullet is based on the high and low of a full macro session. It automatically detects the session’s range and bias, then offers optimal entries for either Long or Short setups. Once the session resolves, it provides Fibonacci-based levels for entry, target, and stop loss.
• Silver Bullet is based on ICT concepts and focuses on the hourly range for London, NY AM, and NY PM sessions. It’s designed for quick time blocks and highlights key levels as the session unfolds.
To use this setup, set Macro Time to “ICT Sessions” and select your preferred mode under Bullet Mode.
⸻
🔹 Trading Setup #2: Daily Range
Enable Daily Range to draw Fibonacci levels based on either the previous day’s candle or the current day’s developing range. These levels help you identify potential support, resistance, and midpoint zones throughout the day.
With the current day’s range, levels automatically update in real time as new highs or lows form — keeping your chart aligned with evolving price action.
⸻
🔹 Trading Setup #3: Candlestick Patterns
Turn on Candlestick Patterns to automatically highlight clean reversal signals such as Hammers, Hanging Men, Shooting Stars, and Tweezers. Each pattern is detected using specific criteria and trend filters to reduce noise and improve reliability. They work especially well as confirmation signals around key levels or session zones.
Silver Bullet brings structure, clarity, and precision to your intraday trading. By combining time-based bias, price action levels, and pattern recognition, it helps you trade with purpose — not guesswork. Use one setup or combine all three for a complete view of the market, tailored to your style and session of choice.

MirPapa:ICT:HTF: FVG Threeple# MirPapa:ICT:FVG Double HTF
**Version:** Pine Script® v6
**Author:** © goodia
**License:** MPL-2.0 (Mozilla Public License 2.0)
---
## Overview
“MirPapa:ICT:FVG Double HTF” is a TradingView indicator that identifies and visualizes Fair Value Gaps (FVG) on two higher time frames (HighTF and MidTF) simultaneously. It can also draw FVG boxes on the current chart’s time frame. When “Overlap Mode” is enabled, the indicator displays only the intersection of HighTF and MidTF FVG areas.
---
## Key Features
- **HighTF FVG**
- Detects bullish and bearish FVGs on a user-selected upper time frame (e.g., 4H).
- Draws colored boxes around gap ranges, optionally with a midpoint line.
- Automatically extends boxes on every bar and finalizes (recolors) them after a specified number of closes beyond the gap.
- **MidTF FVG**
- Same as HighTF FVG but for a second, intermediate time frame (e.g., 1H).
- Runs in parallel to HighTF logic, with separate color and transparency settings.
- **CurrentTF FVG (Optional)**
- If enabled, draws FVG boxes using the chart’s own time frame.
- Behaves identically: extends until broken by price, then finalizes.
- **Overlap Mode**
- When enabled, hides all individual HighTF and MidTF boxes.
- Instead, computes and displays only their overlapping rectangle(s)—separate for bullish and bearish gaps.
---
## Inputs & Configuration
- **Common Inputs**
- **Enable High/Mid Overlap Mode** (`boolean`): Show only overlapping HighTF + MidTF FVG areas.
- **Box Close Color** (`color`): Color applied to any FVG box when it is finalized.
- **HighTF FVG Settings**
- **HighTF Label** (`dropdown`): Choose a Korean label (e.g., “4시간”) that maps to a Pine timeframe (e.g., “240”).
- **Enable HighTF FVG Boxes** (`boolean`): Toggle drawing of HighTF FVG boxes.
- **Enable HighTF FVG Midlines** (`boolean`): Toggle midpoint line inside each HighTF box.
- **HighTF FVG Close Count** (`integer` 1–10): Number of closes beyond the gap before finalizing the box.
- **HighTF FVG Bull Color** (`color`): Fill & border color for bullish HighTF gaps.
- **HighTF FVG Bear Color** (`color`): Fill & border color for bearish HighTF gaps.
- **HighTF Box Transparency** (`integer` 1–100): Opacity level for HighTF box fills.
- **MidTF FVG Settings**
- **MidTF Label** (`dropdown`): Choose a Korean label (e.g., “1시간”) mapped to a Pine timeframe.
- **Enable MidTF FVG Boxes** (`boolean`): Toggle drawing of MidTF FVG boxes.
- **Enable MidTF FVG Midlines** (`boolean`): Toggle midpoint line inside each MidTF box.
- **MidTF FVG Close Count** (`integer` 1–10): Number of closes beyond the gap before finalizing the box.
- **MidTF FVG Bull Color** (`color`): Fill & border color for bullish MidTF gaps.
- **MidTF FVG Bear Color** (`color`): Fill & border color for bearish MidTF gaps.
- **MidTF Box Transparency** (`integer` 1–100): Opacity level for MidTF box fills.
- **CurrentTF FVG Settings**
- **Enable CurrentTF FVG Boxes** (`boolean`): Draw FVG boxes on the chart’s own timeframe.
- **Enable CurrentTF FVG Midlines** (`boolean`): Toggle midpoint line inside each CurrentTF box.
- **CurrentTF FVG Close Count** (`integer` 1–10): Number of closes beyond the gap before finalizing the box.
- **CurrentTF FVG Bull Color** (`color`): Fill & border color for bullish CurrentTF gaps.
- **CurrentTF FVG Bear Color** (`color`): Fill & border color for bearish CurrentTF gaps.
- **CurrentTF Box Transparency** (`integer` 1–100): Opacity level for CurrentTF box fills.
---
## How It Works
1. **Time Frame Conversion**
Korean labels (e.g., “4시간”, “1시간”) are converted internally to Pine timeframe strings via `GetHtfFromLabel()`.
2. **Data Retrieval**
For each chosen TF (HighTF, MidTF, and optionally CurrentTF), the script fetches OHLC and historical values using `GetHTFrevised()`.
- Tracks `bar_index` from that TF to align box drawing on the chart’s base timeframe.
3. **Box Lifecycle**
- **Creation**: On each new TF bar, if a bullish gap (`low > high `) or bearish gap (`low > high `) is detected, `CreateBoxData()` registers a new `BoxData` struct and draws an initial box.
- **Extension**: On every chart bar, `ProcessBoxDatas()` extends each active box’s right edge and updates internal “touch stage” and volume.
- **Finalization**: After the specified number of closes beyond the gap, `setBoxFinalize()` disables the box and changes its border & fill to the “Box Close Color”.
4. **Overlap Mode**
- When enabled, HighTF and MidTF boxes are not drawn individually.
- Instead, at each bar, the script iterates over all active HighTF boxes and all active MidTF boxes, computes their intersection rectangle (if any), and draws only that overlapping area (distinct handling for bullish vs. bearish gaps).
---
## Installation & Usage
1. **Copy & Paste**
Copy the entire Pine Script code into TradingView’s Pine Editor.
Click “Add to Chart.”
2. **Configure Inputs**
- Choose your HighTF and MidTF via the dropdown menus.
- Enable or disable FVG boxes/midlines for each TF.
- Adjust colors, transparency, and “Close Count” settings to taste.
- Toggle “Overlap Mode” if you only want to see common areas between HighTF and MidTF gaps.
3. **Interpretation**
- **Active Boxes** extend to the right as new bars form. When price closes beyond a gap (per “Close Count”), the box is finalized and recolored to the close color.
- In **Overlap Mode**, you’ll see only the overlapping region between HighTF and MidTF gaps, updated on every bar.
Enjoy precise FVG visualization across multiple time frames!
SMC ICT – Simplified Daily Trend & Reversal AnalyzerThis Pine Script provides a simplified approach to analyzing daily trends and potential reversals using concepts inspired by Smart Money Concepts (SMC) and ICT (Inner Circle Trader).
What It Does:
• Detects daily uptrend and downtrend conditions by comparing the current daily high/low to the previous day’s values.
• Highlights potential bullish or bearish reversal zones when price behavior suggests a shift in sentiment.
• Automatically draws dashed lines for the previous day's high and low.
• Labels these high/low levels for quick visual reference.
How to Use:
Apply this indicator to any timeframe chart. Use the plotted trend markers to assess daily direction and potential reversal signals. The dashed lines (previous high/low) can be used as reference points for liquidity zones or break/retest entries.
User Interface:
The indicator displays labels and shapes in English. This script is intended for educational and trading workflow enhancement purposes.
Note:
This is an open-source tool designed for clarity and basic SMC/ICT application. It is best used in combination with other confluences like FVGs, order blocks, and liquidity sweeps.

10 AM NY Box - By KaVeH📦 10 AM New York Box till 4 PM — \
--By KaVeH--
This indicator automatically draws a price range box that captures the high and low between 10:00 AM and 11:00 AM New York Time (Eastern Time) on "5-minute charts".
### 🔍 What It Does
The "10 AM NY Box" is a simple but powerful visualization tool for day traders and ICT-based strategies. It highlights a key hourly session right after the "New York open" — often a time of increased volatility, liquidity grabs, and the formation of critical intraday highs or lows.
### 📊 Features
Time Window: Customizable start and end hours (defaults: 10 AM to 11 AM NY time).
Box Color: Customizable with transparency.
Chart Restriction: The indicator "only works on 5-minute charts" to ensure accuracy and prevent misalignment.
### ⚙️ Inputs
- 'Start Hour (NY Time)' – Default: 10
- 'End Hour (NY Time)' – Default: 11
- 'Box Color' – Default: Red with transparency
### 📈 How It Works
- During the specified time window, the script tracks the "highest high and lowest low".
- Once the time window ends, it draws a "box" from the starting to the ending time, extending a little beyond to keep it visible.
- Each day's box is created independently, and only once per day.
### 🧠 Use Cases
- Spotting potential liquidity zones
- Identifying breakout or fakeout traps
- Aligning with ICT concepts like "FVG", "BAG", or "Judas Swing"
### ⚠️ Notes & Limitations
- "Only functions on 5-minute timeframes" — this is intentional to maintain session accuracy.
- Does not repaint.
- Time is aligned to **New York (Eastern Time)** regardless of your chart’s timezone.
- One box per day.

Liquidity Levels (Smart Swing Lows)Liquidity Levels — Smart Swing Low Detection
Efficient Liquidity Sweep Visualization for Smart Money Traders
This script automatically identifies and plots liquidity-rich swing lows based on pivot logic, filters them to remove redundant levels, and overlays daily highs/lows for added context — giving Smart Money Concept (SMC) traders a clean, actionable map of liquidity.
It’s designed to be minimal yet powerful: perfect for spotting potential liquidity grabs, mitigation zones, and sweep targets with zero chart clutter.
🔍 What This Script Does:
Detects Smart Swing Lows
Uses fixed pivot detection (left = 3, right = customizable) to identify structurally significant swing lows.
Filters out swing lows that are too close together using a percentage-based spacing threshold to reduce noise.
Mitigation Cleanup Logic
Tracks whether recent price action breaches past swing lows.
If breached, the swing level is automatically removed, keeping only relevant, unmitigated liquidity levels on your chart.
Plots Daily Highs and Lows
Each new trading day, horizontal rays mark the prior day’s high and low — useful for identifying resting liquidity and possible sweep zones.
Labeling and Style Customization
Optional labels for swing lows.
Full control over label size, color, and visibility to match any chart aesthetic.
Timeframe Filtering
Runs exclusively on 5m, 10m, and 15m charts to ensure optimal reliability and signal clarity.
⚙️ Customization Features:
Pivot sensitivity (Right side control)
Minimum distance between swing lows (in %)
Label visibility, size, and color
Line width and colors for both swing levels and daily highs/lows
Mitigation cleanup lookback length
💡 How to Use:
Add the script to a qualifying intraday chart (5–15m).
Use the swing low levels to monitor liquidity-rich zones.
Combine with your personal strategy to identify liquidity grabs, potential reversal zones, or entry points following a sweep.
Let the built-in cleanup logic remove any already-mitigated levels so you can focus on active targets.
🚀 What Makes It Unique:
This isn’t just another pivot plotter — it’s a smart, self-cleaning SMC tool designed for modern liquidity-based trading strategies.
A must-have for traders using concepts like liquidity grabs, mitigation blocks, or sweep-to-reverse trade models.
🔗 Best used in combination with:
✅ First FVG — Opening Range Fair Value Gap Detector: Pinpoint the day’s first imbalance zone for intraday setups.
✅ ICT SMC Liquidity Grabs + OB + Fibonacci OTE Levels: Confluence-based entries powered by liquidity logic, order blocks, and premium/discount zones.
Used together, these scripts form a complete Smart Money toolkit — helping you build high-probability setups with confidence, clarity, and clean charts.
