Oversold RSI with tight SL Strategy (by Coinrule)This is one of the best strategies that can be used to get familiar with technical indicators and start to include them in your trading bot rules.
ENTRY
1. This trading system uses the RSI ( Relative Strength Index ) to anticipate good points to enter positions. RSI is a technical indicator frequently used in trading. It works by measuring the speed and change of price movements to determine whether a coin is oversold (indicating a good entry point) or overbought (indicating a point of exit/entry for a short position). The RSI oscillates between 0 and 100 and is traditionally considered overbought when over 70 and oversold when below 30.
2. To pick the right moment to buy, the strategy enters a trade when the RSI falls below 30 indicating the coin is oversold and primed for a trend reversal.
EXIT
The strategy then exits the position when the price appreciates 7% from the point of entry. The position also maintains a tight stop-loss and closes the position if the price depreciates 1% from the entry price. The idea behind this is to cut your losing trades fast and let your winners ride.
The best time frame for this strategy based on our backtesting data is the daily. Shorter time frames can also work well on certain coins, however in our experience, the daily works best. Feel free to experiment with this script and test it on a variety of your coins! With our backtesting data a trading fee of 0.1% is taken into account. The fee is aligned to the base fee applied on Binance, which is the largest cryptocurrency exchange by volume. In the example shown, this strategy made a handsome net profit of 39.31% on Chainlink with 61.54% of trades being profitable.
Cari skrip untuk "entry"

Oversold RSI with Tight Stop-Loss Strategy (by Coinrule)KRAKEN:LINKUSD
This is one of the best strategies that can be used to get familiar with technical indicators and start to include them in your rules on Coinrule .
ENTRY
1. This trading system uses the RSI (Relative Strength Index) to anticipate good points to enter positions. RSI is a technical indicator frequently used in trading. It works by measuring the speed and change of price movements to determine whether a coin is oversold (indicating a good entry point) or overbought (indicating a point of exit/entry for a short position). The RSI oscillates between 0 and 100 and is traditionally considered overbought when over 70 and oversold when below 30.
2. To pick the right moment to buy, the strategy enters a trade when the RSI falls below 30 indicating the coin is oversold and primed for a trend reversal.
EXIT
The strategy then exits the position when the price appreciates 7% from the point of entry. The position also maintains a tight stop-loss and closes the position if the price depreciates 1% from the entry price. The idea behind this is to cut your losing trades fast and let your winners ride.
The best time frame for this strategy based on our back testing data is the daily. Shorter time frames can also work well on certain coins, however in our experience, the daily works best. Feel free to experiment with this script and test it on a variety of your coins! With our back testing data a trading fee of 0.1% is taken into account. The fee is aligned to the base fee applied on Binance, which is the largest cryptocurrency exchange by volume. In the example shown, this strategy made a handsome net profit of 52.6% on Chainlink with 66.67% of trades being profitable.
You can execute this strategy on your favorite exchanges with Coinrule .

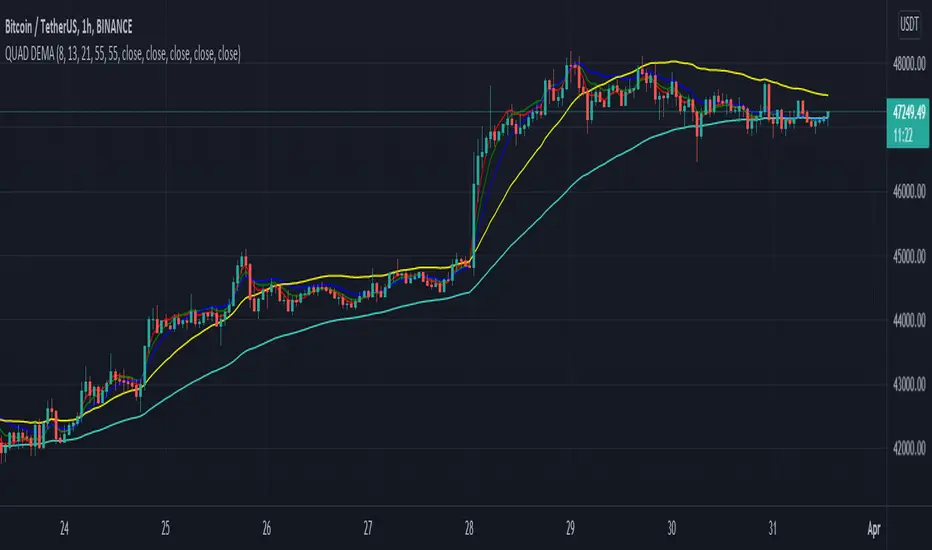
QUAD DEMAHey Folks,
Just created my first script, It's basically 4 DEMA in one indicator which helps you not to use multiple indicators.
It's more accurate than Exponential Moving Average & give signals much prior to the breakout, very helpful in short timeframes.
Tweak it according to your preference
Instructions to use
-When 55 DEMA crosses all the DEMA it's a clear signal for uptrend or downtrend which can potentially be a entry or exit points.
-Don't depend on this when all the DEMA's are entangled to each other.
-Use Stochastic RSI for better approach in entry.
-Most accurate in 1hr time frame for short term entry.
Enjoy!
10 EMA StrategyThis indicator shows you:
- The first bullish candle to close below EMA 10
- The first bearish candle to close above EMA 10.
Optional:
You can enable the exit signals in the setting. This will show you:
- If you are long (bullish), it will signal when the first bullish candle closes below EMA 10
- If you are short (bearish), it will signal when the first bearish candle closes above EMA 10
You can also change the EMA 10, to another length, if you want to try something else.

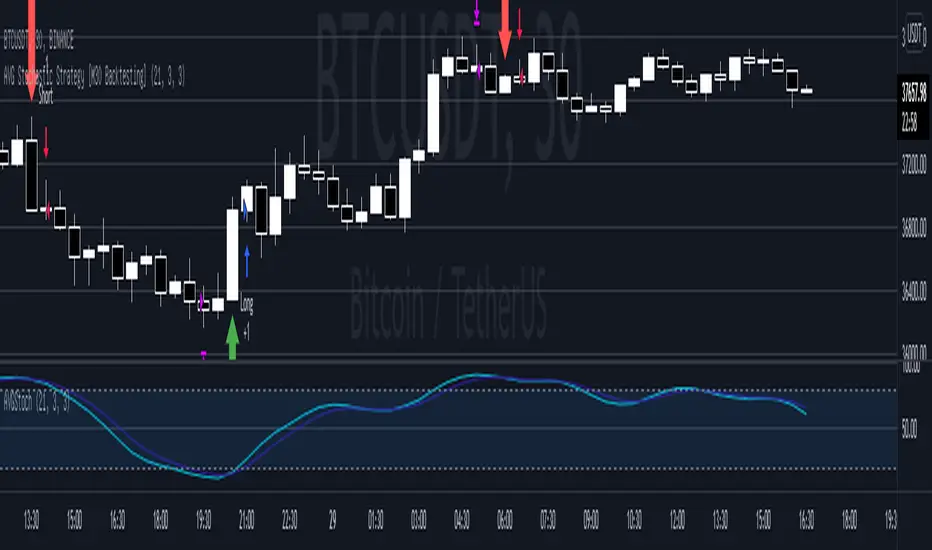
AVG Stochastic Strategy [M30 Backtesting]1. AVG Stochastic Calculate
1.1 AVG %K is calculated by apply EMA with smooth K period on Average of Original Stochastic %k & %d
+ avg_k=ema((%k+%d)/2,smoothK)
1.2 AVG %D is calculated by apply EMA with %d period on AVG %K
+ avg_d=ema(avg_k,periodD)
2. Parameter
+ %K Length: 21
+ %K Smoothing: 3
+ %D Smoothing: 3
+ Symbol: BTC/USDT
+ Timeframe: M30
+ Pyramiding: Maximum 3 orders at the same direction.
3. Signal
3.1 Buy Signal
+ Entry: AVG %K crossover AVG %D and AVG %D < 20
+ Exit: AVG %D > 80
3.2 Sell Signal
+ Entry: AVG %K crossunder AVG %D and AVG %D > 80
+ Exit: AVG %D < 20
Bjorgum Key Levels
Key Levels Aims to capture 3 of the most significant points in price action
Breakouts
False Breakouts (Traps)
Back Checks
These 3 points alone, if properly identified, can be some of the most significant points of movement in the price history of an asset and bring significant gains to traders, if capitalized on. Here are a few examples of these setups
Breakouts
Breakouts can bring significant rallies as the market swings one sided after key levels are breached. This entry type can bring large trending runs to follow. Momentum is on your side, but the trade off is a higher entry.
False Breakouts
Also known as a bull trap or a bear trap, false breaks can lead to swift and significant reversals and potential for a large and sudden move to the opposite side. When a key level breakout fails to hold, parties entering to capitalize on the "epic breakout" can get left holding the bag forcing them to exit at a loss, which can double the force of pressure. Traps can bring swift gains from good entry prices. However, price is still in a larger trend against you so momentum is weak, so price action is susceptible to roll over.
Backchecks
Back checks are pull backs in trend that find middle ground to the 2 areas already described. Both momentum and entry price are decent, but risk is defined as a key level has flipped offering entry with stops below demand, or above supply.
Combining these 3 methods helps to diversify risk, understand trend development, and bring steady gains. This script helps to identify these points to traders with analysis of key levels, price structure, and trend direction, while providing visual signals and alerts for when they occur.
Best of luck in your coding and trading and thank you for your support

Hotch v1.02 RSI+Fractals/VWAP Bands/Smoothed Moving Average. In this script the RSI is used the limit number of displayed fractals to only those fractals that are triggered in the RSI Overbought and Oversold areas. This helps keep the chart cleaner looking when combined with other indicators so other icons that are plotted above and below candles are not covered up.
For example if the RSI drops below 30 the next fractal would be displayed.
If the RSI stays below 30 each fractal would be displayed.
If the RSI dips below 30 and returns above 30 before there is a fractal is displayed, the next valid fractal would still be displayed.
With optimization of the RSI values this indicator can be used in confluence with the included VWAP bands and Moving average to find trend reversal entry points for trades. Also recommended is to use a divergence identifying lower indicator as a secondary confirmation of trade entry.
Example of a potential long entry using the displayed chart.
1) RSI under 30
2) Price was recently outside of your chosen VWAP multiple.
3) a fractal was triggered.
Additionaly:
4) Use other indicators or other confluences for a stronger trade signal.
5) Use your preferred method of determining entry price stop loss and take profit.
NOTE: Fractals normally paint two bars behind the current bar. In this code, with the combination of the RSI and Fractal Trigger, the fractal paints an icon on the current bar.

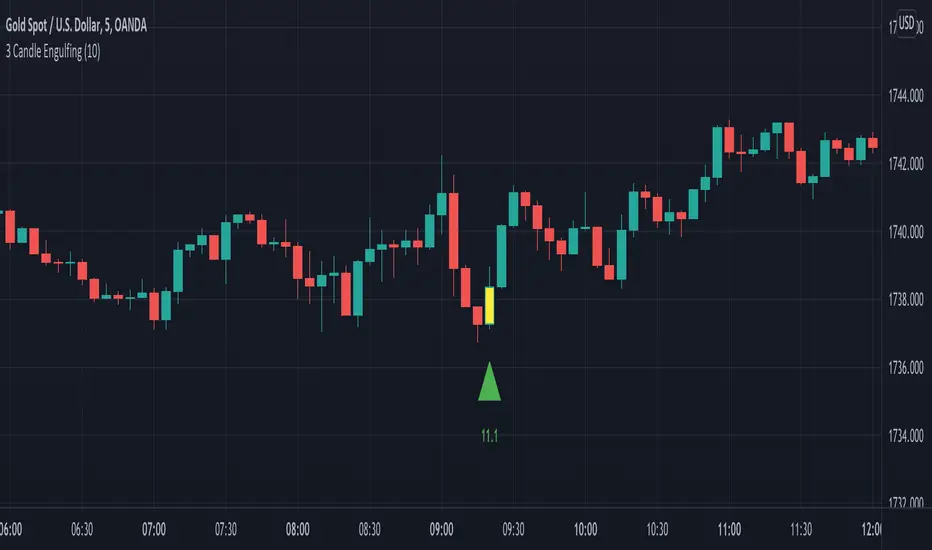
3 Candle EngulfingThree Line Strike Candlestick Pattern (3 candle Engulfing pattern) to help you detect sniper entry point mostly for (forex)
You can use this as an indicator to detect an entry point for your trade.
Please cross-check the Macro and Micro trend and don't go against the trend. Also use other indicators to confirm your entry.
You can set the engulfing minimum pips value (Default is set to 10 pips)
How it works:
Yellow candle with an up green triangle means a long entry
White candle with a down green triangle means a short entry
3Commas BotBjorgum 3Commas Bot
A strategy in a box to get you started today
With 3rd party API providers growing in popularity, many are turning to automating their strategies on their favorite assets. With so many options and layers of customization possible, TradingView offers a place no better for young or even experienced coders to build a platform from to meet these needs. 3Commas has offered easy access with straight forward TradingView compatibility. Before long many have their brokers hooked up and are ready to send their alerts (or perhaps they have been trying with mixed success for some time now) only they realize there might just be a little bit more to building a strategy that they are comfortable letting out of their sight to trade their money while they eat, sleep, etc. Many may have ideas for entry criteria they are excited to try, but further questions arise... "What about risk mitigation?" "How can I set stop or limit orders?" "Is there not some basic shell of a strategy that has laid some of this out for me to get me going?"
Well now there is just that. This strategy is meant for those that have begun to delve into the world of algorithmic trading providing a template that offers risk defined positions complete with stops, limit orders, and even trailing stops should one so choose to employ any of these criteria. It provides a framework that is easily manipulated (with some basic working knowledge of pine coding) to encompass ones own ideas and entry criteria, while also providing an already functioning strategy.
The default settings have a basic 1:1 risk to reward ratio, which sets a limit and a stop equal distance from the entry. The entry is a simple MA cross (up for long, down for short). There a variety of MA's to choose from and the user can define the lengths of the averages. The ratio can be adjusted from the menu along with a volatility based adder (ATR) that helps to distance a stop from support or resistance. These values are calculated off the swing low/high of the user defined lookback period. Risk is calculated from position entry to stop, and projected upwards to the limit as a function of the desired risk to reward ratio. Of note: the default settings include 0.05% commissions. Competitive commissions of the leading cryptocurrency exchanges are .1% round trip (one buy and one sell) for market orders. There is also some slippage to allow time for alerts to be sent and orders to fill giving the back test results a more accurate representation of real time conditions. Its recommended to research the going rates for your exchange and set them to default for the strategy you use or build.
To get started a user would:
1) Make a copy of the code and paste in their bot keys in the area provided under the "3Comma Keys" section
- eg. Long bot "start deal" copied from 3commas in to define "Long" etc. (code is commented)
2) Place alert on desired asset with desired settings ensuring to select "Order fills and alert() function calls"
3) Paste webhook into the webhook box and select webhook URL alerts (3rd party provided webhook)
3) Delete contents of alert message box and replace with {{strategy.order.alert_message}} and nothing else
- the codes will be sent to the webhook appropriately as the strategy enters and exits positions. Only 1 alert is needed
settings used for the display image:
1hr chart on BTCUSD
-ATR stop
-Risk adjustment 1.2
-ATR multiplier 1.3
-RnR 0.6
-MAs HEMA/SMA
-MA Length 50/100
-Order size percent of equity
-Trail trigger 60% of target
Experiment with your own settings on your crypto of choice or implement your own code!
Implementing your trailing stop (optional)
Among the options for possible settings is a trailing stop. This stop will ratchet higher once triggered as a function of the Average True Range (ATR). There is a variable level to choose where the user would like to begin trailing the stop during the trade. The level can be assigned with a decimal between 0 and 1 (eg. 0.5 = 50% of the distance between entry and the target which must be exceeded before the trail triggers to begin). This can allow for some dips to occur during the trade possibly keeping you in the trade for longer, while potentially reducing risk of drawdown over time. The default for this setting is 0 meaning unless adjusted, the trail will trigger on entry if the trailing stop exit method is selected. An example can be seen below:
Again, optional as well is the choice to implement a limit order. If one were to select a trailing stop they could choose not to set a limit, which could allow a trail to run further until hit. Drawdowns of this strategy would be foregoing locking gains at highs on target on other trades. This is a trade-off the user can decide on and test. An example of this working in favor can be observed below:
Conclusion
Although a simple strategy is implemented here, the benefits of this script allow a user a starting platform to build their strategies from with built in risk mitigation. This allows the user to sidestep some of the potential difficulties' that can arise while learning Pine and taking on the endeavor of automating their trading strategies. It is meant as an aid, a structure, and an educational piece that can be seen as a "pick-up-and-go" strategy with easy 3Commas compatibility. Additionally, this can help users become more comfortable with strategy alert messages and sending strings in the form of alerts from Pine. As well, FAQs are often littered with questions regarding "strategy.exit" calls, how to implement stops. how to properly set a trailing stop based on ATR, and more. The time this can save an individual to get started is likely of the best "take-aways" here.
Happy trading

Linear Regression & RSI Multi-Function Screener with Table-LabelHi fellow traders..
Happy to share a Linear Regression & RSI Multi-Function Custom Screener with Table-Labels...
The Screener scans for Linear Regression 2-SD Breakouts and RSI OB/OS levels for the coded tickers and gives Summary alerts
Uses Tables (dynamica resizing) for the scanner output instead of standard labels!
This Screener cum indicator collection has two distinct objectives..
1. Attempt re-entry into trending trades.
2. Attempt Counter trend trades using linear regression , RSI and Zigzag.
Briefly about the Screener functions..
a. It uses TABLES as Labels a FIRST for any Screener on TV.
b. Tables dynamically resize based on criteria..
c. Alerts for breakouts of the UPPER and the LOWER regression channels.(2 SD)
d. In addition to LinReg it also Screens RSI for OB/OS levels so a multifunction Screener.
e. Of course has the standard summary Alerts and programmable format for Custom functions.
f. Uses only the inbuilt Auto Fib and Lin Reg code for the screener.(No proprietary stuff)
g. The auto Zigzag code is derived(Auto fib).
Question what are all these doing in a single screener ??
ZigZag is very useful in determining Trend Up or Down from one Pivot to another.
So Once you have a firm view of the Current Trend for your chosen timeframe and ticker…
We can consider few possible trading scenarios..
a. Re-entry in an Up Trend - Combination of OS Rsi And a Lower Channel breach followed by a re-entry back into the regression channel CAN be used as an effective re-entry.
b. Similarily one can join a Down Trend on OB Rsi and Upper Channel line breach followed by re-entry into the regression channel.
If ZigZag signals a range-bound market, bound within channel lines then the Upper breakout can be used to Sell and vice-versa!
In short many possibilities for using these functions together with Scanner and Alerts.
This facilitates timely PROFITABLE Trending and Counter trend opportunities across multiple tickers.
You must give a thorough READ to the various available tutorials on ZigZag / Regression and Fib retracements before attempting counter trend trades using these tools!!
A small TIP – Markets are sideways or consolidating 70% of the time!!
Acknowledgements: - Thanks a lot DGTRD for the Auto ZigZag code and also for the eagerness to help wherever possible..Respect!!
Disclaimer: The Alerts and Screener are just few tools among many and not any kind of Buy/Sell recommendations. Unless you have sufficient trading experience please consult a Financial advisor before investing real money.
*The alerts are set for crossovers however for viewing tickers trading above or below the channel use code in line 343 and 344 after setting up the Alerts!
** RSI alerts are disabled by default to avoid clutter, but if needed one can activate code lines 441,442,444 and 445
Wish you all, Happy Profitable Trading!

Portfolio Backtester Engine█ OVERVIEW
Portfolio Backtester Engine (PBTE). This tool will allow you to backtest strategies across multiple securities at once. Allowing you to easier understand if your strategy is robust. If you are familiar with the PineCoders backtesting engine , then you will find this indicator pleasant to work with as it is an adaptation based on that work. Much of the functionality has been kept the same, or enhanced, with some minor adjustments I made on the account of creating a more subjectively intuitive tool.
█ HISTORY
The original purpose of the backtesting engine (`BTE`) was to bridge the gap between strategies and studies . Previously, strategies did not contain the ability to send alerts, but were necessary for backtesting. Studies on the other hand were necessary for sending alerts, but could not provide backtesting results . Often, traders would have to manage two separate Pine scripts to take advantage of each feature, this was less than ideal.
The `BTE` published by PineCoders offered a solution to this issue by generating backtesting results under the context of a study(). This allowed traders to backtest their strategy and simultaneously generate alerts for automated trading, thus eliminating the need for a separate strategy() script (though, even converting the engine to a strategy was made simple by the PineCoders!).
Fast forward a couple years and PineScript evolved beyond these issues and alerts were introduced into strategies. The BTE was not quite as necessary anymore, but is still extremely useful as it contains extra features and data not found under the strategy() context. Below is an excerpt of features contained by the BTE:
"""
More than `40` built-in strategies,
Customizable components,
Coupling with your own external indicator,
Simple conversion from Study to Strategy modes,
Post-Exit analysis to search for alternate trade outcomes,
Use of the Data Window to show detailed bar by bar trade information and global statistics, including some not provided by TV backtesting,
Plotting of reminders and generation of alerts on in-trade events.
"""
Before I go any further, I want to be clear that the BTE is STILL a good tool and it is STILL very useful. The Portfolio Backtesting Engine I am introducing is only a tangental advancement and not to be confused as a replacement, this tool would not have been possible without the `BTE`.
█ THE PROBLEM
Most strategies built in Pine are limited by one thing. Data. Backtesting should be a rigorous process and researchers should examine the performance of their strategy across all market regimes; that includes, bullish and bearish markets, ranging markets, low volatility and high volatility. Depending on your TV subscription The Pine Engine is limited to 5k-20k historical bars available for backtesting, which can often leave the strategy results wanting. As a general rule of thumb, strategies should be tested across a quantity of historical bars which will allow for at least 100 trades. In many cases, the lack of historical bars available for backtesting and frequency of the strategy signals produces less than 100 trades, rendering your strategy results inconclusive.
█ THE SOLUTION
In order to be confident that we have a robust strategy we must test it across all market regimes and we must have over 100 trades. To do this effectively, researchers can use the Portfolio Backtesting Engine (PBTE).
By testing a strategy across a carefully selected portfolio of securities, researchers can now gather 5k-20k historical bars per security! Currently, the PTBE allows up to 5 securities, which amounts to 25k-100k historical bars.
█ HOW TO USE
1 — Add the indicator to your chart.
• Confirm inputs. These will be the most important initial values which you can change later by clicking the gear icon ⚙ and opening up the settings of the indicator.
2 — Select a portfolio.
• You will want to spend some time carefully selecting a portfolio of securities.
• Each security should be uncorrelated.
• The entire portfolio should contain a mix of different market regimes.
You should understand that strategies generally take advantage of one particular type of market regime. (trending, ranging, low/high volatility)
For example, the default RSI strategy is typically advantageous during ranging markets, whereas a typical moving average crossover strategy is advantageous in trending markets.
If you were to use the standard RSI strategy during a trending market, you might be selling when you should be buying.
Similarily, if you use an SMA crossover during a ranging market, you will find that the MA's may produce many false signals.
Even if you build a strategy that is designed to be used only in a trending market, it is still best to select a portfolio of all market regimes
as you will be able to test how your strategy will perform when the market does something unexpected.
3 — Test a built-in strategy or add your own.
• Navigate to gear icon ⚙ (settings) of strategy.
• Choose your options.
• Select a Main Entry Strat and Alternate Entry Strat .
• If you want to add your own strategy, you will need to modify the source code and follow the built-in example.
• You will only need to generate (buy 1 / sell -1/ neutral 0) signals.
• Select a Filter , by default these are all off.
• Select an Entry Stop - This will be your stop loss placed at the trade entry.
• Select Pyamiding - This will allow you to stack positions. By default this is off.
• Select Hard Exits - You can also think of these as Take Profits.
• Let the strategy run and take note of the display tables results.
• Portfolio - Shows each security.
• The strategy runs on each asset in your portfolio.
• The initial capital is equally distributed across each security.
So if you have 5 securities and a starting capital of 100,000$ then each security will run the strategy starting with 20,000$
The total row will aggregate the results on a bar by bar basis showing the total results of your initial capital.
• Net Profit (NP) - Shows profitability.
• Number of Trades (#T) - Shows # of trades taken during backtesting period.
• Typically will want to see this number greater than 100 on the "Total" row.
• Average Trade Length (ATL) - Shows average # of days in a trade.
• Maximum Drawdown (MD ) - Max peak-to-valley equity drawdown during backtesting period.
• This number defines the minimum amount of capital required to trade the system.
• Typically, this shouldn’t be lower than 34% and we will want to allow for at least 50% beyond this number.
• Maximum Loss (ML) - Shows largest loss experienced on a per-trade basis.
• Normally, don’t want to exceed more than 1-2 % of equity.
• Maximum Drawdown Duration (MDD) - The longest duration of a drawdown in equity prior to a new equity peak.
• This number is important to help us psychologically understand how long we can expect to wait for a new peak in account equity.
• Maximum Consecutive Losses (MCL) - The max consecutive losses endured throughout the backtesting period.
• Another important metric for trader psychology, this will help you understand how many losses you should be prepared to handle.
• Profit to Maximum Drawdown (P:MD) - A ratio for the average profit to the maximum drawdown.
• The higher the ratio is, the better. Large profits and small losses contribute to a good PMD.
• This metric allows us to examine the profit with respect to risk.
• Profit Loss Ratio (P:L) - Average profit over the average loss.
• Typically this number should be higher in trend following systems.
• Mean reversion systems show lower values, but compensate with a better win %.
• Percent Winners (% W) - The percentage of winning trades.
• Trend systems will usually have lower win percentages, since statistically the market is only trending roughly 30% of the time.
• Mean reversion systems typically should have a high % W.
• Time Percentage (Time %) - The amount of time that the system has an open position.
• The more time you are in the market, the more you are exposed to market risk, not to mention you could be using that money for something else right?
• Return on Investment (ROI) - Your Net Profit over your initial investment, represented as a percentage.
• You want this number to be positive and high.
• Open Profit (OP) - If the strategy has any open positions, the floating value will be represented here.
• Trading Days (TD) - An important metric showing how many days the strategy was active.
• This is good to know and will be valuable in understanding how long you will need to run this strategy in order to achieve results.
█ FEATURES
These are additional features that extend the original `BTE` features.
- Portfolio backtesting.
- Color coded performance results.
- Circuit Breakers that will stop trading.
- Position reversals on exit. (Simulating the function of always in the market. Similar to strategy.entry functionality)
- Whipsaw Filter
- Moving Average Filter
- Minimum Change Filter
- % Gain Equity Exit
- Popular strategies, (MACD, MA cross, supertrend)
Below are features that were excluded from the original `BTE`
- 2 stage in-trade stops with kick-in rules (This was a subjective decision to remove. I found it to be complex and thwarted my use of the `BTE` for some time.)
- Simple conversion from Study to Strategy modes. (Not possible with multiple securities)
- Coupling with your own external indicator (Not really practical to use with multiple securities, but could be used if signals were generated based on some indicator which was not based on the current chart)
- Use of the Data Window to show detailed bar by bar trade information and global statistics.
- Post Exit Analysis.
- Plotting of reminders and generation of alerts on in-trade events.
- Alerts (These may be added in the future by request when I find the time.)
█ THANKS
The whole PineCoders team for all their shared knowledge and original publication of the BTE and Richard Weismann for his ideas on building robust strategies.
═════════════════════════════════════════════════════════════════════════

RSI+PA+DCA StrategyDear Tradingview community,
This RSI based trading strategy is created as a training exercise. I am not a professional trader, but a committed hobbyist. This not a finished trading strategy meant for trading, but more a combination of different trading ideas I liked to explore deeper. The aim with this exercise was to gain more knowledge and understanding about price averaging and dollar cost averaging strategies. Aside that I wanted to learn how to program a pyramiding strategy, how to plot different order entry layers and how to open positions on a specific time interval.
In this script I adapted code from a couple of strategy examples by Coinrule . Who wrote simple and powerful examples of RSI based strategies and pyramiding strategies.
Also the HOWTO scripts shared by vitvlkv were very helpful for this exercise. In the script description you can find all the sources to the code.
A PA strategy could be a helpful addition to ease the 'stress-management to buy when price drops and resolution in selling when the price is rising' (Coinrule).
The idea behind the strategy is fairly simple and is based on an RSI strategy of buying low. A position is entered when the RSI and moving average conditions are met. The position is closed when it reaches a specified take profit percentage. As soon as the first the position is openend multiple PA (price average) layers are setup based on a specified percentage of price drop. When the price crosses the layer another position with somewhat the same amount of assets is entered. This causes the average cost price (the red plot line) to decrease. If the price drops more, another similar amount of assets is bought with another price average decrease as result. When the price starts rising again the different positions are separately closed when each reaches its specified take profit. The positions can be re-openend when the price drops again. And so on. When the price rises more and crosses over the average price and reached the specified take profit on top of it, it closes all the positions at once and cancels all orders. From that moment on it waits for another price dip before it opens a new position.
Another option is to activate a DCA function that opens a position based on a fixed specified amount. It enters a position at the start of every week and only when there are already other positions openend and if the current price is below the average price of the position. Like this buying on a time interval can help lowering the average price in case the market is down.
I read in some articles that price averaging is also called dollar cost averaging as the result is somewhat the same. Although DCA is really based on buying on fixed time intervals. These strategies are both considered long term investment strategies that can be profitable in the long run and are not suitable for short term investment schemes. The downturn is that the postion size increases when the general market trend is going down and that you have to patiently wait until the market start rising again.
Another notable aspect is that the logic in this strategy works the way it does because the entries are exited based on the FIFO (first in first out) close entry rule. This means that the first exit is applied to the first entry position that is openend. In other words that when the third entry reaches its take profit level and exits, it actually exits the first entry. If you take a close look in the 'List of Trades' of your Strategy Tester panel, you can see that some 'Long1' entries are closed by an 'Exit 3' and not by an 'Exit 1'. This means that your trade partly loses, but causes a decrease in average price that is later balanced out by lower or repeated entering and closing other positions. You can change this logic to a real sequential way of closing your entries, but this changes the averaging logic considerably. In case you want to test this you need to change, in this line in the strategy call 'close_entries_rule = "FIFO"', the word FIFO to ANY.
In the settings you can specify the percentage of portfolio to use for each trade to spread the risk and for each order a trading fee of 0.075% is calculated.

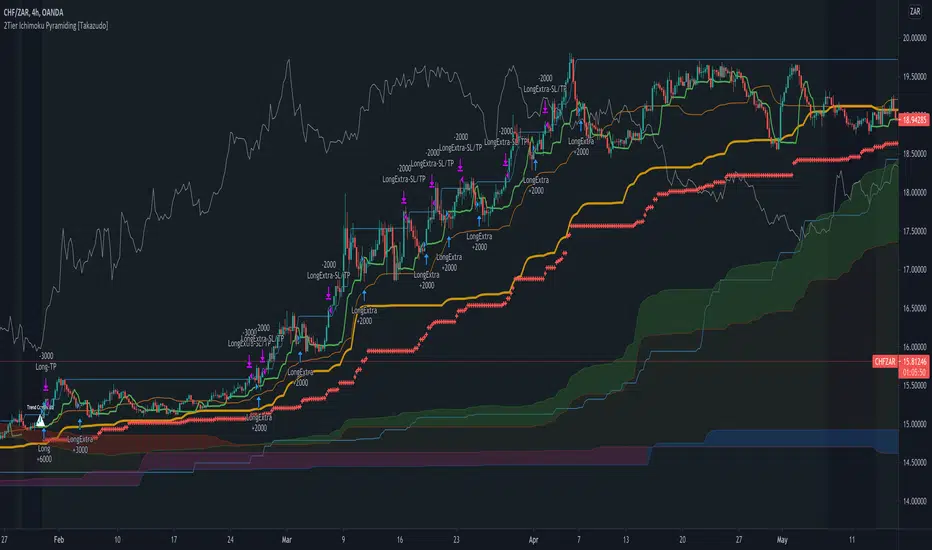
2Tier Ichimoku Pyramiding [Takazudo]Ichimoku based pyramiding strategy example that was tested on 4h TF.
makes the first entry when 2Tier Kumo breakout was occurred.
makes the extra entries when higher-low (on long) or lower-high (on short) was occurred.
uses short term MACD reversal + stop entry as a confirmation of the trend.
slack trailing stop loss.
changes entry quantity by the percentage of SL.
prevents the ranged entry.
This is just an example of how to trade using Ichimoku signals.
RSI Moving Average with Signal LineDefault values:
RSI = white
RSI Prime ( RSI of RSI ) = yellow
EMA 34 = blue
EMA 55 = red
They are listed in order of reactiveness to price changes. Think of them like the Williams Alligator...
White and yellow work the fastest, with WHITE being signal and YELLOW being trigger. Great for LTF
Blue and red work the slowest, with BLUE being frequently testing RED as support/resistance. Great for HTF
Long Entry:
RSIs both > SMAS (signal)
RSI > RSI Prime (confirmation)
Long Exit:
RSI < RSI Prime (signal)
RSIs both < SMAs (confirmation)
Short Entry:
RSIs both < SMAS (signal)
RSI < RSI Prime (confirmation)
Short Exit:
RSI > RSI Prime (signal)
RSIs both > SMAS (confirmation)

Triple EMA Scalper low lag stratHi all,
This strategy is based on the Amazing scalper for majors with risk management by SoftKill21
The change is in lines 11-20 where the sma's are replaced with Triple ema's to
lower the lag.
The original author is SoftKill21. His explanation is repeated below:
Best suited for 1M time frame and majors currency pairs.
Note that I tried it at 3M time frame.
Its made of :
Ema ( exponential moving average ) , long period 25
Ema ( exponential moving average ) Predictive, long period 50,
Ema ( exponential moving average ) Predictive, long period 100
Risk management , risking % of equity per trade using stop loss and take profits levels.
Long Entry:
When the Ema 25 cross up through the 50 Ema and 100 EMA . and we are in london or new york session( very important the session, imagine if we have only american or european currencies, its best to test it)
Short Entry:
When the Ema 25 cross down through the 50 Ema and 100 EMA , and we are in london or new york session( very important the session, imagine if we have only american or european currencies, its best to test it)
Exit:
TargetPrice: 5-10 pips
Stop loss: 9-12 pips

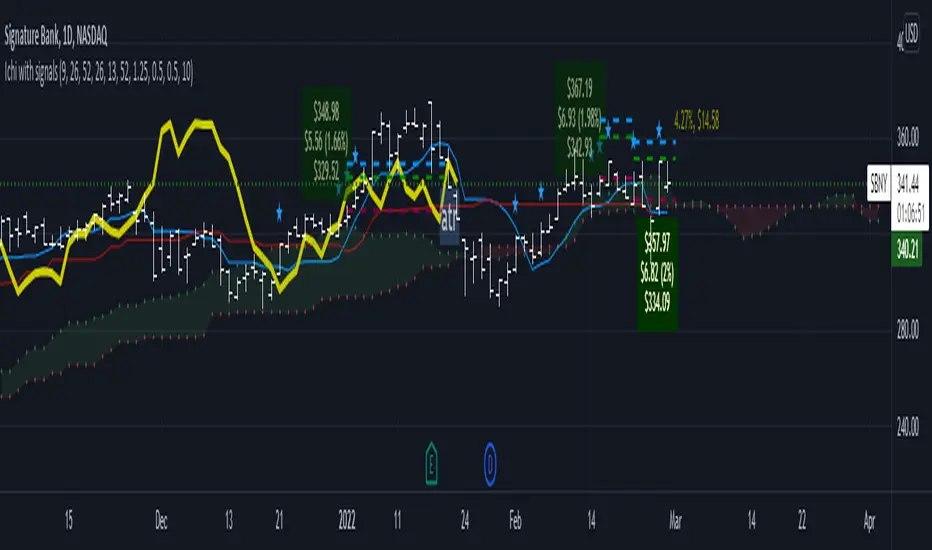
Ichimoku Cloud LONG and SHORT indicatorsThis simple script uses 4 rules from Ichimoku Cloud indicator to marks position entry points.
The idea is that by entering a long position just when these 4 criteria are met, you can capture a 2-3% plus move within the next few days:
1. The conversion line is above the base line
2. The price is above the clouds
3. The lagging span is above the clouds
4. The rightmost cloud is green
The same 4 criteria but inverted will indicate a short entry.
In order to avoid 'stale' entries which can lead to chasing, we want the price and conversion line crossovers to be recent, within the past few days. Ideally we want to enter before close on the day the entry signal is given so that we can capture any potential gap up (or down if short). Often the price will make a nice move the next day or day after. If any of the criteria become invalidated, or if after 4-5 days there hasn't been significant movement, then it was a false alarm.
This script will show the basic Ichimoku Cloud indicators, plus labels for bearish and bullish price and conversion line crossovers as well as LONG and SHOT indicators to show when the entry criteria have been met.
Amazing scalper for majors with risk managementHello,
Today I am glad to bring you an amazing simple and efficient scalper strategy.
Best suited for 1M time frame and majors currency pairs.
Its made of :
Ema (exponential moving average) , long period 25
Ema(exponential moving average) Predictive, long period 50,
Ema(exponential moving average) Predictive, long period 100
Risk management , risking % of equity per trade using stop loss and take profits levels.
Long Entry:
When the Ema 25 cross up through the 50 Ema and 100 EMA. and we are in london or new york session( very important the session, imagine if we have only american or european currencies, its best to test it)
Short Entry:
When the Ema 25 cross down through the 50 Ema and 100 EMA, and we are in london or new york session( very important the session, imagine if we have only american or european currencies, its best to test it)
Exit:
TargetPrice: 5-10 pips
Stop loss: 9-12 pips
Hope you enjoy it :)

Percent Calculator OverlayFirst and foremost: I'm inspired to publish my scripts by the other member's who publish quality, detailed scripts -a token of my appreciation and support, Thank You.
The percent calculator overlay is an extension of my Percent Calculator indicator that allows one to visualize the percent metrics they're interested in trading: it''s function is to simply output the target price from either the close or ones trade-entry based on a desired percent return on investment (R.O.I.) then plots it on top of the chart as an area plot and notes anytime in the past the desired conditions were met with a {flag "Success"}.
Say you want to profit 15% from your entry: open the settings and plug in your entry value and the number 15 into the appropriate settings and the indicator displays what the target price should be (rounded to two decimal places) right on the chart with the area as well as the horizontal line which is enabled by the "track price" setting.
The percent calculator overlay also goes one step further by finding the average percent return on investment over a desired interval of time (the default is 20 candles) as well as allows one to adjust the size of the price move the average percent return on investment is being calculated for which is displayed on the chart as circles and also displays a horizontal line for the most current value with the enabled "track price" setting.
NOTE: unlike the Percent Calculator the Percent Calculator Overlay creates a visual record of the number of success' the programmed parameters have achieved (based on the closing prices) which self adjusts when the "size of the move" is changed.
Say you want to find the average percent return on investment for a 3 candle swing over a 200 candle interval of time: open the settings and plug the number 200 into the interval setting and the number 3 into the price-move setting and the indicator displays what the average 3 candle swing returns on investment and plots what the target price would be to achieve the average return given the current close (or entry price) with the gray circles and the horizontal line enabled with the "track price" setting.
Practical Application: comparing ones desired return on investment to the average return on investment can help determine how realistic ones goals are... it's unlikely to achieve 100% return on investment if the average is only around 10% (given the parameters one is working within) but on the other hand achieving 5% return on investment is highly likely. By visualizing roughly how often the given parameters have achieved success on the chart one can become a lot more comfortable, confident, and accurate with their goals.
Forward Looking Statement: I believe in the not too distant future plug and play automated trading systems will be made available to the general public. Over the past 4 years we have seen brokers offer free charting software, commission free trading, and now fractional shares; I don't think it will be much longer before we can simply click a few buttons and tell the computer to enter when the stochastic is overbought/sold and exit with a predefined percent gain (and to repeat that process indefinitely). -Imagine the data moving 2-3-4 times a second, the liquidity flowing like Niagara falls, and 95% of the working population not only starting to invest but gains the extra cash flow they desperately need.
Beta testing: please comment or send me a message if you happen to stumble over any bugs or have any suggestions for improvement.

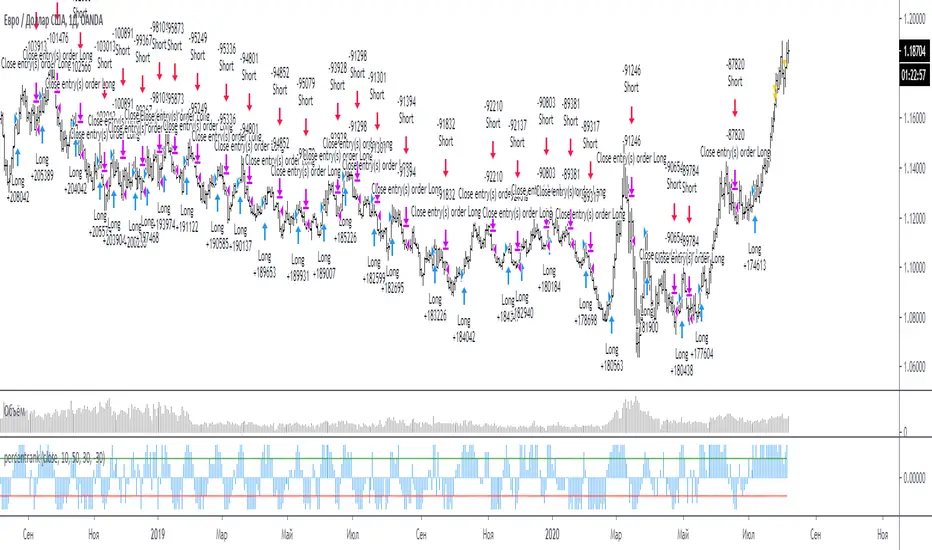
percentrank strategySrategy for percentrank
Percent rank is the percents of how many previous values was less than or equal to the current value of given series.
long entry: intersection line 1 from bottom to top
short entry: crossing line 2 from top to bottom
Стратегия для индикатора percentrank
Процентный рейтинг — это процент от количества предыдущих значений, которые были меньше или равны текущему значению данной серии.
вход в лонг: пересечение line 1 снизу вверх
вход в шорт: пересечение line 2 сверху вниз
Short in Bollinger Band Down trend (Weekly and Daily) // © PlanTradePlanMM
// 6/14/2020
// ---------------------------------------------------
// Name: Short in Bollinger Band Down trend (Weekly and Daily)
// ---------------------------------------------------
// Key Points in this study:
// 1. Short in BB Lower band, probability of price going down is more than 50%
// 2. Short at the top 1/4 of Lower band (EMA - Lower line), Stop is EMA, tartget is Lower line; it matches risk:/reward=1:3 naturally
//
// Draw Lines:
// BB Lower : is the Target (Black line)
// BB EMA : is the initial Stop (Black line)
// ShortLine : EMA - 1/4 of (Stop-target), which matches risk:/reward=1:3
// Prepare Zone : between EMA and ShortLine
// shortPrice : Blue dot line only showing when has Short position, Which shows entry price.
// StopPrice : Black dot line only showing when has Short position, Which shows updated stop price.
//
// Add SMA50 to filter the trend. Price <= SMA, allow to short
//
// What (Condition): in BB down trend band
// When (Price action): Price cross below ShortLine;
// How (Trading Plan): Short at ShortLine;
// Initial Stop is EMA;
// Initial Target is BB Lower Line;
// FollowUp: if price moves down first, and EMA is below Short Price. Move stop to EMA, At least "make even" in this trade;
// if Price touched Short Line again and goes down, new EMA will be the updated stop
//
// Exit: 1. Initial stop -- "Stop" when down first, Close above stop
// 2. Target reached -- "TR" when down quickly, Target reached
// 3. make even -- "ME" when small down and up, Exit at Entry Price
// 4. Small Winner -- "SM" when EMA below Entry price, Exit when Close above EMA
//
// --------------
// Because there are too many flags in up trend study already, I created this down trend script separately.
// Uptrend study is good for SPY, QQQ, and strong stocks.
// Downtrend Study is good for weak ETF, stock, and (-2x, -3x) ETFs, such as FAZ, UVXY, USO, XOP, AAL, CCL
// -----------------------------------------------------------------------------------------------------------------
// Back test Weekly and daily chart for SPY, QQQ, XOP, AAL, BA, MMM, FAZ, UVXY
// The best sample is FAZ Weekly chart.
// When SPY and QQQ are good in long term up trend, these (-2x, -3x) ETFs are always going down in long term.
// Some of them are not allowed to short. I used option Put/Put spread for the short entry.
//

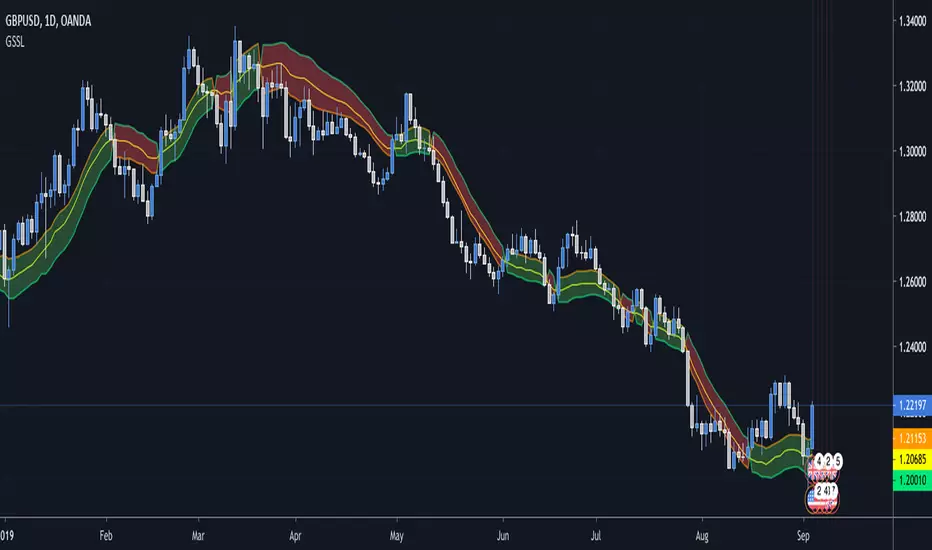
SSL Crossover + MA choiceThis indicator builds on the SSL channel code by ErwinBeckers @
I have added options for diff MA's to be used in the SSL channel and crossover indicators for buy/sell signals
default MA is set to Arnaud Legaux, but you can set it to whatever you like - original was a Simple Moving Average by ErwinBeckers
The indicator will not repaint as the signals are drawn after close of crossover candles
Let me know if you have any suggestions - happy to add more functionality

Mirror MACD by Trader JayThis is my take on the metatrader indicator, the mirror macd. Works pretty good on Forex, haven't tested on anything else
Enter long after the Blue Line Cross Up the Red Line and EXIT after the Green line Cross Up the Red Line (above the Blue Line).
For the opposite position : ENTER SELL after the Red Line Cross Down.

Generalized SSL by Vts// Generalized SSL:
// This is the very first time the SSL indicator, whose acronym I ignore, is on Tradingview.
// It is based on moving averages of the highs and lows.
// Similar channel indicators can be found, whereas
// this one implements the persistency inside the channel, which is rather tricky.
// The green line is the base line which decides entries and exits, possibly with trailing stops.
// With respect to the original version, here one can play with different moving averages.
// The default settings are (10,SMA)
//
// Vitelot/Yanez/Vts March 2019