Adaptive Support/Resistance EMA IndicatorThis indicator automatically identifies and displays the optimal Exponential Moving Average (EMA) period for the current market conditions by analyzing how well different EMAs act as support or resistance levels.
How It Works
Adaptive Period Selection:
The indicator tests 33 different EMA periods (ranging from 5 to 400, including Fibonacci numbers like 8, 13, 21, 34, 55, 89, 144, 233, 377) and scores each based on how effectively it functions as support or resistance.
Intelligent Scoring System:
Each EMA is evaluated using three key metrics:
Respect Rate - Percentage of time price stays on the correct side of the EMA (above for support, below for resistance)
Successful Bounces - Number of times price approached the EMA and reversed without breaking through
Break Severity - Penalties for failed breaks, weighted by both depth and duration of the violation
Trend-Aware Behavior:
Uptrend (price > 50 EMA): Finds the EMA that best acts as a support floor below price
Downtrend (price < 50 EMA): Finds the EMA that best acts as a resistance ceiling above price
Adaptive Features:
Dynamic Lookback: Automatically adjusts analysis period (50-200 bars) based on market volatility
Sticky Selection: Won't switch EMAs unless new choice shows significant improvement (8% threshold by default)
Update Frequency: Recalculates every 20 bars or immediately during high volatility periods
Visual Elements
EMA Display:
Green line = Support (in uptrends)
Red line = Resistance (in downtrends)
Optional glow effect for enhanced visibility
Optional fill between price and EMA
Labels:
Shows "SUP " or "RES " when the selected EMA changes
Markers appear only when there's a meaningful change
Info Table:
Displays real-time statistics:
Current EMA period
Role (Support or Resistance)
Adaptive lookback length
Number of successful bounces
Number of breaks
Break severity score (color-coded: green < 5, yellow 5-20, red > 20)
Key Advantages
No manual EMA period selection needed
Adapts to changing market conditions automatically
Considers both bounce quality and break severity
Reduces whipsaws through sticky selection logic
Provides transparency with detailed performance metrics
Settings
Performance Settings:
Min/Max Lookback: Range for adaptive analysis window
Update Frequency: How often to recalculate (higher = faster performance)
Sticky Threshold: Required improvement % to switch EMAs
Detection Settings:
Touch Threshold: How close price must get to count as a "touch"
Bounce Window: Bars to confirm a successful bounce vs break
Visual Settings:
Customizable support/resistance colors
Toggle glow and fill effects
Show/hide info table and change markers
Cari skrip untuk "ema"

EMA 20/50/200 - Warning Note Before Cross EMA 20/50/200 - Smart Cross Detection with Customizable Alerts
A clean and minimalistic indicator that tracks three key Exponential Moving Averages (20, 50, and 200) with intelligent near-cross detection and customizable warning system.
═══════════════════════════════════════════════════════════════════
📊 KEY FEATURES
✓ Triple EMA System
• EMA 20 (Red) - Fast/Short-term trend
• EMA 50 (Yellow) - Medium/Intermediate trend
• EMA 200 (Green) - Slow/Long-term trend & major support/resistance
✓ Smart Near-Cross Detection
• Get warned BEFORE crosses happen (not after)
• Adjustable threshold percentage (how close is "close")
• Automatic hiding after cross to prevent false signals
• Configurable lookback period
✓ Dual Warning System
• Price Label: Appears directly on chart near EMAs
• Info Table: Positioned anywhere on your chart
• Both show distance percentage and direction
• Dynamic positioning to avoid blocking candles
✓ Color-Coded Alerts
• GREEN warning = Bullish cross approaching (EMA 20 crossing UP through EMA 50)
• RED warning = Bearish cross approaching (EMA 20 crossing DOWN through EMA 50)
✓ Cross Signal Detection
• Golden Cross (EMA 50 crosses above EMA 200)
• Death Cross (EMA 50 crosses below EMA 200)
• Fast crosses (EMA 20 and EMA 50)
═══════════════════════════════════════════════════════════════════
⚙️ CUSTOMIZATION OPTIONS
Warning Settings:
• Custom warning text for bull/bear signals
• Adjustable opacity for better visibility
• Toggle distance and direction display
• Flexible table positioning (9 positions available)
• 5 text size options
Alert Settings:
• Golden/Death Cross alerts
• Fast cross alerts (20/50)
• Near-cross warnings (before it happens)
• All alerts are non-repainting
Display Options:
• Show/hide each EMA individually
• Toggle all signals on/off
• Adjustable threshold sensitivity
• Dynamic label positioning
═══════════════════════════════════════════════════════════════════
🎯 HOW TO USE
1. ADD TO CHART
Simply add the indicator to any chart and timeframe
2. ADJUST THRESHOLD
Default is 0.5% - increase for less frequent warnings, decrease for earlier warnings
3. SET UP ALERTS
Create alerts for:
• Near-cross warnings (get notified before the cross)
• Actual crosses (when EMA 20 crosses EMA 50)
• Golden/Death crosses (major trend changes)
4. CUSTOMIZE APPEARANCE
• Change warning text to your language
• Adjust opacity for your chart theme
• Position table where it's most convenient
• Choose label size for visibility
═══════════════════════════════════════════════════════════════════
💡 TRADING TIPS
- Use the near-cross warning to prepare entries/exits BEFORE the cross happens
- Green warning = Prepare for potential long position
- Red warning = Prepare for potential short position
- Combine with other indicators for confirmation
- Higher timeframes = more reliable signals
- Warning disappears after cross to avoid confusion
═══════════════════════════════════════════════════════════════════
🔧 TECHNICAL DETAILS
- Pine Script v6
- Non-repainting (all signals confirm on bar close)
- Works on all timeframes
- Works on all instruments (stocks, crypto, forex, futures)
- Lightweight and efficient
- No external data sources required
═══════════════════════════════════════════════════════════════════
📝 SETTINGS GUIDE
Near Cross Settings:
• Threshold %: How close EMAs must be to trigger warning (default 0.5%)
• Lookback Bars: Hide warning for X bars after a cross (default 3)
Warning Note Style:
• Text Size: Tiny to Huge
• Colors: Customize bull/bear warning colors
• Position: Place table anywhere on chart
• Opacity: 0 (solid) to 90 (very transparent)
Price Label:
• Size: Tiny to Large
• Opacity: Control transparency
• Auto-positioning: Moves to avoid blocking candles
Custom Text:
• Bull/Bear warning messages
• Toggle distance display
• Toggle direction display
═══════════════════════════════════════════════════════════════════
⚠️ IMPORTANT NOTES
- Warnings only appear BEFORE crosses, not after
- After a cross happens, warning is hidden for the lookback period
- Adjust threshold if you're getting too many/too few warnings
- This is a trend-following indicator - best used with confirmation
- Always use proper risk management
═══════════════════════════════════════════════════════════════════
Happy Trading! 📈📉
If you find this indicator useful, please give it a boost and leave a comment!
For questions or suggestions, feel free to reach out.

T3 Moving Average with Multiple EMAsT3 Moving Average with Multiple EMAs
Short Title: T3 + EMAs
Overview
The T3 Moving Average with Multiple EMAs is a versatile trend-following indicator that combines the smooth, adaptive T3 Moving Average with eight customizable multi-timeframe Exponential Moving Averages (EMAs). Designed for traders seeking clarity in trend direction and momentum, this indicator overlays on the price chart to highlight dynamic support/resistance levels and trend alignment across multiple timeframes.
Key Features
T3 Moving Average: A highly responsive, smoothed moving average (default: 9-period, 0.7 volume factor) that reduces lag while maintaining accuracy, ideal for identifying short-term trends and reversals.
Eight Multi-Timeframe EMAs: Plots eight EMAs (default lengths: 8, 13, 21, 34, 55, 89, 144, 233) sourced from user-defined timeframes (e.g., 1m, 5m, 15m, 1h, 4h), providing a comprehensive view of short-, medium-, and long-term trends.
Customizable Timeframes: Each EMA can be independently set to a specific timeframe, allowing traders to analyze cross-timeframe trend alignment.
Theme Support: Offers "Dark" and "Light" themes with optimized colors for visual clarity and chart compatibility.
Flexible Parameters: Adjust T3 length, volume factor, EMA lengths, and timeframes to suit various markets and trading styles (scalping, swing trading, or long-term investing).
How It Works
The T3 Moving Average is calculated using a multi-stage EMA formula weighted by a volume factor, offering smoother trend tracking than traditional EMAs. The eight EMAs, sourced from higher or lower timeframes using request.security, provide a layered perspective on price trends. Faster EMAs (e.g., 8, 13) react to short-term price movements, while slower EMAs (e.g., 144, 233) reflect longer-term trends. The indicator plots all lines on the price chart with distinct, theme-adjusted colors for easy identification.
Usage
Trend Identification: Use the T3 MA for short-term trend signals and the EMAs to confirm broader trend direction. A price above multiple EMAs suggests a bullish trend; below indicates bearish.
EMA Crossovers: Watch for crossovers between faster and slower EMAs (e.g., 8 crossing 21) for potential entry/exit signals.
Support/Resistance: Treat slower EMAs (e.g., 89, 144) as dynamic support/resistance levels, especially on higher timeframes.
Timeframe Alignment: Align trades with the trend direction of higher-timeframe EMAs for higher-probability setups.
Customization: Adjust T3 and EMA settings to match your trading style or asset volatility.
Settings
T3 Parameters:
Length (default: 9): Period for T3 calculation.
Volume Factor (default: 0.7): Controls T3 smoothness (0.1–1.0).
EMA Parameters:
Lengths (default: 8, 13, 21, 34, 55, 89, 144, 233): Period for each EMA.
Timeframes (default: 5m, 5m, 15m, 15m, 1h, 1h, 4h, 4h): Select from 1m, 5m, 15m, 30m, 1h, 4h, D, W, or M.
Theme: Choose "Dark" (vibrant colors) or "Light" (softer colors) for chart compatibility.
Notes
Combine with other tools (e.g., RSI, support/resistance, or volume) for confirmation.
Optimize settings for specific markets (e.g., crypto, forex, stocks) or timeframes.
The indicator is overlayed on the price chart for seamless integration with price action analysis.
Author’s Note
This indicator was designed to provide traders with a clear, multi-timeframe perspective on trends using the T3 MA and EMAs. Feedback is welcome to enhance this tool for the TradingView community!

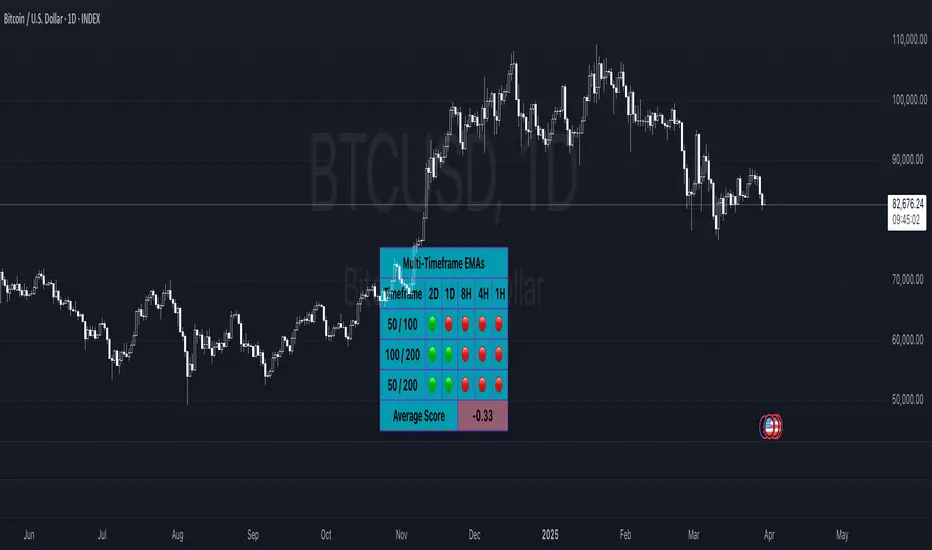
Multi-Timeframe EMAsMulti Timeframe EMA's
The 'Multi-Timeframe EMA Band Comparison' indicator is a tool designed to analyze trend direction across multiple timeframes using Exponential Moving Averages. it calculates the 50, 100, and 200 period EMAs for fiver user defined timeframes and compares their relationships to provide a visual snapshot of bullish or bearish momentum.
How it Works:
EMA Calculations: For each selected timeframe, the indicator computes the 50, 100, and 200 period EMAs based on the closing price.
Band Comparisons: Three key relationships are evaluated:
50 EMA vs 100 EMA
100 EMA vs 200 EMA
50 EMA vs 200 EMA
Scoring System: Each comparison is assigned a score:
🟢 (Green Circle): The shorter EMA is above the longer EMA, signaling bullish momentum.
🔴 (Red Circle): The shorter EMA is below the longer EMA, signaling bearish momentum.
⚪️ (White Circle): The EMAs are equal or data is unavailable (rare).
Average Score:
An overall average score is calculated across all 15 comparisons ranging from 1 to -1, displayed with two decimal places and color coded.
Customization:
This indicator is fully customizable from the timeframe setting to the color of the table. The only specific part that is not changeable is the EMA bands.
Multifactor Buy/Sell Strategy V2 | RSI, MACD, ATR, EMA, Boll.BITGET:1INCHUSDT
This Pine Script code for TradingView is a multifactor Buy/Sell indicator that combines several technical factors to generate trading signals based on trend, volatility, and volume conditions. Here’s a breakdown of the main components and functionality:
Indicator Name
- Multifactor Buy/Sell Strategy V2 — an overlay indicator applied directly on the price chart.
### Input Parameters
The script includes multiple customizable parameters:
- RSI, EMA, MACD parameters — for setting periods and signals of MACD and RSI.
- ATR and Bollinger Bands — used for volatility analysis and level determination.
- Minimum Volatility Threshold — sets a minimum Bollinger Band width threshold for determining high volatility.
Core Indicators
1. RSI — calculated to identify oversold (below 30) and overbought (above 70) conditions.
2. EMA and MACD — calculates exponential moving averages and MACD histogram to determine trend direction.
3. ATR and Bollinger Bands — used to assess current volatility and establish dynamic upper and lower bands.
Volatility and Volume Analysis
- Determines the current ATR level and Bollinger Band width to evaluate high volatility.
- Calculates the volume moving average to track periods of increased volume during high volatility.
Trend Analysis
The script uses the difference between fast and slow EMAs to define strong trends:
- Uptrend — when the fast EMA is above the slow EMA, the price is above the fast EMA, and the trend is strong.
- Downtrend — when the fast EMA is below the slow EMA, the price is below the fast EMA, and the trend is strong.
Momentum Filter
- Based on the price change over the last three bars and compared against the minimum volatility threshold to identify strong momentum.
Buy and Sell Signal Generation
- Buy Signal: Uptrend with RSI oversold, positive MACD histogram, high volatility and volume, strong momentum, and sufficient Bollinger Band width.
- Sell Signal: Downtrend with RSI overbought, negative MACD histogram, high volatility and volume, strong momentum, and sufficient Bollinger Band width.
Visualization
- Buy and sell signals are displayed as green and red triangles on the chart.
- Plots for fast and slow EMAs, upper and lower bands, and Bollinger Bands.
Alerts
The script includes alert conditions for buy and sell signals, allowing notifications to be sent via email or mobile app.
Information Panel
A small table on the chart displays current volatility dataThis Pine Script code for TradingView is a multifactor Buy/Sell indicator that combines several technical factors to generate trading signals based on trend, volatility, and volume conditions. Here’s a breakdown of the main components and functionality:
Indicator Name
- Multifactor Buy/Sell Strategy V2 — an overlay indicator applied directly on the price chart.
Input Parameters
The script includes multiple customizable parameters:
- **RSI, EMA, MACD parameters** — for setting periods and signals of MACD and RSI.
- **ATR and Bollinger Bands** — used for volatility analysis and level determination.
- **Minimum Volatility Threshold** — sets a minimum Bollinger Band width threshold for determining high volatility.
Core Indicators
1. RSI — calculated to identify oversold (below 30) and overbought (above 70) conditions.
2. EMA and MACD — calculates exponential moving averages and MACD histogram to determine trend direction.
3. ATR and Bollinger Bands — used to assess current volatility and establish dynamic upper and lower bands.
Volatility and Volume Analysis
- Determines the current ATR level and Bollinger Band width to evaluate high volatility.
- Calculates the volume moving average to track periods of increased volume during high volatility.
Trend Analysis
The script uses the difference between fast and slow EMAs to define strong trends:
- Uptrend — when the fast EMA is above the slow EMA, the price is above the fast EMA, and the trend is strong.
- Downtrend — when the fast EMA is below the slow EMA, the price is below the fast EMA, and the trend is strong.
Momentum Filter
- Based on the price change over the last three bars and compared against the minimum volatility threshold to identify strong momentum.
Buy and Sell Signal Generation
- Buy Signal: Uptrend with RSI oversold, positive MACD histogram, high volatility and volume, strong momentum, and sufficient Bollinger Band width.
- Sell Signal: Downtrend with RSI overbought, negative MACD histogram, high volatility and volume, strong momentum, and sufficient Bollinger Band width.
Visualization
- Buy and sell signals are displayed as green and red triangles on the chart.
- Plots for fast and slow EMAs, upper and lower bands, and Bollinger Bands.
Alerts
The script includes alert conditions for buy and sell signals, allowing notifications to be sent via email or mobile app.
Information Panel
A small table on the chart displays current volatility
- Volatility Status — indicates high or low volatility.
- Bollinger Band Width — current width as a percentage.
- ATR Ratio — ratio of current ATR to long-term average ATR.
This script is suitable for trading in high-volatility conditions, combining multiple filters and factors to generate precise buy and sell signals.

Rainbow EMA Areas with Volatility HighlightThe indicator provides traders with an enhanced visual tool to observe price movements, trend strength, and market volatility on their charts. It combines multiple EMAs (Exponential Moving Averages) with color-coded areas to indicate the market’s directional bias and a high-volatility highlight for detecting times of increased market activity.
Explanation of Key Components
Multiple EMAs (Exponential Moving Averages):
Six different EMAs are calculated for various periods (15, 45, 100, 150, 200, 300).
Each EMA period represents a different timeframe, from short-term to long-term trends, providing a well-rounded view of price behavior across different market cycles.
The EMAs are color-coded for easy differentiation:
Green shades indicate bullish trends when prices are above the EMAs.
Red shades indicate bearish trends when prices are below the EMAs.
The space between each EMA is filled with a gradient color, creating a "wave" effect that helps identify the market’s overall direction.
ATR-Based Volatility Detection:
The ATR (Average True Range), a measure of market volatility, is used to assess how much the price is fluctuating. When volatility is high, price movements are typically more significant, indicating potential trading opportunities or times to exercise caution.
The indicator calculates ATR and uses a customizable multiplier to set a high-volatility threshold.
When the ATR exceeds this threshold, it signals that the market is experiencing high volatility.
Visual High Volatility Highlight:
A yellow background appears on the chart during periods of high volatility, giving a subtle but clear visual indication that the market is active.
This highlight helps traders spot potential breakout areas or increased activity zones without obstructing the EMA areas.
Volatility Signal Markers:
Small, red triangular markers are plotted above price bars when high volatility is detected, marking these areas for additional emphasis.
These signals serve as alerts to help traders quickly recognize high volatility moments where price moves may be stronger.
How to Use This Indicator
Identify Trends Using EMA Areas:
Bullish Trend: When the price is above most or all EMAs, and the EMA areas are colored in shades of green, it indicates a strong bullish trend. Traders might look for buy opportunities in this scenario.
Bearish Trend: When the price is below most or all EMAs, and the EMA areas are colored in shades of red, it signals a bearish trend. This condition can suggest potential sell opportunities.
Consolidation or Neutral Trend: If the price is moving within the EMA bands without a clear green or red dominance, the market may be in a consolidation phase. This period often precedes a breakout in either direction.
Volatility-Based Entries and Exits:
High Volatility Areas: The yellow background and red triangular markers signal high-volatility areas. This information can be valuable for identifying potential breakout points or strong moves.
Trading in High Volatility: During high-volatility phases, the market may experience rapid price changes, which can be ideal for breakout trades. However, high volatility also involves higher risk, so traders may adjust their strategies accordingly (e.g., setting wider stops or adjusting position sizes).
Trading in Low Volatility: When the yellow background and markers are absent, volatility is lower, indicating a calmer market. In these times, traders may choose to look for range-bound trading opportunities or wait for the next trend to develop.
Combining with Other Indicators:
This indicator works well in combination with momentum or oscillating indicators like RSI or MACD, providing a well-rounded view of the market.
For example, if the indicator shows a bullish EMA area with high volatility, and an RSI is trending up, it could be a stronger buy signal. Conversely, if the indicator shows a bearish EMA area with high volatility and RSI is trending down, this could be a stronger sell signal.
Practical Trading Examples
Bullish Trend in High Volatility:
Price is above the EMAs, showing green EMA areas, and the high volatility background is active.
This indicates a strong bullish trend with significant price movement potential.
A trader could look for breakout or continuation entries in the direction of the trend.
Bearish Reversal Signal:
Price crosses below the EMAs, showing red EMA areas, while high volatility is also detected.
This suggests that the market may be reversing to a bearish trend with increased price movement.
Traders could consider taking short positions or setting stops on existing long trades.
This indicator is designed to provide a rich visual experience, making it easy to spot trends, consolidations, and volatility zones at a glance. It is best used by traders who benefit from visual cues and who seek a quick understanding of both trend direction and market activity. Let me know if you'd like further customization or additional functionalities!

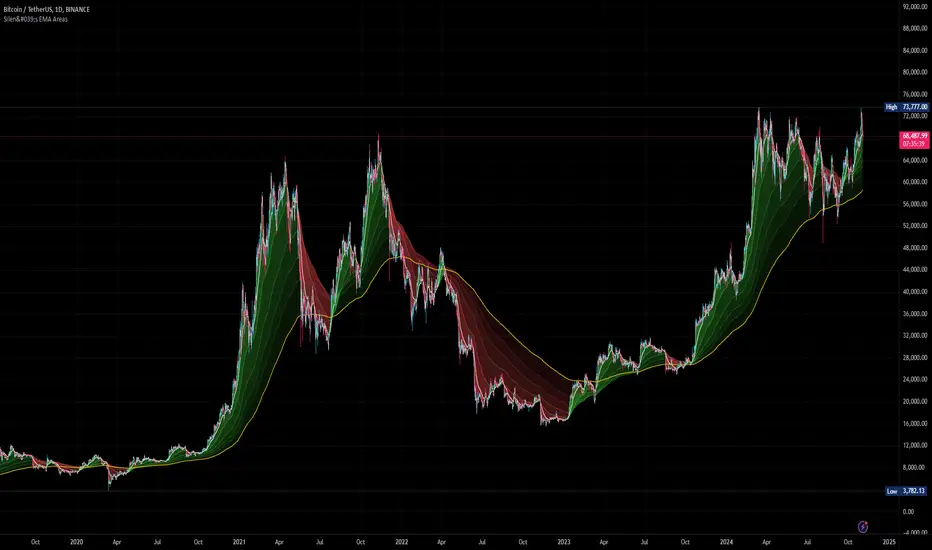
Silen's EMA AreasAre you tired of reading candles? 🧨 Do you want to bring more meaning to your chart? 🧹
Then this is the script for you!
This script does:
- Add several meaningfully pre-configured EMA lines to your chart - up to EMA 300
- Colors the areas between EMA lines in 3d colors - green and red
- The Smaller the EMA, the firmer the color
- Highlights the EMA 300 in a golden color
What is the meaning of this?
Let me introduce a new word to you: EMA FOLDING .
Yes, you heard right. With this indicator you can see in 3D how EMA lines are folding above and below each other, indicating severe mood swings in the chart.
This helps you keep track of what your instrument is actually doing while it enables you to cancel out the noise and messyness of ordinary candles which can be quite random and hard to read.
Once an EMA is fully positive or negatively folded (all ema lines are green and above each other from largest EMA to smallest EMA and vice versa for negatively folded) you can be sure that you are in a Trend or certain mood (for higher timeframes, from 15mins on).
I don't ever want to read any chart without having this indicator on. Whenever I present charts to anybody I use this indicator - and the feedback is insanely positive. People tend to read and understand charts much better with this indicator than just staring at candles.
Why is this indicator different to other EMA indicators and should thereby not be deleted by the TradingView Team due to redundance with other EMA indicators?
- This is not a simple indicator for EMAs
- Rather, this is an indicator to better and easier read the whole chart
- You can detect mood swings very easily which is very hard to do with a normal EMA indicator
- I haven't found any EMA indicator on TradingView that does this job so i sincerely believe it is extremely unique
- I sincerely believe it can help people get a much better understanding of charts without actualy getting into details of EMA's or even needing to know what an EMA is.
This indicator isn't intended for trading purposes, rather it is intended to give you a better and easier understanding of the chart. Of course - you can also use it for your trading but like I said, that is not the primary intended purpose.
This indicator comes pre-configured with quite optimal values (in my opinion) but of course can be fully customized. 🧮
Test it for yourself!
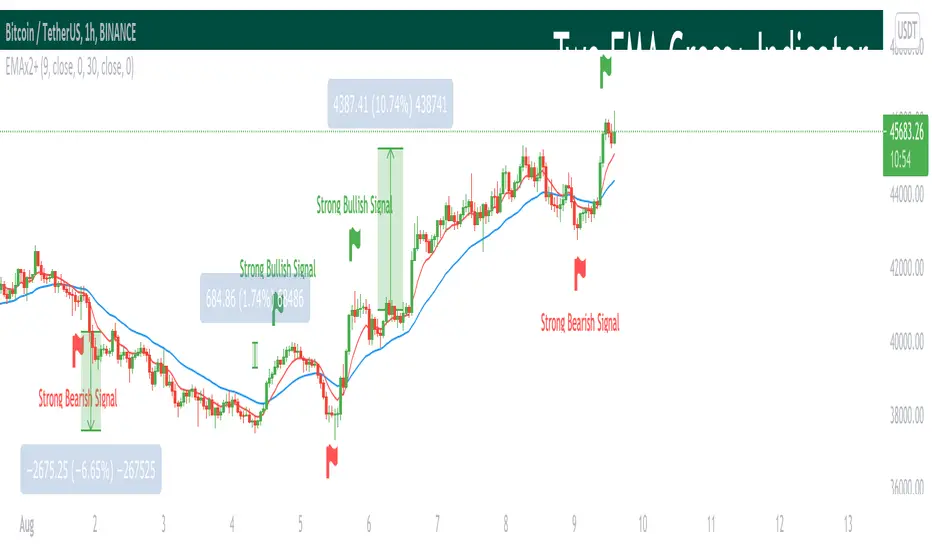
Two EMA Cross+ IndicatorHello traders!
Today we gonna demonstrate out heuristic of classical EMA Indicator. We decided to simplify your trading staff and add some meta data. So, let’s look at it from the very beginning and initially speak about what EMA is and then I’ll tell you why our indicator is extremely convenient and useful.
So, what is EMA? An exponential moving average ( EMA ) is a type of moving average (MA) that places a greater weight and significance on the most recent data points. The exponential moving average is also referred to as the exponentially weighted moving average . An exponentially weighted moving average reacts more significantly to recent price changes than a simple moving average ( SMA ), which applies an equal weight to all observations in the period.
Key takeaways:
-The EMA is a moving average that places a greater weight and significance on the most recent data points.
-Like all moving averages, this technical indicator is used to produce buy and sell signals based on crossovers and divergences from the historical average.
As you know, EMA Cross is one of basic and most popular Entry Indicators. It’s kinda easy to understand and even easier to use. This indicator consists of two EMAs - fast (red line) and slow (blue line). Fast EMA is EMA of less length that the fast EMA (default parameter is 9). Thus, it reacts the price change more actively than the slow. We can say that it takes into consideration the most actual price movements. Speaking about slow EMA (default parameter is 30) it’s more inert and it’s more difficult to change its action vastly. We can say that the EMA «looks» at the historical data more accurate, but doesn’t forget about actual price movements.
But how it works? Trivial. When the fast EMA crosses the slow bellow, it provides bearish signal, whereas when it crosses it above, it’s bullish signal. Even more, we added some «confirmation» factor. As you know, when the price is above the slow EMA, the slow EMA plays the role of support line for price and means that the price is in uptrend. Thus, when we see the cross above and it takes place under the price, we called it «strong Bullish Signal». When the price is bellow the slow EMA, slow EMA is resistance. Thus, when we see the cross bellow and it’s under the slow EMA, we called it «strong Bearish Signal».
To make your trading process easier, we plotted the places of crosses on the chart and added the descriptions of the crosses. The flags mean the place of cross. The default parameters have nice backtest on 1H chart. However, you can also change them depending on your goals and the time period. The places of cross looks like flags (red flag is «bearish» cross, green - «bullish»). As you can see, it’s really convenient.
I hope you’ll enjoy our heuristic of classical EMA Cross. We are sure that the meta data that we are taking into consideration makes the signals more accurate and the deals more profitable. The SkyRock Team with support of Trading View try to make your trading process more successful and profitable. Every day we works in conjunction to boost both your skills and trading balance. We hope, it’s really useful for you, dear traders!
ColorFlow EMA📊 ColorFlow EMA — Trend Flow & Bias Indicator
🔹 What This Indicator Does
ColorFlow EMA is a clean, visual trend-flow indicator designed to show directional bias and momentum state at a glance.
It uses two exponential moving averages:
Fast EMA (default: 10)
Slow EMA (default: 20)
The area between the EMAs is color-shaded to clearly display whether price is in a bullish or bearish flow.
🎨 Visual Logic
🔵 Blue shading → Bullish flow
(Fast EMA above Slow EMA)
🔴 Red shading → Bearish flow
(Fast EMA below Slow EMA)
Optional crossover markers can be enabled for visual confirmation when EMA alignment changes.
🧠 How to Use ColorFlow EMA
This indicator is not a standalone strategy and is not intended for signal-chasing.
It is best used as a context and bias filter alongside:
Price action
Market structure (HH/HL, LH/LL)
Support & resistance or supply & demand zones
Pullbacks vs premium/discount
Typical use cases:
Favor longs when the flow is blue
Favor shorts when the flow is red
Avoid forcing trades when EMAs are tangled or flat
Wait for pullbacks into structure instead of chasing price
⚠️ Important Notes
EMA crossovers alone do not guarantee profitable trades
Market conditions, structure, and location always matter
Works best in trending or transitioning markets
Not designed for ranging/choppy environments without context
⚙️ Customization
EMA lengths can be adjusted
Crossover markers can be toggled on/off
Designed to stay visually clean and uncluttered
🎯 Who This Indicator Is For
Traders who prioritize price action over indicators
Intraday traders (forex, indices, ETFs, stocks)
Traders who want clarity, not noise
📝 Final Thought
ColorFlow EMA answers one simple question:
“Should I be looking for longs or shorts here?”
Use it for bias, not prediction.

EMA + VWAP Strategy# EMA + VWAP Crossover Strategy
## Overview
This is a trend-following intraday strategy that combines fast and slow EMAs with VWAP to identify high-probability entries. It's designed primarily for 5-15 minute charts and includes a smart filter to avoid trading when VWAP is ranging flat.
## How It Works
### Core Concept
The strategy uses three main components working together:
- **Fast EMA (9)** - Responds quickly to price changes and generates entry signals
- **Slow EMA (21)** - Acts as a trend filter to keep you on the right side of the market
- **VWAP** - Serves as a dynamic support/resistance level and the primary trigger for entries
### Entry Rules
**Long Entry:**
- EMA 9 crosses above VWAP (bullish momentum)
- EMA 9 is above EMA 21 (confirming uptrend)
- VWAP has a clear directional slope (not flat/ranging)
- Only during weekdays (Monday-Friday)
**Short Entry:**
- EMA 9 crosses below VWAP (bearish momentum)
- EMA 9 is below EMA 21 (confirming downtrend)
- VWAP has a clear directional slope (not flat/ranging)
- Only during weekdays (Monday-Friday)
### The VWAP Flat Filter
One of the key features is the VWAP slope filter. When VWAP is moving sideways (flat), it indicates the market is likely consolidating or ranging. The strategy skips these periods because crossover signals tend to be less reliable in choppy conditions. You'll see small gray diamonds at the top of the chart when VWAP is considered flat.
### Risk Management
The strategy uses a proper risk-reward approach with multiple stop loss options:
1. **ATR-Based (Recommended)** - Adapts to market volatility automatically. Default is 1.5x ATR(14), which gives your trades room to breathe while protecting capital.
2. **Swing Low/High** - Places stops at recent price structure points for a more technical approach.
3. **Slow EMA** - Uses the trend-defining EMA as your stop level, good for trend-following with wider stops.
4. **Fixed Percentage** - Simple percentage-based stops if you prefer consistency.
Take profits are automatically calculated based on your risk-reward ratio (default 2:1), meaning if you risk $100, you're aiming to make $200.
### Weekday Trading Filter
The strategy includes an option to trade only Monday through Friday. This is particularly useful for crypto markets where weekend liquidity can be thin and price action more erratic. You can toggle this on/off to test whether avoiding weekends improves your results.
### Visual Features
- **Color-coded background** - Green tint when EMA 9 is above EMA 21 (bullish bias), red tint when below (bearish bias)
- **ATR bands** - Dotted lines showing where stops would be placed (when using ATR stops)
- **Active trade levels** - Solid red line for your stop loss, green line for your take profit when you're in a position
- **Weekend highlighting** - Gray background on Saturdays and Sundays when weekday filter is active
## Best Practices
**Timeframe:** Designed for 5-minute charts but can be adapted to other intraday timeframes.
**Markets:** Works on any liquid market - stocks, forex, crypto, futures. Just make sure there's enough volume.
**Position Sizing:** The strategy uses percentage of equity by default. Adjust based on your risk tolerance.
**Backtesting Tips:**
- Test with and without the weekday filter to see which performs better on your instrument
- Try different ATR multipliers (1.0-2.5) to find the sweet spot between stop-outs and letting profits run
- Experiment with risk-reward ratios (1.5R, 2R, 3R) to optimize for your win rate
**What to Watch:**
- Win rate vs. profit factor balance
- How many trades are filtered out by the VWAP flat condition
- Performance difference between weekdays and weekends
- Whether the trend filter (EMA 21) is keeping you out of bad trades
## Parameters You Can Adjust
- Fast EMA length (default 9)
- Slow EMA length (default 21)
- VWAP flat threshold (default 0.01%)
- Stop loss type and parameters
- Risk-reward ratio
- Weekday trading on/off
- ATR length and multiplier
## Disclaimer
This strategy is for educational purposes. Past performance doesn't guarantee future results. Always test thoroughly on historical data and paper trade before risking real money. Use proper position sizing and never risk more than you can afford to lose.
---
*Built with Pine Script v5 for TradingView*

RRR EMA Ignition BUY & SELL (Sideways-Proof)🔹 Description
RRR EMA Ignition Buy & Sell is a trend-following, non-repainting indicator designed to capture high-probability trend ignition points while filtering out sideways market noise.
Unlike basic EMA crossover systems that generate frequent false signals, this indicator uses a state-based trend engine, volatility filters, and trend strength confirmation to ensure signals appear only when a real directional move is underway.
It is optimized for swing trading and positional trading on stocks and indices.
🔹 Core Logic
🔼 BUY Signal (Bullish Ignition)
A BUY signal is generated only when all of the following conditions are met:
EMA 21 confirms bullish regime above EMA 55
EMA 9 shows momentum above EMA 21
Price is trading above EMA 55
Candle closes bullish (confirmation)
Trend strength is validated using ADX
EMA 55 is sloping upward
Price is sufficiently far from EMA 55 (ATR-based distance filter)
Only one BUY per bullish trend leg (no repeated signals)
🔽 SELL Signal (Bearish Ignition)
A SELL signal is the exact reverse of the BUY logic:
EMA 21 confirms bearish regime below EMA 55
EMA 9 shows bearish momentum below EMA 21
Price is trading below EMA 55
Candle closes bearish
ADX confirms trend strength
EMA 55 is sloping downward
ATR distance filter blocks sideways chop
Only one SELL per bearish trend leg
🔹 Key Features
✅ Non-repainting (signals appear only after candle close)
✅ Sideways-market protection using ATR + ADX
✅ State-based logic (prevents repeated BUY/SELL spam)
✅ Handles strong V-reversals using trend re-arm logic
✅ Clean signals suitable for alerts and automation
✅ Works across stocks, indices, and ETFs
🔹 Best Use Cases
📈 Swing trading on Daily / 4H charts
📊 Large-cap stocks and indices (Nifty, Bank Nifty, SPX, NASDAQ)
🚫 Not intended for low-timeframe scalping
🎯 Designed for trend capture, not range trading
🔹 Recommended Settings
Indian Stocks
ADX Minimum: 18
ATR Multiplier: 0.6 – 0.8
US Indices
ADX Minimum: 22
ATR Multiplier: 0.5
(Default settings work well for most instruments.)
🔹 How to Trade (Simple Guide)
Use BUY signals to enter or add to long positions
Use SELL signals to enter short positions or exit longs
Combine with:
Support/resistance
Higher-timeframe bias
Position sizing & risk management
🔹 Disclaimer
This indicator is a decision-support tool, not financial advice.
Always apply proper risk management and confirm signals with your own analysis.

EMA Distance %# EMA Distance % - Daily Timeframe Analysis
## Overview
This indicator provides real-time analysis of price distance from key Exponential Moving Averages (EMA 10 and EMA 21) on the daily timeframe, regardless of your current chart timeframe. It displays both percentage and volatility-adjusted (ATR) distances in a clean, customizable table format.
## Key Features
- **Daily Timeframe Focus**: Always references daily EMA 10 and EMA 21 values, providing consistent analysis across all chart timeframes
- **Dual Distance Metrics**: Shows both percentage distance and ATR-normalized distance for comprehensive analysis
- **Customizable Table Position**: Position the data table anywhere on your chart (9 different locations available)
- **Color-Coded Results**: Green indicates price above EMA, red indicates price below EMA
- **Volatility Adjustment**: ATR distance provides context relative to the asset's typical price movements
## What It Shows
The indicator displays a table with the following information:
- **EMA Value**: Current daily EMA 10 and EMA 21 values
- **Distance %**: Percentage distance from each EMA (positive = above, negative = below)
- **ATR Distance**: How many Average True Range units the price is from each EMA
## Use Cases
- **Mean Reversion Trading**: Identify when price has moved significantly away from key EMAs
- **Trend Strength Analysis**: Gauge the strength of current trends relative to moving averages
- **Entry/Exit Timing**: Use ATR distances to identify potential reversal zones (typically 2-3+ ATR)
- **Multi-Timeframe Analysis**: View daily EMA relationships while analyzing shorter timeframes
- **Risk Management**: Understand volatility-adjusted distance for better position sizing
## Settings
- **Table Position**: Choose from 9 different table positions on your chart
- **ATR Period**: Customize the ATR calculation period (default: 14)
## Interpretation
- **Small distances (< 1% or < 1 ATR)**: Price near EMA support/resistance
- **Medium distances (1-3% or 1-2 ATR)**: Normal trending movement
- **Large distances (> 3% or > 2-3 ATR)**: Potential overextension, watch for mean reversion
Perfect for swing traders, position traders, and anyone using EMA-based strategies who wants quick access to daily timeframe EMA relationships without switching chart timeframes.

Daily EMAs (8, 21 & 50) with BandDescription:
This script plots the Daily EMAs (8, 21, and 50) on any intraday or higher timeframe chart. It provides a clear, multi-timeframe view of market trends by using daily exponential moving averages (EMAs) and a dynamic visual band. I use this on the major indexes to decide if I should be mostly longing or shorting assets.
-In addition to identifying the trend structure, the 8-Day EMA often serves as a key area where buyers or sellers may become active, depending on the market direction:
-In an uptrend, the 8 EMA can act as a dynamic support zone, where buyers tend to re-enter on pullbacks.
-In a downtrend, the same EMA may act as resistance, where sellers become more aggressive.
-The script also includes a colored band between the 8 and 21 EMAs to highlight the short-term trend bias:
-Green fill = 8 EMA is above the 21 EMA (bullish structure).
Blue fill = 8 EMA is below the 21 EMA (bearish structure).
The 50-Day EMA is included to give additional context for intermediate-term trend direction.
Features:
- Daily EMA levels (8, 21, and 50) calculated regardless of current chart timeframe.
- 8 EMA acts as a potential buyer/seller zone based on trend direction.
- Color-coded band between 8 and 21 EMAs:
- Green = Bullish short-term bias
- Blue = Bearish short-term bias
- Customizable price source and EMA offset.
- Suitable for trend trading, pullback entries, and higher-timeframe confirmation.
Use Cases:
Identify key dynamic support/resistance areas using the 8 EMA.
Assess short-, medium-, and intermediate-term trend structure at a glance.
Enhance confluence for entry/exit signals on lower timeframes.

EMA 200 Monitor - Bybit CoinsEMA 200 Monitor - Bybit Coins
📊 OVERVIEW
The EMA 200 Monitor - Bybit Coins is an advanced indicator that automatically monitors 30 of the top cryptocurrencies traded on Bybit, alerting you when they are close to the 200-period Exponential Moving Average on the 4-hour timeframe.
This indicator was developed especially for traders who use the EMA 200 as a key support/resistance level in their swing trading and position trading strategies.
🎯 WHAT IT'S FOR
Multi-Asset Monitoring: Simultaneous monitoring of 30 cryptocurrencies without having to switch between charts
Opportunity Identification: Detects when coins are approaching the 200 EMA, a crucial technical level
Automated Alerts: Real-time notifications when a coin reaches the configured proximity
Time Efficiency: Eliminates the need to manually check chart collections
⚙️ HOW IT WORKS
Main Functionality
The indicator uses the request.security() function to fetch price data and calculate the 200 EMA of each monitored asset. With each new bar, the script:
Calculates the distance between the current price and the 200 EMA for each coin
Identifies proximity based on the configured percentage (default: 2%)
Displays results in a table organized on the chart
Generates automatic alerts when proximity is detected
Monitored Coins
Major : BTC, ETH, BNB, ADA, XRP, SOL, DOT, DOGE, AVAX
DeFi : UNI, LINK, ATOM, ICP, NEAR, OP, ARB, INJ
Memecoins : SHIB, PEPE, WIF, BONK, FLOKI
Emerging : SUI, TON, APT, POL (ex-MATIC)
📋 AVAILABLE SETTINGS
Adjustable Parameters
EMA Length (Default: 200): Exponential Moving Average Period
Proximity Percentage (Default: 2%): Distance in percentage to consider "close"
Show Table (Default: Active): Show/hide results table
Table Position: Position of the table on the chart (9 options available)
Color System
🔴 Red: Distance ≤ 1% (very close)
🟠 Orange: Distance ≤ 1.5% (close)
🟡 Yellow: Distance ≤ 2% (approaching)
🚀 HOW TO USE
Initial Configuration
Add the indicator to the 4-hour timeframe chart
Set the parameters according to your strategy
Position the table where there is no graphic preference
Setting Alerts
Click "Create Alert" in TradingView
Select the "EMA 200 Monitor" indicator
Set the notification frequency and method
Activate the alert to receive automatic notifications
Results Interpretation
The table shows:
Coin: Asset name (e.g. BTC, ETH)
Price: Current currency quote
EMA 200: Current value of the moving average
Distance: Percentage of proximity to the core code
💡 STRATEGIES TO USE
Reversal Trading
Entry: When price touches or approaches the EMA 200
Stop: Below/above the EMA with a safety margin
Target: Previous resistance/support levels
Breakout Trading
Monitoring: Watch for currencies consolidating near the EMA 200
Entry: When the media is finally broken
Confirmation: Volume and close above/below the EMA
Swing Trading
Identification: Use the monitor to detect setups in formation
Timing: Wait for the EMA 200 to approach for detailed analysis
Management: Use the EMA as a reference for stops dynamics
⚠️ IMPORTANT CONSIDERATIONS
Technical Limitations
Request Bybit data: Access to exchange symbols required
Specific timeframe: Optimized for 4-hour analysis
Minimum delay: Data updated with each new bar
Usage Recommendations
Combine with technical analysis: Use together with other indicators
Confirm the configuration: Check the graphic patterns before trading
Manage risk: Always use stop loss and adequate position sizing
Backtesting: Test your strategy before applying with real capital
Disclaimer
This indicator is a technical analysis tool and does not constitute investment advice. Always do your own analysis and manage detailed information about the risks of your operations.
🔧 TECHNICAL INFORMATION
Pine Script version: v6
Type: Indicator (overlay=true)
Compatibility: All TradingView plans
Resources used: request.security(), arrays, tables
Performance: Optimized for multiple simultaneous queries
📈 COMPETITIVE ADVANTAGES
✅ Simultaneous monitoring of 30 major assets ✅ Clear visual interface with intuitive core system ✅ Customizable alerts for different details ✅ Optimized code for maximum performance ✅ Flexible configuration adaptable to different strategies ✅ Real-time update without the need for manual refresh
Developed for traders who value efficiency and accuracy in identifying market opportunities based on the EMA 20

HiLo EMA Custom bandsHILo Ema custom bands
This advanced technical indicator is a powerful variation of "HiLo Ema squeeze bands" that combines the best elements of Donchian channels and EMAs. It's specially designed to identify price squeezes before significant market moves while providing dynamic support/resistance levels and predictive price targets.
Indicator Concept:
The indicator initializes EMAs at each new high or low - the upper EMA tracks highs while the lower EMA tracks lows. It draws maximum of 6 custom bands based on percentage, fixed value or Atr
Upper EM bands are drawn below uper ema, Lower EMA bands are drawn above lower ema
Customizable Options:
Ema length: 200 default
Calculation type: Ema (Default), HILO
Calculation type: Percent,Fixed Value, ATR
Band Value: Percent/Value/ATR multiple This is value to use for calculation type
Band Selection: Both,Upper,Lower
Key Features:
You can choose to draw either of one or both, the latter can be overwhelming initially but as you get used to it, it becomes a powerful tool.
When both bands are selected, upper and lower bands provide provides dual references and intersections
This creates a more trend-responsive alternative to traditional Donchian channels with clearly defined zones for trade planning.
If you select percaentage, note that the calulation is based FROM the respective EMA bands. So bands from lower EMA band will appear narrower compared to the those drawn from upper EMA band
Price targets or reversals:
Look of alignment of lines and price. The current level of one order could align with that of previous level of a different order because often markets move in steps
Settings Guide:
Recommended Settings:
Ema length: 200
Use one of the bands (not both) if using large length of say 1000
Calculation type: EMA
HILO will draw donchian like bands, this is useful if you only want flat price levels. In a rising market use upper and vise versa
Calculation type:
percentage for indices : 5, for symbols 10 or higher based on symbol volatility
Fixed value: about 10% of symbol value converted to value
Atr: 2 ideally
Perfect for swing traders and position traders looking for a more sophisticated volatility-based overlay that adapts to changing market conditions and provides predictive reversal levels.
Note: This indicator works well across multiple timeframes but is especially effective on H4, Daily and Weekly charts for trend trading.

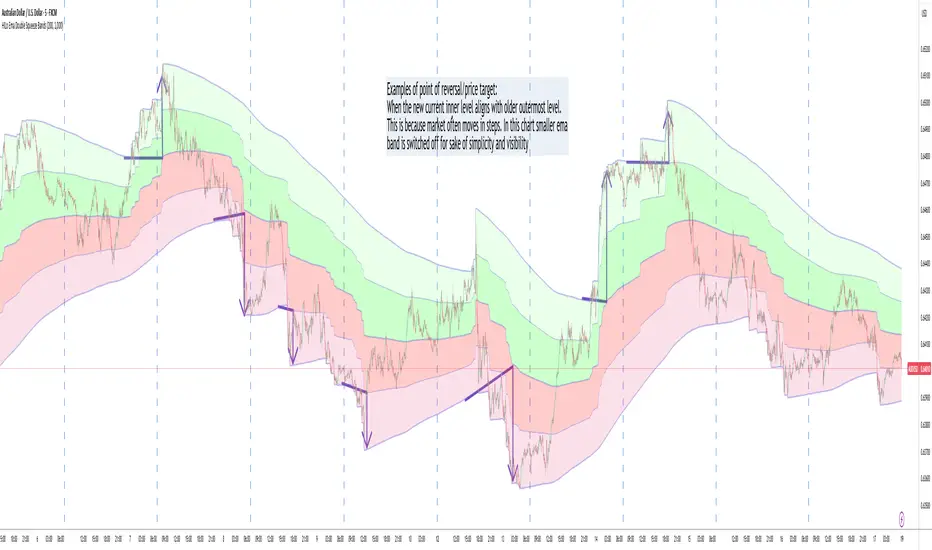
HILo Ema Double Squeeze BandsHILo Ema Double Squeeze Bands
This advanced technical indicator is a powerful variation of "HiLo Ema squeeze bands" that combines the best elements of Donchian channels and EMAs. It's specially designed to identify price squeezes before significant market moves while providing dynamic support/resistance levels and predictive price targets.
Indicator Concept:
The indicator initializes EMAs at each new high or low - the upper EMA tracks highs while the lower EMA tracks lows. The price range between upper and lower bands is divided into 4 equal zones by these lines:
Upper2 (uppermost line)
Upper1 (upper quartile)
Middle (center line)
Lower1 (lower quartile)
Lower2 (lowermost line)
This creates a more trend-responsive alternative to traditional Donchian channels with clearly defined zones for trade planning.
Key Features:
Dual EMA Band System: Utilizes both short-term and long-term EMAs to create adaptive price channels that respond to different market cycles
Quartile Divisions: Each band set includes middle lines and quartile divisions for more precise entry and exit points
Customizable Parameters: Easily adjust EMA periods and display options to suit your trading style and timeframe
Visual Color Zones: Clear color-coded zones help quickly identify bullish and bearish areas
Optional Extra Divisions: Add more granular internal lines (eighth divisions) for enhanced precision with longer EMA periods
Price Labels Option: Display exact price values for key levels directly on the chart
Price Target Prediction:
One of the most valuable features of this indicator is its ability to help predict potential reversal points:
When price breaks above the Upper2 level, look for potential reversals when the new Upper1 or Middle line aligns with previous Upper2 levels
When price breaks below the Lower2 level, look for potential reversals when the new Lower1 or Middle line aligns with previous Lower2 levels
Settings Guide:
Recommended Settings: 200 for Short EMA, 1000 for Long EMA works extremely well across most timeframes and symbols
Display options allow you to show/hide either band system based on your analysis preferences
The new option to divide the long EMA range into 8 parts instead of 4 is particularly useful when:
Long EMA period is >500
Short EMA is switched off and long EMA is used independently
Perfect for swing traders and position traders looking for a more sophisticated volatility-based overlay that adapts to changing market conditions and provides predictive reversal levels.
Note: This indicator works well across multiple timeframes but is especially effective on H4, Daily and Weekly charts for trend trading.
Smoothed Source Weighted EMAThe Smoothed Source EMA is a tool designed to help traders identify potential buying and selling opportunities in the market. It combines two key elements: price smoothing (using standard deviation) and an Exponential Moving Average (EMA). The purpose is to filter out the day-to-day price fluctuations and create clearer buy and sell signals.
Key Concepts Behind the Indicator:
Price Smoothing (Standard Deviation):
To make the price action easier to follow, the indicator first "smooths" the price. This is done by looking at how much the price tends to move up and down (known as standard deviation).
It then creates two "bands" around the current price—one above and one below. These bands represent a smoothed version of the price and help filter out the noise caused by small, random price movements.
Exponential Moving Average (EMA):
The indicator also uses an Exponential Moving Average (EMA), which is a line that represents the average price over a certain period of time (but gives more weight to recent prices). The EMA helps capture the general trend of the price.
The indicator uses this EMA to compare the current price with the overall trend.
How Does the Indicator Work?
Once the indicator calculates the smoothed price bands and the EMA, it looks for specific conditions to trigger a buy or sell signal:
Long (Buy) Signal:
A buy signal happens when the smoothed price (the lower band) is above the EMA. In simple terms, the price is moving up, and the indicator is telling you it's a good time to buy.
The more "weight" or influence you give to the EMA, the slower this buy signal will appear, meaning it’ll only trigger when there’s a strong enough upward movement.
Short (Sell) Signal:
A sell signal occurs when the smoothed price (the upper band) is below the EMA. This suggests the price is moving down, and the indicator signals that it might be time to sell.
Again, the more "weight" you put on the EMA, the slower the sell signal will appear, as the indicator waits for a clearer downtrend.
Why is this Useful for Traders?
Smoothing the Price: Many traders struggle with the noise of price fluctuations, where the price moves up and down quickly without a clear trend. By smoothing the price, this indicator helps traders focus on the bigger picture and avoid reacting to every small movement.
Clear Buy and Sell Signals: The indicator generates easy-to-understand buy and sell signals based on the relationship between the smoothed price and the EMA. If the price is above the smoothed level and EMA, it’s a signal to buy. If it’s below, it’s a signal to sell.
Customizable Sensitivity: The indicator lets traders adjust how sensitive the buy and sell signals are. By changing certain settings, such as the smoothing length and the weight of the EMA, traders can make the indicator react faster or slower depending on how quickly they want to catch changes in the market.
How the Indicator Appears on the Chart:
EMA Line: A line that represents the trend of the price.
Upper and Lower Smoothed Bands: Two bands above and below the price that help identify when the price is moving up or down relative to the trend.
Buy and Sell Arrows: Small arrows on the chart show where the indicator suggests buying or selling.
Colored Bars: The bars on the chart may change color to visually indicate whether the indicator suggests a buy (green) or a sell (red).
In Summary:
The Smoothed Source EMA helps you identify trends by smoothing out price movements using standard deviation, then comparing these smoothed prices with the Exponential Moving Average (EMA).
When the smoothed price moves above or below the EMA, it gives you a signal: a buy when the smoothed price is above the EMA, and a sell when it’s below.
You can adjust how quickly or slowly these signals appear by modifying the settings, giving you control over how sensitive the indicator is to changes in the market.
This indicator is useful for traders who want to reduce noise and focus on the overall trend, using clear, visually simple signals to guide their trading decisions.

EMA Scalping StrategyEMA Slope Indicator Overview:
The indicator plots two exponential moving averages (EMAs) on the chart: a 9-period EMA and a 15-period EMA.
It visually represents the EMAs on the chart and highlights instances where the slope of each EMA exceeds a certain threshold (approximately 30 degrees).
Scalping Strategy:
Using the EMA Slope Indicator on a 5-minute timeframe for scalping can be effective, but it requires adjustments to account for the shorter time horizon.
Trend Identification: Look for instances where the 9-period EMA is above the 15-period EMA. This indicates an uptrend. Conversely, if the 9-period EMA is below the 15-period EMA, it suggests a downtrend.
Slope Analysis: Pay attention to the slope of each EMA. When the slope of both EMAs is steep (exceeds 30 degrees), it signals a strong trend. This can be a favorable condition for scalping as it suggests potential momentum.
Entry Points:
For Long (Buy) Positions: Consider entering a long position when both EMAs are sloping upwards strongly (exceeding 30 degrees) and the 9-period EMA is above the 15-period EMA. Look for entry points when price retraces to the EMAs or when there's a bullish candlestick pattern.
For Short (Sell) Positions: Look for opportunities to enter short positions when both EMAs are sloping downwards strongly (exceeding -30 degrees) and the 9-period EMA is below the 15-period EMA. Similar to long positions, consider entering on retracements or bearish candlestick patterns.
Exit Strategy: Use tight stop-loss orders to manage risk, and aim for small, quick profits. Since scalping involves short-term trading, consider exiting positions when the momentum starts to weaken or when the price reaches a predetermined profit target.
Risk Management:
Scalping involves high-frequency trading with smaller profit targets, so it's crucial to implement strict risk management practices. This includes setting stop-loss orders to limit potential losses and not risking more than a small percentage of your trading capital on each trade.
Backtesting and Optimization:
Before implementing the strategy in live trading, backtest it on historical data to assess its performance under various market conditions. You may also consider optimizing the strategy parameters (e.g., EMA lengths) to maximize its effectiveness.
Continuous Monitoring:
Keep a close eye on market conditions and adjust your strategy accordingly. Market dynamics can change rapidly, so adaptability is key to successful scalping.

CCI+EMA Strategy with Percentage or ATR TP/SL [Alifer]This is a momentum strategy based on the Commodity Channel Index (CCI), with the aim of entering long trades in oversold conditions and short trades in overbought conditions.
Optionally, you can enable an Exponential Moving Average (EMA) to only allow trading in the direction of the larger trend. Please note that the strategy will not plot the EMA. If you want, for visual confirmation, you can add to the chart an Exponential Moving Average as a second indicator, with the same settings used in the strategy’s built-in EMA.
The strategy also allows you to set internal Stop Loss and Take Profit levels, with the option to choose between Percentage-based TP/SL or ATR-based TP/SL.
The strategy can be adapted to multiple assets and timeframes:
Pick an asset and a timeframe
Zoom back as far as possible to identify meaningful positive and negative peaks of the CCI
Set Overbought and Oversold at a rough average of the peaks you identified
Adjust TP/SL according to your risk management strategy
Like the strategy? Give it a boost!
Have any questions? Leave a comment or drop me a message.
CAUTIONARY WARNING
Please note that this is a complex trading strategy that involves several inputs and conditions. Before using it in live trading, it is highly recommended to thoroughly test it on historical data and use risk management techniques to safeguard your capital. After backtesting, it's also highly recommended to perform a first live test with a small amount. Additionally, it's essential to have a good understanding of the strategy's behavior and potential risks. Only risk what you can afford to lose .
USED INDICATORS
1 — COMMODITY CHANNEL INDEX (CCI)
The Commodity Channel Index (CCI) is a technical analysis indicator used to measure the momentum of an asset. It was developed by Donald Lambert and first published in Commodities magazine (now Futures) in 1980. Despite its name, the CCI can be used in any market and is not just for commodities. The CCI compares current price to average price over a specific time period. The indicator fluctuates above or below zero, moving into positive or negative territory. While most values, approximately 75%, fall between -100 and +100, about 25% of the values fall outside this range, indicating a lot of weakness or strength in the price movement.
The CCI was originally developed to spot long-term trend changes but has been adapted by traders for use on all markets or timeframes. Trading with multiple timeframes provides more buy or sell signals for active traders. Traders often use the CCI on the longer-term chart to establish the dominant trend and on the shorter-term chart to isolate pullbacks and generate trade signals.
CCI is calculated with the following formula:
(Typical Price - Simple Moving Average) / (0.015 x Mean Deviation)
Some trading strategies based on CCI can produce multiple false signals or losing trades when conditions turn choppy. Implementing a stop-loss strategy can help cap risk, and testing the CCI strategy for profitability on your market and timeframe is a worthy first step before initiating trades.
2 — AVERAGE TRUE RANGE (ATR)
The Average True Range (ATR) is a technical analysis indicator that measures market volatility by calculating the average range of price movements in a financial asset over a specific period of time. The ATR was developed by J. Welles Wilder Jr. and introduced in his book “New Concepts in Technical Trading Systems” in 1978.
The ATR is calculated by taking the average of the true range over a specified period. The true range is the greatest of the following:
The difference between the current high and the current low.
The difference between the previous close and the current high.
The difference between the previous close and the current low.
The ATR can be used to set stop-loss orders. One way to use ATR for stop-loss orders is to multiply the ATR by a factor (such as 2 or 3) and subtract it from the entry price for long positions or add it to the entry price for short positions. This can help traders set stop-loss orders that are more adaptive to market volatility.
3 — EXPONENTIAL MOVING AVERAGE (EMA)
The Exponential Moving Average (EMA) is a type of moving average (MA) that places a greater weight and significance on the most recent data points.
The EMA is calculated by taking the average of the true range over a specified period. The true range is the greatest of the following:
The difference between the current high and the current low.
The difference between the previous close and the current high.
The difference between the previous close and the current low.
The EMA can be used by traders to produce buy and sell signals based on crossovers and divergences from the historical average. Traders often use several different EMA lengths, such as 10-day, 50-day, and 200-day moving averages.
The formula for calculating EMA is as follows:
Compute the Simple Moving Average (SMA).
Calculate the multiplier for weighting the EMA.
Calculate the current EMA using the following formula:
EMA = Closing price x multiplier + EMA (previous day) x (1-multiplier)
STRATEGY EXPLANATION
1 — INPUTS AND PARAMETERS
The strategy uses the Commodity Channel Index (CCI) with additional options for an Exponential Moving Average (EMA), Take Profit (TP) and Stop Loss (SL).
length : The period length for the CCI calculation.
overbought : The overbought level for the CCI. When CCI crosses above this level, it may signal a potential short entry.
oversold : The oversold level for the CCI. When CCI crosses below this level, it may signal a potential long entry.
useEMA : A boolean input to enable or disable the use of Exponential Moving Average (EMA) as a filter for long and short entries.
emaLength : The period length for the EMA if it is used.
2 — CCI CALCULATION
The CCI indicator is calculated using the following formula:
(src - ma) / (0.015 * ta.dev(src, length))
src is the typical price (average of high, low, and close) and ma is the Simple Moving Average (SMA) of src over the specified length.
3 — EMA CALCULATION
If the useEMA option is enabled, an EMA is calculated with the given emaLength .
4 — TAKE PROFIT AND STOP LOSS METHODS
The strategy offers two methods for TP and SL calculations: percentage-based and ATR-based.
tpSlMethod_percentage : A boolean input to choose the percentage-based method.
tpSlMethod_atr : A boolean input to choose the ATR-based method.
5 — PERCENTAGE-BASED TP AND SL
If tpSlMethod_percentage is chosen, the strategy calculates the TP and SL levels based on a percentage of the average entry price.
tp_percentage : The percentage value for Take Profit.
sl_percentage : The percentage value for Stop Loss.
6 — ATR-BASED TP AND SL
If tpSlMethod_atr is chosen, the strategy calculates the TP and SL levels based on Average True Range (ATR).
atrLength : The period length for the ATR calculation.
atrMultiplier : A multiplier applied to the ATR to set the SL level.
riskRewardRatio : The risk-reward ratio used to calculate the TP level.
7 — ENTRY CONDITIONS
The strategy defines two conditions for entering long and short positions based on CCI and, optionally, EMA.
Long Entry: CCI crosses below the oversold level, and if useEMA is enabled, the closing price should be above the EMA.
Short Entry: CCI crosses above the overbought level, and if useEMA is enabled, the closing price should be below the EMA.
8 — TP AND SL LEVELS
The strategy calculates the TP and SL levels based on the chosen method and updates them dynamically.
For the percentage-based method, the TP and SL levels are calculated as a percentage of the average entry price.
For the ATR-based method, the TP and SL levels are calculated using the ATR value and the specified multipliers.
9 — EXIT CONDITIONS
The strategy defines exit conditions for both long and short positions.
If there is a long position, it will be closed either at TP or SL levels based on the chosen method.
If there is a short position, it will be closed either at TP or SL levels based on the chosen method.
Additionally, positions will be closed if CCI crosses back above oversold in long positions or below overbought in short positions.
10 — PLOTTING
The script plots the CCI line along with overbought and oversold levels as horizontal lines.
The CCI line is colored red when above the overbought level, green when below the oversold level, and white otherwise.
The shaded region between the overbought and oversold levels is plotted as well.

Ultimate Moving Averages (SMA & EMA)Welcome to the Ultimate Moving Average indicator.
Never again spend time looking for EMA / SMA indicators when you can have them all in this single indicator.
Options include :
Daily Chart: Classic Golden / Death Cross - 50/D and 200/D SMA
Daily Chart: 3-day Golden / Death Cross - 150/D and 600/D SMA
Daily Chart: 140/D SMA
Daily Chart: 700/D SMA
Daily Chart: 1458/D SMA
Daily Chart: Golden Ratio Multiplier
Any Chart: Scalping
9 SMA
10 SMA
20 SMA
21 SMA
30 SMA
34 SMA
50 SMA
80 SMA
100 SMA
200 SMA
8 EMA
10 EMA
13 EMA
20 EMA
21 EMA
26 EMA
30 EMA
34 EMA
50 EMA
55 EMA
80 EMA
89 EMA
100 EMA
200 EMA

MTF EMA Trend Table (50/100/200)Using the MTF EMA Trend Table for Supply & Demand Trading
This document explains how to use the Multi‑Timeframe EMA Trend Table as part of a supply and demand trading strategy.
The indicator displays the trend direction (Bullish or Bearish) for EMA 50, 100, and 200 across the following timeframes: 5m, 15m, 30m, 1h, 4h, 1d, and 1w.
---------------------------------------------
1. What the Indicator Shows
---------------------------------------------
The EMA Trend Table instantly reveals whether price is trading above or below the EMA 50/100/200 on multiple timeframes.
• Price above EMA = Bullish trend
• Price below EMA = Bearish trend
This allows you to identify trend alignment across all key timeframes.
---------------------------------------------
2. Why EMAs Matter in Supply & Demand Trading
---------------------------------------------
Supply & Demand zones show where institutions previously bought or sold aggressively. To trade these zones effectively, you must confirm higher‑timeframe trend direction.
The EMA table prevents low‑probability trades by keeping you aligned with institutional flow.
---------------------------------------------
3. How to Use the Indicator for Supply & Demand Trading
---------------------------------------------
Step 1 — Identify Higher‑Timeframe Bias (4H, 1D, 1W)
• Bullish alignment (all green) → Trade demand zones only.
• Bearish alignment (all red) → Trade supply zones only.
Step 2 — Use 1H, 30M, 15M for Setup Timing
These mid‑timeframes help you determine when a pullback is nearing completion.
Step 3 — Trigger Entry on the 5M EMA Flip
Once price enters a supply or demand zone, wait for the 5m EMA trend to flip in your direction before entering.
---------------------------------------------
4. How to Judge Zone Strength Using EMAs
---------------------------------------------
Strong Demand Zone Characteristics:
• Price above EMA200 on 1H+
• Zone forms above EMA200
• Pullback touches EMA50 or EMA100
Strong Supply Zone Characteristics:
• Price below EMA200 on 1H+
• Zone forms below EMA200
• Pullback touches EMA50 or EMA100
---------------------------------------------
5. Full Trade Example
---------------------------------------------
Higher timeframes are bullish: 1W, 1D, 4H all green.
Price pulls back into a 15m demand zone.
5m flips from Bearish → Bullish.
This is the entry confirmation.
---------------------------------------------
6. Why This Indicator Improves Your Trading
---------------------------------------------
• Confirms trend direction
• Shows alignment across timeframes
• Helps avoid counter‑trend traps
• Improves zone accuracy and confidence
• Enhances timing using the 5m EMA flip
This combination is ideal for institutional‑style supply and demand trading.

EMA Cross By Crypto collective Xეს ინდიკატორი გაძლევთ საშუალებას ნახოთ ყველაზე პოპულარული EMA წყვილები ერთ გრაფიკზე:
EMA 9/21
EMA 20/50
EMA 50/200
EMA 100/200
და საკუთარი, მომხმარებლის მიერ შერჩეული Custom წყვილი.
👉 თითოეულ წყვილს შეგიძლია ჩართო/გამორთო ინდიკატორის პარამეტრებიდან.
👉 შესაძლებელია ფერების შეცვლა, ასევე სურვილის შემთხვევაში EMA-ების higher timeframe-ზე გამოტანა (მაგ. 1D EMA 4H გრაფიკზე).
ეს ინსტრუმენტი განსაკუთრებით გამოსადეგია:
ტრენდების დადგენისთვის
გრძელვადიანი და მოკლევადიანი გადაკვეთების შესადარებლად
საკუთარი სტრატეგიის ტესტირებისთვის
This indicator lets you plot and compare the most commonly used EMA pairs on a single chart:
EMA 9/21
EMA 20/50
EMA 50/200
EMA 100/200
plus a fully customizable user-defined EMA pair.
👉 Each pair can be toggled on/off from the settings.
👉 Colors are customizable, and you can optionally display EMAs from a higher timeframe (e.g., show Daily EMAs on a 4H chart).
This tool is especially useful for:
Trend confirmation
Comparing short-term vs. long-term crosses
Backtesting your own strategies
