Cari skrip untuk "ema"

EMA SpreadExponential Moving Average Spread is the percentage spread difference between EMA1 (Slow) and EMA2 (Fast) ie. the gap between two indicators slow and fast. Useful when used alongside EMA cross, MACD, and RSI to strengthen buy/sell signals.

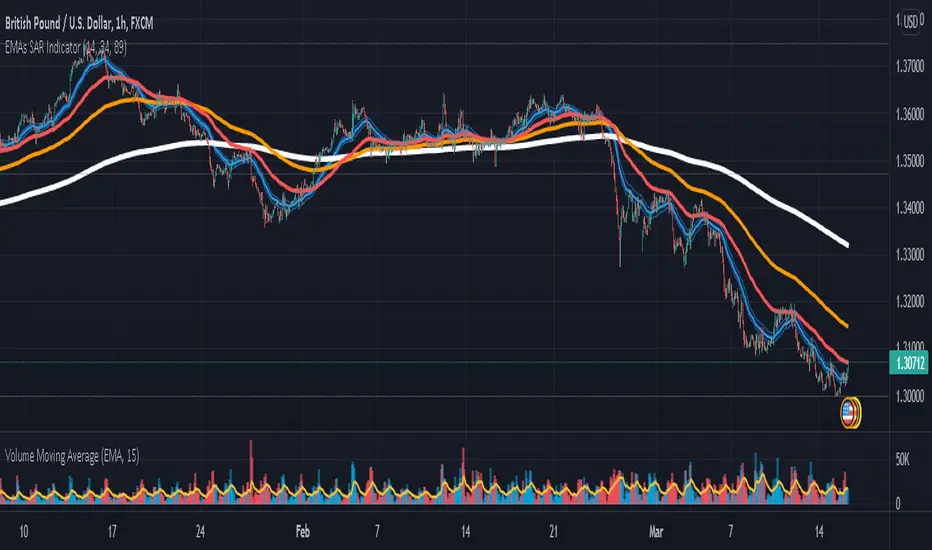
Double EMAThis indicator drops to EMA on your chart. by default it's using different number of bars to calculate the short and long range indicators per time frame. This system is wildly used by professionals to avoid false reading on market's trend and better make decisions. Remember, the crossing of these two indicators should not be used for getting a signal. Instead, you can look into long indicator to see the global market's trend and look at short indicator if the market is reversing the direction of trend to avoid false signals by other systems you may use.
There is also an input and when you check mark the check box, you can tweak the numbers and the two custom numbers will totally override the default ones to make it suite your needs.
Triple EMA difference colors - GcNaif PandorraTriple EMA difference colors
* choose colors on your choice
* choose wave count on your choice

B3 EMA RibbonAs a person versed in other languages of script, I am sharing my first pinescript. I have just thrown together some EMA lines and testing out the fill() function. I have some 400+ indicators I could make and share, so cheers to many more! As I get more versed in the language, I will make more intricate studies based on high math and sound strategy.

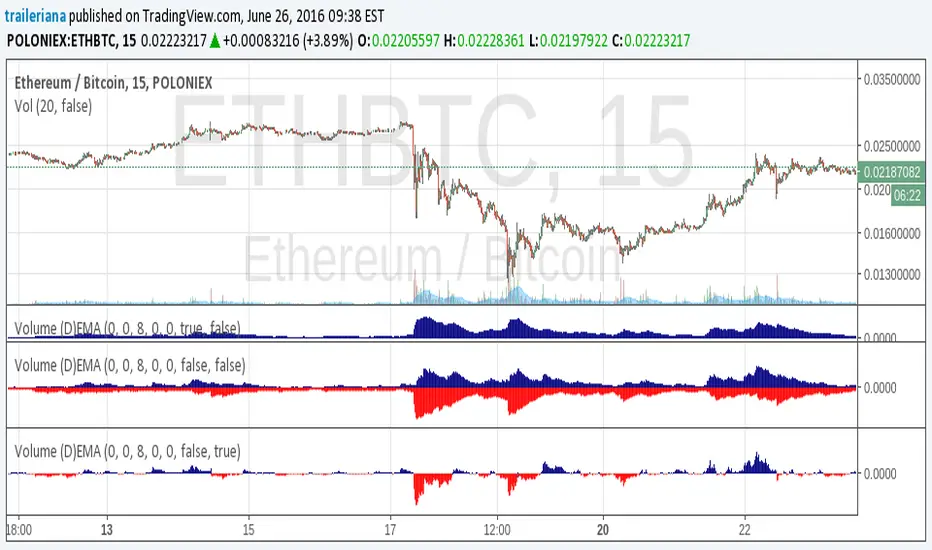
Volume (D)EMAA simple yet configurable indicator that shows recent traffic volumes.
The time period is specified as weeks/days/hours/minutes, not as bars.
For using the generalized double EMA, set the velocity to something other than zero.
Single Timeframe EMAThis plots EMAs from higher timeframes on intraday charts. Very useful for finding areas of S/R

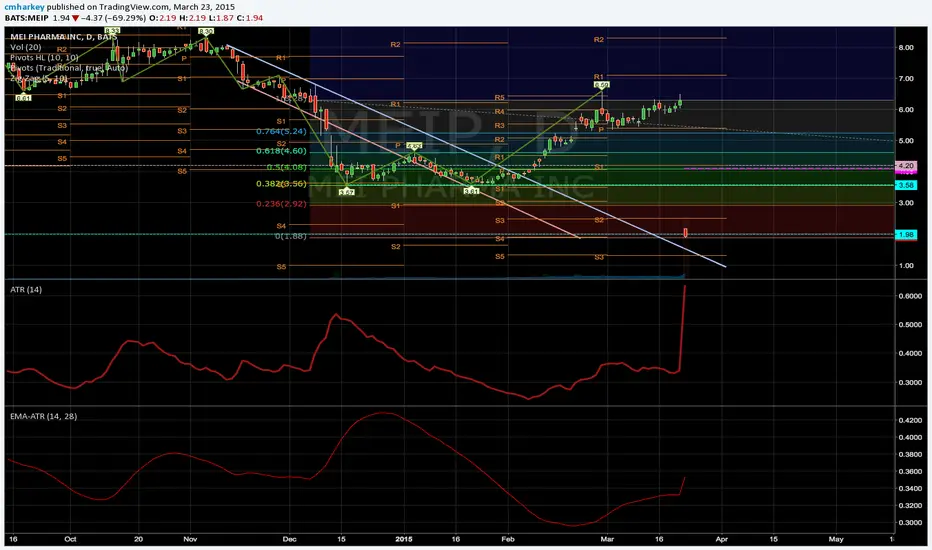
Moving Average of Average True Range - EMA ATRSo I came across the need of wanting to smooth out the ATR of something that has some violent swings in it in order to better place some stops.
Simply put the output of the ATR into the EMA function.
Everything is labeled easily in the settings window you you can clearly change period length for each function.
EMA Wave Indicator [LazyBear]This is a 3 EMA visualization tool. Relative momentum across 3 timeframes are rendered as A/B/C waves. Also, helpful in identifying spike/exhaustion bars.
When all the waves are in the same direction, the momentum is very high on that direction. I have made all options configurable, have fun tuning for your instrument :)
Complete list of all my indicators:
docs.google.com

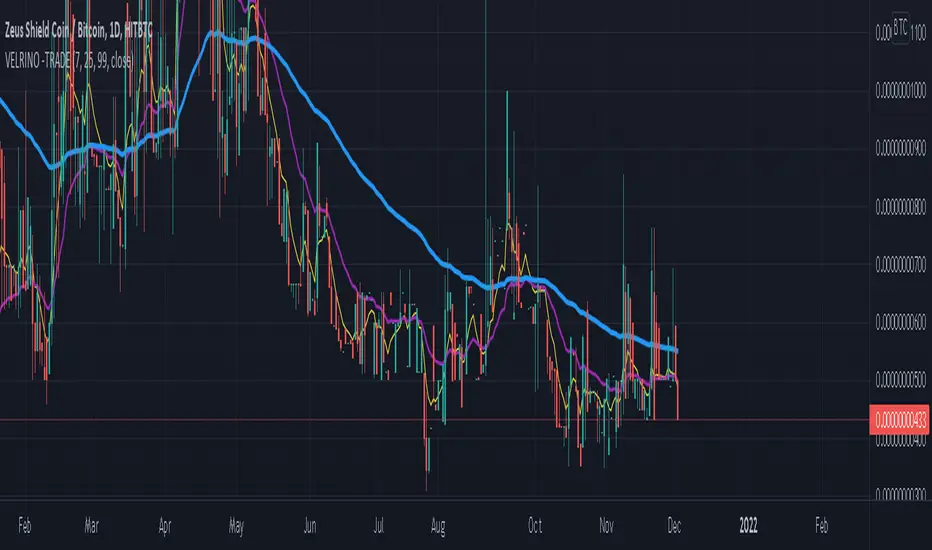
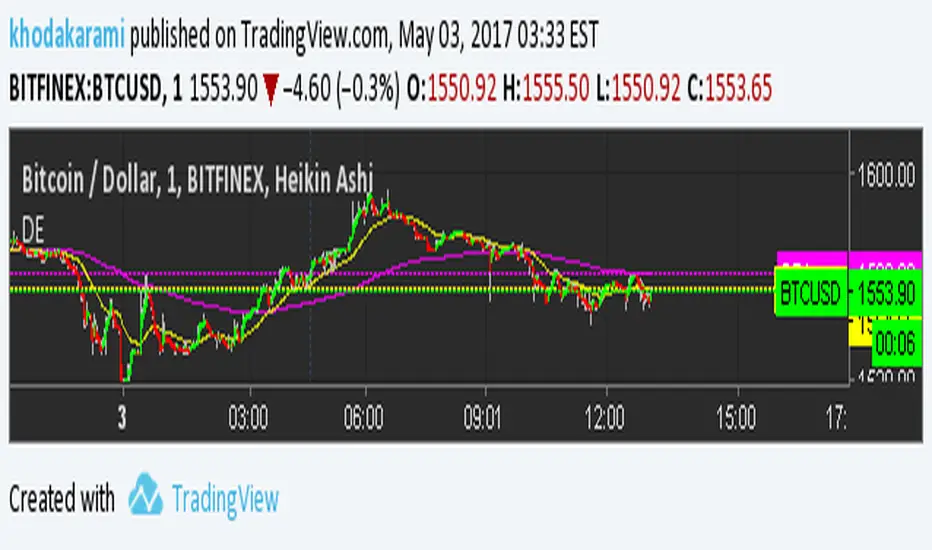
Ema(Ema10,10) Ema(Ema21,21) crossover strategyThis code works better in 1 hour for crypto currencies like BTC 1.51% or LTC.
It seems to beat the market. Feedback or improvement are welcome.


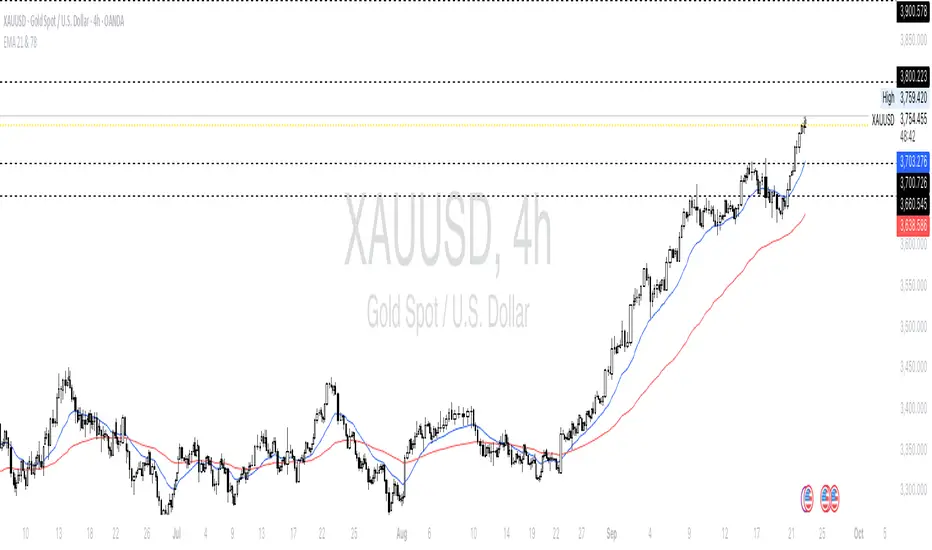
EMA 21 & 78 - With Instrument Nameonly add EMA21 and 78, I saw the 21 and 78 period is the most favor period when trading with gold
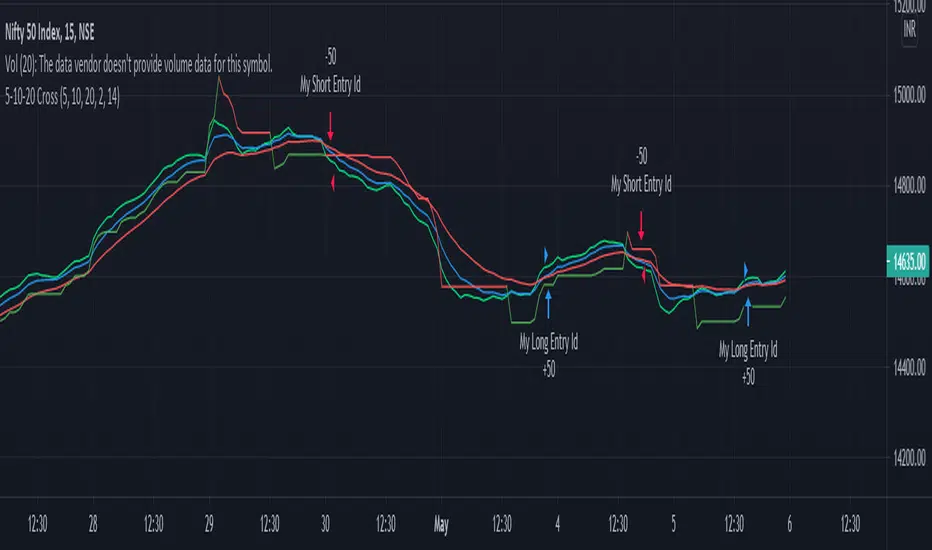
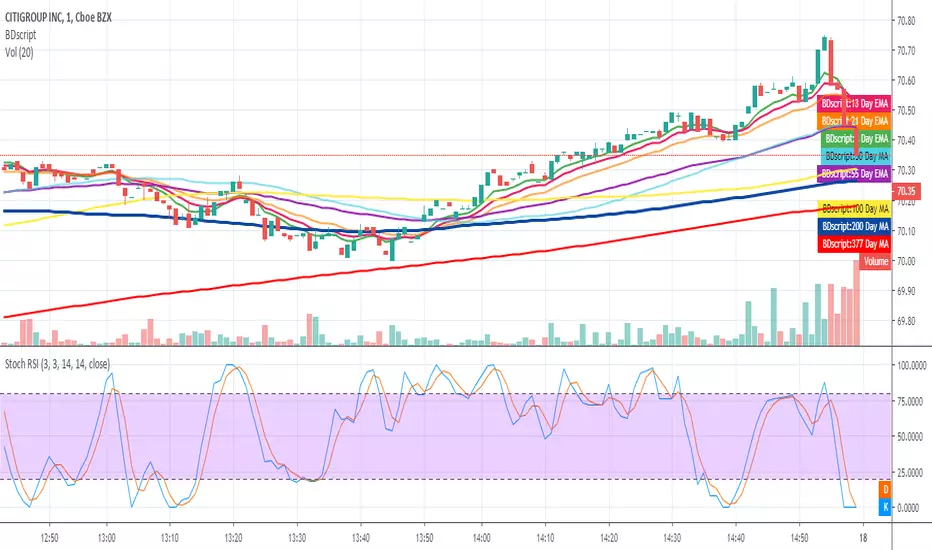
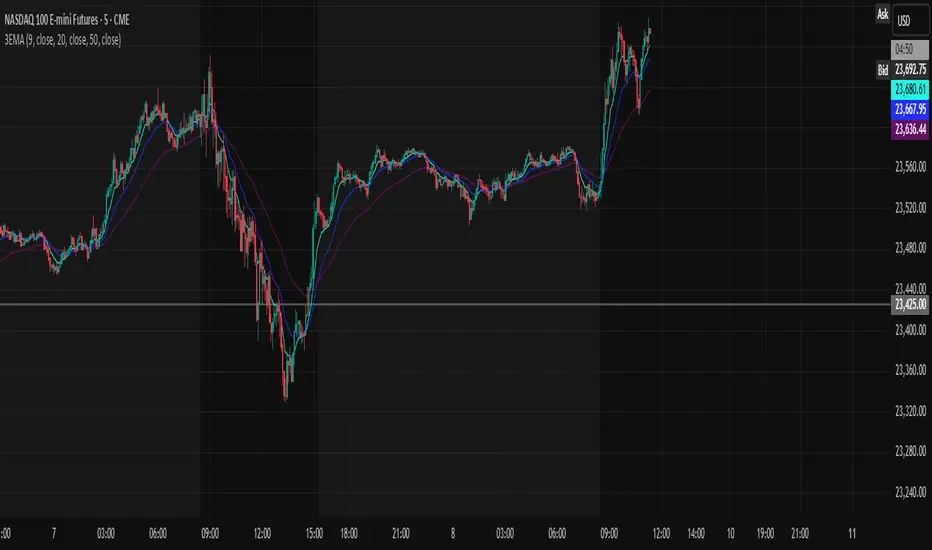
EMA 9, 20, 50Exponential Moving Averages of 9, 20, and 50. Used to gauge buy and sell opportunities in trending markets.
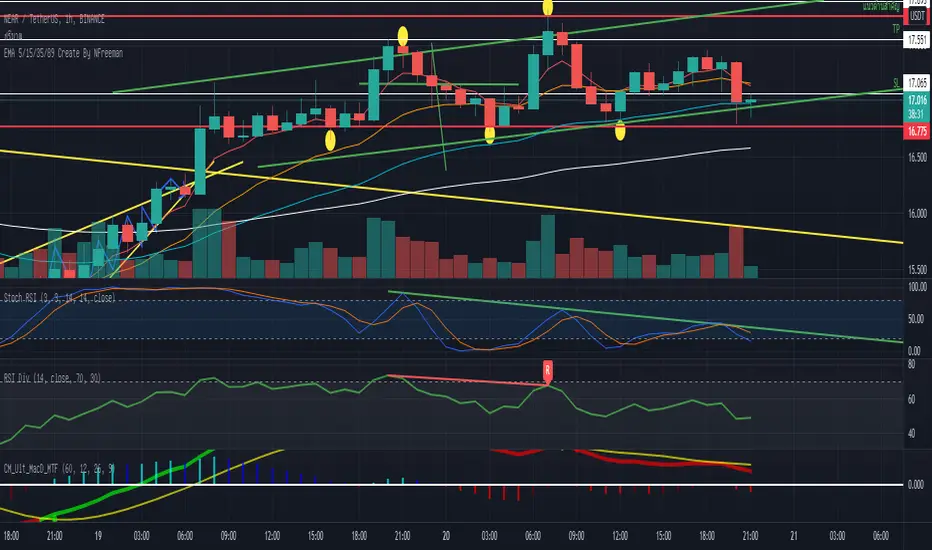
EMA 5/15/35/89 Create By NFreeman (Technical by CJ.SuperTrader)How to Use
เงื่อนไขการเล่นคือ UPTrend และดูแบบ TF1Day
-จังหวะการเข้าซื้อคือช่วงที่พักตัวลงมาระหว่าง EMA35-EMA89
-จังหวะที่ต้องบริหารความเสี่ยงคือช่วงหลุด EMA89
ขอให้ทุกคนเทรดได้ และมีความสุข