5min Williams Fractals scalping (3commas)Another strategy I'm learning Pine Script on. It is inspired by a MoneyZG youtube strategy called "Easy 5 Minute Scalping Strategy (Simple to Follow Scalping Trading Strategy)".
Again this is a one order per trade strategy compatible with the 3commas bot (works also with the free 3commas subscription). This strategy is based on the signals from Williams Fractals, taking the signals in reverse - red triangle indicates a bottom and hence we go long. The green triangle indicates a top so we go short. By default these signals are only accepted if they occur between the two Emas. However, you can also turn this off and when a WF signal comes in, only the current price has to be between the Emas. Stop loss is set to the current Ema slow and the take profit is a multiple of the distance to the slow ema.
Like previously I have added different filters as well as the ability to view essential things like the WF signal and Emas. I hope the script will help you to be more successful and if so it would be great if you could share here your setups, or tips on what would be good to refine to make it an even a more profitable strategy. Kind of a community approach so that we help each other out :).
Instructions for the 3commas connector:
1. First, you need to prepare 3commas Long/Short bots that will only listen to custom TV signals.
2. Inputs for the 3commas bot can be found at the end of the user inputs.
3. Once you have entered the required details into the inputs, turn on 3commas comments. They should appear on the chart (looks messy).
4. Now you can add the alert where you should paste the 3commas Webhook URL: 3commas.io
5. For the alert message text insert the placeholder {{strategy.order.comment}} and delete the rest.
6. Once the alert is saved, you can turn off those 3commas comments to have a clearer chart.
7. With a new alert, the bot and trade should launch.
In the near future I would like to publish more scripts that will carry similar elements as the first two, incl. compatibility with 3commas (I don't have access to another bot system). I will choose some strategies myself, but I will also be glad for some tips on what strategy would be good to do and is still missing here on Tradingview (short youtube videos or brief strategy manuals would be great).
Thanks and keep it up
PS: My screen values starting at Long Target Profit and ending at Pullback NOT greater than: 1.5; 1.5; 0; ON; 1; 2; OFF; 17; 36; ON; 0.05; ON; Chart; 14; 46; 50; 48.5; 51; OFF; 1; ON; 4; 2.
Cari skrip untuk "ema"

Simple EMA20 Strategy + StochasticThis is a Trend Following Strategy.
The intent of this strategy is to catchthe price as it trends higher than the 20-period EMA and sell immediately after the price closes below it.
I have implemented calculations from Stochastic to make sure the price is coming from an oversold area.
There is also a check to see if the 20-period EMA is trending higher than before.

MACD + CMF + EMA + Supertrend by TradeSmartHello everyone and welcome to our first script release!
This script is one of many upcoming scripts. This one is a test for us, how it works, how you guys like this kind of stuff, and for feedback what we should change/improve at.
SCRIPT IS OPTIMIZED FOR:
EUR/USD 30 MINUTE TIMEFRAME
Video of the Strategy:
Search for “MACD + CMF + 200 EMA + Supertrend Trading Strategy Tested 100 Times with Great Results!” on our channel.
In this video you can find the exact strategy we programmed, just one added feature: Supertrend trailing stop loss. (position gets closed once the price hits the Supertrend indicator)
Now you can modify the following:
MACD settings
Supertrend settings
EMA settings
CMF settings
We will update the script with more and more features.
The first update will be:
Modifiable risk to reward ratio.
I will make a video of how to use this indicator next week, explaining all the features and more!
Hope you like it! Don't forget to let us know what we should change or improve. Thanks, and have a great day!
STRATEGY ENTRY RULES
LONG
When CMF is above 0 and price is under EMA. Also MACD has made a double cross above the zero line (meaning one cross down and one cross up by the MACD line). Then go long!
Note:
MACD or Signal must return under 0 in order to start a new position
If either of the MACD lines touches the 0 line before entry, we skip the trade and wait for the next signal.
SHORT
When CMF is under 0 and price is under EMA. Also MACD has made a double cross under the zero line (meaning one cross up and one cross down by the MACD line). Then go short!
Note:
MACD or Signal must return under 0 in order to start a new position.
If either of the MACD lines touches the 0 line before entry, we skip the trade and wait for the next signal.
TAKE PROFIT
When price hits the exit price (calculated from stop loss with the risk ratio), then exit with 50% of the position. The other 50% will stay open until the price hits the supertrend or the base stop loss.
STOP LOSS
When price hits stop loss then exit the position. Stop loss is calculated from the Supertrend and it is a trailing one, meaning it changes based on the movement of the price.
QUANTITY TO BUY
The quantity to buy is based on the Risk Per Trade % attribute. This means that we can set how much money we want to risk on one trade. Meaning that if we lose that particular position, then a Risk Per Trade % value of our equity will be lost.
Example: if you set the Risk Per Trade % to 1 % and you have a 100$ account balance, then if you loose the trade you will loose 1$ max.

RSI Divergence + EMA @DaviddTechVery simple strategy that will look for Divergence on the RSI.
My Strategy for this was mixed with the 55 EMA which you can activate in the settings.
WARNING:
- For purpose educate only - My mission is to debunk fake strategies with code to find THE ONE.
- Plots EMAs and other values on chart.
- This script to change bars colors.

DEMA/EMA & VOLATILITY (VAMS)The biggest issue with momentum following strategies is over signaling during whipsaw periods. I created this strategy that measure momentum with DEMA (Fast Moving) and EMA (Slow moving). In order to mitigate over signaling during whipsaw periods I implemented the average true range percentage (ATRP) to measure realized volatility. If momentum is picking up while volatility is under a certain threshold it purchases the security. If momentum slows while volatility picks up it sells the security. Additionally, if momentum picks up, but volatility is high, it stays out of the security. This follows the theory that during sustained uptrends volatility will decrease, and during market corrections the volatility picks up. Following the old adage that markets climb up the stairs, and fall out the window. Note that this strategy does repaint due to it entering and closing positions at the close of the bars. I forgot to mention how volatility is measured high vs low. If the ATRP is above the EMA of the ATRP the strategy interprets the volatility is increasing and does not enter the security & Vice Versa for selling (with momentum signal of MAs)
This is just my first strategy, any feedback would be much appreciated.
Chandelier + BB + EMASIn this strategy I am using the Emas and bollinger bands' width to determine the entry conditions:
Objetive of emas: Determine the current market trend
BB: Avoid low volatility market periods
Chandelier: Exit trades
Long Condition:
Once the fast moving average turns above the slow ma is first signal
Entry into the trade if the width crosses above the threshold set up by the user
Short condition: Exact opposite to long condition
Current idea is using an suppose capital of 1000 USD and paying commissions of 0.2%.
Educational purposes only at the time.

3x SuperTrend Strategy (Mel0nTek) V1This is a triple SuperTrend based strategy for lower time frame trades such as day trades and scalping. I have not seen many strategies that combine multiple SuperTrends so I thought I would publish this one since I put it together and have been quite happy with the results. I have found through testing that the best results are on currency exchange markets such as Crypto or Forex on 1-15 min time frames.
The core idea was inspired by a youtube video put out by Trade Pro:
"Trade Pro - HIGHEST PROFIT Triple Supertrend Trading Strategy Proven 100 Trade Results"
I went ahead and set the defaults to the ones he uses in his video for anyone who wants to try a configuration similar to his. They work pretty well in general, however the EMA, SuperTrend ATR multipliers, and P/L ratio can be tuned/optimized to fit the timeframe/market desired. The video is quite good but not a required watch as I will explain below.
The 200EMA is used as a medium-term trend direction indicator.
- Price closing consistently above the 200EMA means that only long positions should be entered.
- Price closing consistently below 200EMA means that only short positions should be entered.
The 3 SuperTrend indicators should be used as direction confirmation for entries. Typically, price above SuperTrend indicates bullish movement, while price below SuperTrend indicates Bearish movement. However by itself, it is not a great indication to enter/exit positions in my experience. By combining 3 of them with slightly longer periods and increased ATR multipliers, we can get much stronger confirmation of trend direction/strength.
The way they are used in this strategy is such that:
- We only want to enter a position if at least 2 out of 3 SuperTrends are on our side.
- 3/3 SuperTrends on our side is the best case, since we are taking trades WITH momentum/price strength.
- The second farthest SuperTrend from entry price is used as a Stop Loss
SuperTrend being on our side is not the only requirement for an entry however. The probability of success is increased with SuperTrend, and a longer EMA on our side, but we want to be sure that we aren't getting in too late/after the movement has already happened.
So we use Stoch RSI to pick our entries where price is oversold/overbought and reversing. That means the Stoch RSI is above 80, or below 20, and our indication to enter the trade is when the 2 lines cross/begin reversing direction.
So with trend direction on our side, we can get really good entries at these oversold/overbought extremes, especially as it's reversing (Stoch RSI K and D are crossing). This allows us to use the SuperTrend as a support/stop loss on our entry since price should be above it.
Then we just target 1.5x our max loss so that even if we only win 50% of the time, we still make a profit.
The explicit rules of this strategy are as follows:
=== Rules ===
long only
- price above EMA200
short only
- price below EMA200
Stop Loss = 2nd SuperTrend line above (short) or below(long) entry candle
Profit = 1.5x SL/risk (Profit Ratio x Max Loss)
=== Entry Setup ===
LONG
- Stoch RSI below 20, cross up
- at least 2 SuperTrend lines below close
SHORT
- Stoch RSI above 80, cross down
- at least 2 SuperTrend lines above close
P.S. Special thanks to Trade Pro for producing so many quality videos, putting strategy claims to the test, and providing me with so many good ideas I apply to my own strategies.

Bollinger Bands Trending Reverse StrategyWelcome to yet another script. This script was a lot easier since I was stuck for so long on the Donchian Channels one and learned so much from that one that I could use in this one.
This code should be a lot cleaner compared to the Donchian Channels, but we'll leave that up to the pro's.
This strategy has two entry signals, long = when price hits lower band, while above EMA, previous candle was bearish and current candle is bullish.
Short = when price hits upper band, while below EMA, previous candle was bullish and current candle is bearish.
Take profits are the opposite side's band(lower band for long signals, upper band for short signals). This means our take profit price will change per bar.
Our stop loss doesn't change, it's the difference between entry price and the take profit target divided by the input risk reward.

Donchian Channels Trending Breakout StrategyThis script looks for two entry signals. Long is when the previous breakout of the donchian channels was a low, price is above the input EMA, current price is equal or higher than the upper band and we're not in a position yet. Short is the other way around, so previous breakout of the donchian channels was a high, price is below the input EMA, current price is equal or lower than the lower band.
I haven't found a script that does take the previous highs and lows into consideration. Works for any markets in any conditions because the stop loss and profit targets are based on the upper and lower band of the donchian channels, which means the stop loss and profit targets move with the trend.
For more details see the script itself, I wrote a ton of comments.

Stock Market Strategy : VWAP, MACD, EMA, Breakout, BBHello there,
Today I bring you a stock market strategy, specialized in NASDAQ stocks.
Its a daytrading strategy, that can only do a max of 1 trade per day. In this case it only trades the first 2 opening hours of the market.
The rules are simple :
We follow the trend based on a big EMA, in this case 200, after that, we check for VWAP direction , then, we check histogram from MACD. This is the simple logic of the strategy.
Inside there is another strategy, that not just do the above, but also uses Bollinger bands, and checks for breakout of bottom or top line. Also it uses Average directional Index, for even a bigger criteria .
So for example a long condition it would be : candle is above the ema, and candle is above vwap, and histogram is positive, and candle break the top bb level and ADI < 40 -> long signal . The opposite works for short(ADI > 20).
In this case all this criterias are between the first 2 hours of market. So we enter between the first hour, and exit in the next hour. For this we need to use very short time frames.
Hope you enjoy it.
Let me know if you have any questions

Arkaydeus Trend Strategy (by Arkaydeus) The Arkaydeus Trend Strategy uses a combination of a fast and slow EMA creating a trend ribbon but also introduces the following features:
A Big EMA to filter out buys which aren't following a higher level trend
A filter on only positive candles for entry
An entry only closing above a positive trending ribbon
A sideways noise threshold filter which is configurable to remove too many trades whilst ranging sideways
A toggled spike switch to exit trades on lows hitting threshold even if close doesn't
A % based trailing stop feature that is turned off by default
The indicator can be used as a trading strategy or you can switch trades off and just use the enter and exit points painted on the graph.
This strategy is designed for the larger Crypto assets ( BTC /ETH) and should be run on the daily time frame. It has been optimised for these and may not perform as well on other instruments.
It should not be used in heavily ranging markets which move sideways and is designed as a trend based long only strategy.
Strategy Tester EMA-SMA-RSI-MACDOn Tradingview I never saw a custom adjustable strategy script yet, so this is it,
you can change different things and see if you'll get a good strategy or not
Settings:
First choose the source, you can choose out of:
close, open, high, low, ohlc4, hlc3, hl2
Then choose you strategy: Long & Short, Long only or Short only
Next, choose your entry "Buy/Long" (which is the "close Short position" when "Short"):
- (E)MA 1 > (E)MA 2 (Each can be made ema or sma)
- close above (E)MA 1
- RSI strategy
- macd > signal
- macd > 0
- signal > 0
Then choose your RSI values if needed (for example you want a trigger when EMA 1 > SMA 2
but only if RSI > 60, then change "IF RSI >" from 0 to 60
Next you can choose an extra argument
and even a second argument with Higher Time Frame settings
Under this you can change your (E)MA values as desired (HTF values, MACD and RSI length can be found lower)
All the same with the exit/close (or if "Short", this is your entry)
Again, change everything as you wish
Then comes the RSI length setting, MACD settings and HTF settings, followed by SL/TP settings
(you also can enable/disable SL/TP), and TIME settings (for example you want to know the profit only from this year)
Alerts are provided in next script
Have fun!
OBV EMA X BF 🚀Credit to Lancelot_Augur for the idea of EMAs of On Balance Volume.
The signals are generated when the faster OBV EMA crosses the slower one.
BACKGROUND COLORS:
Green = go long
Red = go short
White = you have been stopped out
This strategy uses a 3% stop loss.

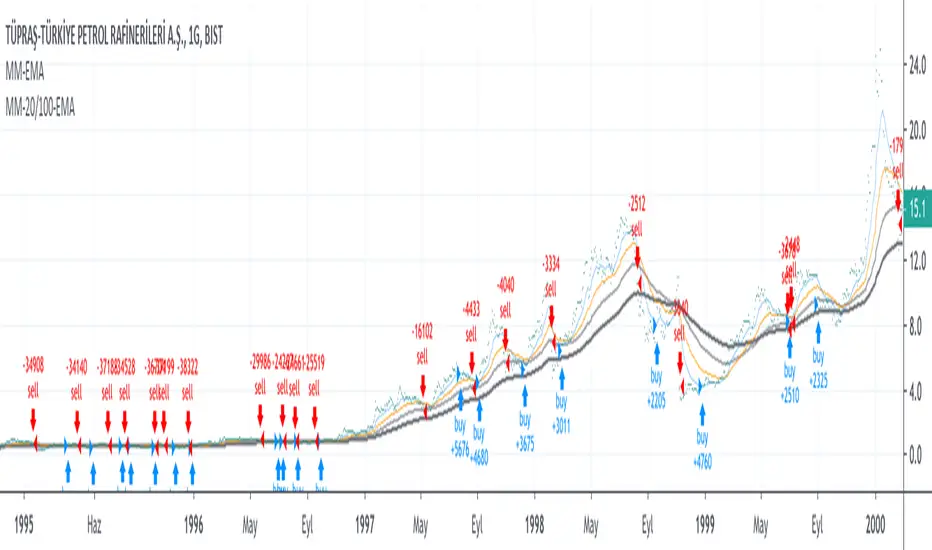
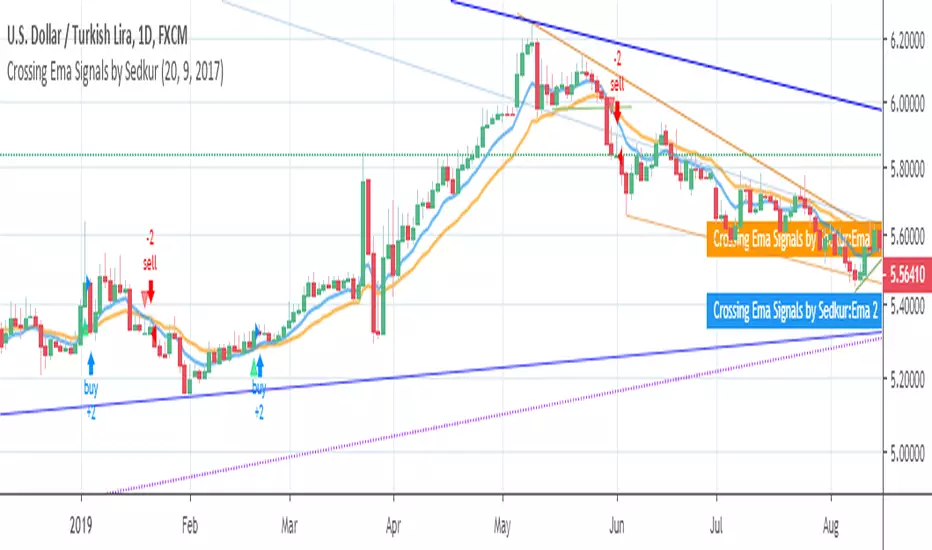
Crossing Ema Signals by SedkurGives an signals when 2 Ema's cross.
You can
- change EMA values
- change the signal start year
Parabolic SAR Strategy w/ EMALong when above EMA and SAR is in long state.
Short when below EMA and SAR is in short state.

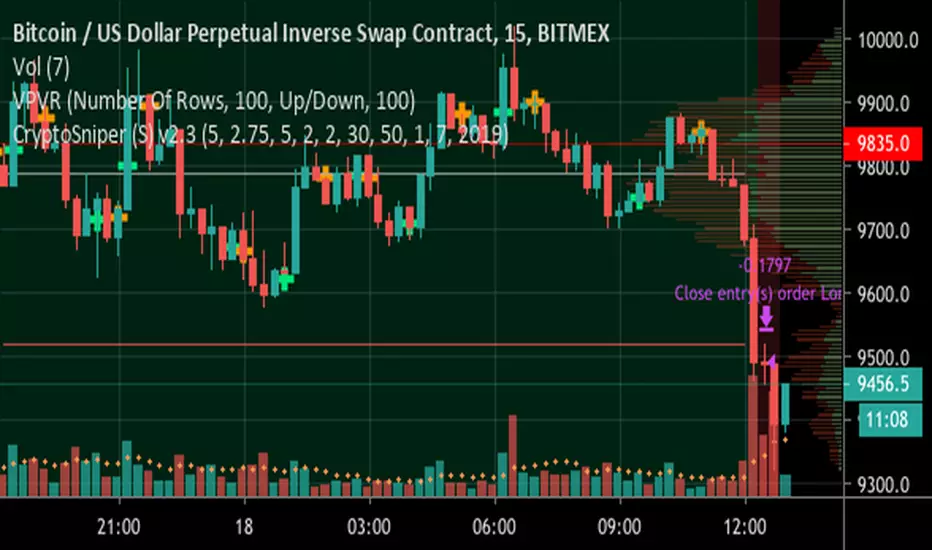
ck - CryptoSniper (Strategy) v2.1This strategy is radically different to the v1 script previously released.
It has ***NO REPAINTING*** - as such the algorithm had to change to remove it’s reliance on HMAs from future timeframes to establish trend, this is now accomplished with EMAs.
It is completely written in Pinescript v4.
It has integrated Stoploss and you can plot this & with the recommended Entry on the chart.
WARNING - This strategy has to be “tuned” to the instrument you are trading, for example, Bitcoin. The default settings work well for BTC/USD, XBT/USD on 15m chart timeframe but not for ETH/USD - it is possible the default settings will work with other crypto’s but I haven’t had time to test - if you find good settings PLEASE share them!
How to use:
1) Load up your favourite chart/instrument and select your favourite timeframe
2) Adjust the “signal” EMA and “baseline” EMA settings until you get the majority of uptrending moves highlighted with a green background and the majority of downtrending moves with a red background. The signal has to be faster (that is a lower number) than the baseline.
3) Adjust the “Sensitivity” - this will plot more green & orange Trigger points on the chart.
The strategy waits until in a trend, for example, a Long (green background) then waits for first green cross before opening a deal. It will Trigger a sell if the background turns red (downtrend) and a orange cross is printed.
4) Fine tuning:
A) Increase your profits by changing the Stoploss value - getting this right protects you from bad trades but also resets the indicator to provide another alert faster
B) You can increase the delay positions are opened or closed with the “Bar(s) offset to open position” and “Bar(s) offset to close position” settings. When you adjust these, 0 will buy/sell immediately when a Trigger cross is printed, 2 will wait until 2 bars/candles AFTER the Trigger cross prints to strat/close a position.
TIP: When adjusting indicator settings, load your chart and timeframe first.
Add the indicator/strategy (if you haven’t already).
Click the Strategy Tester tab at the bottom of the chart window so it is visible.
Open the strategy/indicator settings so you can see this wind AND the Strategy Tester display
Change a setting and click into a different setting input box, this will update the test results WITHOUT closing the settings window! This will save you a lot of time!
Write down any OK settings you find, you can come back later to fine tune them!
Please provide any feedback & let’s share the best settings for different crypto’s!

Investing - Weekly EMA's mapped to Daily ChartWhen there isn't enough time in your day to day-trade, yet you want to utilise all the technical analysis skills you have... why not make a long term investing or swing trading indicator set to help you along the way!
So I did....
When it comes to long term investing and swing trading, I often find the weekly 12/26/52 EMA's do a great job in capturing the main market swings from bull to bear.
However, I like to use the Daily chart to see the candle patterns and shapes with more detail and divergences often show up better on the daily chart.
So I have decided to combine the two!
I have basically taken the EMA 12/26/52 from the weekly and transferred them over to the daily (mathematically they are not exact, but for me they are close enough).
I have also developed a simple scale in / scale out strategy for using these exponential moving averages. It isn't as simple as buying in on each signal, however I use my own special strategy to take advantage of the alerts.
Enjoy!

Adaptive Zero Lag EMA v2 (Strategy w/ Backtest Date Range)This is a modified strategy including Date Range Selection for dasanc's incredible "Adaptive Zero Lag EMA v2":
The Original:

Adaptive Zero Lag EMA v2This is my most successful strategy to date! Please enjoy and join the Open Source movement by sharing your code and ideas online!
OPERATING PRINCIPLE
The strategy is based on Ehlers idea that any indicator can be turned into a signal-producing trade system through smoothing and other filtering processes.
In fact, I'm using his Zero Lag EMA (ZLEMA) as a baseline indicator as well as some code snippets he has made public (1). God bless open source!
Next, I've provided the option to use an Instantaneous Frequency Measurement (IFM) method, which will adaptively choose the best period for the ZLEMA (2)
I've written other studies that use the differential calculus approximations for IFM, so it was only natural to include them in this strategy.
The primary two are Cosine IFM (3) and In-phase Quadrature IFM (4). You can also find an indicator with both plotted and the ability to average them together, as one IFM prefers long periods and the other short. (5)
BEFORE WE BEGIN
1. This strategy only runs on "normal" FX pairs (EURUSD, GBPJPY, AUDUSD ...) and will fail on Metals or Commodities.
Cryptos are largely untested.
2. Please run it on these time frames: M15 to D.
Anything outside this range will likely fail.
HOW TO USE AND SUCCEED
1. If the Default settings don't produce good results right off the bat, then lower gain limit to 1 or 2 and threshold to 0.01.
2. Test each setting under adaptive method . If you want to leave it Off , then I'd recommend using some kind of IFM (see my links below) to
discover the most efficient period to use.
3. Once you have the best adaptive method chosen, begin incrementing gain limit until you find a nice balance between profit factor (PF) and drawdown.
4. Now, begin incrementing threshold . The goal is to have PF above 2 and a drawdown as low as possible.
5. Finally, change the source ! Typically, close is the best option, but I have run into cases where high
yielded the highest returns and win rate.
6. Sit back, relax, and tweak the risk until you're happy with the return and drawdown amounts.
ADVANCED
You may need to adjust take profit (TP) points and stop loss (SL) points to create the best entry possible. Don't be greedy! You'll likely have poor
results if the TP is set to 300 and SL is 50.
If you are trading a pair that has a long Dominant Cycle Period , then you may increase Max Period to allow the IFM
to accept longer periods. Any period above the Max Period will be rejected. This may increase lag time!
Cheers and good luck trading!
-DasanC
PS - This code doesn't repaint or have future-leak, which was present in Pinescript v2.
PPS - Believe me! These returns are typical! Sometimes you must push aside the "if it's too good to be true..." mindset that society has ingrained in you.
Do you really believe the most successful pass up opportunities before investigating them? ;)
(1) Ehlers & Ric Zero Lag EMA
(2) Measuring Cycles by Ehlers
(3) Cosine IFM
(4) Inphase Quadrature IFM
(5) Averaging IFM

EmaCross + Adx Strategylong = ema fast > ema slow, dmi+ > dmi- , dmi+ > 20, adx > 20
short = opposite of the first 3
Cheers!

MACD + RSI + EMA + SMA + Ichimoku + overbought + buy, sell +Doji// MACD + EMA 200 *** buy and sell strategy (RSI, EMA, SMA) *** Doji Harami *** overbought and oversold *** trend direction *** divergence *** Ichimoku
Use this script in time 1h