ORBs, EMAs, AVWAPThis Pine Script (version 6) is a multi-session trading indicator that combines Opening Range Breakouts (ORBs), Exponential Moving Averages (EMAs), and an Anchored VWAP (AVWAP) system — all in one overlay script for TradingView.
Here’s a clear breakdown of its structure and functionality:
🕒 1. Session Logic and ORB Calculation
Purpose: Identify and plot the high and low of the first 30 minutes (default) for the Tokyo, London, and New York trading sessions.
Session Anchors (NY time):
Tokyo → 20:00
London → 03:00
New York → 09:30
(All configurable in inputs.)
ORB Duration: Default is 30 minutes (orbDurationMin), also user-configurable.
Resets:
London and NY ORBs reset at the start of each new New York trading day (17:00 NY time).
Tokyo ORB resets independently using a stored timestamp.
Process:
For each session:
While the time is within the ORB window, the script captures the session’s high and low.
Once the window closes, those levels remain plotted until reset.
Plot Colors:
Tokyo → Yellow (#fecc02)
London → Gray (#8c9a9c)
New York → Magenta (#ff00c8)
These form visible horizontal lines marking the prior session ranges — useful for breakout or retest trading setups.
📈 2. EMA System
Purpose: Provide trend and dynamic support/resistance guidance.
It calculates and plots four EMAs:
EMA Period Color Purpose
EMA 9 Short-term Green Fast signal
EMA 20 Short-term Red Confirms direction
EMA 113 Medium Aqua Trend filter
EMA 200 Long-term Orange Macro trend baseline
Each EMA is plotted directly on the price chart for visual confluence with ORB and VWAP levels.
⚖️ 3. Anchored VWAP (AVWAP)
Purpose: Display a volume-weighted average price anchored to specific timeframes or events, optionally with dynamic deviation or percentage bands.
Features:
Anchor Options:
Time-based: Session, Week, Month, Quarter, Year, Decade, Century
Event-based: Earnings, Dividends, Splits
VWAP resets when the chosen anchor condition is met (e.g., new month, new earnings event, etc.).
Bands:
Up to three levels of symmetric upper/lower bands.
Choose between Standard Deviation or Percentage-based widths.
Display Toggles:
Each band’s visibility is optional.
VWAP can be hidden on 1D+ timeframes (hideonDWM option).
Color Scheme:
VWAP: Fuchsia (magenta-pink) line
Bands: Green / Olive / Teal with light-filled zones
⚙️ 4. Technical Highlights
Uses ta.vwap() with built-in band calculations.
Handles instruments with or without volume (errors if missing volume).
Uses time-zone aware timestamps (timestamp(NY_TZ, …)).
Uses timeframe.change() to detect new anchors for the VWAP.
Employs persistent variables (var) to maintain session state across bars.
💡 In Practice
This indicator is designed for multi-session intraday traders who:
Trade Tokyo, London, or NY open breakouts or retests.
Use EMA stacking and crossovers for trend confirmation.
Use Anchored VWAP as a fair-value or mean-reversion reference.
Need clear visual structure across different market sessions.
It provides strong session separation, trend context, and volume-weighted price reference — making it ideal for discretionary or semi-systematic trading strategies focused on liquidity zones and session momentum.
Cari skrip untuk "ema"

DAILY Supertrend + EMA Crossover with RSI FilterThis strategy is a technical trading approach that combines multiple indicators—Supertrend, Exponential Moving Averages (EMAs), and the Relative Strength Index (RSI)—to identify and manage trades.
Core Components:
1. Exponential Moving Averages (EMAs):
Two EMAs, one with a shorter period (fast) and one with a longer period (slow), are calculated. The idea is to spot when the faster EMA crosses above or below the slower EMA. A fast EMA crossing above the slow EMA often suggests upward momentum, while crossing below suggests downward momentum.
2. Supertrend Indicator:
The Supertrend uses Average True Range (ATR) to establish dynamic support and resistance lines. These lines shift above or below price depending on the prevailing trend. When price is above the Supertrend line, the trend is considered bullish; when below, it’s considered bearish. This helps ensure that the strategy trades only in the direction of the overall trend rather than against it.
3. RSI Filter:
The RSI measures momentum. It helps avoid buying into markets that are already overbought or selling into markets that are oversold. For example, when going long (buying), the strategy only proceeds if the RSI is not too high, and when going short (selling), it only proceeds if the RSI is not too low. This filter is meant to improve the quality of the trades by reducing the chance of entering right before a reversal.
4. Time Filters:
The strategy only triggers entries during user-specified date and time ranges. This is useful if one wants to limit trading activity to certain trading sessions or periods with higher market liquidity.
5. Risk Management via ATR-based Stops and Targets:
Both stop loss and take profit levels are set as multiples of the ATR. ATR measures volatility, so when volatility is higher, both stops and profit targets adjust to give the trade more breathing room. Conversely, when volatility is low, stops and targets tighten. This dynamic approach helps maintain consistent risk management regardless of market conditions.
Overall Logic Flow:
- First, the market conditions are analyzed through EMAs, Supertrend, and RSI.
- When a buy (long) condition is met—meaning the fast EMA crosses above the slow EMA, the trend is bullish according to Supertrend, and RSI is below the specified “overbought” threshold—the strategy initiates or adds to a long position.
- Similarly, when a sell (short) condition is met—meaning the fast EMA crosses below the slow EMA, the trend is bearish, and RSI is above the specified “oversold” threshold—it initiates or adds to a short position.
- Each position is protected by an automatically calculated stop loss and a take profit level based on ATR multiples.
Intended Result:
By blending trend detection, momentum filtering, and volatility-adjusted risk management, the strategy aims to capture moves in the primary trend direction while avoiding entries at excessively stretched prices. Allowing multiple entries can potentially amplify gains in strong trends but also increases exposure, which traders should consider in their risk management approach.
In essence, this strategy tries to ride established trends as indicated by the Supertrend and EMAs, filter out poor-quality entries using RSI, and dynamically manage trade risk through ATR-based stops and targets.

Gauti Market Maker Killzone EMA1. Identifying the Trend
Use Daily (1D) and Hourly (1H) Exponential Moving Averages (EMAs) to define the overall trend:
Bullish Trend: Both 1D and 1H EMAs are upward sloping, and the price is above these EMAs.
Bearish Trend: Both 1D and 1H EMAs are downward sloping, and the price is below these EMAs.
2. Confirmation with Higher Timeframes
Bullish Conditions:
Check 1D and 4H charts for price action above the EMA bands.
Look for price forming higher highs and higher lows or respecting support at the EMA bands.
Bearish Conditions:
Check 1D and 4H charts for price action below the EMA bands.
Look for price forming lower highs and lower lows or respecting resistance at the EMA bands.
Note: Crossover of EMAs on higher timeframes is an optional extra confirmation, but not mandatory for entry.
3. Entry Strategy
Use the 15-Minute (15M) timeframe for entries.
Entries are taken only during Killzones:
Killzones: London Open, New York Open, or other intraday key trading sessions. (Define the time ranges for these zones based on your trading hours.)
Wait for the price to touch or pull back to the EMA band during the Killzones in the direction of the overall trend:
In a bullish trend, enter long when the price touches the EMA band and shows signs of rejection or reversal.
In a bearish trend, enter short when the price touches the EMA band and shows signs of rejection or reversal.
4. Checklist for Entry
Confirm the following before entering:
1D Trend aligns with the 1H Trend.
Price Action in 1D and 4H supports the trend.
Killzone session is active.
Price is reacting to the EMA band on the 15M chart in the trend direction.

DNSE VN301!, SMA & EMA Cross StrategyDiscover the tailored Pinescript to trade VN30F1M Future Contracts intraday, the strategy focuses on SMA & EMA crosses to identify potential entry/exit points. The script closes all positions by 14:25 to avoid holding any contracts overnight.
HNX:VN301!
www.tradingview.com
Setting & Backtest result:
1-minute chart, initial capital of VND 100 million, entering 4 contracts per time, backtest result from Jan-2024 to Nov-2024 yielded a return over 40%, executed over 1,000 trades (average of 4 trades/day), winning trades rate ~ 30% with a profit factor of 1.10.
The default setting of the script:
A decent optimization is reached when SMA and EMA periods are set to 60 and 15 respectively while the Long/Short stop-loss level is set to 20 ticks (2 points) from the entry price.
Entry & Exit conditions:
Long signals are generated when ema(15) crosses over sma(60) while Short signals happen when ema(15) crosses under sma(60). Long orders are closed when ema(15) crosses under sma(60) while Short orders are closed when ema(15) crosses over sma(60).
Exit conditions happen when (whichever came first):
Another Long/Short signal is generated
The Stop-loss level is reached
The Cut-off time is reached (14:25 every day)
*Disclaimers:
Futures Contracts Trading are subjected to a high degree of risk and price movements can fluctuate significantly. This script functions as a reference source and should be used after users have clearly understood how futures trading works, accessed their risk tolerance level, and are knowledgeable of the functioning logic behind the script.
Users are solely responsible for their investment decisions, and DNSE is not responsible for any potential losses from applying such a strategy to real-life trading activities. Past performance is not indicative/guarantee of future results, kindly reach out to us should you have specific questions about this script.
---------------------------------------------------------------------------------------
Khám phá Pinescript được thiết kế riêng để giao dịch Hợp đồng tương lai VN30F1M trong ngày, chiến lược tập trung vào các đường SMA & EMA cắt nhau để xác định các điểm vào/ra tiềm năng. Chiến lược sẽ đóng tất cả các vị thế trước 14:25 để tránh giữ bất kỳ hợp đồng nào qua đêm.
Thiết lập & Kết quả backtest:
Chart 1 phút, vốn ban đầu là 100 triệu đồng, vào 4 hợp đồng mỗi lần, kết quả backtest từ tháng 1/2024 tới tháng 11/2024 mang lại lợi nhuận trên 40%, thực hiện hơn 1.000 giao dịch (trung bình 4 giao dịch/ngày), tỷ lệ giao dịch thắng ~ 30% với hệ số lợi nhuận là 1,10.
Thiết lập mặc định của chiến lược:
Đạt được một mức tối ưu ổn khi SMA và EMA periods được đặt lần lượt là 60 và 15 trong khi mức cắt lỗ được đặt thành 20 tick (2 điểm) từ giá vào.
Điều kiện Mở và Đóng vị thế:
Tín hiệu Long được tạo ra khi ema(15) cắt trên sma(60) trong khi tín hiệu Short xảy ra khi ema(15) cắt dưới sma(60). Lệnh Long được đóng khi ema(15) cắt dưới sma(60) trong khi lệnh Short được đóng khi ema(15) cắt lên sma(60).
Điều kiện đóng vị thể xảy ra khi (tùy điều kiện nào đến trước):
Một tín hiệu Long/Short khác được tạo ra
Giá chạm mức cắt lỗ
Lệnh chưa đóng nhưng tới giờ cut-off (14:25 hàng ngày)
*Tuyên bố miễn trừ trách nhiệm:
Giao dịch hợp đồng tương lai có mức rủi ro cao và giá có thể dao động đáng kể. Chiến lược này hoạt động như một nguồn tham khảo và nên được sử dụng sau khi người dùng đã hiểu rõ cách thức giao dịch hợp đồng tương lai, đã đánh giá mức độ chấp nhận rủi ro của bản thân và hiểu rõ về logic vận hành của chiến lược này.
Người dùng hoàn toàn chịu trách nhiệm về các quyết định đầu tư của mình và DNSE không chịu trách nhiệm về bất kỳ khoản lỗ tiềm ẩn nào khi áp dụng chiến lược này vào các hoạt động giao dịch thực tế. Hiệu suất trong quá khứ không chỉ ra/cam kết kết quả trong tương lai, vui lòng liên hệ với chúng tôi nếu bạn có thắc mắc cụ thể về chiến lược giao dịch này.

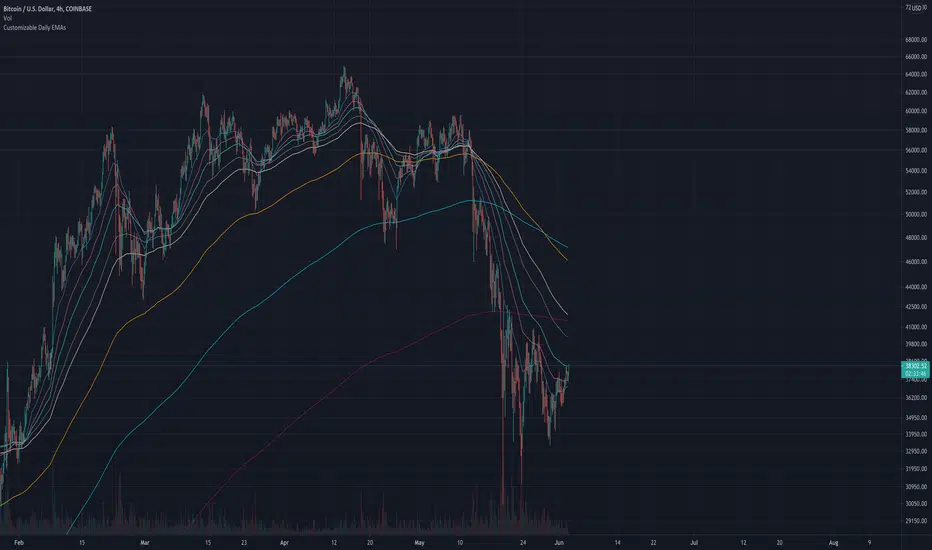
Customizable Daily EMAs (up to 8)This indicator provides you with up to 8 different EMAs that are customizable.
You can specify how many EMAs you want on the chart (up to a maximum of 8), as well as the length and color of each EMA. In addition, the resolution of all EMAs can also be customized - by default all EMAs follow the Daily timeframe but you could set this to any timeframe you want or you could choose for it to follow the timeframe chart as most other EMA Indicators do.
The reason for creating this indicator is because I was looking for Daily EMAs, but wanted to view the chart in a different time period without the EMA lines themselves changing. In addition, I wanted to view ample EMAs at once, and have the ability to change their length as I see fit.
You can see this demonstrated on the 4-hour chart above. Despite the chart being a 4 hourly chart, the EMAs are Daily EMAs.
In the example above all 8 EMAs have been activated, but you could turn any of these off to suit your own preferences.
The default EMAs are set to the following: 20, 50, 100, 200, 5, 9, 13, 26.
The First 4 are ideal for longer-term targets, while the smaller timeframes are more suited to short-term trading targets.
I have made this script Open-source for anybody to view, copy and modify if they need.
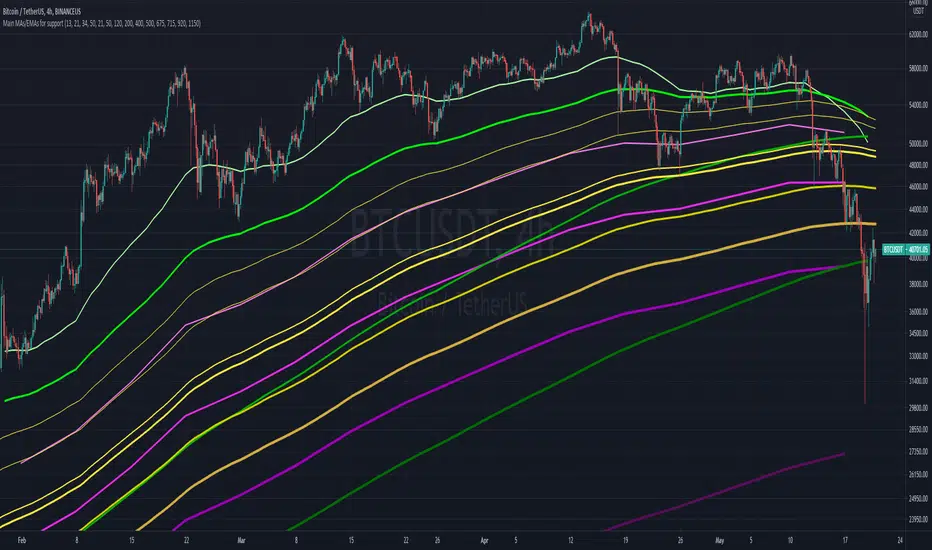
Main MAs and EMAs multi-timeframe for supportObjective is to map out different multi-timeframe support/resistance , all at once. Includes weekly, daily and 4H EMAs and MAs, as per the follow (allowing customization)
WEEKLY (in pink/purple variations):
- 13 EMA
- 21 EMA
- 34 EMA
- 50 M.A
DAILY (in green variations):
- 21 EMA
- 50 EMA
- 120 M.A.
- 200 M.A.
4H (in yellow/golden colors):
- 400 EMA
- 500 EMA
- 675 EMA
- 715 EMA
- 920 EMA
- 1150 EMA
Notes:
- Quite useful to all types of assets; crypto, commodities , stocks, etc...
- Ideally not to be visible all the time, as it can "pollute" the charts. But very helpful in moments of great volatility
EMA CrossoversUseful for identifying and receiving alerts about uptrends and downtrends.
This script uses two Exponential Moving Averages (EMAs) to find price uptrends and downtrends. An Exponential Moving Average (EMA) is a type of moving average that places a greater weight and significance on the most recent data points. The script produces uptrend and downtrend signals based on crossovers and divergences between the two EMAs, the user will be able to spot a trend change (when the EMAs crossover) and to determine the strength of the current trend (when the EMAs diverge). It is also posible to get alerts for uptrends and downtrends on the web and mobile app with sound and pop-ups as well as via email. The optimal time to enter and exit the market can be concluded from this trend changes.
The user can set their own EMAs, by default they are set to 21 and 55 periods for medium and long term respectively. When the medium term EMA crosses below the long term EMA the asset is in a downtrend and the price will decline, and when the medium term EMA crosses above the long term EMA the asset is in an uptrend and price will increase.
This scripts plots the following indicators and signals on the chart to help the user to identify trends:
1.- Medium and long term EMAs as lines overlaid on the price chart.
2.- Up green triangles above bars when the price is on an uptrend and down red triangles below bars when the price is on a downtrend.
3.- Arrows with text to indicate the start of an uptrend or downtrend.
The user can enable and disable the indicators and signals as well as set colors and shapes to their liking.
This script also lets the user create alerts for uptrends and downtrends. To create a new alert using this script follow this instructions:
1.- Once you added this script to your chart, go to the alerts panel (right on web or bottom tool bar on the mobile app) and add a new alert (alarm clock icon with a plus sign).
2.- A modal window will open. On the “Condition” dropdown menu select “EMA Crossovers”.
3.- On the next dropdown menu (right below the “Condition” one) you can select from two types of alerts “Uptrend started” and “Downtrend started”.
4.- Lastly you can set all the normal alert options and create the alert.

Dual HTF EMAMulti-timeframe Exponential Moving Average (EMA) indicator plots two separate higher timeframe (HTF) EMAs of your choice. Displays four EMAs per HTF while providing optional background coloring (bullish/bearish). The background coloring occurs when two EMA's cross per HTF. User can select two of the four EMAs to determine the trend direction as they cross creating the background color.
User can configure timeframe, EMA lengths, EMA cross and background, source, and visibility; separately for each timeframe.
Default lengths are 9, 21, 50, 200 with source as closed and EMA cross background from EMA 1 and EMA 3. Also clear visual distinction using thick solid lines for HTF 1 and thin dashed lines for HTF 2.
Uses request.security() with gaps=barmerge.gaps_on to avoid staircase effects on lower timeframes.
This script is ideal for multi-timeframe analysis, helping traders align shorter-term price movements with broader trends from higher timeframes without cluttering the chart.

Color Change EMA 200 (4H)200 Color Change EMA (4H Locked)
Overview
This indicator displays a 200-period Exponential Moving Average (EMA) that is locked to the 4-hour timeframe, regardless of what chart timeframe you're currently viewing. The EMA line changes color dynamically based on price action to provide clear visual trend signals.
Key Features
• Multi-Timeframe Capability : Always shows the 4H 200 EMA on any chart timeframe
• Dynamic Color Coding :
- Green: Price is above the 200 EMA (bullish condition)
- Red: Price is below the 200 EMA (bearish condition)
• Clean Visual Design : Bold 2-pixel line width for clear visibility
• Real-time Updates : Colors change instantly as price crosses above or below the EMA
How to Use
1. Add the indicator to any timeframe chart
2. The 4H 200 EMA will appear as a smooth line
3. Watch for color changes:
- When the line turns green, it indicates price strength above the key moving average
- When the line turns red, it suggests price weakness below the moving average
4. Use for trend identification, support/resistance levels, and entry/exit timing
Best Practices
• Combine with other technical analysis tools for confirmation
• Use the color changes as alerts for potential trend shifts
• Consider the 200 EMA as a major support/resistance level
• Works well for swing trading and position sizing decisions
Settings
• Length : Default 200 periods (customizable)
• Source : Default closing price (customizable)
Perfect for traders who want to keep the important 4H 200 EMA visible across all timeframes with instant visual trend feedback.

MicuRobert EMA Cross StrategyThis is a repost of a old strategy that cant be updated anymore, it was a request for a user made in Oct, 6, 2015
Here's a possible engaging description for the tradingview script:
**MicuRobert EMA Cross V2: A Powerful Trading Strategy**
Join the ranks of successful traders with this advanced strategy, designed to help you profit from market trends. The MicuRobert EMA Cross V2 combines two essential indicators - Exponential Moving Average (EMA) and Divergence EMA (DEMA) - to generate buy and sell signals.
**Key Features:**
* **Trading Session Filter**: Only trade during your preferred session, ensuring you're in sync with market conditions.
* **Trailing Stop**: Automatically adjust stop-loss levels to lock in profits or limit losses.
* **Customizable Trade Size**: Set the size of each trade based on your risk tolerance and trading goals.
**How it Works:**
The script uses two EMAs (5-period and 34-period) to identify trends. When the shorter EMA crosses above the longer one, a buy signal is generated. Conversely, when the shorter EMA falls below the longer one, a sell signal is triggered. The strategy also incorporates divergence analysis between price action and the EMAs.
**Visual Aids:**
* **EMA Plots**: Visualize the two EMAs on your chart to gauge market momentum.
* **Buy/Sell Signals**: See when buy or sell signals are generated, along with their corresponding entry prices.
* **Trailing Stop Lines**: Monitor stop-loss levels as they adjust based on price action.
**Get Started:**
Download this script and start trading like a pro! With its robust features and customizable settings, the MicuRobert EMA Cross V2 is an excellent addition to any trader's arsenal.
~Llama3

EMA Volatility Channel [QuantAlgo]EMA Volatility Channel 🌊📈
The EMA Volatility Channel by QuantAlgo is an advanced technical indicator designed to capture price volatility and trend dynamics through adaptive channels based on exponential moving averages. This sophisticated system combines EMA-based trend analysis with dynamic volatility-adjusted bands to help traders and investors identify trend direction, potential reversals, and market volatility conditions. By evaluating both price momentum and volatility together, this tool enables users to make informed trading decisions while adapting to changing market conditions.
💫 Dynamic Channel Architecture
The EMA Volatility Channel provides a unique framework for assessing market trends through a blend of exponential moving averages and volatility-based channel calculations. Unlike traditional channel indicators that use fixed-width bands, this system incorporates dynamic volatility measurements to adjust channel width automatically, helping users determine whether price movements are significant relative to current market conditions. By combining smooth EMA trends with adaptive volatility bands, it evaluates both directional movement and market volatility, while the smoothing parameters ensure stable yet responsive channel adjustments. This adaptive approach allows users to identify trending conditions while remaining aware of volatility expansions and contractions, enhancing both trend-following and reversal strategies.
📊 Indicator Components & Mechanics
The EMA Volatility Channel is composed of several technical components that create a dynamic channel system:
EMA Midline: Calculates a smoothed exponential moving average that serves as the channel's centerline, providing a clear reference for trend direction.
Volatility Measurement: Computes average price movement to determine dynamic channel width, adapting to changing market conditions automatically.
Smooth Band Calculation: Applies additional smoothing to the channel bands, reducing noise while maintaining responsiveness to significant price movements.
📈 Key Indicators and Features
The EMA Volatility Channel combines various technical tools to deliver a comprehensive analysis of market conditions.
The indicator utilizes exponential moving averages with customizable length and smoothing parameters to adapt to different trading styles. Volatility calculations are applied to determine channel width, providing context-aware boundaries for price movement. The trend detection component evaluates price action relative to the channel bands, helping validate trends and identify potential reversals.
The indicator incorporates multi-layered visualization with color-coded channels and bars to signal both trend direction and market position. These adaptive visual cues, combined with programmable alerts for channel breakouts, help traders and investors track both trend changes and volatility conditions, supporting both trend-following and mean-reversion strategies.
⚡️ Practical Applications and Examples
✅ Add the Indicator: Add the indicator to your TradingView chart by clicking on the star icon to add it to your favorites ⭐️
👀 Monitor Channel Position: Watch the price position relative to the channel bands to identify trend direction and potential reversals. When price moves outside the channel, consider potential trend changes or extreme conditions.
🔔 Set Alerts: Configure alerts for channel breakouts and trend changes, ensuring you can act on significant technical developments promptly.
🌟 Summary and Tips
The EMA Volatility Channel by QuantAlgo is a versatile technical tool, designed to support both trend following and volatility analysis across different market environments. By combining smooth EMA trends with dynamic volatility-based channels, it helps traders and investors identify significant price movements while measuring market volatility, providing reliable technical signals. The tool's adaptability across timeframes makes it suitable for both trend-following and reversal strategies, allowing users to capture opportunities while maintaining awareness of changing market conditions.

J Lines EMA + VWAPThe EMA + VWAP indicator combines the power of Exponential Moving Averages (EMA) with the Volume Weighted Average Price (VWAP) to help traders spot trends, identify potential entries/exits, and understand market momentum with ease. This dual-purpose tool is designed to give both beginner and experienced traders a clear view of price direction and volume influence, whether for day trading or swing trading.
Key Features:
Dynamic EMA Lines:
Six customizable moving averages (EMA by default) adapt to your selected timeframe. EMAs help track trend direction and strength, with various colors and opacity settings that visually separate them for clarity.
VWAP Tracking: A standalone VWAP line (blue) shows the average trading price adjusted for volume, making it ideal for pinpointing significant price levels where institutional interest often lies.
EMA Ribbons for Trend Confirmation: Soft-colored ribbons are placed between EMA pairs to make the trend strength visually apparent, with different color fills between lines. This makes it easy to gauge bullish or bearish conditions at a glance.
Flexible MA Options: Besides EMA, you can choose from SMA, WMA, HMA, and RMA, allowing you to adapt the indicator to various trading strategies.
This tool simplifies trend-following and volume-based analysis by giving you insight into both price momentum and market participation levels. EMAs adapt to volatility and changing market conditions, while the VWAP keeps you aware of critical price zones based on trading volume. Together, these help you stay on the right side of the market, avoid false breakouts, and make informed decisions on when to enter or exit trades.
Ideal for beginners due to its visual clarity and flexible enough for seasoned traders, EMA + VWAP is your go-to indicator for a structured approach to market trends.

EMA Cross Dashboard | Flux Charts💎 GENERAL OVERVIEW
Introducing our new Exponential Moving Average (EMA) Cross Dashboard! This dashboard let's you select a source for the calculation of the EMA of it, then let's you enter 2 lengths for up to 5 timeframes, plotting their crosses in the chart.
Features of the new EMA Cross Dashboard :
Shows EMA Crosses Across Up To 5 Different Timeframes.
Select Any Source, Including Other Indicators.
Customizable Dashboard.
📌 HOW DOES IT WORK ?
EMA is a widely used indicator within trading community, it is similar to a Simple Moving Average (SMA) but places more weight on recent prices, making it more reactive to current trends. Crosses of EMA lines can be helpful to determine strong bullish & bearish movements of an asset. This indicator shows finds crosses across 5 different timeframes in a dashboard and plots them in your chart for ease of use.
🚩UNIQUENESS
This dashboard cuts through the hassle of manual EMA cross calculations and plotting. It offers flexibility by allowing various data sources (even custom indicators) and customization through enabling / disabling individual timeframes. The clear visualization lets you see EMA crosses efficiently.
⚙️SETTINGS
1. Timeframes
You can set up to 5 timeframes & 2 lenghts to detect crosses for each timeframe here. You can also enable / disable them.
2. General Configuration
EMA Source -> You can select the source for the calculation of the EMA here. You can select sources from other indicators as well as more general sources like close, high and low price.

Zero-lag Volatility-Breakout EMA Trend StrategyThis is a simple volatility-breakout strategy which uses the difference in two different zero-lag* EMAs (explained below on what exactly I mean by this) to track the upwards or downwards strength of an instrument. When the difference breaks above a Bollinger Band of a configurable standard deviation multiple, the strategy enters based off the direction of the base EMA used (i.e. if the difference breaks above and the current EMA is rising, a long entry is produced. If the difference breaks above and the current EMA is falling, a short entry is produced).
The two EMA-type metrics used to calculate the volatility difference are calculated by the following formula:
top_ema = math.max(src, ta.ema(src, length))
bottom_ema = math.min(src, ta.ema(src, length))
ema_difference = (top_ema - bottom_ema) - 1
This produces a difference which responds immediately to large price movements, instead of lagging if it used strictly the EMA itself.
SETTINGS
Source : The source of the strategy - close, hlc3, another indicator plot, etc.
EMA Difference Length : The length of both the EMA difference statistics and the base EMA used to calculate the entry side.
Standard Deviation Multiple : The Bollinger Bands multiple used when the difference is breaking out.
Use Binary Strategy : The strategy has two configurations: Binary and Rapid-Exit. 'Binary' means that it will not close a long position until a short position is generated, and vice-versa. 'Rapid-Exit' will close a long or short position once the difference reaches the middle Bollinger Band MA. This means that turning on 'Binary' will expose you to more market risk, but potentially greater market return. Turning off 'Binary' will exit quickly and reduce drawdown.
The strategy results below use 10% equity and 0.1% fees per trade.

EMA x 3 MAsThis indicator can be used for moving average strategies based on a EMA trigger over MAs (SMAs) : MA1 , MA2 , MA3 .
Based on those crossings, the background color will change for the upcoming candle showing green for upper crossing change (the more MA are crossed, the darker is the background). Order and priority of background colors :
1/ EMA x MA1
2/ EMA x MA2 (if EMA x MA1 confirmed)
3/ EMA x MA3 (if EMA x MA1and EMA x MA2 confirmed)
EMA and MAs can also be tuned with your own values in the parameters, therefore allowing you to try different strategies and to use the EMA and MAs as support/resistance indication.
You can set up the background and lines colors in the Style in the parameters.

All in One EMA indicator with Average EMA Calculations The Indicator displays multiple exponential moving averages (EMAs) on the chart. The six available options will let you adjust and set ]exponential moving averages ( EMAS) as per your choice. Additionally I have added an Average ema which will calculate the average of all the emas that you have selected. This average ema works very strong and greatly to find potential zone of dynamic supports and resistance as well as to gauge the overall trend .. The average ema will also allow you to keep your chart clean and you wont have to add too many emas together.
The average of the selected EMAs are displayed as a single line. This helps identify trends and potential reversals in the market. i hope this indicator will help you with trading...
Plz use the chart BINANCE:LINKBTC as reference, for back testing and educational purposes only.
Thumbs up if you liked the script.
Happy trading..

TASC 2022.09 LRAdj EMA█ OVERVIEW
TASC's September 2022 edition of Traders' Tips includes an article by Vitali Apirine titled "The Linear Regression-Adjusted Exponential Moving Average". This script implements the titular indicator presented in this article.
█ CONCEPT
The Linear Regression-Adjusted Exponential Moving Average (LRAdj EMA) is a new tool that combines a linear regression indicator with exponential moving averages . First, the indicator accounts for the linear regression deviation, that is, the distance between the price and the linear regression indicator. Subsequently, an exponential moving average (EMA) smooths the price data and and provides an indication of the current direction.
As part of a trading system, LRAdj EMA can be used in conjunction with an exponential moving average of the same length to identify the overall trend. Alternatively, using LRAdj EMAs of different lengths together can help identify turning points.
█ CALCULATION
The script uses the following input parameters:
EMA Length
LR Lookback Period
Multiplier
The calculation of LRAdj EMA is carried out as follows:
Current LRAdj EMA = Prior LRAdj EMA + MLTP × (1+ LRAdj × Multiplier ) × ( Price − Prior LRAdj EMA ),
where MLTP is a weighting multiplier defined as MLTP = 2 ⁄ ( EMA Length + 1), and LRAdj is the linear regression adjustment (LRAdj) multiplier:
LRAdj = (Abs( Current LR Dist )−Abs( Minimum LR Dist )) ⁄ (Abs( Maximum LR Dist )−Abs( Minimum LR Dist ))
When calculating the LRAdj multiplier, the absolute values of the following quantities are used:
Current LR Dist is the distance between the current close and the linear regression indicator with a length determined by the LR Lookback Period parameter,
Minimum LR Dist is the minimum distance between the close and the linear regression indicator for the LR lookback period ,
Maximum LR Dist is the maximum distance between the close and the linear regression indicator for the LR lookback period .

Combined Momentum MA (Equal-Length EMA/SMA Crossover)Overview:
This momentum and trend-following strategy captures the majority of any trending move, and works well on high timeframes.
It uses an equal-period EMA and SMA crossover to detect trend acceleration/deceleration, since an EMA places a greater weight and significance on the most recent data.
To reduce noise and optimize entries, we combined this with an overall trend bias for further confluence.
How it works:
Signals are determined by the crossover of an EMA and SMA of the same length, e.g. EMA-50 and SMA-50.
The overall trend bias is determined using a slower SMA golden/death cross, e.g. SMA-50 and SMA-100.
The signal is stronger when it occurs in confluence with the overall trend bias, e.g. when EMA-50 crosses over SMA-50, while above the SMA-100. This is analogous to only opening long positions in a bull market.
Indicator description:
GREEN: Up Trend (EMA is above SMA, while EMA is above BIAS_MA. This shows a bullish confluence.)
YELLOW: No Trend (EMA/SMA crossover and BIAS_MA are not in confluence.)
RED = Down Trend (EMA is below SMA, while EMA is below BIAS_MA. This shows a bearish confluence.)

Equal-Length EMA/SMA Crossover Momentum StrategyOverview:
This momentum and trend-following strategy captures the majority of any trending move, and works well on high timeframes.
It uses an equal-period EMA and SMA crossover to detect trend acceleration/deceleration, since an EMA places a greater weight and significance on the most recent data.
This version is optimized for longs, and designed to cut your losses quickly and let your winners run.
To reduce noise and optimize entries, we combined this with an overall trend bias for further confluence.
How it works:
Signals are determined by the crossover of an EMA and SMA of the same length, e.g. EMA-50 and SMA-50.
The overall trend bias is determined using a slower SMA golden/death cross, e.g. SMA-50 and SMA-100.
The signal is stronger when it occurs in confluence with the overall trend bias, e.g. when EMA-50 crosses over SMA-50, while above the SMA-100. This is analogous to only opening long positions in a bull market.
Signal description:
Trend Buy: EMA crosses above SMA, and overall trend bias is bullish. Buying is in confluence with the overall trend bias.
Risky Buy: EMA crosses above SMA, and overall trend bias is bearish. Buying is early, more risky, and not in confluence with the overall trend bias.
Late Buy: SMA crosses above BIAS_SLOW. This gives further confirmation of bullish trend, but signal comes later.
Sell: EMA crosses under SMA.
Strategy entry and exit conditions:
This version enters a Long when "TREND BUY" is signalled.
This version has Sell/Shorts disabled because UP ONLY.
Long entry: Strategy enters Long when EMA is above SMA, while overall trend bias is bullish.
Long exit: Close long when EMA crosses under SMA.

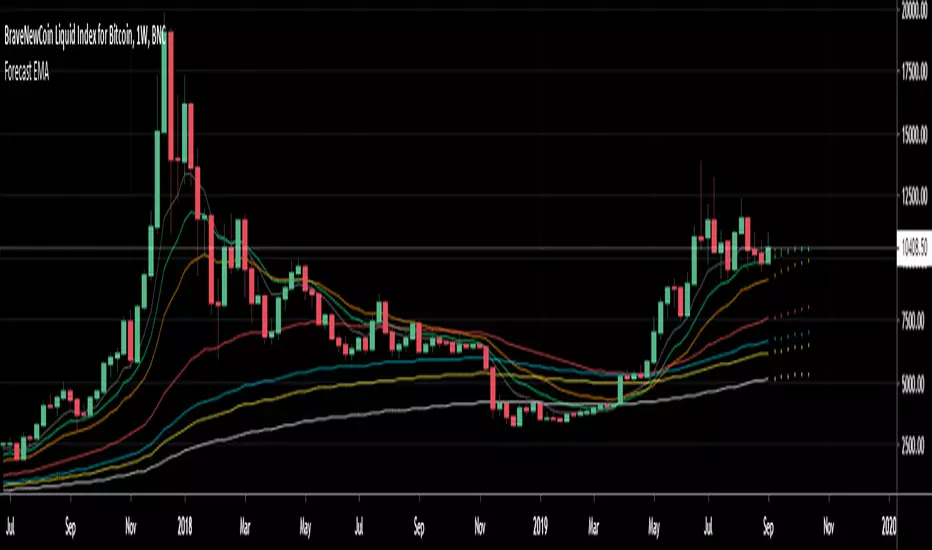
Forecast 7 EMA's 6 periodsForecast 7 EMA's 6 periods
This script is an upgrade of the existing Triple MA Forecast from Yatrader2
To allow the user to display 7 different EMAs and look 6 candles ahead
Default Value
8 ema
13 ema
21 ema
55 ema
100 ema
128 ema
200 ema
Note:
Best to use on high timeframe, if on low timeframe change the forecast maximum to lower
This was made to forecast the 21 ema on weekly timeframe on the upcomming Bitcoin price
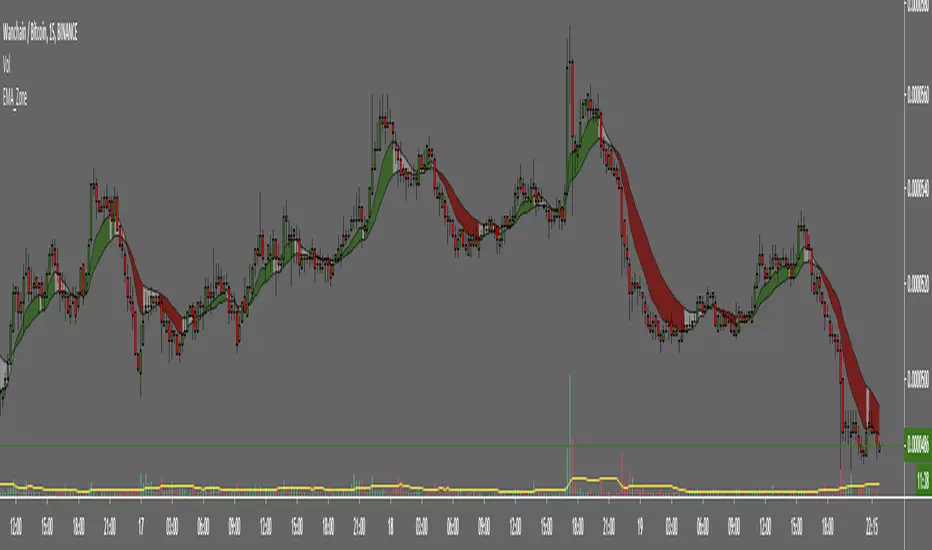
EMA ZoneIndicator to fill the ZONE between two EMAs (9 and 21 is the default)
RULES of completion:
CLOSE above "EMAs" and "EMA SLOW", and "EMA FAST" > "EMA SLOW" = green fill
CLOSE below "EMAs" and "EMA SLOW" ,and "EMA FAST" < "EMA SLOW" = red fill
CLOSE between EMAs = white fill
EMA 12HDesigned specifically for the **12-Hour (12H)** timeframe, this indicator offers a powerful setup for Swing Traders who want to capture significant market moves without the "noise" of lower timeframes or the lag of the Daily chart.
This script visualizes the interaction between a fast-moving momentum line (EMA 7) and a short-term trend baseline (EMA 21). This specific combination on the 12H chart is often considered a "Sweet Spot" for identifying multi-day trends in volatile markets like Crypto and Forex.
**Indicator Components:**
* **EMA 7 (Green Line):** The "Fast Momentum" line. By using a period of 7, this line hugs price action tightly. It acts as the immediate signal trigger, reacting swiftly to sudden bursts of buying or selling pressure.
* **EMA 21 (Dark Blue Line):** The "Trend Anchor." This serves as the baseline for the trend. As long as price remains respectful of the EMA 21, the current swing trend is considered intact.
**Why the 12H Timeframe?**
The 12-Hour chart is a professional timeframe that effectively filters out intraday fluctuation. A crossover on the 12H chart carries significantly more weight than on the 1H or 4H charts, often preceding major trend continuations or reversals that last for days or weeks.
**Trading Strategy Guide:**
1. **The Entry Signal (Crossover):**
* **Bullish Swing:** When the EMA 7 (Green) crosses **above** the EMA 21 (Blue). This indicates that immediate momentum has overpowered the recent average, signaling a potential start of an uptrend.
* **Bearish Swing:** When the EMA 7 (Green) crosses **below** the EMA 21 (Blue). This signals a breakdown in momentum and a potential start of a downtrend.
2. **Trend Confirmation:**
* **Strong Uptrend:** Price candles should close consistently above the Green line.
* **Strong Downtrend:** Price candles should close consistently below the Green line.
* **Warning Sign:** If price closes between the Green and Blue lines, the trend may be weakening or consolidating.
3. **The "Golden Gap":**
* Watch the space between the two lines. An expanding gap indicates high volatility and a strong trend. If the lines begin to merge, it suggests the market is losing momentum and entering a choppy phase—traders should exercise caution.
**Settings & Customization:**
* **Default:** Lengths are set to **7** and **21** to match the 12H aggressive swing strategy.
* **Customizable:** You can adjust the lengths in the input tab to experiment with other combinations (e.g., 9/21 or 10/20) depending on the asset's volatility.
**Disclaimer:**
Trading involves high risk. This indicator is a tool for technical analysis and should not be considered financial advice. Always use stop-losses and proper risk management.

EMA 4HThis indicator is a streamlined trend-following tool designed specifically for the **4-Hour (4H)** timeframe. It combines two key Exponential Moving Averages (EMA) to help traders identify short-term momentum and dynamic support/resistance levels with reduced noise.
**Key Components:**
* **EMA 9 (Green Line):** The "Trigger" line. It reacts quickly to price action, representing immediate short-term momentum.
* **EMA 21 (Dark Blue Line):** The "Trend" line. It serves as a dynamic support/resistance zone and acts as a filter to keep you on the right side of the trend.
**Why the 4H Timeframe?**
The 4-hour chart offers a sweet spot between the noise of lower timeframes (15m, 1H) and the lag of daily charts. This setup allows for swing trading and intraday positioning with higher reliability.
**How to Use This Strategy:**
1. **Trend Identification (Crossovers):**
* **Bullish Bias:** When the EMA 9 crosses **above** the EMA 21. Look for long positions.
* **Bearish Bias:** When the EMA 9 crosses **below** the EMA 21. Look for short positions.
2. **Dynamic Support & Resistance (Pullbacks):**
* In a strong trend, price often pulls back to test the area between the EMA 9 and EMA 21. This "zone" often acts as a high-value entry point if price action shows rejection (wicks).
3. **Trend Strength:**
* **Wide Gap:** If the space between the Green and Blue lines is expanding, the trend is strengthening.
* **Narrow Gap:** If the lines are flat or intertwining, the market is ranging (choppy). It is best to wait for a breakout.
**Settings:**
* Default inputs are set to **9** and **21**, optimized for H4.
* Fully customizable via the settings menu to fit other strategies or assets (Crypto, Forex, Stocks).
**Disclaimer:**
This script is for educational and technical analysis purposes only. Always manage your risk and use stop losses.
