Donchian TrendHello All,
I think all of you knows Donchian Channels . so I am not going to write about it.
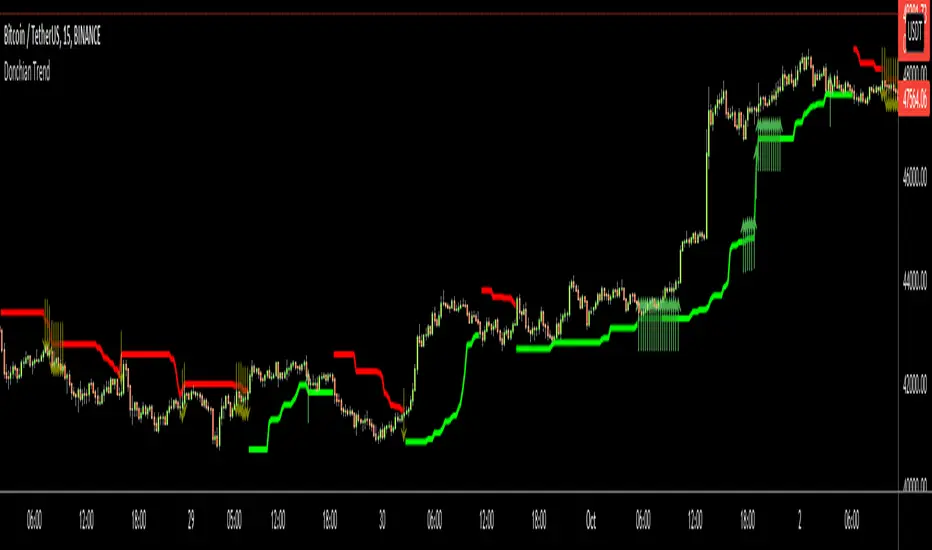
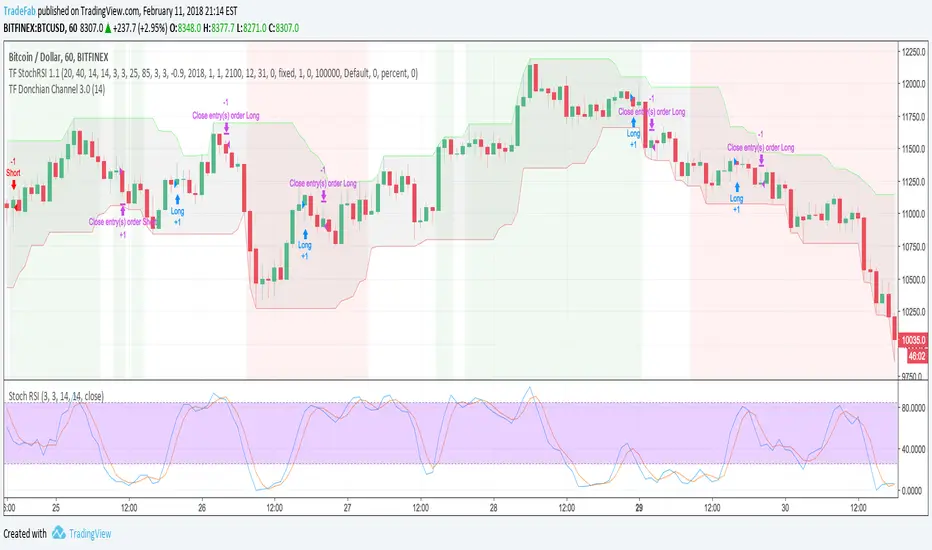
With this indicator I tried to create Trend Lines by using Donchian Channel upper/lower bands. I tried add possible entry levels as well.
How it works ?
- it calculates main trend direction by using the length that is user-defined. so you can change it as you wish
- then it calculates trend direction for 9 lower lengths. if you set the length = 20 then the lengths are 19, 18,...11
- and it checks if the trend directions that came from lower lengths is same or not with main trend direction.
- it changes the trendline color. lighter trend line means stonger trend, darker trend lines means entry points or possible trend reversal.
- it puts entry points by using trend directions that were created by using lower lengths. it gets entry points if high/low touches main trend line as well.
Warning: Arrows are entry points but it may also represents trend reversal. So you should use stoploss line if you decide to take buy/sell positions.
P.S. I didn't backtest it, it's non-repainting, it should be used educational purposes only . I believe it can be improved, so I am open for new ideas to improve it ;)
Enjoy!
Cari skrip untuk "donchian"
Donchian Channel Trend MeterInspired by the Chande Trend Meter (this is not the Chande Trend Meter), this indicator aims to show the trend so you can make trading decisions accordingly. This is calculated by looking at Donchian Channels over a number of lengths (20, 40, 60 periods, etc.), converting them to percent, and then applying a weighting and smoothing similar to the Know Sure Thing Indicator. This results in smooth trend line that is not disturbed by large fluctuations in price action.
When the line is below 20%, you have a strong down trend. Values between 20 - 40% are a weak down trend. Values between 40 - 60% are no trend (slightly bullish or bearish if above or below 50%). Similarly, 60 - 80% is a weak uptrend, and above 80% is a strong uptrend. Trade signals can be turned on or off that correspond to crosses over 50%. It can be useful in spotting divergence.

Donchian Channel Strategy IdeaThis strategy idea is a variation of the "Donchian Channel" trading strategy. It is built with a highest-high band, a lowest-low band, and a baseline which is average the highest-high and the lowest-low bands. This strategy is very useful in trending instruments on 1W and 1D timeframes. This is the implementation used in the QuantCT app.
You can set the operation mode to be Long/Short or long-only.
You also can set a fixed stop-loss or ignore it so that the strategy acts solely based on entry and exit signals.
Trade Idea
When the close price breaks up the previous highest-high, it is a long signal, the market is considered rising (bullish), and the plotted indicator becomes green. Long positions are held until the close price crosses under the baseline.
When the close price breaks down the previous lowest-low, it is a short signal, the market is considered falling (bearish), and the plotted indicator becomes red. Short positions are held until the close price crosses above the baseline.
Otherwise, if we have no position in the market, the market is considered ranging, and the plotted indicator becomes orange.
Entry/Exit rules
Enter LONG if the close price breaks up the previous highest-high (i.e. when the plotted indicator becomes green).
Exit LONG if the close price crosses under the baseline (i.e. when the plotted indicator becomes orange).
Enter SHORT if the close price breaks down the previous lowest-low (i.e. when the plotted indicator becomes red).
Exit SHORT if the close price crosses above the baseline (i.e. when the plotted indicator becomes orange).
CAUTION
It's just a bare trading idea - a profitable one. However, you can enhance this idea and turn it into a full trading strategy with enhanced risk/money management and optimizing it, and you ABSOLUTELY should do this!
DON'T insist on using Long/Short mode on all instruments! This strategy performs much better in Long-Only mode on many (NOT All) trending instruments (Like BTC, ETH, etc.).
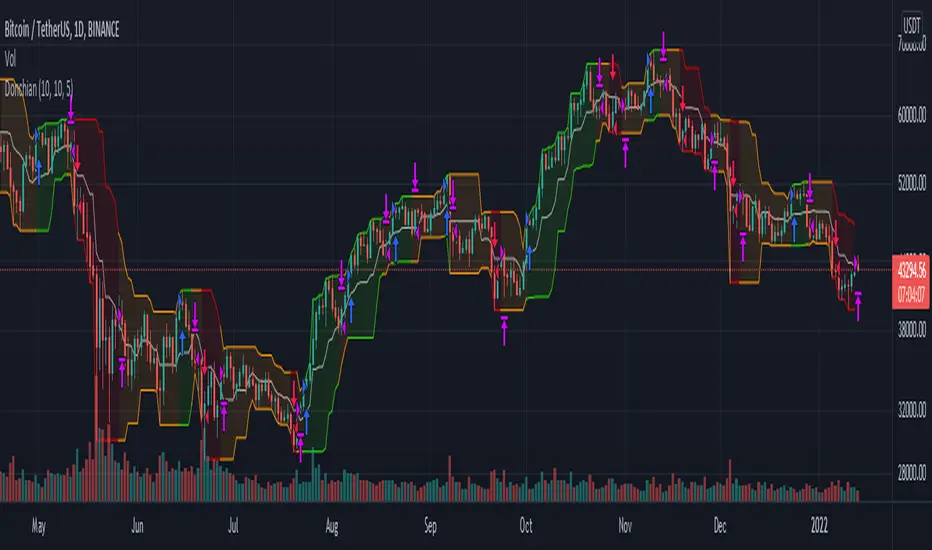
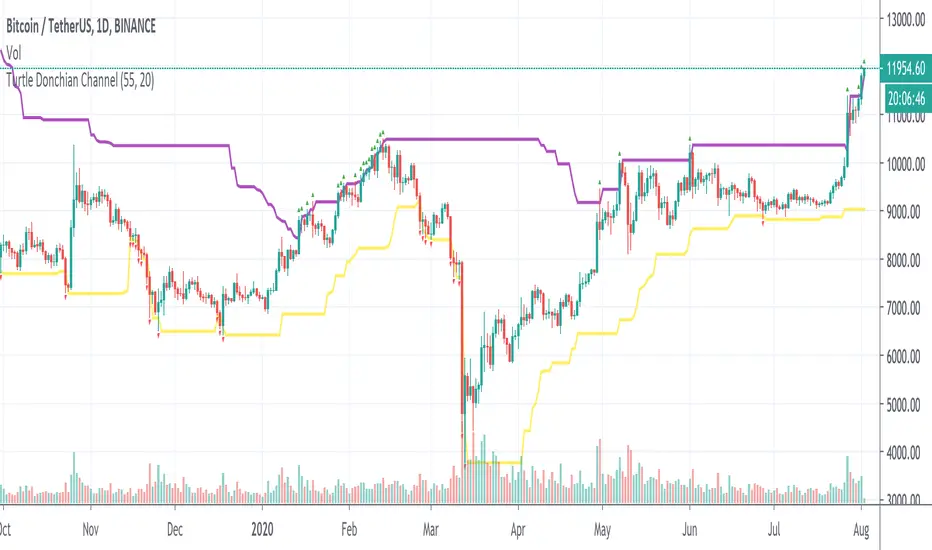
Turtle Donchian ChannelDonchian channel with Turtle trading style: buy long when price is higher than high 20 candles (green up arrow), and sell short when price is lower than low 10 candles (red down arrow).
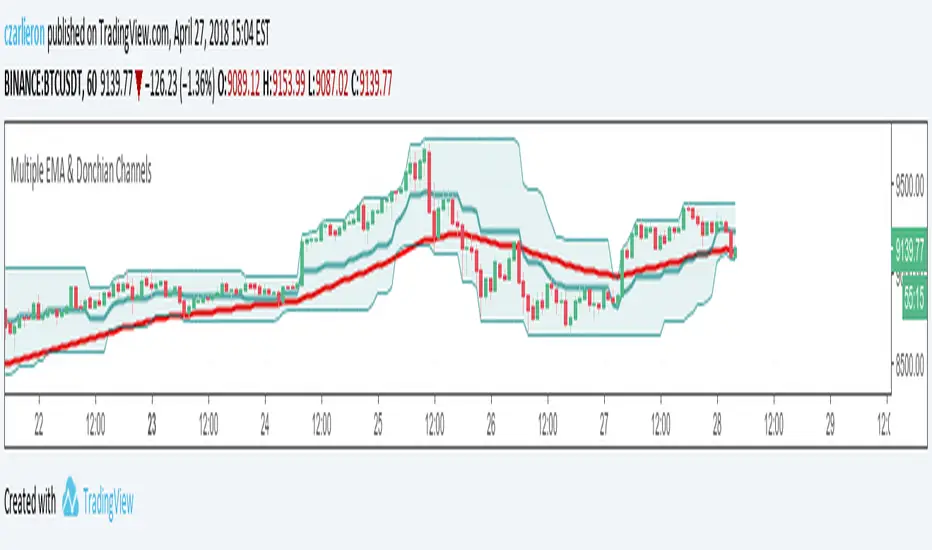
My Multiple EMA with Donchian ChannelsDonchian Channels with EMA's 8, 13, 21, 34, 55, 89 (fib numbers). Everything is configurable.
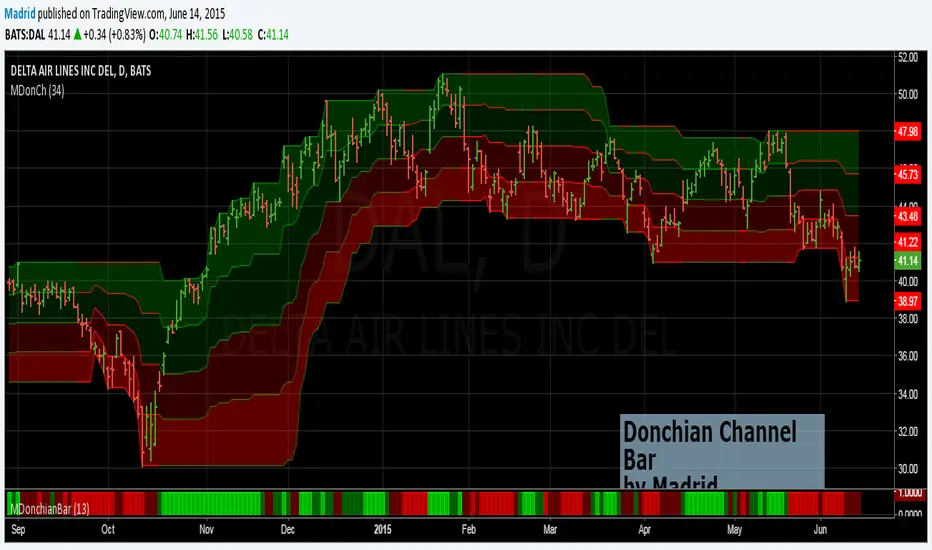
Madrid Donchian ChannelThis study is based on the Donchian Channel. The idea is to show where the price is located referred to its recent highest and lowest values.
Donchian channel only displays one channel with two bands. This variation displays four bands. When the price is in the uppermost band it is bullish, when the price is in the lowest band it is bearish.
When the price is on either of these two extreme bands it is in a trending market. When it is bouncing around the midchannel line it is a trading market.
The channel lines change color according to the direction of the price.

RealBody Donchian ChannelsThis is an enhancement of the built-in TradingView Donchian Channel indicator.A technical variation of the standard DC, it utilizes candlestick real body data. Instead of using the absolute high and low (shadows) for extreme value calculation, this indicator derives the channel boundaries from the highest Max(Open, Close) and the lowest Min(Open, Close) within the specified length. This approach filters out noise from wicks/shadows, providing a cleaner look at sustained price ranges defined by buying and selling pressure between the open and close.


Madrid Donchian BarThis is the companion bar of the Donchian Channel study. This bar at the bottom of the screen depicts the detrended position of the closing price. This is useful to reduce clutter on the screen and locate the position of the closing price at a glance.
Lime ; Extremely Bullish
Green : Bullish
Maroon : Bearish
Red : Extremely Bearish
Custom Indicator for Donchian Channels!!! System Rules Included!Mentor of mine (Mark Helweg) who ran a successful Hedge Fund, and has won several Awards for Quantatative Analysis conducted a free webinar that blew my mind. We’ve all heard most successful Traders make the most money on 5% of their trades. The reason is simple. To make BIG Money You Have to Catch BIG MOVES in the market. Do You Have A system That Get’s You In To Trades With LOW Risk, But Also Has Rules Built In To KEEP You In A WINNING TRADE? Well He Gave Me His System So I Coded It and I’m Passing Along to You….Trade Rules Will be in the First Post. INDICATOR - Donchian Channel that allows you to pick different Periods for the Upper and Lower Band. Read The First Post For an Explanation…..

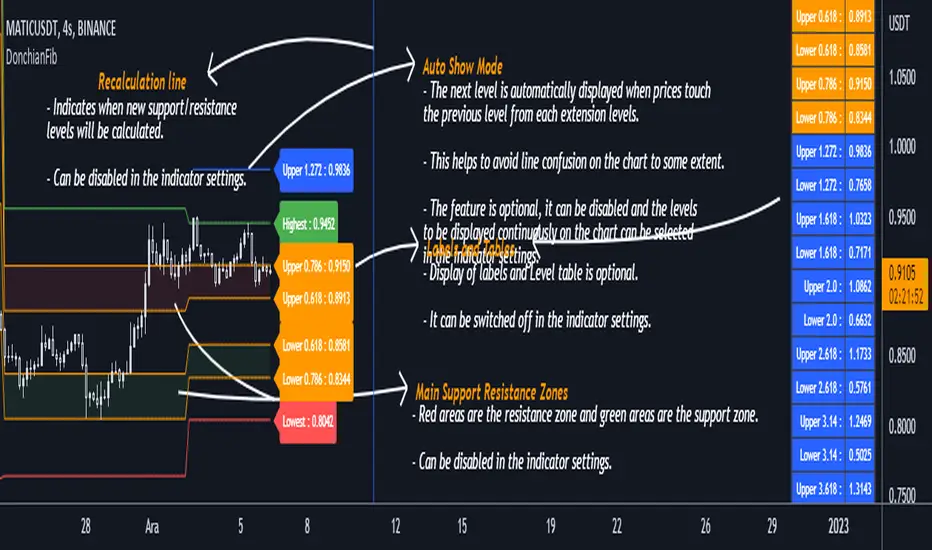
DonchianFib[Akcay]How does it work?
- The indicator detects the highest and lowest price level in the last x periods every time prices advance by x periods.
- From these values, retracement (0.618, 0.786) and expansion levels (1.272, 1.618, 2, 2.618, 3.14, 3.618, 4.236) are obtained.
- Since the symmetrical counterpart of the retracement levels is used, there are two of each of the 0.618 and 0.786 lines, for a total of four.
How can it be used?
- It can be used for step buying.
- It can be used for step selling.
- Can be used to set a profit target.
- Can be used to set a stop target.
- This indicator can be used in the same way as Pivot levels can be used. You can think of this indicator like the Pivot Points Standard indicator, where you set the period more flexibly.
Which indicators can it be combined with?
- I don't think there are any limitations, but I think it is compatible with trend detection indicators, trend detection with DonchianFib, and stepped buy/sell with limit orders.
- If you want to enter a position with mismatch signals, you can wait for the DonchianFib levels to break.
- Its use is limited by your imagination :)
Where does the name come from?
- As the name suggests, Donchian Channels. I was inspired by Donchian Channels when developing the indicator. Donchian channels show the highs and lows of prices over the last x number of periods. DonchianFib does this once for every x periods and uses the fibonacci levels to create upper and intermediate levels.
Note : I don't know if such an indicator has been done before or not. If it has been done, I haven't seen it in tradingview.
Çalışma mantığı nedir ?
- Gösterge, fiyatlar her x periyot kadar ilerlediğinde son x periyot içerisindeki en yüksek ve en düşük fiyat seviyesini tespit eder.
- Bu değerler üzerinden geri çekilme (0.618, 0.786) ve genişleme seviyeleri (1.272, 1.618, 2, 2.618, 3.14, 3.618, 4.236) elde edilir.
- Geri çekilme seviyelerinin simetrik karşılığı kullanıldığından 0.618 ve 0.786 çizgilerinden her birinden iki adet olmak üzere toplamda dört adet bulunur.
Nasıl kullanılabilir ?
- Kademeli alım yapmak için kullanılabilir.
- Kademeli satım yapmak için kullanılabilir.
- Kâr hedefi belirlemek için kullanılabilir.
- Stop hedefi belirlemek için kullanılabilir.
- Pivot seviyelerinden nasıl faydalanılıyorsa bu göstergeden de aynı şekilde faydalanılabilir. Bu göstergeyi, periyodunu kendinizin daha esnek bir şekilde belirlediğiniz Pivot Noktalar Standartı göstergesi gibi düşünebilirsiniz.
Hangi göstergelerle kombine edilebilir ?
- Bunun için herhangi sınırlama yapmak doğru değil ancak trend tespit etmeye çalışan göstergelerle uyumlu olduğunu düşünüyorum. Bu göstergeler ile trend tespiti yapıp DonchianFib ile alım/satım yerleri belirlenebilir ve limit emirleri ile kademeli alım/satım yapılabilir.
- Uyuşmazlık sinyalleri ile pozisyona girilmek isteniliyorsa DonchianFib seviyelerinin kırılması beklenebilir.
- Kullanımı sizin hayal gücünüz ile sınırlıdır :)
Adı nereden geliyor ?
- Adından da anlaşılacağı üzere Donchian Kanallarından. Göstergeyi geliştirirken Donchian Kanallarından ilham aldım. Donchian kanalları fiyatların son x periyot içerisindeki en yüksek ve en düşük seviyelerini grafikte gösteriyor. DonchianFib ise bunu her x periyot için bir defa yapıp, fibonacci seviyelerini de kullanarak üst ve ara seviyeler oluşturuyor.
Not : Daha önce böyle bir göstergenin yapılıp yapılmadığını bilmiyorum. Yapıldı ise ben tradingview'da görmedim.
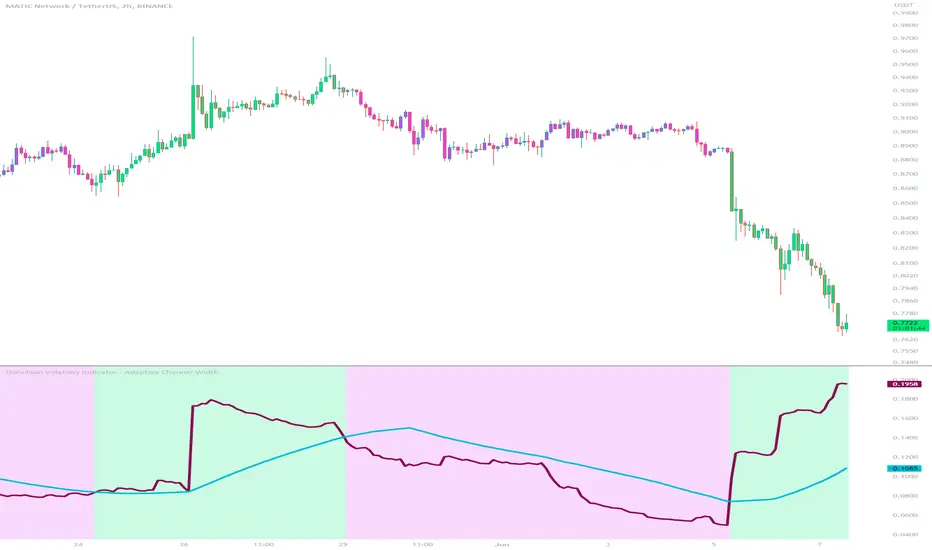
Donchian Volatility Indicator - Adaptive Channel WidthThis indicator is designed to help traders assess and analyze market volatility. By calculating the width of the Donchian channels, it provides valuable insights into the range of price movements over a specified period. This indicator helps traders identify periods of high and low volatility, enabling them to make more informed trading decisions.
The indicator is based on the concept of Donchian channels, which consist of the highest high and lowest low over a specified lookback period. The channel width is calculated as the difference between the upper and lower channels. A wider channel indicates higher volatility, suggesting potentially larger price movements and increased trading opportunities. On the other hand, a narrower channel suggests lower volatility, indicating a relatively calmer market environment with potentially fewer trading opportunities.
The adaptive aspect of the indicator refers to its ability to adjust the width of the channels dynamically based on market conditions. The indicator calculates the width of the channels using the Average True Range (ATR) indicator, which measures the average range of price movements over a specified period. By multiplying the ATR value with the user-defined ATR multiplier, the indicator adapts the width of the channels to reflect the current level of volatility. During periods of higher volatility, the channels expand to accommodate larger price movements, providing a broader range for assessing volatility. Conversely, during periods of lower volatility, the channels contract, reflecting the narrower price ranges and signaling a decrease in volatility. This adaptive nature allows traders to have a flexible and responsive measure of volatility, ensuring that the indicator reflects the current market conditions accurately.
To provide further insights, the indicator includes a signal line. The signal line is derived from the channel width and is calculated as a simple moving average over a specified signal period. This signal line acts as a reference level, allowing traders to compare the current channel width with the average width over a given time frame. By assessing whether the current channel width is above or below the signal line, traders can gain additional context on the volatility level in the market.
The colors used in the Donchian Volatility Indicator - Adaptive Channel Width play a vital role in visualizing the volatility levels:
-- Lime Color : When the channel width is above the signal line, it is colored lime. This color signifies that volatility has entered the market, indicating potentially higher price movements and increased trading opportunities. Traders can pay closer attention to the lime-colored channel width as it may suggest favorable conditions for trend-following or breakout trading strategies.
-- Fuchsia Color : When the channel width is below the signal line, it is colored fuchsia. This color represents relatively low volatility, suggesting a calmer market environment with potentially fewer trading opportunities. Traders may consider adjusting their strategies during periods of low volatility, such as employing range-bound or mean-reversion strategies.
-- Aqua Color : The signal line is represented by the aqua color. This color allows traders to easily identify the signal line amidst the channel width. The aqua color provides a visual reference for the average channel width and helps traders assess whether the current width is above or below this average.
The Donchian Volatility Indicator - Adaptive Channel Width has several practical applications for traders:
-- Volatility Assessment : Traders can use this indicator to assess the level of volatility in the market. By observing the width of the Donchian channels and comparing it to the signal line, they can determine whether the current volatility is relatively high or low. This information helps traders set appropriate expectations and adjust their trading strategies accordingly.
-- Breakout Trading : Wide channel widths may indicate an increased likelihood of price breakouts. Traders can use the Donchian Volatility Indicator - Adaptive Channel Width to identify potential breakout opportunities. When the channel width exceeds the signal line, it suggests a higher probability of significant price movements, potentially signaling a breakout. Traders may consider entering trades in the direction of the breakout.
-- Risk Management : The indicator can assist in setting appropriate stop-loss levels based on the current volatility. During periods of high volatility (lime-colored channel width), wider stop-loss orders may be warranted to account for larger price swings. Conversely, during periods of low volatility (fuchsia-colored channel width), narrower stop-loss orders may be appropriate to limit risk in a more range-bound market.
While the Donchian Volatility Indicator - Adaptive Channel Width is a valuable tool, it is important to consider its limitations:
-- Lagging Indicator : The indicator relies on historical price data, making it a lagging indicator. It provides insights based on past price movements and may not capture sudden changes or shifts in volatility. Traders should be aware that the indicator may not generate real-time signals and should be used in conjunction with other indicators and analysis tools.
-- False Signals : Like any technical indicator, the Donchian Volatility Indicator - Adaptive Channel Width is not immune to generating false signals. Traders should exercise caution and use additional analysis to confirm the signals generated by the indicator. Considering the broader market context and employing risk management techniques can help mitigate the impact of false signals.
-- Market Conditions : Market conditions can vary, and volatility levels can differ across different assets and timeframes. Traders should adapt their strategies and consider other market factors when interpreting the signals provided by the indicator. It is crucial to avoid relying solely on the indicator and to incorporate a comprehensive analysis of the market environment.
In conclusion, this indicator is a powerful tool for assessing market volatility. By examining the width of the Donchian channels and comparing it to the signal line, traders can gain insights into the level of volatility and adjust their trading strategies accordingly. The color-coded representation of the channel width and signal line allows for easy visualization and interpretation of the volatility dynamics. Traders should utilize this indicator as part of a broader trading approach, incorporating other technical analysis tools and considering market conditions for a comprehensive assessment of market volatility.
Donchian Channel Width The Donchian Channel was developed by Richard Donchian and it could be compared
to the Bollinger Bands. When it comes to volatility analysis, the Donchian Channel
Width was created in the same way as the Bollinger Bandwidth technical indicator was.
As was mentioned above the Donchian Channel Width is used in technical analysis to measure
volatility. Volatility is one of the most important parameters in technical analysis.
A price trend is not just about a price change. It is also about volume traded during this
price change and volatility of a this price change. When a technical analyst focuses his/her
attention solely on price analysis by ignoring volume and volatility, he/she only sees a part
of a complete picture only. This could lead to a situation when a trader may miss something and
lose money. Lets take a look at a simple example how volatility may help a trader:
Most of the price based technical indicators are lagging indicators.
When price moves on low volatility, it takes time for a price trend to change its direction and
it could be ok to have some lag in an indicator.
When price moves on high volatility, a price trend changes its direction faster and stronger.
An indicator's lag acceptable under low volatility could be financially suicidal now - Buy/Sell signals could be generated when it is already too late.
Another use of volatility - very popular one - it is to adapt a stop loss strategy to it:
Smaller stop-loss recommended in low volatility periods. If it is not done, a stop-loss could
be generated when it is too late.
Bigger stop-loss recommended in high volatility periods. If it is not done, a stop-loss could
be triggered too often and you may miss good trades.

Donchian Channel Width Strategy The Donchian Channel was developed by Richard Donchian and it could be compared
to the Bollinger Bands. When it comes to volatility analysis, the Donchian Channel
Width was created in the same way as the Bollinger Bandwidth technical indicator was.
You can change long to short in the Input Settings
WARNING:
- For purpose educate only
- This script to change bars colors.

Donchian Channel Width Strategy The Donchian Channel was developed by Richard Donchian and it could be compared
to the Bollinger Bands. When it comes to volatility analysis, the Donchian Channel
Width was created in the same way as the Bollinger Bandwidth technical indicator was.
WARNING:
- This script to change bars colors.

Quant Trend + Donchian (Educational, Public-Safe)What this does
Educational, public-safe visualization of a quant regime model:
• Trend : EMA(64) vs EMA(256) (EWMAC proxy)
• Breakout : Donchian channel (200)
• Volatility-awareness : internal z-scores (not plotted) for concept clarity
Why it’s useful
• Shows when trend & breakout align (clean regimes) vs conflict (chop)
• Helps explain why volatility-aware systems size up in smooth trends and scale down in noise
How to read it
• EMA64 above EMA256 with price near/above Donchian high → trend-following alignment
• EMA64 below EMA256 with price near/below Donchian low → bearish alignment
• Inside channel with EMAs tangled → range/chop risk
Notes
• Indicator is educational only (no orders).
• Built entirely with TradingView built-ins.
• For consistent visuals: enable “Indicator values on price scale” and disable “Scale price chart only” in Settings → Scales .

Donchian with Trend IndicatorStandard Donchian Channels, this includes a Trend EMA which can be configured and the channels will use to give buy and sell signals. The channels are also colored in such a way to indicate a trend reversal. My favorite part that sets this apart from others is, if using the bClose option (which I recommend you do) the trend will not reverse until there is a close above/below the previous channel high/low. i.e. a reversal into an uptrend requires the current bar to close above the previous upper channel rather than just a new high.
The coloring of the current trend allows for a quick read of current market conditions and I use this on any timeframe across all forms of charts (forex stock, futures, crypto, etc). When taking one of the signals I use the opposite channel as the stop loss (when buying use bottom, and selling use top channel)

Weeknights Donchian CloudDonchian Channel Trading system visualised as a cloud.
Regular/Quick inputs;
Length: 20
Entry Length: 20
Stop Length: 10
Alternate/Slower Inputs;
Length: 55
Entry Length: 55
Stop Length: 20
For a more in-depth review, look up "Turtle Trading" rules
The simplest way to use the cloud;
-When the cloud flips from above to below (support), close any shorts and open a long
-When the cloud flips from below to above (resistance), close any longs and open a short
-Cloud is flipped based on a breakout on the high / low
-Most effectively used on the daily, but can be used on any time frame
-For traditional markets, an input of 20 is most commonly used
-For 24/7 markets, an input of 28 is most commonly used
-Find an input that makes the most sense to you!
I appreciate any feedback, feel free to message me on twitter / comment!
Twitter ; @ImWeeknight
Credit to user KivancOzbilgic for helping with the script
Donchian Predictive Channel (Zeiierman)█ Overview
Donchian Predictive Channel (Zeiierman) extends the classic Donchian framework into a predictive structure. It does not just track where the range has been; it projects where the Donchian mid, high, and low boundaries are statistically likely to move based on recent directional bias and volatility regime.
By quantifying the linear drift of the Donchian midline and the expansion or compression rate of the Donchian range, the indicator generates a forward propagation cone that reflects the prevailing trend and volatility state. This produces a cleaner, more analytically grounded projection of future price corridors, and it remains fully aligned with the signal precision of the underlying Donchian logic.
█ How It Works
⚪ Donchian Core
The script first computes a standard Donchian Channel over a configurable Length:
Upper Band (dcHi) – highest high over the lookback.
Lower Band (dcLo) – lowest low over the lookback.
Midline (dcMd) – simple midpoint of upper and lower: (dcHi + dcLo)/ 2.
f_getDonchian(length) =>
hi = ta.highest(high, length)
lo = ta.lowest(low, length)
md = (hi + lo) * 0.5
= f_getDonchian(lenDC)
⚪ Slope Estimation & Range Dynamics
To turn the Donchian Channel into a predictive model, the script measures how both the midline and the range are changing over time:
Midline Slope (mSl) – derived from a 1-bar difference in linear regression of the midline.
Range Slope (rSl) – derived from a 1-bar difference in linear regression of the Donchian range (dcHi − dcLo).
This pair describes both directional drift (uptrend vs. downtrend) and range expansion/compression (volatility regime).
f_getSlopes(midLine, rngVal, length) =>
mSl = ta.linreg(midLine, length, 0) - ta.linreg(midLine, length, 1)
rSl = ta.linreg(rngVal, length, 0) - ta.linreg(rngVal, length, 1)
⚪ Forward Projection Engine
At the last bar, the indicator constructs a set of forward points for the mid, upper, and lower projections over Forecast Bars:
The midline is projected linearly using the midline slope per bar.
The range is adjusted using the range slope per bar, creating either a widening cone (expansion) or a tightening cone (compression).
Upper and lower projections are then anchored around the projected midline, with logic that keeps the structure consistent and prevents pathological flips when slope changes sign.
f_generatePoints(hi0, md0, lo0, steps, midSlp, rngSlp) =>
upPts = array.new()
mdPts = array.new()
dnPts = array.new()
fillPts = array.new()
hi_vals = array.new_float()
md_vals = array.new_float()
lo_vals = array.new_float()
curHiLocal = hi0
curLoLocal = lo0
curMidLocal = md0
segBars = math.floor(steps / 3)
segBars := segBars < 1 ? 1 : segBars
for b = 0 to steps
mdProj = md0 + midSlp * b
prevRange = curHiLocal - curLoLocal
rngProj = prevRange + rngSlp * b
hiTemp = 0.0
loTemp = 0.0
if midSlp >= 0
hiTemp := math.max(curHiLocal, mdProj + rngProj * 0.5)
loTemp := math.max(curLoLocal, mdProj - rngProj * 0.5)
else
hiTemp := math.min(curHiLocal, mdProj + rngProj * 0.5)
loTemp := math.min(curLoLocal, mdProj - rngProj * 0.5)
hiProj = hiTemp < mdProj ? curHiLocal : hiTemp
loProj = loTemp > mdProj ? curLoLocal : loTemp
if b % segBars == 0
curHiLocal := hiProj
curLoLocal := loProj
curMidLocal := mdProj
array.push(hi_vals, curHiLocal)
array.push(md_vals, curMidLocal)
array.push(lo_vals, curLoLocal)
array.push(upPts, chart.point.from_index(bar_index + b, curHiLocal))
array.push(mdPts, chart.point.from_index(bar_index + b, curMidLocal))
array.push(dnPts, chart.point.from_index(bar_index + b, curLoLocal))
ptSet.new(upPts, mdPts, dnPts)
⚪ Rejection Signals
The script also tracks failed Donchian breakouts and marks them as potential reversal/reversion cues:
Signal Down: Triggered when price makes an attempt above the upper Donchian band but then pulls back inside and closes above the midline, provided enough bars have passed since the last signal.
Signal Up: Triggered when price makes an attempt below the lower Donchian band but then snaps back inside and closes below the midline, also requiring sufficient spacing from the previous signal.
// Base signal conditions (unfiltered)
bearCond = high < dcHi and high >= dcHi and close > dcMd and bar_index - lastMarker >= lenDC
bullCond = low > dcLo and low <= dcLo and close < dcMd and bar_index - lastMarker >= lenDC
// Apply MA filter if enabled
if signalfilter
bearCond := bearCond and close < ma // Bearish only below MA
bullCond := bullCond and close > ma // Bullish only above MA
signalUp := false
signalDn := false
if bearCond
lastMarker := bar_index
signalDn := true
if bullCond
lastMarker := bar_index
signalUp := true
█ How to Use
The Donchian Predictive Channel is designed to outline possible future price trajectories. Treat it as a directional guide, not a fixed prediction tool.
⚪ Map Future Support & Resistance
Use the projected upper and lower paths as dynamic future reference levels:
Projected upper band ≈ is likely a resistance corridor if the current trend and volatility persist.
Projected lower band ≈ likely support corridor or expected downside range.
⚪ Trend Path & Volatility Cone
Because the projection is driven by midline and range slopes, the channel behaves like a trend + volatility cone:
Steep positive midline slope + expanding range → accelerating, high-volatility trend.
Flat midline + compressing range → coiling/contracting regime ahead of potential expansion.
This helps you distinguish between a gentle drift and an aggressive move that likely needs more risk buffer.
⚪ Reversion & Rejection Signals
The Donchian-based signals are especially useful for mean-reversion and fade-style trades.
A Signal Down near the upper band can mark a failed breakout and a potential rotation back toward the midline or the lower projected band.
A Signal Up near the lower band can flag a failed breakdown and a potential snap-back up the channel.
When Filter Signals is enabled, these signals are only generated when they align with the chart’s directional bias as defined by the moving average. Bullish signals are allowed only when the price is above the MA, and bearish signals only when the price is below it.
This reduces noise and helps ensure that reversions occur in harmony with the prevailing trend environment.
█ Settings
Length – Donchian lookback length. Higher values produce a smoother channel with fewer but more stable signals. Lower values make the channel more reactive and increase sensitivity at the cost of more noise.
Forecast Bars – Number of bars used for projecting the Donchian channel forward.
Higher values create a broader, longer-term projection. Lower values focus on short-horizon price path scenarios.
Filter Signals – Enables directional filtering of Donchian signals using the selected moving average. When ON, bullish signals only trigger when the price is above the MA, and bearish signals only trigger when the price is below it. This helps reduce noise and aligns reversions with the broader trend context.
Moving Average Type – The type of moving average used for signal filtering and optional plotting.
Choose between SMA, EMA, WMA, or HMA depending on desired responsiveness. Faster averages (EMA, HMA) react quickly, while slower ones (SMA, WMA) smooth out short-term noise.
Moving Average Length – Lookback length of the moving average. Higher values create a slower, more stable trend filter. Lower values track price more tightly and can flip the directional bias more frequently.
-----------------
Disclaimer
The content provided in my scripts, indicators, ideas, algorithms, and systems is for educational and informational purposes only. It does not constitute financial advice, investment recommendations, or a solicitation to buy or sell any financial instruments. I will not accept liability for any loss or damage, including without limitation any loss of profit, which may arise directly or indirectly from the use of or reliance on such information.
All investments involve risk, and the past performance of a security, industry, sector, market, financial product, trading strategy, backtest, or individual's trading does not guarantee future results or returns. Investors are fully responsible for any investment decisions they make. Such decisions should be based solely on an evaluation of their financial circumstances, investment objectives, risk tolerance, and liquidity needs.

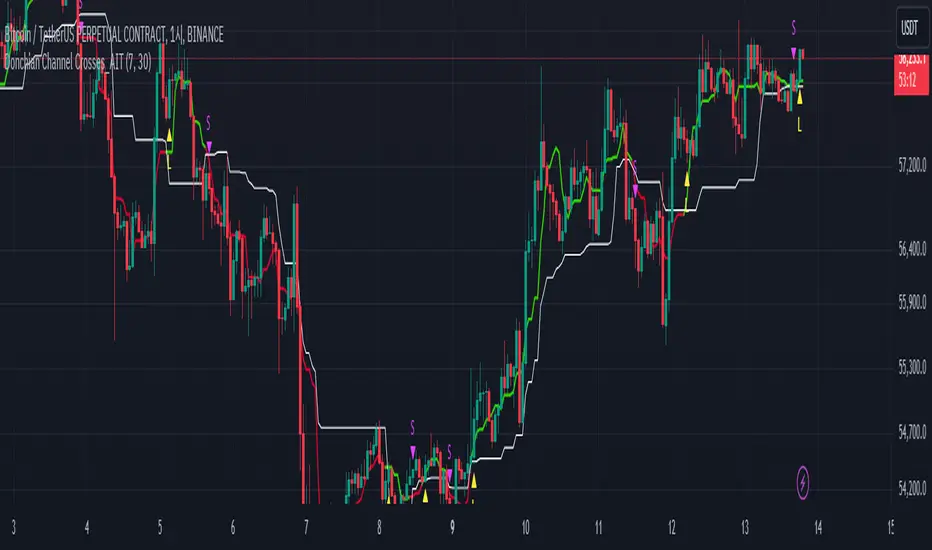
Donchian Channel Crosses_AITIndicator Name: Donchian Channel Crosses_AIT
Programming Language: Pine Script (TradingView)
Description
The Donchian Channel Crosses_AIT indicator is designed to provide trading signals based on the crossover of two Donchian Channels with different lookback periods. The indicator uses two channels, Donchian Channel A (default 7-day period) and Donchian Channel B (default 30-day period), to detect upward or downward momentum shifts. The signals are generated when the middle line of Donchian Channel A crosses above or below the middle line of Donchian Channel B.
Components
Donchian Channel A:
Default period: 7 days (modifiable by the user).
Middle Line: Calculated as the average of the highest high and lowest low over the period.
The middle line changes color depending on its position relative to Donchian Channel B.
Green: When Donchian Channel A's middle line is above Donchian Channel B's middle line.
Red: When Donchian Channel A's middle line is below Donchian Channel B's middle line.
Donchian Channel B:
Default period: 30 days (modifiable by the user).
Middle Line: Also calculated as the average of the highest high and lowest low over the period.
Always displayed as a white line with a line thickness of 1.
Long Signal:
Triggered when the middle line of Donchian Channel A crosses above the middle line of Donchian Channel B.
Displayed as a yellow triangle pointing up (L) below the price bar.
Short Signal:
Triggered when the middle line of Donchian Channel A crosses below the middle line of Donchian Channel B.
Displayed as a fuchsia triangle pointing down (S) above the price bar.
Settings
Donchian Channel A:
Default period: 7 days (modifiable via user input).
Middle line changes color based on its relationship to Donchian Channel B.
Donchian Channel B:
Default period: 30 days (modifiable via user input).
Middle line is always white and displayed with a line thickness of 1.
Signal Display:
Long Signal: A yellow "L" triangle is displayed when Donchian Channel A’s middle line crosses above Donchian Channel B’s middle line.
Short Signal: A fuchsia "S" triangle is displayed when Donchian Channel A’s middle line crosses below Donchian Channel B’s middle line.
Signals can be toggled on or off using the "Show Signals" setting.
Usage
Trend Confirmation:
Use this indicator to confirm trend direction by monitoring the relationship between Donchian Channel A and Donchian Channel B.
Uptrend: When Donchian Channel A’s middle line is above Donchian Channel B’s middle line (green line for Donchian A).
Downtrend: When Donchian Channel A’s middle line is below Donchian Channel B’s middle line (red line for Donchian A).
Entry and Exit Signals:
Long Signal: Enter a buy position when Donchian Channel A crosses above Donchian Channel B.
Short Signal: Enter a sell position when Donchian Channel A crosses below Donchian Channel B.
Visual Representation:
The Donchian Channels are drawn on the price chart, with Donchian Channel A dynamically changing color depending on its relative position to Donchian Channel B.
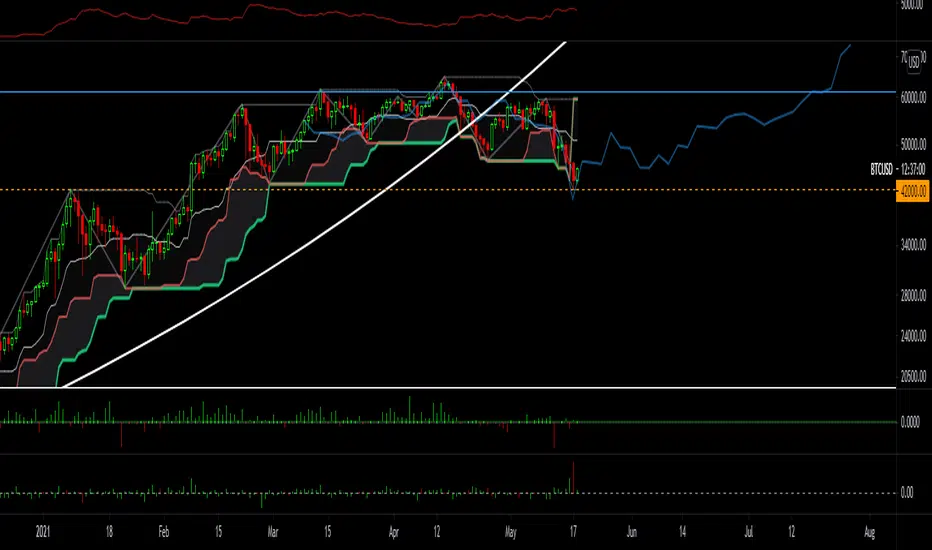
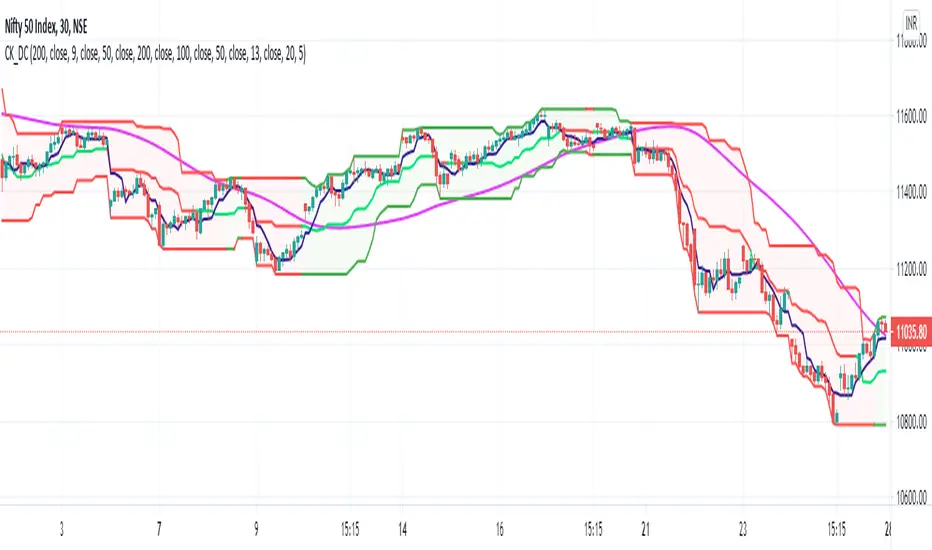
Modified Donchian ChannelRelease Note:
This indicator setup highly inspired by Donchian Channel and Hull Moving Average. Big thanks to both Richard Donchian and Alan Hull.
Back test and live test it and come to conclusion of how to use this indicator for live trading.
200 HMA:
200 Hull Moving Average plays major role in deciding the right trades using Donchian Channel. As part of this setup,
If price is below 200 HMA, then the Donchian Channel is highlighted in Red color
If price is above 200 HMA, then the Donchian Channel is highlighted in Green color
Donchian Channel:
Default 20 period is used for the Donchian channel. However, the color highlight as per 200 HMA position. Also, the middle basis color changes to Green and Red based on candle close of above or below.
Additionally, 5 period Donchian basis is used as tight stop loss. This can be used wisely or optionally based on trade decisions
Disclaimer:
//Idea of publishing this script is to identify the strength of the instrument using multiple confirmation.
//Using this indicator, changing inputs, and trading decisions are up to the users/traders.
//Courtesy: Thanks to Richard Donchian and Alan Hull as this indicator/script inspired by Donchian Channels and Hull Moving Average
Donchian Trend Ranges [AlgoAlpha]🚀🔗 Donchian Trend Ranges 🔗🚀
Elevate your trading game with the Donchian Trend Ranges indicator from AlgoAlpha! 🌟📈 This advanced tool helps you visualize market trends and potential reversal points using Donchian channels, volatility measures, and average true range (ATR).
Key Features
⚙️ Customizable Parameters: Adjust the lookback period and range multiplier to fit your trading style.
🎨 Color-Coded Trends: Easily distinguish between uptrends and downtrends with customizable colors.
📊 Dynamic Channels: Visualize multiple dynamic channels based on Donchian ranges and volatility.
☁️ Trend Clouds: See market strength and weakness with upper and lower trend clouds.
🔔 Signal Alerts: Get notified of potential trend shifts and take profit points.
How to Use
🛠 Add the Indicator: Add the indicator to favorites. Customize settings such as the lookback period and range multiplier to match your trading needs.
🔍 Analyze Trends: The indicator calculates the highest and lowest prices over a specified period to create dynamic channels. It then uses standard deviation and ATR to adjust these channels for market volatility, plotting upper and lower ranges. Green bars indicate an up trend and red bars for a down trend.
🔔 Set Alerts: Enable notifications for bullish and bearish trend shifts, as well as weak and strong take profit points, ensuring you never miss an opportunity.
How it Works
The Donchian Trend Ranges indicator calculates the highest and lowest prices over a specified period to create a basis line. It creates a range around the basis based on standard deviations and the clouds' width is determined by a 14 period ATR. The basis line and bar colors changes based on whether the closing price is above or below it, indicating trends. Clouds around these lines represent market reversal zones that can be used as entry levels when used in confluence with momentum indicators, visual signals ("X" and "◆") marking strong and weak take profit points are also printed when the prices revert from the clouds towards the basis. Integrated alerts notify you of significant events like trend shifts and take profit signals, keeping you informed without constant monitoring.
Unleash the power of the Donchian Trend Ranges in your trading strategy! 🌐📈✨
