Time Frame Color ClassifierTime Frame Colour Classifier
A professional Pine Script indicator that provides instant visual identification of trading sessions through intelligent colour-coded backgrounds.
Key Features
📅 Daily Session Colours
- Monday: Green | Tuesday: Blue | Wednesday: Yellow | Thursday: Red | Friday: Purple
📊 Weekly Classification
- Week 1-5 : Colour-coded by week of the month using the same colour scheme
## How It Works
Intraday Charts (1min-4H) : Shows daily colours - every candle on Monday displays green background, Tuesday shows blue, etc.
Daily/Weekly Charts : Switches to weekly colours - all days in Week 1 show green, Week 2 shows blue, etc.
Professional Applications
✅ Multi-Timeframe Analysis : Seamlessly switch between timeframes whilst maintaining visual context
✅ Session Recognition : Instantly identify which trading day you're analysing
✅ Pattern Analysis : Spot recurring patterns on specific days of the week
✅ Strategy Development : Incorporate temporal factors into trading strategies
✅ Performance Attribution : Correlate results with specific trading sessions
Customisation Options
- Toggle daily/weekly colours on/off
- Fully customisable colour schemes
- Adjustable background transparency
- Optional day labels
Technical Details
- Pine Script v5for optimal performance
- Automatic timeframe detection - no manual configuration required
- Minimal resource usage - won't slow down your charts
- Works on all chart types and timeframes
Perfect For
- Day traders switching between multiple timeframes
- Swing traders analysing weekly patterns
- Algorithmic strategy development
- Multi-timeframe market analysis
- Trading education and research
---
Developed by @wyckoffnawaf
Transform your chart analysis with visual timeframe clarity
Cari skrip untuk "charts"
Ultimate Regression Channel v5.0 [WhiteStone_Ibrahim]Ultimate Regression Channel v5.0: Comprehensive User Guide
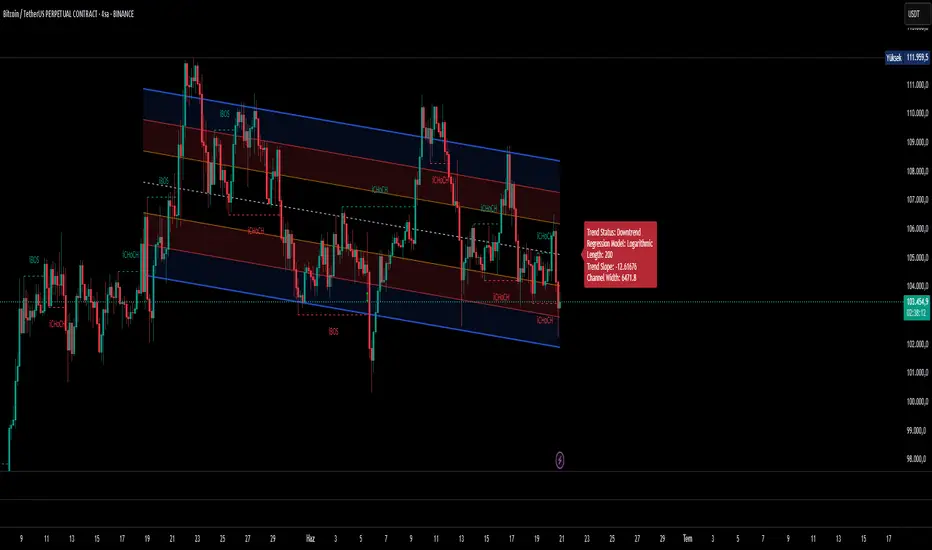
This indicator is designed to visualize the current trend, potential support/resistance levels, and market volatility through a statistical analysis of price action. At its core, it plots a regression line (a trend line) based on prices over a specific period and adds channels based on standard deviation around this line.
1. Core Features and Settings
Length Mode:
Numerical (Manual): You define the number of bars to be used for the regression channel calculation. You can use lower values (e.g., 50-100) for short-term analysis and higher values (e.g., 200-300) to identify long-term trends.
Automatic (Based on Market Structure): This mode automatically draws the channel starting from the highest high or lowest low that has formed within the Auto Scan Period. This allows the indicator to adapt itself to significant market turning points (swing points), which is highly useful.
Regression Model:
Linear: Calculates the trend as a straight line. It generally works well in stable, short-to-medium-term trends.
Logarithmic: Calculates the trend as a curved line. It more accurately reflects price action, especially on long-term charts or for assets that experience exponential growth/decline (like cryptocurrencies or growth stocks).
Channel Widths:
These settings determine how far from the central trend line (in terms of standard deviations) the channels will be drawn.
The 0 (Inner), 1 (Middle), and 2 (Outer) channels represent the "normal" range of price movement and the "extreme" zones. Statistically, about 95% of all price action occurs within the outer channels (2nd standard deviation).
2. Visual Extras and Their Interpretation
Breakout Style:
This feature alerts you when the price closes above the uppermost channel (Channel 2) with a green arrow/background or below the lowermost channel with a red arrow/background.
This is a very important signal. A breakout can signify that the current trend is strengthening and likely to continue (a breakout/trend-following strategy) or that the market has become overextended and may be due for a reversal (an exhaustion/top-bottom signal). It is critical to confirm this signal with other indicators (e.g., RSI, Volume).
Info Label:
This provides an at-a-glance summary of the channel on the right side of the chart:
Trend Status: Identifies the trend as "Uptrend," "Downtrend," or "Sideways" based on the slope of the centerline. The Horizontal Threshold setting allows you to filter out noise by treating very small slopes as "Sideways."
Regression Model and Length: Shows your current settings.
Trend Slope: A numerical value representing how steep or weak the trend is.
Channel Width: Shows the price difference between the outermost channels. This is a measure of current volatility. A widening channel indicates increasing volatility, while a narrowing one indicates decreasing volatility.
3. What Users Should Pay Attention To & Best Practices
Define Your Strategy: Mean Reversion or Breakout?
Mean Reversion: If the market is in a ranging or gently trending phase, the price will tend to revert to the centerline after hitting the outer channels (overbought/oversold zones). In this case, the outer channels can be considered opportunities to sell (upper channel) or buy (lower channel).
Breakout: If a strong trend is in place, a price close beyond an outer channel can be a sign that the trend is accelerating. In this scenario, one might consider taking a position in the direction of the breakout. Correctly analyzing the current market state (ranging vs. trending) is key to deciding which strategy to employ.
Don't Use It in Isolation: No indicator is a holy grail. Use the Regression Channel in conjunction with other tools. Confirm signals with RSI divergences for overbought/oversold conditions, Moving Averages for the overall trend direction, or Volume indicators to confirm the strength of a breakout.
Choose the Right Model: On shorter-term charts (e.g., 1-hour, 4-hour), the Linear model is often sufficient. However, on long-term charts like the daily, weekly, or monthly, the Logarithmic model will provide much more accurate results, especially for assets with parabolic movements.
The Power of Automatic Mode: The Automatic length mode is often the most practical choice because it finds the most logical starting point for you. It saves you the trouble of adjusting settings, especially when analyzing different assets or timeframes.
Use the Alerts: If you don't want to miss the moment the price touches a key channel line, set up an alert from the Alert Settings section for your desired line (e.g., only the "Outer Channels"). This helps you catch opportunities even when you are not in front of the screen.
Ticker Pulse Meter BasicPairs nicely with the Contrarian 100 MA located here:
and the Enhanced Stock Ticker with 50MA vs 200MA located here:
Description
The Ticker Pulse Meter Basic is a dynamic Pine Script v6 indicator designed to provide traders with a visual representation of a stock’s price position relative to its short-term and long-term ranges, enabling clear entry and exit signals for long-only trading strategies. By calculating three normalized metrics—Percent Above Long & Above Short, Percent Above Long & Below Short, and Percent Below Long & Below Short—this indicator offers a unique "pulse" of market sentiment, plotted as stacked area charts in a separate pane. With customizable lookback periods, thresholds, and signal plotting options, it empowers traders to identify optimal entry points and profit-taking levels. The indicator leverages Pine Script’s force_overlay feature to plot signals on either the main price chart or the indicator pane, making it versatile for various trading styles.
Key Features
Pulse Meter Metrics:
Computes three percentages based on short-term (default: 50 bars) and long-term (default: 200 bars) lookback periods:
Percent Above Long & Above Short: Measures price strength when above both short and long ranges (green area).
Percent Above Long & Below Short: Indicates mixed momentum (orange area).
Percent Below Long & Below Short: Signals weakness when below both ranges (red area).
Flexible Signal Plotting:
Toggle between plotting entry (blue dots) and exit (white dots) signals on the main price chart (location.abovebar/belowbar) or in the indicator pane (location.top/bottom) using the Plot Signals on Main Chart option.
Entry/Exit Logic:
Long Entry: Triggered when Percent Above Long & Above Short crosses above the high threshold (default: 20%) and Percent Below Long & Below Short is below the low threshold (default: 40%).
Long Exit: Triggered when Percent Above Long & Above Short crosses above the profit-taking level (default: 95%).
Visual Enhancements:
Plots stacked area charts with semi-transparent colors (green, orange, red) for intuitive trend analysis.
Displays threshold lines for entry (high/low) and profit-taking levels.
Includes a ticker and timeframe table in the top-right corner for quick reference.
Alert Conditions: Supports alerts for long entry and exit signals, integrable with TradingView’s alert system for automated trading.
Technical Innovation: Combines normalized price metrics with Pine Script v6’s force_overlay for seamless signal integration on the price chart or indicator pane.
Technical Details
Calculation Logic:
Uses confirmed bars (barstate.isconfirmed) to calculate metrics, ensuring reliability.
Short-term percentage: (close - lowest(low, lookback_short)) / (highest(high, lookback_short) - lowest(low, lookback_short)).
Long-term percentage: (close - lowest(low, lookback_long)) / (highest(high, lookback_long) - lowest(low, lookback_long)).
Derived metrics:
pct_above_long_above_short = (pct_above_long * pct_above_short) * 100.
pct_above_long_below_short = (pct_above_long * (1 - pct_above_short)) * 100.
pct_below_long_below_short = ((1 - pct_above_long) * (1 - pct_above_short)) * 100.
Signal Plotting:
Entry signals (long_entry) use ta.crossover to detect when pct_above_long_above_short crosses above entryThresholdhigh and pct_below_long_below_short is below entryThresholdlow.
Exit signals (long_exit) use ta.crossover for pct_above_long_above_short crossing above profitTake.
Signals are plotted as tiny circles with force_overlay=true for main chart or standard plotting for the indicator pane.
Performance Considerations: Optimized for efficiency by calculating metrics only on confirmed bars and using lightweight plotting functions.
How to Use
Add to Chart:
Copy the script into TradingView’s Pine Editor and apply it to your chart.
Configure Settings:
Short Lookback Period: Adjust the short-term lookback (default: 50 bars) for sensitivity.
Long Lookback Period: Set the long-term lookback (default: 200 bars) for broader context.
Entry Thresholds: Modify high (default: 20%) and low (default: 40%) thresholds for entry conditions.
Profit Take Level: Set the exit threshold (default: 95%) for profit-taking.
Plot Signals on Main Chart: Check to display signals on the price chart; uncheck for the indicator pane.
Interpret Signals:
Long Entry: Blue dots indicate a strong bullish setup when price is high relative to both lookback ranges and weakness is low.
Long Exit: White dots signal profit-taking when strength reaches overbought levels.
Use the stacked area charts to assess trend strength and momentum.
Set Alerts:
Create alerts for Long Entry and Long Exit conditions using TradingView’s alert system.
Customize Visuals:
Adjust colors and thresholds via TradingView’s settings for better visibility.
The ticker table displays the symbol and timeframe in the top-right corner.
Example Use Cases
Swing Trading: Use entry signals to capture short-term bullish moves within a broader uptrend, exiting at profit-taking levels.
Trend Confirmation: Monitor the green area (Percent Above Long & Above Short) for sustained bullish momentum.
Market Sentiment Analysis: Use the stacked areas to gauge bullish vs. bearish sentiment across timeframes.
Notes
Testing: Backtest the indicator on your chosen market and timeframe to validate its effectiveness.
Compatibility: Built for Pine Script v6 and tested on TradingView as of June 20, 2025.
Limitations: Signals are long-only; adapt the script for short strategies if needed.
Enhancements: Consider adding a histogram for the difference between metrics or additional thresholds for nuanced trading.
Acknowledgments
Inspired by public Pine Script examples and designed to simplify complex market dynamics into a clear, actionable tool. For licensing or support, contact Chuck Schultz (@chuckaschultz) on TradingView. Share feedback in the comments, and happy trading!

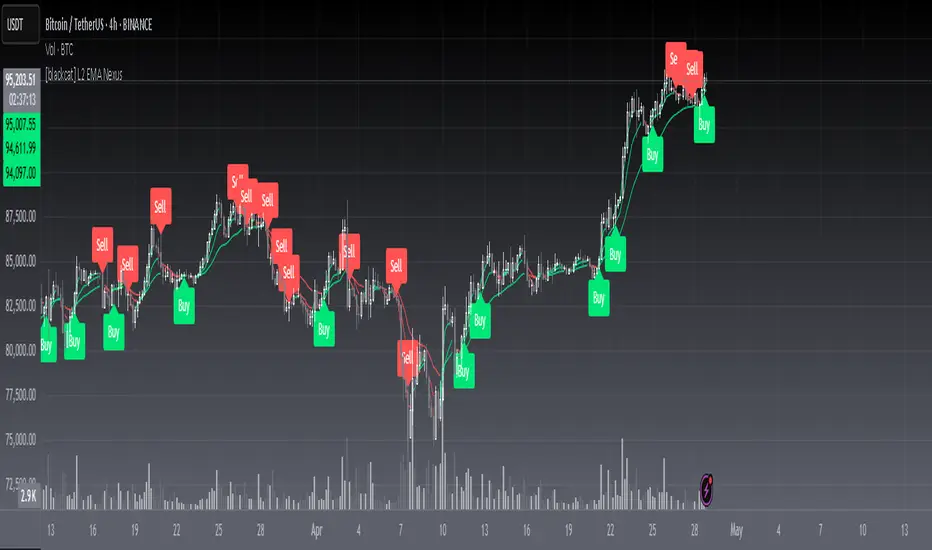
[blackcat] L2 EMA NexusOVERVIEW
The L2 EMA Nexus is a comprehensive trading indicator that utilizes a three-tiered Exponential Moving Average (EMA) system to identify potential trading opportunities. This script combines technical analysis with robust risk management features to help traders make informed decisions.
KEY FEATURES
• Triple EMA Analysis:
Customizable source inputs for each EMA
Adjustable length parameters (3, 8, 21 periods)
Dynamic color coding based on trend direction
Real-time price action monitoring
• Advanced Entry Signals:
High-low price action verification
EMA cross-overs and cross-unders
Multi-timeframe trend confirmation
Dynamic position sizing limits
• Risk Management:
Configurable Take Profit levels
Flexible Stop Loss settings
Optional TP/SL activation
Clear visual indicators for levels
HOW TO USE
Setup Initial Parameters:
Configure EMA lengths for your timeframe
Set Take Profit percentage (default 25%)
Define Stop Loss percentage (default 2.5%)
Adjust pyramiding limit as needed
Enable/Disable Features:
Toggle TP/SL settings based on strategy
Customize alert conditions
Modify visual labels for clarity
Monitor Trading Signals:
Watch for buy/sell labels
Track TP/SL levels
Monitor position status
TRADE MANAGEMENT
• Entry Conditions:
Long Entry: Higher high with rising EMA1 and stable EMA3
Short Entry: Lower low with falling EMA1 and stable EMA2
• Exit Conditions:
Take Profit: Price reaches defined percentage above/below entry
Stop Loss: Price reaches defined percentage below/above entry
• Position Control:
Limited to specified number of positions
Automatic position tracking
Clear visual indication of current trades
TECHNICAL DETAILS
• EMA Calculation:
Uses Exponential Moving Average for trend following
Color-coded based on 2-bar trend direction
Multiple timeframe compatibility
• Label System:
Clear buy/sell markers
Take Profit and Stop Loss indicators
Real-time position status updates
• Alert Configuration:
Customizable alert messages
Multiple alert conditions
Option to enable/disable specific alerts
LIMITATIONS
⚠️ Important Considerations:
Results may vary across different market conditions
Historical performance does not guarantee future results
Always backtest strategy before live trading
Consider complementing with additional analysis tools
BEST PRACTICES
• Recommended Timeframes:
Daily charts for long-term strategies
4-hour charts for swing trading
1-hour charts for short-term trading
• Risk Management Tips:
Start with small position sizes
Always use TP/SL in live trading
Monitor market volatility before entering trades
TROUBLESHOOTING
• Common Issues:
Ensure proper chart resolution
Verify alert conditions are enabled
Check for conflicting indicators
• Performance Optimization:
Use appropriate timeframe for your strategy
Adjust indicator parameters based on market conditions
Monitor for potential overfitting
[blackcat] L3 Hull SeekerOVERVIEW
The L3 Hull Seeker is a comprehensive trading indicator that combines Hull Moving Average (HMA) analysis with robust position management and risk control features. This script is designed to help traders identify potential entry and exit points while maintaining strict risk management protocols.
KEY FEATURES
• Hull MA Analysis:
Advanced Hull Moving Average calculations
Separate Hull MA lines for Close and Open prices
Visual color coding for trend direction
Customizable length parameter for flexibility
• Position Tracking:
Real-time monitoring of long and short positions
Maximum position limit control
Clear position status indicators on chart
• Risk Management System:
User-defined Take Profit percentage
User-defined Stop Loss percentage
Optional activation of TP/SL features
Dynamic label markers for important levels
• Alert System:
Buy/Sell entry alerts
Take Profit/Stop Loss exit alerts
Position status changes
HOW TO USE
Setup Initial Parameters:
Hull MA Length: Adjust based on your trading timeframe
Take Profit Percentage: Set according to your risk tolerance
Stop Loss Percentage: Define your maximum acceptable loss
Enable/Disable Features:
Toggle Take Profit/Stop Loss options as needed
Adjust alert conditions for your trading style
Monitor Trading Signals:
Watch for crossover/crossunder signals
Track position status through labels
Monitor entry and exit alerts
Manage Risk:
Use TP/SL features to control position size
Monitor pyramiding limits
Review position status regularly
TRADE MANAGEMENT
• Entry Conditions:
Long Entry: HullMA_close crosses above HullMA_open
Short Entry: HullMA_close crosses below HullMA_open
• Exit Conditions:
Take Profit: Price reaches defined percentage above/below entry
Stop Loss: Price reaches defined percentage below/above entry
• Position Control:
Limited to one position at a time
Automatic position tracking
Clear visual indication of current trades
TECHNICAL DETAILS
• Hull MA Calculation:
Uses WMA (Weighted Moving Average) for precise calculations
Optimized for trend-following strategies
Smoothed Hull MA lines for better readability
• Label System:
Clear buy/sell markers
Take Profit and Stop Loss indicators
Real-time position status updates
• Alert Configuration:
Customizable alert messages
Multiple alert conditions
Option to enable/disable specific alerts
LIMITATIONS
⚠️ Important Considerations:
Results may vary across different market conditions
Historical performance does not guarantee future results
Always backtest strategy before live trading
Consider complementing with additional analysis tools
BEST PRACTICES
• Recommended Timeframes:
Daily charts for long-term strategies
4-hour charts for swing trading
1-hour charts for short-term trading
• Risk Management Tips:
Start with small position sizes
Always use TP/SL in live trading
Monitor market volatility before entering trades
TROUBLESHOOTING
• Common Issues:
Ensure proper chart resolution
Verify alert conditions are enabled
Check for conflicting indicators
• Performance Optimization:
Use appropriate timeframe for your strategy
Adjust indicator parameters based on market conditions
Monitor for potential overfitting

RSI3M3+ v.1.8RSI3M3+ v.1.8 Indicator
This script is an advanced trading indicator based on Walter J. Bressert's cycle analysis methodology, combined with an RSI (Relative Strength Index) variation. Let me break it down and explain how it works.
Core Concepts
The RSI3M3+ indicator combines:
A short-term RSI (3-period)
A 3-period moving average to smooth the RSI
Bressert's cycle analysis principles to identify optimal trading points
RSI3M3+ Indicator VisualizationImage Walter J. Bressert's Cycle Analysis Concepts
Walter Bressert was a pioneer in cycle analysis trading who believed markets move in cyclical patterns that can be measured and predicted. His key principles integrated into this indicator include:
Trading Cycles: Markets move in cycles with measurable time spans from low to low
Timing Bands: Projected periods when the next cyclical low or high is anticipated
Oscillator Use: Using oscillators like RSI to confirm cycle position
Entry/Exit Rules: Specific rules for trade entry and exit based on cycle position
Key Parameters in the Script
Basic RSI Parameters
Required bars: Minimum number of bars needed (default: 20)
Overbought region: RSI level considered overbought (default: 70)
Oversold region: RSI level considered oversold (default: 30)
Bressert-Specific Parameters
Cycle Detection Length: Lookback period for cycle identification (default: 30)
Minimum/Maximum Cycle Length: Expected cycle duration in days (default: 15-30)
Buy Line: Lower threshold for buy signals (default: 40)
Sell Line: Upper threshold for sell signals (default: 60)
How the Indicator Works
RSI3M3 Calculation:
Calculates a 3-period RSI (sRSI)
Smooths it with a 3-period moving average (sMA)
Cycle Detection:
Identifies bottoms: When the RSI is below the buy line (40) and starting to turn up
Identifies tops: When the RSI is above the sell line (60) and starting to turn down
Records these points to calculate cycle lengths
Timing Bands:
Projects when the next cycle bottom or top should occur
Creates visual bands on the chart showing these expected time windows
Signal Generation:
Buy signals occur when the RSI turns up from below the oversold level (30)
Sell signals occur when the RSI turns down from above the overbought level (70)
Enhanced by Bressert's specific timing rules
Bressert's Five Trading Rules (Implemented in the Script)
Cycle Timing: The low must be 15-30 market days from the previous Trading Cycle bottom
Prior Top Validation: A Trading Cycle high must have occurred with the oscillator above 60
Oscillator Behavior: The oscillator must drop below 40 and turn up
Entry Trigger: Entry is triggered by a rise above the price high of the upturn day
Protective Stop: Place stop slightly below the Trading Cycle low (implemented as 99% of bottom price)
How to Use the Indicator
Reading the Chart
Main Plot Area:
Green line: 3-period RSI
Red line: 3-period moving average of the RSI
Horizontal bands: Oversold (30) and Overbought (70) regions
Dotted lines: Buy line (40) and Sell line (60)
Yellow vertical bands: Projected timing windows for next cycle bottom
Signals:
Green up arrows: Buy signals
Red down arrows: Sell signals
Trading Strategy
For Buy Signals:
Wait for the RSI to drop below the buy line (40)
Look for an upturn in the RSI from below this level
Enter the trade when price rises above the high of the upturn day
Place a protective stop at 99% of the Trading Cycle low
For Sell Signals:
Wait for the RSI to rise above the sell line (60)
Look for a downturn in the RSI from above this level
Consider exiting or taking profits when a sell signal appears
Alternative exit: When price moves below the low of the downturn day
Cycle Timing Enhancement:
Pay attention to the yellow timing bands
Signals occurring within these bands have higher probability of success
Signals outside these bands may be less reliable
Practical Tips for Using RSI3M3+
Timeframe Selection:
The indicator works best on daily charts for intermediate-term trading
Can be used on weekly charts for longer-term position trading
On intraday charts, adjust cycle lengths accordingly
Market Applicability:
Works well in trending markets with clear cyclical behavior
Less effective in choppy, non-trending markets
Consider additional indicators for trend confirmation
Parameter Adjustment:
Different markets may have different natural cycle lengths
You may need to adjust the min/max cycle length parameters
Higher volatility markets may need wider overbought/oversold levels
Trade Management:
Enter trades when all Bressert's conditions are met
Use the protective stop as defined (99% of cycle low)
Consider taking partial profits at the projected cycle high timing
Advanced Techniques
Multiple Timeframe Analysis:
Confirm signals with the same indicator on higher timeframes
Enter in the direction of the larger cycle when smaller and larger cycles align
Divergence Detection:
Look for price making new lows while RSI makes higher lows (bullish)
Look for price making new highs while RSI makes lower highs (bearish)
Confluence with Price Action:
Combine with support/resistance levels
Use with candlestick patterns for confirmation
Consider volume confirmation of cycle turns
This RSI3M3+ indicator combines the responsiveness of a short-term RSI with the predictive power of Bressert's cycle analysis, offering traders a sophisticated tool for identifying high-probability trading opportunities based on market cycles and momentum shifts.
THANK YOU FOR PREVIOUS CODER THAT EFFORT TO CREATE THE EARLIER VERSION THAT MAKE WALTER J BRESSERT CONCEPT IN TRADINGVIEW @ADutchTourist

Strategy Stats [presentTrading]Hello! it's another weekend. This tool is a strategy performance analysis tool. Looking at the TradingView community, it seems few creators focus on this aspect. I've intentionally created a shared version. Welcome to share your idea or question on this.
█ Introduction and How it is Different
Strategy Stats is a comprehensive performance analytics framework designed specifically for trading strategies. Unlike standard strategy backtesting tools that simply show cumulative profits, this analytics suite provides real-time, multi-timeframe statistical analysis of your trading performance.
Multi-timeframe analysis: Automatically tracks performance metrics across the most recent time periods (last 7 days, 30 days, 90 days, 1 year, and 4 years)
Advanced statistical measures: Goes beyond basic metrics to include Information Coefficient (IC) and Sortino Ratio
Real-time feedback: Updates performance statistics with each new trade
Visual analytics: Color-coded performance table provides instant visual feedback on strategy health
Integrated risk management: Implements sophisticated take profit mechanisms with 3-step ATR and percentage-based exits
BTCUSD Performance
The table in the upper right corner is a comprehensive performance dashboard showing trading strategy statistics.
Note: While this presentation uses Vegas SuperTrend as the underlying strategy, this is merely an example. The Stats framework can be applied to any trading strategy. The Vegas SuperTrend implementation is included solely to demonstrate how the analytics module integrates with a trading strategy.
⚠️ Timeframe Limitations
Important: TradingView's backtesting engine has a maximum storage limit of 10,000 bars. When using this strategy stats framework on smaller timeframes such as 1-hour or 2-hour charts, you may encounter errors if your backtesting period is too long.
Recommended Timeframe Usage:
Ideal for: 4H, 6H, 8H, Daily charts and above
May cause errors on: 1H, 2H charts spanning multiple years
Not recommended for: Timeframes below 1H with long history
█ Strategy, How it Works: Detailed Explanation
The Strategy Stats framework consists of three primary components: statistical data collection, performance analysis, and visualization.
🔶 Statistical Data Collection
The system maintains several critical data arrays:
equityHistory: Tracks equity curve over time
tradeHistory: Records profit/loss of each trade
predictionSignals: Stores trade direction signals (1 for long, -1 for short)
actualReturns: Records corresponding actual returns from each trade
For each closed trade, the system captures:
float tradePnL = strategy.closedtrades.profit(tradeIndex)
float tradeReturn = strategy.closedtrades.profit_percent(tradeIndex)
int tradeType = entryPrice < exitPrice ? 1 : -1 // Direction
🔶 Performance Metrics Calculation
The framework calculates several key performance metrics:
Information Coefficient (IC):
The correlation between prediction signals and actual returns, measuring forecast skill.
IC = Correlation(predictionSignals, actualReturns)
Where Correlation is the Pearson correlation coefficient:
Correlation(X,Y) = (nΣXY - ΣXY) / √
Sortino Ratio:
Measures risk-adjusted return focusing only on downside risk:
Sortino = (Avg_Return - Risk_Free_Rate) / Downside_Deviation
Where Downside Deviation is:
Downside_Deviation = √
R_i represents individual returns, T is the target return (typically the risk-free rate), and n is the number of observations.
Maximum Drawdown:
Tracks the largest percentage drop from peak to trough:
DD = (Peak_Equity - Trough_Equity) / Peak_Equity * 100
🔶 Time Period Calculation
The system automatically determines the appropriate number of bars to analyze for each timeframe based on the current chart timeframe:
bars_7d = math.max(1, math.round(7 * barsPerDay))
bars_30d = math.max(1, math.round(30 * barsPerDay))
bars_90d = math.max(1, math.round(90 * barsPerDay))
bars_365d = math.max(1, math.round(365 * barsPerDay))
bars_4y = math.max(1, math.round(365 * 4 * barsPerDay))
Where barsPerDay is calculated based on the chart timeframe:
barsPerDay = timeframe.isintraday ?
24 * 60 / math.max(1, (timeframe.in_seconds() / 60)) :
timeframe.isdaily ? 1 :
timeframe.isweekly ? 1/7 :
timeframe.ismonthly ? 1/30 : 0.01
🔶 Visual Representation
The system presents performance data in a color-coded table with intuitive visual indicators:
Green: Excellent performance
Lime: Good performance
Gray: Neutral performance
Orange: Mediocre performance
Red: Poor performance
█ Trade Direction
The Strategy Stats framework supports three trading directions:
Long Only: Only takes long positions when entry conditions are met
Short Only: Only takes short positions when entry conditions are met
Both: Takes both long and short positions depending on market conditions
█ Usage
To effectively use the Strategy Stats framework:
Apply to existing strategies: Add the performance tracking code to any strategy to gain advanced analytics
Monitor multiple timeframes: Use the multi-timeframe analysis to identify performance trends
Evaluate strategy health: Review IC and Sortino ratios to assess predictive power and risk-adjusted returns
Optimize parameters: Use performance data to refine strategy parameters
Compare strategies: Apply the framework to multiple strategies to identify the most effective approach
For best results, allow the strategy to generate sufficient trade history for meaningful statistical analysis (at least 20-30 trades).
█ Default Settings
The default settings have been carefully calibrated for cryptocurrency markets:
Performance Tracking:
Time periods: 7D, 30D, 90D, 1Y, 4Y
Statistical measures: Return, Win%, MaxDD, IC, Sortino Ratio
IC color thresholds: >0.3 (green), >0.1 (lime), <-0.1 (orange), <-0.3 (red)
Sortino color thresholds: >1.0 (green), >0.5 (lime), <0 (red)
Multi-Step Take Profit:
ATR multipliers: 2.618, 5.0, 10.0
Percentage levels: 3%, 8%, 17%
Short multiplier: 1.5x (makes short take profits more aggressive)
Stop loss: 20%

MTF Fibonacci Pivots with Mandelbrot FractalsMTF Fibonacci Pivots with Mandelbrot Fractals: Advanced Market Structure Analysis
Overview
The MTF Fibonacci Pivots with Mandelbrot Fractals indicator represents a significant advancement in technical analysis by combining multi-timeframe Fibonacci pivot levels with sophisticated fractal pattern recognition. This powerful tool identifies key support and resistance zones while predicting potential price reversals with remarkable accuracy.
Key Capabilities
This indicator provides traders with three distinct layers of market structure analysis:
Automatic Timeframe Adaptation: The primary pivot set automatically adjusts to your chart's timeframe, ensuring relevant support and resistance levels for your specific trading horizon.
1-Year Fibonacci Pivots: The second layer displays yearly pivots that reveal long-term market cycles and institutional price levels that often act as significant reversal points.
3-Year Fibonacci Pivots: The third layer unveils major market structure zones that typically remain relevant for extended periods, offering strategic context for position trading and long-term investment decisions.
Predictive Technology
What truly distinguishes this indicator is its advanced predictive capability powered by:
Mandelbrot Fractal Pattern Recognition: The indicator implements a sophisticated fractal detection algorithm that identifies recurring price patterns across multiple timeframes. Unlike conventional fractal indicators, it incorporates noise filtering and adaptive sensitivity to market volatility.
Tesla's 3-6-9 Principle Integration: The system incorporates Nikola Tesla's mathematical principle through a cubic Mandelbrot equation (Z_{n+1} = Z_n^3 + C where Z_0 = 0), creating a unique approach to pattern recognition that aligns with natural market rhythms.
Historical Pattern Matching: When a current price pattern exhibits strong similarity to historical formations, the indicator generates predictive targets with confidence ratings. Each prediction undergoes rigorous validation against multiple parameters including trend alignment, volatility context, and mathematical coherence.
Visual Intelligence System
The indicator's visual presentation enhances trading decision-making through:
Confidence-Based Visualization: Predictions display with intuitive star ratings, percentage confidence scores, and contextual information including price movement magnitude and estimated time to target.
Adaptive Color Harmonization: The color system intelligently adjusts to provide optimal visibility while maintaining a professional appearance suitable for any chart setup.
Trend Alignment Indicators: Each prediction includes references to the broader trend context, helping traders avoid counter-trend trades unless the reversal signal carries exceptional strength.
Strategic Applications
This indicator excels in multiple trading scenarios:
Intraday Trading: Identify high-probability reversal zones with precise timing
Swing Trading: Anticipate significant market turns at key structural levels
Position Trading: Recognize major cycle shifts for strategic entry and exit
The automatic 1-year and 3-year Fibonacci pivots provide institutional-grade reference points that typically define major market movements. These longer timeframes reveal critical zones that might be invisible on shorter-term analysis, giving you a significant edge in understanding where price is likely to encounter substantial buying or selling pressure.
This innovative approach to market analysis combines classical Fibonacci mathematics with cutting-edge fractal theory to create a comprehensive market structure visualization system that illuminates both present support/resistance levels and future price targets with exceptional clarity.
Setting Up MTF Fibonacci Pivots with Mandelbrot Fractals
Initial Setup
Adding this indicator to your TradingView charts is straightforward:
Navigate to the "Indicators" button on your chart toolbar
Search for "MTF Fibonacci Pivots with Mandelbrot Fractals"
Select the indicator to add it to your chart
A configuration panel will appear with various setting categories
Recommended Settings
The indicator comes pre-configured with optimal default settings, but you may want to adjust them based on your trading style:
For Day Trading (Timeframes 1-minute to 1-hour)
Pivots Timeframe 1: Auto (automatically adapts to your chart)
Pivots Timeframe 2: Daily
Pivots Timeframe 3: Weekly
Fractal Sensitivity: 2-3
Fractal Lookback Period: 20
Prediction Strength: 2
Color Theme: High Contrast or Dark Mode
For Swing Trading (Timeframes 4-hour to Daily)
Pivots Timeframe 1: Daily
Pivots Timeframe 2: Weekly
Pivots Timeframe 3: Monthly
Fractal Sensitivity: 1-2
Fractal Lookback Period: 30
Prediction Strength: 2-3
Color Theme: Default or Dimmed
For Position Trading (Timeframes Daily to Weekly)
Pivots Timeframe 1: Weekly
Pivots Timeframe 2: Monthly
Pivots Timeframe 3: Quarterly
Fractal Sensitivity: 1
Fractal Lookback Period: 50
Prediction Strength: 1
Color Theme: Monochrome or Pastel
Restoring Default Settings
If you've adjusted settings and wish to return to the defaults:
Right-click on the indicator name on your chart
Select "Settings" from the context menu
In the settings dialog, look for the "Reset All" button at the bottom
Confirm the reset when prompted
Alternatively, you can remove the indicator and add it again for a fresh start with default settings.
Advanced Settings Guidance
Visual Appearance
Use Gradient Colors: Enable for better visual differentiation between pivot levels
Color Transparency: 15% provides an optimal balance between visibility and chart clutter
Line Width: 1-2 for cleaner charts, 3+ for enhanced visibility
Fractal Analysis
Enable Fractal Analysis: Keep enabled for prediction capabilities
Fractal Box Spacing: Higher values (5-10) for cleaner displays, lower values (1-3) for more signals
Maximum Forecast Bars: 20 is optimal for most timeframes, adjust higher for longer predictions
Performance Considerations
Enable Self-Optimization: Keep enabled to maintain smooth chart performance
Resource Priority: Use "Balanced" for most computers, "Performance" for older systems
Force Pivot Display: Enable only when checking specific historical periods
Common Setup Mistakes to Avoid
Setting all timeframes too close together (e.g., Daily, Daily, Weekly) reduces the multi-timeframe advantage
Using high fractal sensitivity (4+) on noisy markets creates excessive signals
Setting fractal box spacing too low causes cluttered prediction boxes
Disabling self-optimization may cause performance issues on complex charts
Using incompatible color themes for your chart background reduces visibility
The indicator's power comes from its default 1-year and 3-year Fibonacci pivot settings, which highlight institutional levels while the auto-timeframe setting adapts to your trading horizon. These carefully balanced defaults provide an excellent starting point for most traders.
For optimal results, I recommend making minimal adjustments at first, then gradually customizing settings as you become familiar with the indicator's behavior in your specific markets and timeframes.
Screenshots:

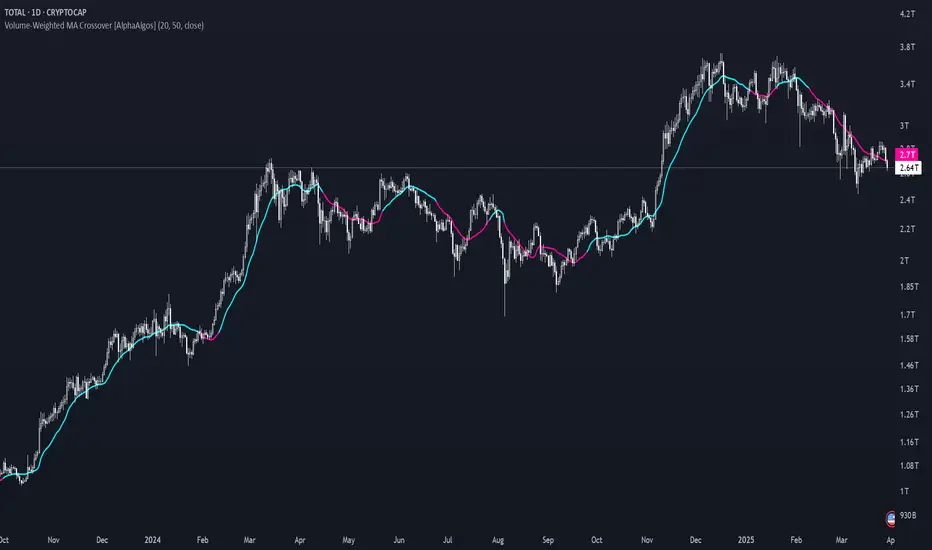
Volume-Weighted MA Crossover [AlphaAlgos]Volume-Weighted MA Crossover
Overview:
The Volume-Weighted MA Crossover is a sophisticated trend-following indicator designed to capture reliable trend reversals and trend continuation signals using volume and price action. By combining the power of Volume-Weighted Moving Averages (VWMA) and the simplicity of Simple Moving Averages (SMA) , this indicator provides a more robust and reliable trend filter. It ensures that trend signals are supported by strong market volume, offering a deeper insight into market strength and potential price movements.
How It Works:
The Volume-Weighted MA Crossover indicator calculates a Volume-Weighted Moving Average (VWMA) of the chosen price source (typically close ), which takes into account both the price and volume of each bar. This ensures that price movements with higher volume are weighted more heavily, providing a better reflection of actual market sentiment.
In conjunction with the VWMA, a traditional Simple Moving Average (SMA) is used to filter out noise and smooth price data, providing a more stable trend direction. The crossover between the VWMA and SMA serves as the primary trading signal:
Long Signal (Bullish Crossover) : The VWMA crosses above the SMA, indicating that a strong bullish trend is likely underway, supported by increased volume and price action.
Short Signal (Bearish Crossover) : The VWMA crosses below the SMA, signaling that a bearish trend is emerging, backed by decreasing volume and price reversal.
The Volume-Weighted MA Crossover can be used as a standalone indicator or in conjunction with other tools to enhance your trading strategy, offering both trend-following and volume confirmation.
Key Features:
Volume Sensitivity : The VWMA adjusts the moving average based on volume, providing a more accurate representation of price action during high-volume periods. This makes the indicator more sensitive to market dynamics, ensuring that price movements during significant volume spikes are prioritized.
Trend Confirmation : The crossover of the VWMA and SMA offers clear and actionable signals, helping traders identify trend reversals early and with more confidence.
Clean Signal Presentation : With color-coded signal markers , this indicator makes it easy to spot actionable entry points.
Customizable Settings : Tailor the VWMA and SMA periods, volume multiplier, and source price according to your preferred market conditions and timeframes, allowing the indicator to fit your trading style.
How to Use It:
Trend Direction : Look for crossovers between the VWMA and SMA to identify potential trend changes:
Volume Confirmation : The volume-weighted aspect of this indicator ensures that trends are confirmed by volume. A bullish trend with a VWMA crossing above the SMA suggests that the upward movement is supported by strong market sentiment (high volume). Conversely, a bearish trend with a VWMA crossing below the SMA indicates a reversal is supported by volume reduction.
Trend Continuation & Reversal : This indicator works particularly well during strong trending markets. However, it can also identify potential reversals, particularly during periods of high volume and rapid price changes.
Best Timeframe to Use:
This indicator is adaptable to multiple timeframes and can be used across various market types. However, it tends to work most effectively on medium to long-term charts (such as 1-hour, 4-hour, and daily charts) where trends have the potential to develop more clearly and with more volume participation.
Ideal for:
Trend-following traders looking for reliable signals that are confirmed by both price action and volume.
Swing traders who want to enter trades at the beginning of a new trend or after a confirmed trend reversal.
Day traders seeking clear and easy-to-read signals on intra-day charts, helping to pinpoint optimal entry and exit points during volatile market conditions.
Conclusion:
The Volume-Weighted MA Crossover is an essential tool for any trader looking to improve their trend-following strategy. By incorporating both volume and price action into a VWMA and SMA crossover , it offers a more refined approach to identifying and confirming trends. Whether you're a trend follower , swing trader , or day trader , this indicator provides clear, actionable signals backed by volume confirmation, giving you the confidence to execute your trades with precision.
Mile Runner - Swing Trade LONGMile Runner - Swing Trade LONG Indicator - By @jerolourenco
Overview
The Mile Runner - Swing Trade LONG indicator is designed for swing traders who focus on LONG positions in stocks, BDRs (Brazilian Depositary Receipts), and ETFs. It provides clear entry signals, stop loss, and take profit levels, helping traders identify optimal buying opportunities with a robust set of technical filters. The indicator is optimized for daily candlestick charts and combines multiple technical analysis tools to ensure high-probability trades.
Key Features
Entry Signals: Visualized as green triangles below the price bars, indicating a potential LONG entry.
Stop Loss and Take Profit Levels: Automatically plotted on the chart for easy reference.
Stop Loss: Based on the most recent pivot low (support level).
Take Profit: Calculated using a Fibonacci-based projection from the entry price to the stop loss.
Trend and Momentum Filters: Ensures trades align with the prevailing trend and have sufficient momentum.
Volume and Volatility Confirmation: Verifies market interest and price movement potential.
How It Works
The indicator uses a combination of technical tools to filter and confirm trade setups:
Exponential Moving Averages (EMAs):
A short EMA (default: 9 periods) and a long EMA (default: 21 periods) identify the trend.
A bullish crossover (EMA9 crosses above EMA21) signals a potential upward trend.
Money Flow Index (MFI):
Confirms buying pressure when MFI > 50.
Average True Range (ATR):
Ensures sufficient volatility by checking if ATR exceeds its 20-period moving average.
Volume:
Confirms market interest when volume exceeds its 20-period moving average.
Pivot Lows:
Identifies recent support levels (pivot lows) to set the stop loss.
Ensures the pivot low is recent (within the last 10 bars by default).
Additional Trend Filter:
Confirms the long EMA is rising, reinforcing the bullish trend.
Inputs and Customization
The indicator is highly customizable, allowing traders to tailor it to their strategies:
EMA Periods: Adjust the short and long EMA lengths.
ATR and MFI Periods: Modify lookback periods for volatility and momentum.
Pivot Lookback: Control the sensitivity of pivot low detection.
Fibonacci Level: Adjust the Fibonacci retracement level for take profit.
Take Profit Multiplier: Fine-tune the aggressiveness of the take profit target.
Max Pivot Age: Set the maximum bars since the last pivot low for relevance.
Usage Instructions
Apply the Indicator:
Add the "Mile Runner - Swing Trade LONG" indicator to your TradingView chart.
Best used on daily charts for swing trading.
Look for Entry Signals:
A green triangle below the price bar signals a potential LONG entry.
Set Stop Loss and Take Profit:
Stop Loss: Red dashed line indicating the stop loss level.
Take Profit: Purple dashed line showing the take profit level.
Monitor the Trade:
The entry price is marked with a green dashed line for reference.
Adjust trade management based on the plotted levels.
Set Alerts:
Use the built-in alert condition to get notified of new LONG entry signals.
Important Notes
For LONG Positions Only : Designed exclusively for swing trading LONG positions.
Timeframe: Optimized for daily charts but can be tested on other timeframes.
Asset Types: Works best with stocks, BDRs, and ETFs.
Risk Management: Always align stop loss and take profit levels with your risk tolerance.
Why Use Mile Runner?
The Mile Runner indicator simplifies swing trading by integrating trend, momentum, volume, and volatility filters into one user-friendly tool. It helps traders:
Identify high-probability entry points.
Establish clear stop loss and take profit levels.
Avoid low-volatility or low-volume markets.
Focus on assets with strong buying pressure and recent support.
By following its signals and levels, traders can make informed decisions and enhance their swing trading performance. Customize the inputs and test it on your favorite assets—happy trading!

Casa_SessionsLibrary "Casa_Sessions"
Advanced trading session management library that enhances TradingView's default functionality:
Key Features:
- Accurate session detection for futures markets
- Custom session hour definitions
- Drop-in replacements for standard TradingView session functions
- Flexible session map customization
- Full control over trading windows and market hours
Perfect for traders who need precise session timing, especially when working
with futures markets or custom trading schedules.
SetSessionTimes(session_type_input, custom_session_times_input, syminfo_type, syminfo_root, syminfo_timezone)
Parameters:
session_type_input (simple string) : Input string for session selection:
- 'Custom': User-defined session times
- 'FX-Tokyo': Tokyo forex session
- 'FX-London': London forex session
- 'FX-New York': NY forex session
- 'Overnight Session (ON)': After-hours trading
- 'Day Session (RTH)': Regular trading hours
custom_session_times_input (simple string) : Session parameter for custom time windows
Only used when session_type_input is 'Custom'
syminfo_type (simple string)
syminfo_root (simple string)
syminfo_timezone (simple string)
Returns:
session_times: Trading hours for selected session
session_timezone: Market timezone (relevant for forex)
getSessionMap()
Get futures trading session hours map
Keys are formatted as 'symbol:session', examples:
- 'ES:market' - Regular trading hours (RTH)
- 'ES:overnight' - Extended trading hours (ETH)
- 'NQ:market' - NASDAQ futures RTH
- 'CL:overnight' - Crude Oil futures ETH
Returns: Map
Key: Symbol:session identifier
Value: Session hours in format "HH:MM-HH:MM"
getSessionString(session, symbol, sessionMap)
Returns a session string representing the session hours (and days) for the requested symbol (or the chart's symbol if the symbol value is not provided). If the session string is not found in the collection, it will return a blank string.
Parameters:
session (string) : A string representing the session hour being requested. One of: market (regular trading hours), overnight (extended/electronic trading hours), postmarket (after-hours), premarket
symbol (string) : The symbol to check. Optional. Defaults to chart symbol.
sessionMap (map) : The map of futures session hours. Optional. Uses default if not provided.
inSession(session, sessionMap, barsBack)
Returns true if the current symbol is currently in the session parameters defined by sessionString.
Parameters:
session (string) : A string representing the session hour being requested. One of: market (regular trading hours), overnight (extended/electronic trading hours), postmarket (after-hours), premarket
sessionMap (map) : The map of futures session hours. Optional. Uses default if not provided.
barsBack (int) : Private. Only used by futures to check islastbar. Optional. The default is 0.
ismarket(sessionMap)
Returns true if the current bar is a part of the regular trading hours (i.e. market hours), false otherwise. Works for futures (TradingView's methods do not).
Parameters:
sessionMap (map) : The map of futures session hours. Optional. Uses default if not provided.
Returns: bool
isfirstbar()
Returns true if the current bar is the first bar of the day's session, false otherwise. If extended session information is used, only returns true on the first bar of the pre-market bars. Works for futures (TradingView's methods do not).
Returns: bool
islastbar()
Returns true if the current bar is the last bar of the day's session, false otherwise. If extended session information is used, only returns true on the last bar of the post-market bars. Works for futures (TradingView's methods do not).
Returns: bool
ispremarket(sessionMap)
Returns true if the current bar is a part of the pre-market, false otherwise. On non-intraday charts always returns false. Works for futures (TradingView's methods do not).
Parameters:
sessionMap (map) : The map of futures session hours. Optional. Uses default if not provided.
Returns: bool
ispostmarket(sessionMap)
Returns true if the current bar is a part of the post-market, false otherwise. On non-intraday charts always returns false. Works for futures (TradingView's methods do not).
Parameters:
sessionMap (map) : The map of futures session hours. Optional. Uses default if not provided.
Returns: bool
isfirstbar_regular(sessionMap)
Returns true on the first regular session bar of the day, false otherwise. The result is the same whether extended session information is used or not. Works for futures (TradingView's methods do not).
Parameters:
sessionMap (map) : The map of futures session hours. Optional. Uses default if not provided.
Returns: bool
islastbar_regular(sessionMap)
Returns true on the last regular session bar of the day, false otherwise. The result is the same whether extended session information is used or not. Works for futures (TradingView's methods do not).
Parameters:
sessionMap (map) : The map of futures session hours. Optional. Uses default if not provided.
Returns: bool
isovernight(sessionMap)
Returns true if the current bar is a part of the pre-market or post-market, false otherwise. On non-intraday charts always returns false.
Parameters:
sessionMap (map) : The map of futures session hours. Optional. Uses default if not provided.
Returns: bool
getSessionHighAndLow(session, sessionMap)
Returns a tuple containing the high and low print during the specified session.
Parameters:
session (string) : The session for which to get the high & low prints. Defaults to market.
sessionMap (map) : The map of futures session hours. Optional. Uses default if not provided.
Returns: A tuple containing
getSessionHigh(session, sessionMap)
Convenience function to return the session high. Necessary if you want to call this function from within a request.security expression where you can't return a tuple.
Parameters:
session (string) : The session for which to get the high & low prints. Defaults to market.
sessionMap (map) : The map of futures session hours. Optional. Uses default if not provided.
Returns: The high of the session
getSessionLow(session, sessionMap)
Convenience function to return the session low. Necessary if you want to call this function from within a request.security expression where you can't return a tuple.
Parameters:
session (string) : The session for which to get the high & low prints. Defaults to market.
sessionMap (map) : The map of futures session hours. Optional. Uses default if not provided.
Returns: The low of the session

[3Commas] HA & MAHA & MA
🔷What it does: This tool is designed to test a trend-following strategy using Heikin Ashi candles and moving averages. It enters trades after pullbacks, aiming to let profits run once the risk-to-reward ratio reaches 1:1 while securing the position.
🔷Who is it for: It is ideal for traders looking to compare final results using fixed versus dynamic take profits by adjusting parameters and trade direction—a concept applicable to most trading strategies.
🔷How does it work: We use moving averages to define the market trend, then wait for opposite Heikin Ashi candles to form against it. Once these candles reverse in favor of the trend, we enter the trade, using the last swing created by the pullback as the stop loss. By applying the breakeven ratio, we protect the trade and let it run, using the slower moving average as a trailing stop.
A buy signal is generated when:
The previous candle is bearish (ha_bear ), indicating a pullback.
The fast moving average (ma1) is above the slow moving average (ma2), confirming an uptrend.
The current candle is bullish (ha_bull), showing trend continuation.
The Heikin Ashi close is above the fast moving average (ma1), reinforcing the bullish bias.
The real price close is above the open (close > open), ensuring bullish momentum in actual price data.
The signal is confirmed on the closed candle (barstate.isconfirmed) to avoid premature signals.
dir is undefined (na(dir)), preventing repeated signals in the same direction.
A sell signal is generated when:
The previous candle is bullish (ha_bull ), indicating a temporary upward move before a potential reversal.
The fast moving average (ma1) is below the slow moving average (ma2), confirming a downtrend.
The current candle is bearish (ha_bear), showing trend continuation to the downside.
The Heikin Ashi close is below the fast moving average (ma1), reinforcing bearish pressure.
The real price close is below the open (close < open), confirming bearish momentum in actual price data.
The signal is confirmed after the candle closes (barstate.isconfirmed), avoiding premature entries.
dir is undefined (na(dir)), preventing consecutive signals in the same direction.
In simple terms, this setup looks for trend continuation after a pullback, confirming entries with both Heikin Ashi and real price action, supported by moving average alignment to avoid false signals.
If the price reaches a 1:1 risk-to-reward ratio, the stop will be moved to the entry point. However, if the slow moving average surpasses this level, it will become the new exit point, acting as a trailing stop
🔷Why It’s Unique
Easily visualizes the benefits of using risk-to-reward ratios when trading instead of fixed percentages.
Provides a simple and straightforward approach to trading, embracing the "keep it simple" concept.
Offers clear visualization of DCA Bot entry and exit points based on user preferences.
Includes an option to review the message format before sending signals to bots, with compatibility for multi-pair and futures contract pairs.
🔷 Considerations Before Using the Indicator
⚠️Very important: The indicator must be used on charts with real price data, such as Japanese candlesticks, line charts, etc. Do not use it on Heikin Ashi charts, as this may lead to unrealistic results.
🔸Since this is a trend-following strategy, use it on timeframes above 4 hours, where market noise is reduced and trends are clearer. Also, carefully review the statistics before using it, focusing on pairs that tend to have long periods of well-defined trends.
🔸Disadvantages:
False Signals in Ranges: Consolidating markets can generate unreliable signals.
Lagging Indicator: Being based on moving averages, it may react late to sudden price movements.
🔸Advantages:
Trend Focused: Simplifies the identification of trending markets.
Noise Reduction: Uses Heikin Ashi candles to identify trend continuation after pullbacks.
Broad Applicability: Suitable for forex, crypto, stocks, and commodities.
🔸The strategy provides a systematic way to analyze markets but does not guarantee successful outcomes. Use it as an additional tool rather than relying solely on an automated system.
Trading results depend on various factors, including market conditions, trader discipline, and risk management. Past performance does not ensure future success, so always approach the market cautiously.
🔸Risk Management: Define stop-loss levels, position sizes, and profit targets before entering any trade. Be prepared for potential losses and ensure your approach aligns with your overall trading plan.
🔷 STRATEGY PROPERTIES
Symbol: BINANCE:BTCUSDT (Spot).
Timeframe: 4h.
Test Period: All historical data available.
Initial Capital: 10000 USDT.
Order Size per Trade: 1% of Capital, you can use a higher value e.g. 5%, be cautious that the Max Drawdown does not exceed 10%, as it would indicate a very risky trading approach.
Commission: Binance commission 0.1%, adjust according to the exchange being used, lower numbers will generate unrealistic results. By using low values e.g. 5%, it allows us to adapt over time and check the functioning of the strategy.
Slippage: 5 ticks, for pairs with low liquidity or very large orders, this number should be increased as the order may not be filled at the desired level.
Margin for Long and Short Positions: 100%.
Indicator Settings: Default Configuration.
MA1 Length: 9.
MA2 Length: 18.
MA Calculations: EMA.
Take Profit Ratio: Disable. Ratio 1:4.
Breakeven Ratio: Enable, Ratio 1:1.
Strategy: Long & Short.
🔷 STRATEGY RESULTS
⚠️Remember, past results do not guarantee future performance.
Net Profit: +324.88 USDT (+3.25%).
Max Drawdown: -81.18 USDT (-0.78%).
Total Closed Trades: 672.
Percent Profitable: 35.57%.
Profit Factor: 1.347.
Average Trade: +0.48 USDT (+0.48%).
Average # Bars in Trades: 13.
🔷 HOW TO USE
🔸 Adjust Settings:
The default values—MA1 (9) and MA2 (18) with EMA calculation—generally work well. However, you can increase these values, such as 20 and 40, to better identify stronger trends.
🔸 Choose a Symbol that Typically Trends:
Select an asset that tends to form clear trends. Keep in mind that the Strategy Tester results may show poor performance for certain assets, making them less suitable for sending signals to bots.
🔸 Experiment with Ratios:
Test different take profit and breakeven ratios to compare various scenarios—especially to observe how the strategy performs when only the trade is protected.
🔸This is an example of how protecting the trade works: once the price moves in favor of the position with a 1:1 risk-to-reward ratio, the stop loss is moved to the entry price. If the Slow MA surpasses this level, it will act as a trailing stop, aiming to follow the trend and maximize potential gains.
🔸In contrast, in this example, for the same trade, if we set a take profit at a 1:3 risk-to-reward ratio—which is generally considered a good risk-reward relationship—we can see how a significant portion of the upward move is left on the table.
🔸Results Review:
It is important to check the Max Drawdown. This value should ideally not exceed 10% of your capital. Consider adjusting the trade size to ensure this threshold is not surpassed.
Remember to include the correct values for commission and slippage according to the symbol and exchange where you are conducting the tests. Otherwise, the results will not be realistic.
If you are satisfied with the results, you may consider automating your trades. However, it is strongly recommended to use a small amount of capital or a demo account to test proper execution before committing real funds.
🔸Create alerts to trigger the DCA Bot:
Verify Messages: Ensure the message matches the one specified by the DCA Bot.
Multi-Pair Configuration: For multi-pair setups, enable the option to add the symbol in the correct format.
Signal Settings: Enable whether you want to receive long or short signals (Entry | TP | SL), copy and paste the the messages for the DCA Bots configured.
Alert Setup:
When creating an alert, set the condition to the indicator and choose "alert() function call only.
Enter any desired Alert Name.
Open the Notifications tab, enable Webhook URL, and paste the Webhook URL.
For more details, refer to the section: "How to use TradingView Custom Signals".
Finalize Alerts: Click Create, you're done! Alerts will now be sent automatically in the correct format.
🔷 INDICATOR SETTINGS
MA 1: Fast MA Length
MA 2: Slow MA Length
MA Calc: MA's Calculations (SMA,EMA, RMA,WMA)
TP Ratio: This is the take profit ratio relative to the stop loss, where the trade will be closed in profit.
BE Ratio: This is the breakeven ratio relative to the stop loss, where the stop loss will be updated to breakeven or if the MA2 is greater than this level.
Strategy: Order Type direction in which trades are executed.
Use Custom Test Period: When enabled signals only works in the selected time window. If disabled it will use all historical data available on the chart.
Test Start and End: Once the Custom Test Period is enabled, here you select the start and end date that you want to analyze.
Check Messages: Enable the table to review the messages to be sent to the bot.
Entry | TP | SL: Enable this options to send Buy Entry, Take Profit (TP), and Stop Loss (SL) signals.
Deal Entry and Deal Exit : Copy and paste the message for the deal start signal and close order at Market Price of the DCA Bot. This is the message that will be sent with the alert to the Bot, you must verify that it is the same as the bot so that it can process properly so that it executes and starts the trade.
DCA Bot Multi-Pair: You must activate it if you want to use the signals in a DCA Bot Multi-pair in the text box you must enter (using the correct format) the symbol in which you are creating the alert, you can check the format of each symbol when you create the bot.
👨🏻💻💭 We hope this tool helps enhance your trading. Your feedback is invaluable, so feel free to share any suggestions for improvements or new features you'd like to see implemented.
__
The information and publications within the 3Commas TradingView account are not meant to be and do not constitute financial, investment, trading, or other types of advice or recommendations supplied or endorsed by 3Commas and any of the parties acting on behalf of 3Commas, including its employees, contractors, ambassadors, etc.

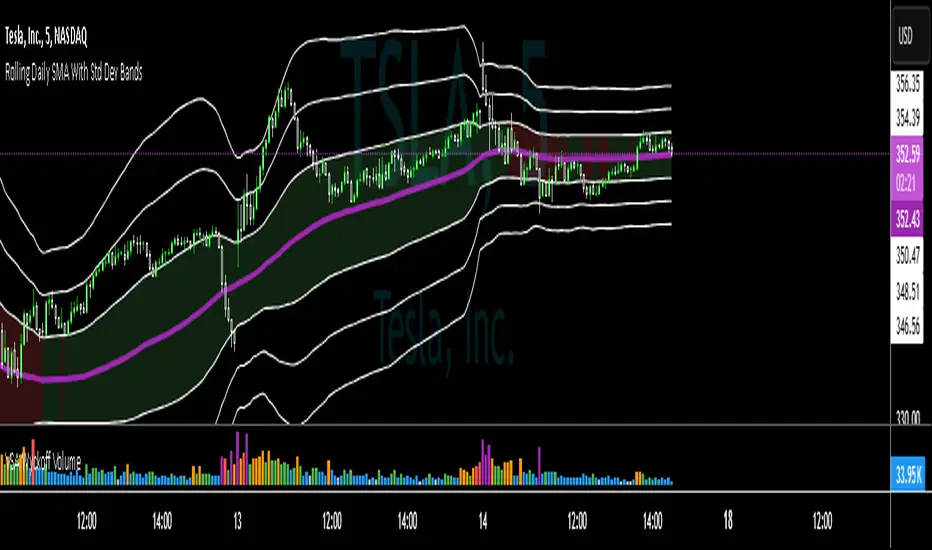
SMA with Std Dev Bands (Futures/US Stocks RTH)Rolling Daily SMA With Std Dev Bands
Upgrade your technical analysis with Rolling Daily SMA With Std Dev Bands, a powerful indicator that dynamically adjusts to your trading instrument. Whether you’re analyzing futures or US stocks during regular trading hours (RTH), this indicator seamlessly applies the correct logic to calculate a rolling daily Simple Moving Average (SMA) with customizable standard deviation bands for precise trend and volatility tracking.
Key Features:
✅ Automatic Instrument Detection– The indicator automatically recognizes whether you're trading futures or US equities and applies the correct daily lookback period based on your chart’s timeframe.
- Futures: Uses full trading day lengths (e.g., 1380 bars for 1‑minute charts).
- US Stocks (RTH): Uses regular session lengths (e.g., 390 bars for 1‑minute charts).
✅ Rolling Daily SMA (3‑pt Purple Line) – A continuously updated daily moving average, giving you an adaptive trend indicator based on market structure.
✅ Three Standard Deviation Bands (1‑pt White Lines) –
- Customizable multipliers allow you to adjust each band’s width.
- Toggle each band on or off to tailor the indicator to your strategy.
- The inner band area is color-filled: light green when the SMA is rising, light red when falling, helping you quickly identify trend direction.
✅ Works on Any Chart Timeframe – Whether you trade on 1-minute, 3-minute, 5-minute, or 15-minute charts, the indicator adjusts dynamically to provide accurate rolling daily calculations.
# How to Use:
📌 Identify Trends & Volatility Zones – The rolling daily SMA acts as a dynamic trend guide, while the standard deviation bands help spot potential overbought/oversold conditions.
📌 Customize for Precision – Adjust band multipliers and toggle each band on/off to match your trading style.
📌 Trade Smarter – The filled inner band offers instant visual feedback on market momentum, while the outer bands highlight potential breakout zones.
🔹 This is the perfect tool for traders looking to combine trend-following with volatility analysis in an easy-to-use, adaptive indicator.
🚀 Add Rolling Daily SMA With Std Dev Bands to your chart today and enhance your market insights!
---
*Disclaimer: This indicator is for informational and educational purposes only and should not be considered financial advice. Always use proper risk management and conduct your own research before trading.*
Opening Score with DivergenceOverview
The Opening Score Indicator is a versatile tool designed to help traders assess market sentiment, trend direction, and potential reversals. By combining Opening Range Breakout (ORB), VWAP, Trend, Volatility, and Divergence Detection, this indicator provides a composite score that adapts to different market conditions.
This version includes divergence detection between the Opening Score and price, which highlights potential trend reversals or continuations before they happen. When a regular divergence occurs, the histogram bar turns orange, signaling an increased probability of a trend change.
Best for Both Intraday & Longer-Term Charts
📊 Optimized for intraday trading → Works well on 1m to 30m timeframes for short-term strategies.
📈 Also effective on longer-term charts → Can be used on 1-hour, 4-hour, daily, or weekly charts to identify macro trends and momentum shifts.
🕰️ Adapts to different market conditions → Whether you’re a day trader, swing trader, or position trader, the Opening Score helps you track trend health and reversals.
How It Works
📊 Composite Opening Score Calculation
• ORB Signal → Detects bullish/bearish breakouts based on the opening range.
• VWAP Signal → Measures price positioning relative to VWAP for trend confirmation.
• Trend Signal → Uses a moving average to determine market direction.
• Volatility Signal → Tracks ATR changes to assess market strength.
• Divergence Detection → Identifies regular and hidden divergences for potential reversals or trend continuation.
🔹 Reversal Alerts with Color-Coded Histogram
• Green Bars → Normal bullish Opening Score.
• Red Bars → Normal bearish Opening Score.
• Orange Bars → Warning! Regular Divergence detected → Possible trend reversal.
🔹 Hidden & Regular Divergence Detection
• Regular Divergence (Reversal Signals)
• 📉 Bearish Regular Divergence → Price makes a Higher High, but Opening Score makes a Lower High → 🔻 Possible Downtrend Reversal.
• 📈 Bullish Regular Divergence → Price makes a Lower Low, but Opening Score makes a Higher Low → 🔼 Possible Uptrend Reversal.
• Hidden Divergence (Trend Continuation Signals)
• 📉 Bearish Hidden Divergence → Price makes a Lower High, but Opening Score makes a Higher High → 🔻 Trend Likely to Continue Down.
• 📈 Bullish Hidden Divergence → Price makes a Higher Low, but Opening Score makes a Lower Low → 🔼 Trend Likely to Continue Up.
How to Use It
✅ Watch for Reversal Alerts (Orange Bars) → These highlight potential market turning points.
✅ Use the Zero Line as a Trend Filter → A score above 0 suggests bullish conditions, while below 0 signals bearish conditions.
✅ Combine with Market Structure & Volume Profile → Works well when paired with support/resistance levels, liquidity zones, and order flow data.
✅ Adjust settings based on timeframe → Increase moving average length & lookback periods for longer-term analysis.
Why Use This Indicator?
🚀 Works for both short-term and long-term traders → Adapts to intraday and higher timeframes.
📊 Multi-Factor Analysis → Combines multiple key market indicators for better accuracy.
🎯 Customizable Weighting → Adjust the influence of each signal to suit your trading style.
✅ No Clutter – Only the Opening Score is plotted → Keeps your chart clean & efficient.
🔔 Recommended for Intraday Trading (1m – 30m) AND Longer-Term Analysis (1H – Weekly) → Use this indicator to enhance your trend detection & reversal strategy! 🚀
Line Break Chart StrategyHello All!
We should not pass this year without a gift!
My last publication in 2024 is Complete Line Break Chart Strategy with many features!
What is Line Break Chart?
" Line Break is a Japanese chart style that disregards time intervals and only focuses on price movements, similar to the Kagi and Renko chart styles. Line Break charts form a series of up and down bars (referred to as lines). Up lines represent rising prices, and down lines represent falling prices. New confirmed lines only form on the chart when closing prices break the range covered by previous lines. Users can control the number of past lines used in the calculation via the "Number of Lines" input in the chart settings. The typical "Number of Lines" setting is 3, meaning the chart forms a new up line when the closing price is above the high prices of the last three lines, and it forms a new down line when the closing price is below the past three lines' low prices. If the current price is higher, it is an up line and if it is lower, it is a down line. If the current closing price is the same or the move in the opposite direction is not large enough to warrant a reversal, l then no new line is draw n" by Tradingview. You can find it here
Now let's start examining the features of the indicator:
By using Line break reversals it shows trend on the main chart. You can create alert .
Moreover, you can decide which trade should be taken by using Risk Management in the indicator. You can set the " Maximum Risk " and then if the risk is more than you set then the trade is not taken. When trend changed it checks the distance between reversal level and open price and compare it with the Maximum Risk
Breakout:
It can find breakouts and shows on the chart. You can create alert for breakouts
It can show breakouts on the main chart:
Flip-Flops:
Upon looking at set of price break charts, the trader will notice that there are instances when uptrend blocks is followed by one reversal block, and then by a reversal to a series of uptrend blocks. The opposite is also possible: a series of downtrend blocks is followed by one reversal box and then by an immediate reversal to downtrend. This price action is called a " Flip-Flop ". This structure usually produces trend continuation signal. when we see this then we better use Buy/Sell stop order. lets see this on the chart:
Temporal Sequence Table:
Sequence frequency shows the frequency distribution of the number of sequential highs and the number of sequential lows that have been generated. This is quite important to the trader who is seeking to join a trend or put on a trade when the price break reverses into a new trend direction. For example, if the pattern over the past year has been that there never were more than nine consecutive high closes, it would make sense not to enter a position late into the sequence of new high closes.
also you can see market structure. I have tried to formalize it and show it under the table. so you can understand if it's choppy market.
"Number of Lines" has very important role. While using low time frames such seconds/minutes time frame you may want to choose higher number of lines such 5,6. ( this may minimize the risk of a whipsaw )
Gaps feature:
You can set Gaps on/off. if Gaps on then you can see how long it takes for each box
Reversal and Continuation Probability:
The script calculated Reversal level and Continuation probability of the trend by using Sequence frequency.
It also shows unconfirmed box and current closing price level:
Last but not least it has Overlay option for all items, and can show all items in the main chart!
P.S. I added alerts :)
Wish you all a happy new year!
Enjoy!

Multi-Symbol Scanner: Advanced EMA-RSI-Volume Strategy# Multi-Symbol Tech Stock Scanner: Advanced EMA-RSI-Volume Strategy
## Technical Analysis Methodology
This scanner implements a sophisticated multi-timeframe analysis approach combining three key technical elements:
### 1. Dual EMA System (Primary Trend Detection)
- **Long-term EMA (820 periods)**: Acts as the primary trend identifier
- Chosen specifically for tech stocks' longer-term price waves
- Helps filter out minor market noise while capturing major trend changes
- 820 periods approximately represents 3.2 years of trading days
- **Medium-term EMA (320 periods)**: Serves as trend confirmation
- Approximately 1.25 years of trading data
- Provides earlier entry signals while maintaining trend reliability
- Helps identify potential trend reversals before the major trend shift
### 2. Volume Analysis Component
The script employs a dynamic volume analysis system:
- Calculates 20-period moving average of volume as baseline
- Requires 1.5x surge above baseline for signal confirmation
- Volume surge requirement helps filter out weak moves and potential false breakouts
- Different from standard volume indicators as it uses adaptive thresholds
### 3. RSI Momentum Filter
Implements a specialized RSI configuration:
- 14-period RSI with dynamic overbought/oversold levels
- Oversold threshold: 30 (customizable)
- Overbought threshold: 70 (customizable)
- Used as a confirmation tool rather than primary signal generator
## Signal Generation Logic
### Buy Signal Requirements
1. Price must cross above 820 EMA (PRIMARY CONDITION)
2. Current price must be above 320 EMA (CONFIRMATION)
3. RSI must be above 30 but below 70 (MOMENTUM CHECK)
4. Volume must be 1.5x above 20-period average (STRENGTH VALIDATION)
### Sell Signal Requirements
1. Price must cross below 820 EMA (PRIMARY CONDITION)
2. Current price must be below 320 EMA (CONFIRMATION)
3. RSI must be above 30 but below 70 (MOMENTUM CHECK)
4. Volume must be 1.5x above 20-period average (STRENGTH VALIDATION)
## Risk Management Integration
The script automatically calculates key risk levels based on volatility:
1. **Stop Loss Calculation**:
- Default: 2% below entry for buys
- Dynamically adjusted based on price point
- Can be modified through input parameters
2. **Take Profit Targets**:
- Primary target: 6% above entry (3:1 reward-risk ratio)
- Based on historical tech stock movement patterns
- Adjustable through input parameters
## Multi-Symbol Implementation
The scanner monitors 6 symbols simultaneously using:
- Separate security calls for each data point
- Optimized data requests to prevent overload
- Individual signal processing for each symbol
- Synchronized alert generation system
## Technical Implementation Details
1. **Data Processing**:
```
- Security data requests on 10-minute timeframe
- Individual EMA calculations per symbol
- Separate volume analysis threads
- RSI calculations with standard deviation normalization
```
2. **Signal Processing**:
```
- Cross-verification of all conditions
- Time-based signal validation
- Volume surge confirmation
- Trend alignment check
```
3. **Alert System**:
```
- Bar-close confirmation required
- Multi-condition validation
- Detailed price level inclusion
- Risk parameter integration
```
## Optimization Features
1. **Memory Usage**:
- Optimized security calls
- Efficient data structure
- Reduced redundant calculations
2. **Processing Efficiency**:
- Single-pass data analysis
- Combined indicator calculations
- Streamlined alert generation
## Practical Application
The system is designed for:
1. Swing Trading (primary use)
2. Position Trading (secondary use)
3. Technical Breakout Trading
Optimal timeframes:
- Primary: 4H charts
- Secondary: Daily charts
- Verification: 1H charts
## Default Configuration
The scanner is preset to monitor key tech stocks:
- TSLA: High-volatility tech leader
- NVDA: Semiconductor sector benchmark
- AVGO: Stable tech infrastructure
- TSM: Global chip manufacturer
- META: Social media sector leader
- AMZN: E-commerce/Cloud computing leader
Each symbol can be modified through input parameters.
## Version Information
- Current Version: 1.3
- Last Updated: November 2024
- Compatibility: TradingView Pro/Pro+/Premium
## Limitations & Considerations
- Limited to 6 symbols due to TradingView security request limits
- Requires consistent market volume for optimal performance
- Best suited for liquid stocks with significant daily volume
- May need parameter adjustments during extreme market conditions

MERCURY by DrAbhiramSivprasad"MERCURY by DrAbhiramSivprasad"
Developed from over 10 years of personal trading experience, the Mercury Indicator is a strategic tool designed to enhance accuracy in trading decisions. Think of it as a guiding light—a supportive tool that helps traders refine and build more robust strategies by integrating multiple powerful elements into a single indicator. I’ll be sharing some examples to illustrate how I use this indicator in my own trading journey, highlighting its potential to improve strategy accuracy.
Reason behind the combination of emas , cpr and vwap is it provides very good support and resistance in my trading carrier so now i brought them together in one plate
How It Works:
Mercury combines three essential elements—EMA, VWAP, and CPR—each of which plays a vital role in detecting support and resistance:
Exponential Moving Averages (EMAs): Known for their strength in providing dynamic support and resistance levels, EMAs help in identifying trends and shifts in momentum. This indicator includes a dashboard with up to nine customizable EMAs, showing whether each is acting as support or resistance based on real-time price movement.
Volume Weighted Average Price (VWAP): VWAP also provides valuable support and resistance, often regarded as a fair price level by institutional traders. Paired with EMAs, it forms a dual-layered support/resistance system, adding an additional level of confirmation.
Central Pivot Range (CPR): By combining CPR with EMAs and VWAP, Mercury highlights “traffic blocks” in your target journey. This means it identifies zones where price is likely to stall or reverse, providing additional guidance for navigating entries and exits.
Why This Combination Matters:
Using these three tools together gives you a more complete view of the market. VWAP and EMAs offer dynamic trend direction and support/resistance, while CPR pinpoints critical price zones. This combination helps you find high-probability trades, adding clarity to complex market situations and enabling stronger confirmation on trend or reversal decisions.
How to Use:
Trend Confirmation: Check if all EMAs are aligned (green for uptrend, red for downtrend), which is visible in the EMA dashboard. An alignment across VWAP, CPR, and EMAs signifies high confidence in trend direction.
Breakouts & Breakdowns: Mercury has an alert system to signal when a price breakout or breakdown occurs across VWAP, EMA1, and EMA2. This can help in spotting strong directional moves.
Example Application: In my trading, I use Mercury to identify support/resistance zones, confirming trends with EMA/VWAP alignment and using CPR as a checkpoint. I find this especially useful for day trading and swing setups.
Recommended Timeframes:
Day Trading: 5 to 15-minute charts for swift, actionable insights.
Swing Trading: 1-hour or 4-hour charts for broader trend analysis.
Note:
The Mercury Indicator should be used as a supportive tool rather than a standalone strategy, guiding you toward informed decisions in line with your trading style and goals.
EXAMPLE OF TRADE
you can see the cart of XAUUSD on 11th nov 2024
1.SHORT POSITION - TIME FRAME 15 MIN
So here for a short position you need to wait for a breakdown candle which will print in orange post the candle you need to check ema dashboard is completly red that indicates no traffic blocks in your journey to destiny target from ema's and you can take the target from nearest cpr support line
TAKEN IN XAUUSD you can see in chart of XAUUSD on 7th nov
2.LONG POSITION - TIME FRAME 15 MIN -
So here for long position you need to wait for a breakout candle from indicator thats here is blue and check all ema boxes are green and candle body should close above all the 3 lines here it is the both ema 1 and 2 and the vwap line then you can take and entry and your target will be the nearest resistance from the daily cpr
3. STOP LOSS CRITERIA
After the entry any candle close below any of the last line from entry for example we have 3 lines vwap and ema 1 and 2 lines and u have made an entry and the last line before the entry is vwap then if any candle closes below vwap can be considered as stoploss like wise in any lines
The MERCURY indicator is a comprehensive trading tool designed to enhance traders' ability to identify trends, breakouts, and reversals effectively. Created by Dr. Abhiram Sivprasad, this indicator integrates several technical elements, including Central Pivot Range (CPR), EMA crossovers, VWAP levels, and a table-based EMA dashboard, to offer a holistic trading view.
Core Components and Functionality:
Central Pivot Range (CPR):
The CPR in MERCURY provides a central pivot level along with Below Central (BC) and Top Central (TC) pivots. These levels act as potential support and resistance, useful for identifying reversal points and zones where price may consolidate.
Exponential Moving Averages (EMAs):
MERCURY includes up to nine EMAs, with a customizable EMA crossover alert system. This feature enables traders to see shifts in trend direction, especially when shorter EMAs cross longer ones.
VWAP (Volume-Weighted Average Price):
VWAP is incorporated as a dynamic support/resistance level and, combined with EMA crossovers, helps refine entry and exit points for higher probability trades.
Breakout and Breakdown Alerts:
MERCURY monitors conditions for upside and downside breakouts. For an upside breakout, all EMAs turn green and a candle closes above VWAP, EMA1, and EMA2. Similarly, all EMAs turning red, combined with a close below VWAP and EMA1/EMA2, signals a downside breakdown. Continuous alerts are available until the trend shifts.
Real-Time EMA Dashboard:
A table displays each EMA’s relative position (Above or Below), helping traders quickly gauge trend direction. Colors in the table adjust to long/short conditions based on EMA alignment.
Usage Recommendations:
Trend Confirmation:
Use the CPR, EMA alignments, and VWAP to confirm uptrends and downtrends. The table highlights trends, making it easy to spot long or short setups at a glance.
Breakout and Breakdown Alerts:
The alert system is customizable for continuous notifications on critical price levels. When all EMAs align in one direction (green for long, red for short) and the close is above or below VWAP and key EMAs, the indicator confirms a breakout/breakdown.
Adaptable for Different Styles:
Day Trading: Traders can set shorter EMAs for quick insights.
Swing Trading: Longer EMAs combined with CPR offer insights into sustained trends.
Recommended Settings:
Timeframes: MERCURY is suitable for timeframes as low as 5 minutes for intraday traders, up to daily charts for trend analysis.
Symbols: Works across forex, stocks, and crypto. Adjust EMA lengths for asset volatility.
Example Strategy:
Long Entry: When the price crosses above CPR and closes above both EMA1 and EMA2.
Short Entry: When the price falls below CPR with a close below both EMA1 and EMA2.

Silen's EMA AreasAre you tired of reading candles? 🧨 Do you want to bring more meaning to your chart? 🧹
Then this is the script for you!
This script does:
- Add several meaningfully pre-configured EMA lines to your chart - up to EMA 300
- Colors the areas between EMA lines in 3d colors - green and red
- The Smaller the EMA, the firmer the color
- Highlights the EMA 300 in a golden color
What is the meaning of this?
Let me introduce a new word to you: EMA FOLDING .
Yes, you heard right. With this indicator you can see in 3D how EMA lines are folding above and below each other, indicating severe mood swings in the chart.
This helps you keep track of what your instrument is actually doing while it enables you to cancel out the noise and messyness of ordinary candles which can be quite random and hard to read.
Once an EMA is fully positive or negatively folded (all ema lines are green and above each other from largest EMA to smallest EMA and vice versa for negatively folded) you can be sure that you are in a Trend or certain mood (for higher timeframes, from 15mins on).
I don't ever want to read any chart without having this indicator on. Whenever I present charts to anybody I use this indicator - and the feedback is insanely positive. People tend to read and understand charts much better with this indicator than just staring at candles.
Why is this indicator different to other EMA indicators and should thereby not be deleted by the TradingView Team due to redundance with other EMA indicators?
- This is not a simple indicator for EMAs
- Rather, this is an indicator to better and easier read the whole chart
- You can detect mood swings very easily which is very hard to do with a normal EMA indicator
- I haven't found any EMA indicator on TradingView that does this job so i sincerely believe it is extremely unique
- I sincerely believe it can help people get a much better understanding of charts without actualy getting into details of EMA's or even needing to know what an EMA is.
This indicator isn't intended for trading purposes, rather it is intended to give you a better and easier understanding of the chart. Of course - you can also use it for your trading but like I said, that is not the primary intended purpose.
This indicator comes pre-configured with quite optimal values (in my opinion) but of course can be fully customized. 🧮
Test it for yourself!
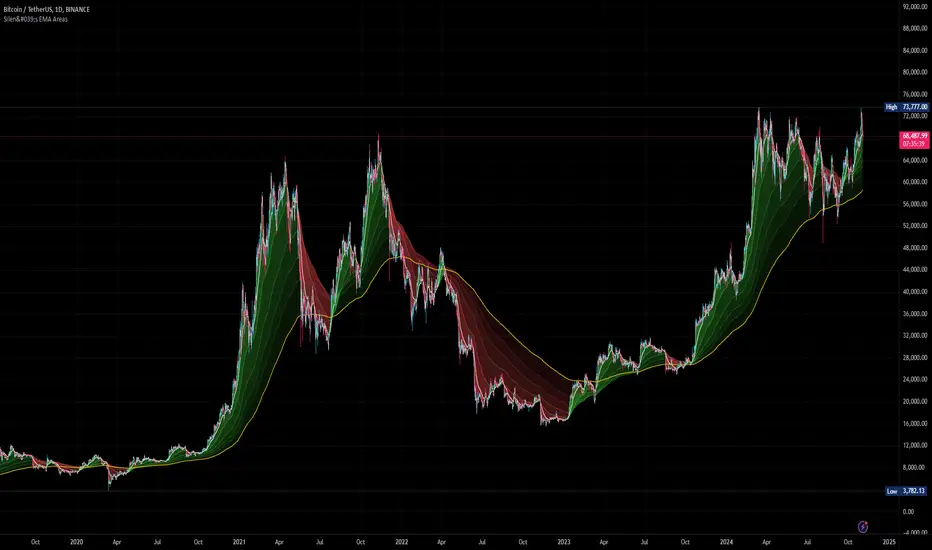
Rounded Grid Levels🟩 Rounded Grid Levels is a visual tool that helps traders quickly identify key psychological price levels on any chart. By dynamically adapting to the user's visible screen area, it provides consistent, easy-to-read round number grids that align with price action. The indicator offers a traditional visualization of horizontal round level grids, along with enhanced options such as tilted grids that align with market sentiment, and fan-shaped grids for alternative price interaction views. It serves purely as a visual aid, providing an adaptable way to observe rounded price levels without making predictions or generating trading signals.
⚡ OVERVIEW ⚡
The Rounded Grid Levels indicator is a visual tool designed to help traders identify and track price levels that may hold psychological significance, such as round numbers or significant milestones. These levels often serve as potential areas for price reactions, including support, resistance, or points of market interest. The indicator's gridlines are determined by user-defined settings and adjust dynamically based on the visible chart area, meaning they are influenced by the user's current zoom level and perspective. This behavior is similar to TradingView's built-in grid lines found in the chart settings canvas, which also adjust in real-time based on the visible screen, ensuring the most relevant price levels are displayed. By default, the indicator provides consistent gridlines to represent traditional round number levels, offering a straightforward view of key psychological areas. Additionally, users have access to experimental and novel configurations, such as fan-shaped layouts, which expand from a central point and adapt directionally based on user settings. This configuration can provide an alternate perspective for traders, especially useful in analyzing broader market moves and visualizing expansion relative to the current price.
Users can display the gridlines in a variety of configurations, including horizontal, neutral, auto, or fan-shaped layouts, depending on their preferred method of analysis. This flexibility allows traders to focus on different types of price action without overcrowding the visual representation of price movements.
This indicator is intended purely as a visual aid for understanding how price interacts with rounded levels over time. It does not generate predictive trading signals or recommendations but rather provides traders with a customizable framework to enhance their market analysis.
⭕ ROUND NUMBERS IN MARKET PSYCHOLOGY ⭕
Round numbers hold a significant place in financial markets, largely due to the psychological tendencies of traders and investors. These levels often represent areas of interest where human behavior, market biases, and trading strategies converge. Whether it's prices ending in 000, 500, or other recognizable values, these levels naturally attract more attention and influence decision-making.
Round numbers can act as key support or resistance levels and often become focal points in market activity. They are frequently highlighted by financial media, embedded in products like options, and serve as foundations for various trading theories. Their impact extends across different market participants and strategies, making them important focal points in both short-term and long-term market analysis.
Round numbers play an important role in guiding trader behavior and market activity. To better understand why these levels are so impactful, there are several key factors that highlight their significance in trading and price dynamics:
Psychological Impact : Humans naturally gravitate toward round numbers, such as prices ending in 000, 500, or 00. These levels tend to draw attention as traders perceive them as psychologically significant. This behavior is rooted in the cognitive bias known as "left-digit bias," where people assign greater importance to rounded, more recognizable numbers. In trading, this means that prices at these levels are more memorable and thus more likely to attract attention, creating an area where traders focus their buying or selling decisions.
Order Clustering : Traders often place buy and sell orders around these rounded levels, either manually or automatically through stop and limit orders. This clustering leads to the formation of visible support or resistance zones, as the concentrated orders tend to influence price behavior around these key levels. Market participants tend to converge their orders around these price points because of their perceived psychological importance, creating a liquidity pocket. As a result, these areas often act as barriers that the price either struggles to cross or uses as springboards for further movement.
External Influences : Financial media frequently highlights round-number milestones, amplifying market sentiment and drawing traders' attention to these levels. Additionally, algorithmic trading systems often react to round-number thresholds, which can further reinforce price movements, creating self-reinforcing reactions at these levels. As media and analysts emphasize these milestones, more traders pay attention to them, leading to increased volume and often heightened volatility at those points. This self-reinforcing cycle makes round numbers an area where price movement can either accelerate due to a breakout or stall because of clustering interest.
Option Strike Prices : Options contracts typically have strike prices set at round numbers, and as expiration approaches, these levels can influence the price of the underlying asset due to concentrated trading activity. The behavior around these levels, often called "pinning," happens because traders adjust their positions to avoid unfavorable scenarios at these key strikes. This activity tends to concentrate price movement toward these levels as traders hedge their positions, leading to increased liquidity and the potential for abrupt price reactions near option expiration dates.
Whole Number Theory : This theory suggests that whole numbers act as natural psychological barriers, where traders tend to make decisions, place orders, or expect price reactions, making these levels crucial for analysis. Whole numbers are simple to remember and are often used as informal targets for profit-taking or stop placement. This behavior leads to a natural ebb and flow around these levels, where the market finds equilibrium temporarily before deciding on a future direction. Whole numbers tend to work like magnets, drawing price to them and often creating reactions that are visible across different timeframes.
Quarters Theory : Commonly used in Forex markets, this theory focuses on quarter-point increments (e.g., 1.0000, 1.2500, 1.5000) as key levels where price often pauses or reverses. These quarter levels are treated as important psychological barriers, with price frequently interacting at these intervals. Traders use these points to gauge market strength or weakness because quarter levels divide larger round-number ranges into more manageable and meaningful segments. For example, in highly traded forex pairs like EUR/USD, traders might treat 1.2500 as a significant barrier because it represents a halfway point between 1.0000 and 1.5000, offering a balanced reference point for decision-making.
Big Round Numbers : Major round numbers, such as 100, 500, or 1000, often attract significant attention and serve as psychological thresholds. Traders anticipate strong reactions when prices approach or cross these levels. This is often because large round numbers symbolize major milestones, and price behavior around them tends to signal important market sentiment shifts. When price crosses a major level, such as a stock moving above $100 or Bitcoin crossing $50,000, it often creates a surge in trading activity as it is viewed as a validation or invalidation of market trends, drawing in momentum traders and triggering both retail and institutional responses.
By visualizing these round levels on the chart, the Rounded Grid Levels indicator helps traders identify areas where price may pause, reverse, or gain momentum. While round numbers provide useful insights, they should be used in conjunction with other technical analysis tools for a comprehensive trading strategy.
🛠️ CONFIGURATION AND SETTINGS 🛠️
The Rounded Grid Levels indicator offers a variety of configurable settings to tailor the visualization according to individual trader preferences. Below are the key settings available for customization:
Custom Settings
Rounding Step : The Rounding Step parameter sets the minimum interval between gridlines. This value determines how closely spaced the rounded levels are on the chart. For example, if the Rounding Step is set to 100, gridlines will be displayed at every 100 points (e.g., $100, $200, $300) relative to the current price level. The Rounding Step is scaled to the chart's visible area, meaning users should adjust it appropriately for different assets to ensure effective visualization. Lower values provide a more granular view, while larger values give a broader, higher-level perspective.
Major Grids : Defines the interval at which major gridlines will appear compared to minor ones. For example, if the Rounding Step is 100 and Major Grids is set to 10, major gridlines will be displayed every $1,000, while minor gridlines will be at every $100. This distinction allows traders to better visualize key psychological levels by emphasizing significant price intervals.
Direction : Users can select the gridline direction, choosing between options such as 'Up', 'Down', 'Auto', or 'Neutral'. This setting controls how the gridlines extend relative to the current price level, which can help in analyzing directional trends.
Neutral Direction : This option provides balanced gridlines both above and below the current price, allowing traders to visualize support and resistance levels symmetrically. This is useful for analyzing sideways or ranging markets without directional bias.
Up Direction : The gridlines are tilted upwards, starting from visible lows and extending toward the rounded level at the current price. By choosing Up , traders emphasize an upward sentiment, visualizing price action that aligns with rising trends. This option helps illustrate potential areas where pullbacks may occur, as well as how price might expand upwards in the current market context.
Down Direction : The gridlines are tilted downwards, starting from visible highs and extending toward the rounded level at the current price. Selecting Down allows traders to emphasize a downward sentiment, visualizing how price may expand downwards, which is particularly useful when analyzing downtrends or potential correction levels. The gridlines provide an illustrative view of how price interacts with lower levels during market declines.
Auto Direction : The gridlines automatically adjust their direction based on recent market trends. This adaptive option allows traders to visualize gridlines that dynamically change according to price action, making it suitable for evolving market conditions where the direction is uncertain. It’s useful for traders looking for an indicator that moves in sync with market shifts and doesn’t require manual adjustment.
Grid Type : Allows users to choose between 'Linear' or 'Fan' grid types. The Linear type creates evenly spaced gridlines that can be either horizontal or tilted, depending on the chosen direction setting, providing a straightforward view of price levels. The Fan type radiates lines from a central point, offering a more dynamic perspective for analyzing price expansions relative to the current price. These grid types introduce experimental visualizations influenced by chart properties, including visible highs, lows, and the current price. Regardless of the configuration, the gridlines will always end at the current bar, which represents a rounded price level, ensuring consistency in how key price areas are displayed.
Extend : This setting allows gridlines to be projected into the future, helping traders see potential levels beyond the current bar. When enabled, the behavior of the extended lines varies based on the selected grid type and direction. For Neutral and Horizontal Linear settings, the extended gridlines maintain their round-number alignment indefinitely. However, for Up , Down , or Auto directions, the angle of the extended gridlines can change dynamically based on the chart’s visible high and low or the latest price action. As a result, extended lines may not continue to align with round-number levels beyond the current bar, reflecting instead the current trend and sentiment of the market. Regardless of direction, extended gridlines remain consistently spaced and either parallel or evenly distributed, ensuring a structured visual representation.
Color Settings : Users can customize the colors for resistance, support, and minor gridlines at the current price. This helps in visually distinguishing between different grid types and their significance on the chart.
Color Options
These configuration options make the Rounded Grid Levels indicator a versatile tool for traders looking to customize their charts based on their personal trading strategies and analytical preferences.
🖼️ CHART EXAMPLES 🖼️
The following chart examples illustrate different configurations available in the Rounded Grid Levels indicator. These examples show how variations in grid type, direction, and rounding step settings impact the visualization of price levels. Traders may find that smaller rounding steps are more effective on lower time frames, where precision is key, whereas larger rounding steps help to reduce clutter and highlight key levels on higher time frames. Each image includes a caption to explain the specific configuration used, helping users better understand how to apply these settings in different market conditions.
Smaller Rounding Step (100) : With a smaller rounding step, the gridlines are spaced closely together. This setting is particularly useful for lower time frames where price action is more granular and finer details are needed. It allows traders to track price interactions at narrower levels, but on higher time frames, it may lead to clutter and exceed Pine Script's 500-line limit.
Larger Rounding Step (1000) : With a larger rounding step, the gridlines are spaced farther apart. This visualization is better suited for higher time frames or broader market overviews, allowing users to focus on major psychological levels without overloading the chart. On lower time frames, this may result in fewer actionable levels, but it helps in maintaining clarity and staying within Pine Script's line limit.
Linear Grid Type, Neutral Direction (Traditional Rounded Price Levels) : The Linear gridlines are displayed in a neutral fashion, representing traditional round-number levels with consistent spacing above and below the current price. This layout helps visualize key psychological price levels over time in a straightforward manner.
Linear Grid Type, Down Direction : The Linear gridlines are tilted downwards, remaining parallel and ending at the rounded level at the current price. This setup emphasizes downward market sentiment, allowing traders to visualize price expansion towards lower levels, which is useful when analyzing downtrends or potential correction levels.
Linear Grid Type, Down Direction : The Linear gridlines are tilted downwards, extending from the current price to lower levels. Useful for observing downtrending price movements and visualizing pullback areas during uptrends.
Linear Grid Type, Auto Direction : The Linear gridlines adjust dynamically, tilting either upwards or downwards to align with recent price trends, remaining parallel and ending at the rounded level at the current price. This configuration reflects the current market sentiment and offers traders a flexible way to observe price dynamics as they develop in real time.
Fan Grid Type, Neutral Direction : The fan-shaped gridlines radiate symmetrically from a central point, ending at the rounded level at the current price. This configuration provides an unbiased view of price action, giving traders a balanced visualization of rounded levels without directional influence.
Fan Grid Type, Up Direction : The fan-shaped gridlines originate from lower visible price points and radiate upwards, ending at the rounded level at the current price. This layout helps visualize potential price expansion to higher levels, offering insights into upward momentum while maintaining a dynamic and evolving perspective on market conditions.
Fan Grid Type, Down Direction : The fan-shaped gridlines originate from higher visible price points and radiate downwards, ending at the rounded level at the current price. This setup is particularly useful for observing potential price expansion towards lower levels, illustrating areas where the price might extend during a downtrend.
Fan Grid Type, Auto Direction : The fan-shaped gridlines dynamically adjust, originating from visible chart points based on the current market trend, and radiate outward, ending at the rounded level at the current price. This adaptive visualization offers a continuously evolving representation that aligns with changing market sentiment, helping traders assess price expansion dynamically.
📊 SUMMARY 📊
The Rounded Grid Levels indicator helps traders highlight important round-number price levels on their charts, providing a dynamic way to visualize these psychological areas. With customizable gridline options—including traditional, tilted, and fan-shaped styles—users can adapt the indicator to suit their analysis needs. The gridlines adjust with chart zoom or scale, offering a flexible tool for observing price action, without providing specific trading signals or predictions.
⚙️ COMPATIBILITY AND LIMITATIONS ⚙️
Asset Compatibility :
The Rounded Grid Levels indicator is compatible with all asset classes, including cryptocurrencies, forex, stocks, and commodities. Users should adjust both the Rounding Step and the Major Grid settings to ensure the correct scale is used for the specific asset. This adjustment ensures that the most relevant round price levels are displayed effectively regardless of the instrument being analyzed. For instance, when analyzing BTCUSD, a higher Rounding Step may be needed compared to forex pairs like EURUSD, and the Major Grid value should also be adjusted to appropriately emphasize significant levels.
Line Limitations in Pine Script :
The Rounded Grid Levels indicator is subject to Pine Script's 500-line limit. This means that it cannot draw more than 500 gridlines on the chart at any given time. The number of gridlines depends directly on the chosen Rounding Step . If the steps are too small, the gridlines will be spaced too closely, causing the indicator to quickly reach the line limit. For example, if Ethereum is trading around $2,500, a Rounding Step of 100 might be appropriate, but a step of 1.00 would create too many gridlines, exceeding Pine Script's limit. Users should consider appropriate settings to avoid running into this constraint.
Runtime Error Considerations
When using the Rounded Grid Levels indicator, users might encounter a runtime error in specific scenarios. This typically happens if the Rounding Step is set too small, causing the indicator to exceed Pine Script's line limit or take too long to process. This can often occur when switching between charts that have significantly different price ranges. Since the Rounding Step requires flexibility to work with a wide variety of assets—ranging from decimals to thousands—it is not practically limited within the script itself. If a runtime error occurs, the recommended solution is to increase the Rounding Step to a larger value that better matches the current asset's price range.
Runtime Error: If the Rounding Step is too small for the current asset or chart, the indicator may generate a runtime error. Users should increase the Rounding Step to ensure proper visualization.
⚠️ DISCLAIMER ⚠️
The Rounded Grid Levels indicator is not designed as a predictive tool. While it extends gridlines into the future, this extension is purely for visual continuity and does not imply any forecast of future price movements. The primary function of this indicator is to help users visualize significant round number price levels.
The gridlines adjust dynamically based on the visible chart range, ensuring that the most relevant round price levels are displayed. This behavior allows the indicator to adapt to your current view of the market, but it should not be used to predict price movements. The indicator is intended as a visual aid and should be used alongside other tools in a comprehensive market analysis approach.
While gridlines may align with significant price levels in hindsight, they should not be interpreted as indicators of future price movements. Traders are encouraged to adjust settings based on their strategy and market conditions.
🧠 BEYOND THE CODE 🧠
The Rounded Grid Levels indicator, like other xxattaxx indicators , is designed with education and community collaboration in mind. Its open-source nature encourages exploration, experimentation, and the development of new grid calculation indicators, drawings, and strategies. We hope this indicator serves as a framework and a starting point for future innovations in grid trading.
Your comments, suggestions, and discussions are invaluable in shaping the future of this project. We actively encourage your feedback and contributions, which will directly help us refine and improve the Rounded Grid Levels indicator. We look forward to seeing the creative ways in which you use and enhance this tool.

Multi-Average Trend Indicator (MATI)[FibonacciFlux]Multi-Average Trend Indicator (MATI)
Overview
The Multi-Average Trend Indicator (MATI) is a versatile technical analysis tool designed for traders who aim to enhance their market insights and streamline their decision-making processes across various timeframes. By integrating multiple advanced moving averages, this indicator serves as a robust framework for identifying market trends, making it suitable for different trading styles—from scalping to swing trading.
MATI 4-hourly support/resistance
MATI 1-hourly support/resistance
MATI 15 minutes support/resistance
MATI 1 minutes support/resistance
Key Features
1. Diverse Moving Averages
- COVWMA (Coefficient of Variation Weighted Moving Average) :
- Provides insights into price volatility, helping traders identify the strength of trends in fast-moving markets, particularly useful for 1-minute scalping .
- DEMA (Double Exponential Moving Average) :
- Minimizes lag and quickly responds to price changes, making it ideal for capturing short-term price movements during volatile trading sessions .
- EMA (Exponential Moving Average) :
- Focuses on recent price action to indicate the prevailing trend, vital for day traders looking to enter positions based on current momentum.
- KAMA (Kaufman's Adaptive Moving Average) :
- Adapts to market volatility, smoothing out price action and reducing false signals, which is crucial for 4-hour day trading strategies.
- SMA (Simple Moving Average) :
- Provides a foundational view of the market trend, useful for swing traders looking at overall price direction over longer periods.
- VIDYA (Variable Index Dynamic Average) :
- Adjusts based on market conditions, offering a dynamic perspective that can help traders capture emerging trends.
2. Combined Moving Average
- The MATI's combined moving average synthesizes all individual moving averages into a single line, providing a clear and concise summary of market direction. This feature is especially useful for identifying trend continuations or reversals across various timeframes .
3. Dynamic Color Coding
- Each moving average is visually represented with color coding:
- Green indicates bullish conditions, while Red suggests bearish trends.
- This visual feedback allows traders to quickly assess market sentiment, facilitating faster decision-making.
4. Signal Generation and Alerts
- The indicator generates buy signals when the combined moving average crosses above its previous value, indicating a potential upward trend—ideal for quick entries in scalping.
- Conversely, sell signals are triggered when the combined moving average crosses below its previous value, useful for exiting positions or entering short trades.
Insights and Applications
1. Scalping on 1-Minute Charts
- The MATI excels in fast-paced environments, allowing scalpers to identify quick entry and exit points based on short-term trends. With dynamic signals and alerts, traders can react swiftly to price movements, maximizing profit potential in brief price fluctuations.
2. Day Trading on 4-Hour Charts
- For day traders, the MATI provides essential insights into intraday trends. By analyzing the combined moving average and its relation to individual moving averages, traders can make informed decisions on when to enter or exit positions, capitalizing on daily price swings.
3. Swing Trading on Daily Charts
- The MATI also serves as a valuable tool for swing traders. By evaluating longer-term trends through the combined moving average, traders can identify potential swing points and adjust their strategies accordingly. The flexibility of adjusting the lengths of the moving averages allows for tailored approaches based on market volatility.
Benefits
1. Clarity and Insight
- The combination of diverse moving averages offers a clear visual representation of market trends, aiding traders in making informed decisions across multiple timeframes.
2. Flexibility and Customization
- With adjustable parameters, traders can adapt the MATI to their specific strategies, making it suitable for various market conditions and trading styles.
3. Real-Time Alerts and Efficiency
- Built-in alerts minimize response times, allowing traders to capitalize on opportunities as they arise, regardless of their trading style.
Conclusion
The Multi-Average Trend Indicator (MATI) is an essential tool for traders seeking to enhance their technical analysis capabilities. By seamlessly integrating multiple moving averages with dynamic color coding and real-time alerts, this indicator provides a comprehensive approach to understanding market trends. Its versatility makes it an invaluable asset for scalpers, day traders, and swing traders alike.
Important Note
As with any trading tool, thorough analysis and risk management are crucial when using this indicator. Past performance does not guarantee future results, and traders should always be prepared for market fluctuations.

MM Day Trader LevelsAs an intraday trader, there are certain key levels that I care about for short-term price action on every single chart. When I first began day trading, each morning I would painstakingly mark those key levels off on the charts I planned to trade each day. Depending on the number of charts I was watching, this would take up quite a bit of my time that I felt would have been much better spent doing other things. It also meant that those levels would often be left behind, and on later days I might be trading a symbol and get confused when a line appeared and I'd be paying attention to it only to later discover that it wasn't from prior day, but from some other day in the past when I had marked it off.
I looked all over TradingView to find indicators that did this automatically for me, and I found a lot of them. One by one I tried them, and inevitably I would always find that something was wrong with them. Often they didn't have all of the levels I wanted (so I would have to combine multiple indicators), but more often I found that the levels would be incorrect, or they would be buggy and not appear consistently, or they would not appear at the right time, or they would not work on futures! The list of problems went on and on. And the biggest issue I found was that nobody knew how to get session volume profile in an indicator.
So, over the course of a few years I figured out how to solve all of those problems and now I'm thrilled to present this free indicator for everyone like me who trades intraday and wants a clean consistent way to see the prior day levels that they care about automatically on every single chart (even futures). The levels the indicator provides are:
Yesterday High & Low
Value Area High & Low & Point of Control
Today's Open
Yesterday's Close (aka "Settlement" on futures)
Premarket High & Low (non-futures only)
Overnight High & Low (futures only)
These levels are extremely important, and I expect price to be reactive to them, so each level has a shaded background behind it so that the levels stand out against other lines you may have on your chart. I try to keep configuration as simple as possible, but there are configuration options that allow you to:
Hide any of the levels
Change the color for the levels
Shade the value area (or not)
Change the label text, size, type (basic label or plain text) and location (how far to the right of last candle to place the label
Adjust session volume profile value area volume & number of rows
The biggest advantage to this indicator over others on TradingView is how it handles session volume profile. When it comes to futures, TradingView does differentiate between regular trading hours and "electronic" trading hours on the charts, but their timeframes for those sessions are unusual, and they do not provide any programmatic way to differentiate between them. So, I created a whole new library for dealing with futures sessions that is fully integrated into both my Session Volume Profile library and this indicator, allowing me to bring you the best and only custom indicator available on TradingView that provides you with true regular session volume profile information across every type of symbol, including futures.
I'm incredibly proud of everything I've been able to provide with this indicator, and even more thrilled to say that I'm proud of how the indicator has been implemented. Once again releasing this indicator and all associated code for free and open source. I encourage you to take a look at the source code to see how it all works, take advantage of the free underlying libraries I created to make all of this possible: Session Library and Session Volume Profile Library.

Negroni Opening Range StrategyStrategy Summary:
This tool can be used to help identify breakouts from a range during a time-zone of your choosing. It plots a pre-market range, an opening range, it also includes moving average levels that can be used as confluence, as well as plotting previous day SESSION highs and lows.
There are several options on how you wish to close out the trades, all described in more detail below.
Back-testing Inputs:
You define your timezone.
You define how many trades to open on any given day.
You decide to go: long only, short only, or long & short (CAREFUL: "Long & Short" can open trades that effectively closes-out existing ones, for better AND worse!)
You define between which times the strategy will open trades.
You define when it closes any open trades (preventing overnight trades, or leaving trades open into US data times!!).
This hopefully helps make back-testing reflect YOUR trading hours.
NOTE: Renko or Heikin-Ashi charts
For ALL strategies, don’t use Renko or Heikin-Ashi charts unless you know EXACTLY the implications.
Specific to my strategy, using a renko chart can make this 85-90% profitable (I wish it was!!) Although they can be useful, renko charts don’t always capture real wicks, so the renko chart may show your trade up-only but your broker (who is not using renko!!) will have likely stopped you out on a wick somewhere along the line.
NOTE: TradingView ‘Deep backtesting’
For ALL strategies, be cynical of all backtesting (e.g. repainting issues etc) as well as ‘Deep backtesting’ results.
Specific to this strategy, the default settings here SHOULD BE OK, but unfortunately at the time of writing, we can’t see on the chart what exactly ‘deep backtesting’ is calculating. In the past I have noted a number of trades that were not closed at the end of the day, despite my ‘end of day’ trade closing being enabled, so there were big winners and losers that would not have materialized otherwise. As I say, this seems ok at these settings but just always be cynical!!
Opening Range Inputs
You define a pre-market range (example: 08:00 - 09:00).
You define an opening range (example: 09:00 - 09:30).
The strategy will give an update at the close of the opening range to let you know if the opening range has broken out the pre-market range (OR Breakout), or if it has remained inside (OR Inside). The label appears at the end of the opening range NOT at the bar that ‘broke-out’.
This is just a visual cue for you, it has no bearing on what the strategy will do.
The strategy default will trade off the pre-market range, but you can untick this if you prefer to trade off the opening range.
Opening Trades:
Strategy goes long when the bar (CLOSE) crosses-over the ‘pre-market’ high (not the ‘opening range’ high); and the time is within your trading session, and you have not maxed out your number of trades for the day!
Strategy goes short when the bar (CLOSE) crosses-under the ‘pre-market’ low (not the ‘opening range low); and the time is within your trading session, and you have not maxed out your number of trades for the day!
Remember, you can untick this if you prefer to trade off the opening range instead.
NOTES:
Using momentum indicators can help (RSI and MACD): especially to trade range plays in failed breakouts, when momentum shifts… but the strategy won’t do this for you!
Using an anchored vwap at the session open can also provide nice confluence, as well as take-profit levels at the upper/lower of 3x standard deviation.
CLOSING TRADES:
You have 6 take-profit (TP) options:
1) Full TP: uses ATR Multiplier - Full TP at the ATR parameters as defined in inputs.
2) Take Partial profits: ATR Multiplier - Takes partial profits based on parameters as defined in inputs (i.e close 40% of original trade at TP1, close another 40% of original trade at TP2, then the remainder at Full TP as set in option 1.).
3) Full TP: Trailing Stop - Applies a Trailing Stop at the number of points, as defined in inputs.
4) Full TP: MA cross - Takes profit when price crosses ‘Trend MA’ as defined in inputs.
5) Scalp: Points - closes at a set number of points, as defined in inputs.
6) Full TP: PMKT Multiplier - places a SL at opposite pre-market Hi/Low (we go long at a break-out of the pre-market high, 50% would place a SL at the pre-market range mid-point; 100% would place a SL at the pre-market low)'. This takes profit at the input set in option 1).

Daniels Script v2 EMA 4h y DTitle:
"EMA 200 Dynamic Projection on 4H and Daily Charts"
Description:
"This script is designed to provide traders with a comprehensive view of market trends by displaying the 200-period Exponential Moving Average (EMA) on both 4-hour and daily charts simultaneously. Unlike typical EMA representations, this script enhances user decision-making by projecting the potential future path of these EMAs using a dynamic slope calculation.
The dynamic projection feature calculates the slope based on recent changes in the EMA, allowing traders to visualize potential future trends more accurately. This innovative approach helps in identifying potential areas of support and resistance before they are fully formed, offering traders a strategic advantage in planning their entries and exits.
Key Features:
Dual Time Frame Analysis: View 200-period EMAs for both 4-hour and daily charts on a single graph.
Dynamic EMA Projections: Projected using a calculated slope from recent EMA changes, presented as dotted lines for clear distinction.
Enhanced Trend Visualization: Helps in recognizing trend continuations or reversals early, aiding in risk management and decision-making processes.
Usage:
Simply add the script to your chart, and the EMAs along with their projections will automatically be displayed. The 4-hour EMA is shown in green, while the daily EMA is in red. Projections extend from the last known data point, providing a visual guide to potential future movements.
This script is unique in its approach to combining real-time EMA analysis with predictive modeling, making it a valuable tool for traders looking to enhance their technical analysis capabilities."
## SPANISH
Título del Script:
"Proyección Dinámica de la EMA 200 en Gráficos de 4H y Diarios"
Descripción del Script:
"Este script está diseñado para proporcionar a los traders una visión integral de las tendencias del mercado al mostrar la Media Móvil Exponencial (EMA) de 200 periodos tanto en los gráficos de 4 horas como diarios simultáneamente. A diferencia de las representaciones típicas de la EMA, este script mejora la toma de decisiones del usuario al proyectar el posible camino futuro de estas EMAs utilizando un cálculo de pendiente dinámico.
La función de proyección dinámica calcula la pendiente basada en cambios recientes en la EMA, permitiendo a los traders visualizar tendencias futuras potenciales con mayor precisión. Este enfoque innovador ayuda a identificar áreas potenciales de soporte y resistencia antes de que se formen completamente, ofreciendo a los traders una ventaja estratégica en la planificación de sus entradas y salidas.
Características Clave:
Análisis de Doble Marco Temporal: Visualiza las EMAs de 200 periodos para los gráficos de 4 horas y diarios en un solo gráfico.
Proyecciones Dinámicas de la EMA: Proyectadas utilizando una pendiente calculada a partir de cambios recientes en la EMA, presentadas como líneas punteadas para una clara distinción.
Visualización Mejorada de Tendencias: Ayuda en el reconocimiento temprano de continuaciones o reversos de tendencias, asistiendo en la gestión de riesgos y en los procesos de toma de decisiones.
Uso:
Simplemente añade el script a tu gráfico, y las EMAs junto con sus proyecciones se mostrarán automáticamente. La EMA de 4 horas se muestra en verde, mientras que la EMA diaria está en rojo. Las proyecciones se extienden desde el último punto de datos conocido, proporcionando una guía visual hacia movimientos futuros potenciales.
Este script es único en su enfoque de combinar análisis de EMA en tiempo real con modelado predictivo, convirtiéndolo en una herramienta valiosa para traders que buscan mejorar sus capacidades de análisis técnico."
