Weekly Power 3Did you know there is a simple line you can place on your chart to immediately make the weeks price action more understandable? Its called the Weekly Open Line. And its the opening price of the trading week. It was created by The Inner Circle Trader (ICT) and incorporates another one of his concepts called Power 3.
The Weekly Power 3 indicator takes the idea of the Weekly Open Line and builds a suite of intelligent and dynamic tools around it that will immediately help the user to start understanding how price moves within the trading week context.
Features
Static Weekly Open Line
Intelligent Days of the Week Text
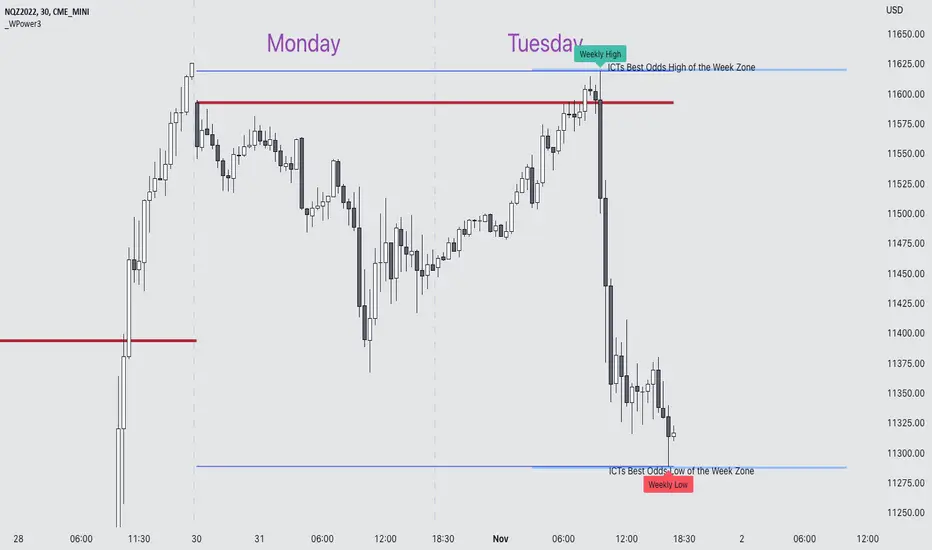
Dynamic Weekly High Line
Dynamic Weekly Low Line
Weekly High Candle Label (highest candle of the week)
Weekly Low Candle Label (lowest candle of the week)
Best Odds High of the Week Zone Line & Text
Best Odds Low of the Week Zone Line & Text
Components
The primary feature is a line that forms on the weekly open price and grows as the week progresses. Additionally, lines are created for the highest and lowest prices of the week so the weekly profile can be easily recognized. A dynamic label marks each weeks highest and lowest point. This will automatically move as prices expand throughout the week.
A very useful component of the Weekly Power 3 indicator is the Days of the Week text. Each Day of the Week text is displayed in the middle of each trading day and also the user can specify in the Settings whether to position the text at the high or low of the weeks price range. Additionally, there is a Buffer setting that allows the user to move the Days of the Week text up or down to prevent chart overlapping.
To help the user visualize the span of time with the best odds of forming the weekly highs or weekly lows, according to ICT, this indicator adds at static line and optional label into the charts future that projects the span from Tuesday’s London Open to Wednesday’s New York. Having a static line out in the future on your chart really helps to picture where price could be drawn to based solely around time of the week.
Premise
ICT says that the weekly open price is the most important level that price reacts to across the five days of a trading week. If the week profile is expected to be bullish then price many times goes below the weekly open line at the beginning of the week and above it later in the week (a.k.a Bullish Power 3). Consequently, if the week is anticipated to be a bearish week, price often times starts the week high and then goes lower throughout the week (a.k.a Bearish Power 3).
ICT always specifies that the weekly high or weekly low have the best odds of forming between the Tuesday’s London Open and Wednesday’s New York Open.
Inputs and Style
Like all scripts publish by Infinity Trading, everything in the indicator is customizable by the user. Every label, line, or text can be individually toggled ON or OFF so the user has complete control over the elements they want displayed on their chart. All of the lines can be individually adjusted by color, line style, or line width. The color and text color on the high and low of the week labels can be individually changed. The text in the chart (day of the week & best odds zones text) each have a “buffer” value. This allows the user to individually move the text up or down on the chart to declutter the chart. And lastly, the day of the week text can be positioned above or below the weeks price action and the text will dynamically move higher or lower as price expands throughout the week.
Previous weeks have all of the Weekly Power 3 markups so it's easy to study past price action and identify trends.
Gallery
View the weeks price action
View multiple weeks price action
Visualize future price action
Cari skrip untuk "chart"
Zig Zag+ (Macro + Internal Structure Tool)ZigZag+ (Macro + Internal Structure Tool)
ZigZag+ is a simple tool that helps traders to clearly identify and differentiate between macro and internal market structure, to help you keep your bearings of where you are currently in the overall picture.
It is especially difficult to keep your bearings within the larger structural trend when trading the lower timeframes, where for example, a bearish structural trend on a lower timeframe may simply be a retracement of an overall bullish structural trend on a higher timeframe. This indicator primarily aims to help traders maintain awareness of where they are in relationship to the higher timeframe / 'macro' structural trend, and their most significant swing point highs and lows.
The features of this indicator include:
- 2x Zig Zag lines drawn automatically onto your chart. One which has a longer length than the other, which can be used to help identify and differentiate the larger price swings from the smaller price swings found within it. Enabled by default.
- Customisable Zig Zag line color & width settings to help clearly differentiate the higher timeframe 'macro structure' apart from the lower timeframe 'internal structure' within it, enabling it to be tailored to suit your chart colour theme and personal preference.
- Customisable individual length settings for the 2x Zig Zag lines, to allow the fine tuning of each line to any timeframe and asset. By default one lines length is set to a higher value than the other, to illustrate a macro structure (higher length value) as well as the 'internal structure' (lower value length), seen within the larger macro structure.
- Up to a maximum of 500 lines can be drawn meaning you can zoom out considerably, and view historical price action with both Zig Zag lines continuing to print.
- Custom alerts for identifying candlesticks that can offer optimal entries where they are found within valid price markups or markdowns that are already underway. Further details can be found within the tooltips for these signals.
Note: The above list of features are accurate at the time of publishing, but may be updated or added to in future.
Structure
Understanding structure is arguably the foundation of all trading strategies, and therefore very important to understand where you are exactly in the bigger picture, since it can help identify levels at which there is a higher probability of price moving either upward or downward at a given point. Structural trend refers to the typical way that price tends to move in any given trending market, identified by the continuation of higher highs and higher lows in a typical bullish trending market, and lower highs and lower lows in a bearish trending market.
During other times price may not be trending in this way, for example when it is undergoing accumulation or distribution phases, where the consistent higher high & lower low / lower high and lower low patterns will not be evident.
What is Macro Structure?
Macro trend structure refers to the structural trend seen on higher timeframe charts.
What is Internal Structure?
Internal trend structure refers to the structural trend seen on lower timeframe charts, which is found within the higher timeframe structure.
Disclaimer: This indicator is adapted from an original script authored by Tr0sT . With special thanks.

Penny Stock Short Signal Pro# Penny Stock Short Signal Pro (PSSP) v1.0
## Complete User Guide & Documentation
---
# 📋 TABLE OF CONTENTS
1. (#introduction)
2. (#why-short-penny-stocks)
3. (#the-7-core-detection-systems)
4. (#installation--setup)
5. (#understanding-the-dashboard)
6. (#input-settings-deep-dive)
7. (#visual-elements-explained)
8. (#alert-configuration)
9. (#trading-strategies)
10. (#risk-management)
11. (#best-practices)
12. (#troubleshooting)
13. (#changelog)
---
# Introduction
**Penny Stock Short Signal Pro (PSSP)** is a comprehensive Pine Script v6 indicator specifically engineered for identifying high-probability short-selling opportunities on low-priced, high-volatility stocks. Unlike generic indicators that apply broad technical analysis, PSSP is purpose-built for the unique characteristics of penny stock price action—where parabolic moves, retail FOMO, and violent reversals create predictable patterns for prepared traders.
## Key Features
- **7 Independent Detection Systems** working in concert to identify exhaustion points
- **Composite Signal Engine** that requires multiple confirmations before triggering
- **Real-Time Dashboard** displaying all signal states and market metrics
- **Automatic Risk Management** with dynamic stop-loss and profit target calculations
- **Customizable Sensitivity** for different trading styles (scalping vs. swing)
- **Built-in Alert System** for all major signal types
## Who Is This For?
- **Active Day Traders** looking to capitalize on intraday reversals
- **Short Sellers** who specialize in penny stocks and small caps
- **Momentum Traders** who want to identify when momentum is exhausting
- **Risk-Conscious Traders** who need clear entry/exit levels
---
# Why Short Penny Stocks?
## The Penny Stock Lifecycle
Penny stocks follow a remarkably predictable lifecycle that creates shorting opportunities:
```
PHASE 1: ACCUMULATION
└── Low volume, tight range
└── Smart money quietly building positions
PHASE 2: MARKUP / PROMOTION
└── News catalyst or promotional campaign
└── Volume increases, price begins rising
└── Early momentum traders enter
PHASE 3: DISTRIBUTION (YOUR OPPORTUNITY)
└── Parabolic move attracts retail FOMO buyers
└── Smart money selling into strength
└── Volume climax signals exhaustion
└── ⚠️ PSSP SIGNALS FIRE HERE ⚠️
PHASE 4: DECLINE
└── Support breaks, panic selling
└── Price returns toward origin
└── Short sellers profit
```
## Why Shorts Work on Penny Stocks
1. **No Fundamental Support**: Most penny stocks have no earnings, revenue, or assets to justify elevated prices
2. **Promotional Nature**: Many rallies are driven by promoters who will eventually stop
3. **Retail Exhaustion**: Retail buying power is finite—when it's exhausted, gravity takes over
4. **Float Dynamics**: Low float stocks move fast in both directions
5. **Technical Levels Matter**: VWAP, round numbers, and prior highs become self-fulfilling resistance
---
# The 7 Core Detection Systems
PSSP employs seven independent detection algorithms. Each identifies a specific type of exhaustion or reversal signal. When multiple systems fire simultaneously, the probability of a successful short dramatically increases.
---
## 1. PARABOLIC EXHAUSTION DETECTOR
### What It Detects
Identifies when price has moved too far, too fast and is likely to reverse. This system looks for the classic "blow-off top" pattern common in penny stock runners.
### Technical Logic
```
Parabolic Signal = TRUE when:
├── Consecutive green candles ≥ threshold (default: 3)
├── AND price extension from VWAP ≥ threshold ATRs (default: 1.5)
└── OR shooting star / upper wick rejection pattern forms
```
### Visual Representation
```
╱╲ ← Shooting star / upper wick
╱ ╲ (Parabolic exhaustion)
╱
╱
╱
══════════════ VWAP
╱
╱
```
### Why It Works on Penny Stocks
Penny stocks are notorious for parabolic moves driven by retail FOMO. When everyone who wants to buy has bought, there's no one left to push prices higher. The shooting star pattern shows that sellers are already stepping in at higher prices.
### Key Settings
| Parameter | Default | Range | Description |
|-----------|---------|-------|-------------|
| Lookback Period | 10 | 3-30 | Bars to analyze for pattern |
| Extension Threshold | 1.5 ATR | 0.5-5.0 | How far above VWAP is "parabolic" |
| Consecutive Green Bars | 3 | 2-10 | Minimum green bars for exhaustion |
---
## 2. VWAP REJECTION SYSTEM
### What It Detects
Volume Weighted Average Price (VWAP) is the single most important level for institutional traders. This system identifies when price tests above VWAP and gets rejected back below—a powerful short signal.
### Technical Logic
```
VWAP Rejection = TRUE when:
├── Candle high pierces above VWAP
├── AND candle closes below VWAP
├── AND candle is bearish (close < open)
└── AND rejection distance is within sensitivity threshold
```
### Visual Representation
```
High ──→ ╱╲
╱ ╲
VWAP ════════╱════╲═══════════
Close ←── Rejection
```
### Extended VWAP Signals
The system also tracks VWAP standard deviation bands. Rejection from the upper band (2 standard deviations above VWAP) is an even stronger signal.
### Why It Works on Penny Stocks
- Algorithms and institutions use VWAP as their benchmark
- Failed attempts to reclaim VWAP often lead to waterfall selling
- VWAP acts as a "magnet" that price tends to revert toward
### Key Settings
| Parameter | Default | Range | Description |
|-----------|---------|-------|-------------|
| Rejection Sensitivity | 0.5 ATR | 0.1-2.0 | How close to VWAP for valid rejection |
| Show VWAP Line | True | - | Display VWAP on chart |
| Show VWAP Bands | True | - | Display standard deviation bands |
| Band Multiplier | 2.0 | 0.5-4.0 | Standard deviations for bands |
---
## 3. VOLUME CLIMAX DETECTOR
### What It Detects
Identifies "blow-off tops" where extreme volume accompanies a price spike. This often marks the exact top as it represents maximum retail participation—after which buying power is exhausted.
### Technical Logic
```
Volume Climax = TRUE when:
├── Current volume ≥ (Average volume × Climax Multiple)
├── AND one of:
│ ├── Selling into the high (upper wick > lower wick on green bar)
│ └── OR post-climax weakness (red bar following climax bar)
```
### Visual Representation
```
Price: ╱╲
╱ ╲
╱ ╲
╱ ╲
╱
Volume:
▂▃▅▇██▇▅▃▂▁
↑
Volume Climax (3x+ average)
```
### Why It Works on Penny Stocks
- Retail traders pile in at the top, creating volume spikes
- Market makers and smart money use this liquidity to exit
- Once the volume spike passes, there's no fuel left for higher prices
- The "smart money selling into dumb money buying" creates the top
### Key Settings
| Parameter | Default | Range | Description |
|-----------|---------|-------|-------------|
| Volume MA Length | 20 | 5-50 | Period for average volume calculation |
| Climax Volume Multiple | 3.0x | 1.5-10.0 | Multiple of average for "climax" |
| Show Volume Bars | True | - | Visual volume representation |
---
## 4. RSI DIVERGENCE ANALYZER
### What It Detects
Bearish divergence occurs when price makes higher highs but RSI (momentum) makes lower highs. This indicates that momentum is weakening even as price pushes higher—a warning of imminent reversal.
### Technical Logic
```
Bearish Divergence = TRUE when:
├── RSI is in overbought territory (> threshold)
├── AND RSI is declining (current < previous < prior)
└── Indicates momentum exhaustion before price catches up
```
### Visual Representation
```
Price: /\ /\
/ \ / \ ← Higher high
/ \/
/
/
RSI: /\
/ \ /\
/ \/ \ ← Lower high (DIVERGENCE)
/ \
════════════════════ Overbought (70)
```
### Why It Works on Penny Stocks
- Penny stocks often push to new highs on weaker and weaker momentum
- Divergence signals that fewer buyers are participating at each new high
- Eventually, the lack of buying pressure leads to collapse
### Key Settings
| Parameter | Default | Range | Description |
|-----------|---------|-------|-------------|
| RSI Length | 14 | 5-30 | Standard RSI calculation period |
| Overbought Level | 70 | 60-90 | RSI level considered overbought |
| Divergence Lookback | 14 | 5-30 | Bars to look back for swing highs |
---
## 5. KEY LEVEL REJECTION TRACKER
### What It Detects
Identifies rejections from significant price levels where shorts are likely to be concentrated: High of Day (HOD), premarket highs, and psychological levels (whole and half dollars).
### Technical Logic
```
Level Rejection = TRUE when:
├── Price touches key level (within 0.2% tolerance)
├── AND candle is bearish (close < open)
├── AND close is in lower portion of candle range
│
├── Key Levels Tracked:
│ ├── High of Day (HOD)
│ ├── Premarket High
│ └── Psychological levels ($1.00, $1.50, $2.00, etc.)
```
### Visual Representation
```
HOD ─────────────────────────────────
╱╲ ← Rejection
╱ ╲
╱ ╲
╱
─────────────────────────────────
PM High ─────────────────────────────
```
### Why It Works on Penny Stocks
- **HOD**: The high of day is where the most traders are trapped long. Failure to break HOD often triggers stop-loss cascades
- **Premarket High**: Represents overnight enthusiasm; failure to exceed often means the "news" is priced in
- **Psychological Levels**: Round numbers ($1, $2, $5) attract orders and act as natural resistance
### Key Settings
| Parameter | Default | Range | Description |
|-----------|---------|-------|-------------|
| Track HOD Rejection | True | - | Monitor high of day |
| Track Premarket High | True | - | Monitor premarket resistance |
| Track Psychological Levels | True | - | Monitor round numbers |
---
## 6. FAILED BREAKOUT DETECTOR
### What It Detects
Identifies "bull traps" where price breaks above resistance but immediately fails and closes back below. This traps breakout buyers and often leads to accelerated selling.
### Technical Logic
```
Failed Breakout = TRUE when:
├── Price breaks above recent high (lookback period)
├── AND one of:
│ ├── Same bar closes below the breakout level
│ └── OR following bars show consecutive red candles
```
### Visual Representation
```
╱╲
╱ ╲ ← False breakout
Recent High ══╱════╲════════════════
╱ ╲
╱ ╲
╱ ╲ ← Trapped longs panic sell
```
### Why It Works on Penny Stocks
- Breakout traders enter on the break, providing exit liquidity for smart money
- When the breakout fails, these traders become trapped and must exit
- Their forced selling accelerates the decline
- Penny stocks have thin order books, making failed breakouts especially violent
### Key Settings
| Parameter | Default | Range | Description |
|-----------|---------|-------|-------------|
| Breakout Lookback | 5 | 2-15 | Bars to define "recent high" |
| Confirmation Bars | 2 | 1-5 | Bars to confirm failure |
---
## 7. MOVING AVERAGE BREAKDOWN SYSTEM
### What It Detects
Monitors exponential moving averages (EMAs) for bearish crossovers and price rejections. EMA crosses often signal trend changes, while rejections from EMAs indicate resistance.
### Technical Logic
```
MA Breakdown = TRUE when:
├── Bearish EMA cross (fast crosses below slow)
└── OR EMA rejection (price tests EMA from below and fails)
```
### Visual Representation
```
╱╲ ← Rejection from EMA
╱ ╲
EMA 9 ═══════════╱════╲═══════════
╲
EMA 20 ═══════════════════╲════════
╲
Bearish cross ↓
```
### Why It Works on Penny Stocks
- EMAs smooth out the noise and show underlying trend direction
- When fast EMA crosses below slow EMA, it signals momentum shift
- Rejected attempts to reclaim EMAs show sellers are in control
### Key Settings
| Parameter | Default | Range | Description |
|-----------|---------|-------|-------------|
| Fast EMA | 9 | 3-20 | Short-term trend |
| Slow EMA | 20 | 10-50 | Medium-term trend |
| Show EMAs | True | - | Display on chart |
---
# Installation & Setup
## Step 1: Access Pine Editor
1. Open TradingView (tradingview.com)
2. Open any chart
3. Click "Pine Editor" at the bottom of the screen
## Step 2: Create New Indicator
1. Click "Open" → "New blank indicator"
2. Delete any existing code
3. Paste the entire PSSP code
## Step 3: Save and Add to Chart
1. Click "Save" (give it a name like "PSSP")
2. Click "Add to chart"
3. The indicator will appear with default settings
## Step 4: Configure Settings
1. Click the gear icon (⚙️) on the indicator
2. Adjust settings based on your trading style (see Settings section)
3. Click "OK" to apply
## Recommended Chart Setup
- **Timeframe**: 1-minute or 5-minute for scalping, 15-minute for swing shorts
- **Chart Type**: Candlestick
- **Extended Hours**: Enable if trading premarket/afterhours
- **Volume**: Can disable default volume since PSSP tracks it
---
# Understanding the Dashboard
The real-time dashboard provides at-a-glance status of all systems:
```
┌─────────────────────────────────────────┐
│ 📊 SHORT SIGNAL DASHBOARD │
├─────────────────────────────────────────┤
│ Signal Strength: 5/7 │
├─────────────────────────────────────────┤
│ ─── ACTIVE SIGNALS ─── │
│ │
│ Parabolic Exhaustion 🔴 2.1 ATR │
│ VWAP Rejection 🔴 Above │
│ Volume Climax 🔴 4.2x Avg │
│ RSI Divergence ⚪ RSI: 68 │
│ Level Rejection 🔴 @ HOD │
│ Failed Breakout 🔴 │
│ MA Breakdown ⚪ Bullish │
├─────────────────────────────────────────┤
│ ─── RISK LEVELS ─── │
│ Stop: $2.45 T1: $2.10 T2: $1.85 │
└─────────────────────────────────────────┘
```
## Dashboard Elements Explained
### Signal Strength Indicator
| Rating | Signals | Color | Interpretation |
|--------|---------|-------|----------------|
| STRONG | 5-7 | Red | High-confidence short opportunity |
| MODERATE | 3-4 | Orange | Decent setup, consider other factors |
| WEAK | 1-2 | Gray | Insufficient confirmation |
| NONE | 0 | Gray | No short signals active |
### Signal Status Icons
- 🔴 = Signal is ACTIVE (condition met)
- ⚪ = Signal is INACTIVE (condition not met)
### Contextual Metrics
Each signal row includes relevant metrics:
- **Parabolic**: Shows ATR extension from VWAP
- **VWAP**: Shows if price is Above/Below VWAP
- **Volume**: Shows current volume as multiple of average
- **RSI**: Shows current RSI value
- **Level**: Shows which level was touched (HOD, PM High, etc.)
- **MA**: Shows EMA relationship (Bullish/Bearish)
### Risk Levels
When a composite short signal fires:
- **Stop**: Suggested stop-loss level (high + ATR multiple)
- **T1**: First profit target (1:1 risk/reward)
- **T2**: Second profit target (user-defined R:R)
---
# Input Settings Deep Dive
## Group 1: Parabolic Exhaustion
| Setting | Default | Conservative | Aggressive | Description |
|---------|---------|--------------|------------|-------------|
| Enable | True | True | True | Turn system on/off |
| Lookback Period | 10 | 15 | 5 | Bars analyzed for pattern |
| Extension Threshold | 1.5 | 2.0 | 1.0 | ATRs above VWAP for "parabolic" |
| Consecutive Green Bars | 3 | 4 | 2 | Minimum green bars required |
**Tuning Tips:**
- Lower thresholds = more signals but more false positives
- Higher thresholds = fewer signals but higher quality
- For very volatile penny stocks, consider higher thresholds
## Group 2: VWAP Rejection
| Setting | Default | Conservative | Aggressive | Description |
|---------|---------|--------------|------------|-------------|
| Enable | True | True | True | Turn system on/off |
| Rejection Sensitivity | 0.5 | 0.3 | 0.8 | ATR distance for valid rejection |
| Show VWAP Line | True | True | True | Display VWAP |
| Show VWAP Bands | True | True | True | Display deviation bands |
| Band Multiplier | 2.0 | 2.5 | 1.5 | Standard deviations for bands |
**Tuning Tips:**
- Tighter sensitivity (lower number) = must reject very close to VWAP
- Wider bands = less frequent upper band rejections but more significant
## Group 3: Volume Climax
| Setting | Default | Conservative | Aggressive | Description |
|---------|---------|--------------|------------|-------------|
| Enable | True | True | True | Turn system on/off |
| Volume MA Length | 20 | 30 | 10 | Baseline volume period |
| Climax Volume Multiple | 3.0 | 4.0 | 2.0 | Multiple for "climax" status |
| Show Volume Profile | True | True | True | Visual volume bars |
**Tuning Tips:**
- Higher multiple = only extreme volume spikes trigger
- Shorter MA = more responsive to recent volume changes
- For highly liquid stocks, consider higher multiples
## Group 4: Momentum Divergence
| Setting | Default | Conservative | Aggressive | Description |
|---------|---------|--------------|------------|-------------|
| Enable | True | True | True | Turn system on/off |
| RSI Length | 14 | 21 | 7 | RSI calculation period |
| Overbought Level | 70 | 75 | 65 | Threshold for "overbought" |
| Divergence Lookback | 14 | 20 | 10 | Bars for swing high detection |
**Tuning Tips:**
- Lower overbought threshold = more frequent signals
- Shorter RSI length = more responsive but noisier
## Group 5: Key Level Rejection
| Setting | Default | Description |
|---------|---------|-------------|
| Enable | True | Master toggle for level system |
| Track Premarket High | True | Monitor premarket resistance |
| Track HOD Rejection | True | Monitor high of day |
| Track Psychological Levels | True | Monitor round numbers |
**Tuning Tips:**
- Disable premarket tracking if stock doesn't have significant premarket activity
- Psychological levels work best on stocks under $10
## Group 6: Failed Follow-Through
| Setting | Default | Conservative | Aggressive | Description |
|---------|---------|--------------|------------|-------------|
| Enable | True | True | True | Turn system on/off |
| Breakout Lookback | 5 | 8 | 3 | Bars defining "recent high" |
| Confirmation Bars | 2 | 3 | 1 | Bars to confirm failure |
**Tuning Tips:**
- Shorter lookback = more breakouts detected but smaller significance
- More confirmation bars = higher confidence but later entry
## Group 7: Moving Average Signals
| Setting | Default | Conservative | Aggressive | Description |
|---------|---------|--------------|------------|-------------|
| Enable | True | True | True | Turn system on/off |
| Fast EMA | 9 | 12 | 5 | Short-term trend |
| Slow EMA | 20 | 26 | 13 | Medium-term trend |
| Show EMAs | True | True | True | Display on chart |
**Tuning Tips:**
- Standard 9/20 works well for most penny stocks
- Faster EMAs (5/13) for scalping, slower (12/26) for swing trading
## Group 8: Composite Signal
| Setting | Default | Conservative | Aggressive | Description |
|---------|---------|--------------|------------|-------------|
| Minimum Signals | 3 | 4-5 | 2 | Signals needed for trigger |
| Show Dashboard | True | True | True | Display signal table |
| Dashboard Position | top_right | - | - | Screen location |
**Tuning Tips:**
- **Minimum Signals is the most important setting**
- Higher minimum = fewer trades but higher win rate
- Lower minimum = more trades but more false signals
## Group 9: Risk Management
| Setting | Default | Conservative | Aggressive | Description |
|---------|---------|--------------|------------|-------------|
| Show Stop Levels | True | True | True | Display stop loss |
| Stop ATR Multiple | 1.5 | 2.0 | 1.0 | Stop distance in ATRs |
| Show Targets | True | True | True | Display profit targets |
| Target R:R | 2.0 | 1.5 | 3.0 | Risk:Reward for Target 2 |
**Tuning Tips:**
- Tighter stops (lower ATR multiple) = less risk but more stop-outs
- Higher R:R targets = bigger winners but fewer targets hit
## Group 10: Visual Settings
| Setting | Default | Description |
|---------|---------|-------------|
| Bullish Color | Green | Color for bullish elements |
| Bearish Color | Red | Color for bearish/short signals |
| Warning Color | Orange | Color for caution signals |
| Neutral Color | Gray | Color for inactive elements |
---
# Visual Elements Explained
## Chart Overlays
### VWAP Line (Blue)
- **Solid blue line** = Volume Weighted Average Price
- Price above VWAP = bullish bias
- Price below VWAP = bearish bias
- **Use**: Short when price rejects from above VWAP
### VWAP Bands (Purple circles)
- Upper band = 2 standard deviations above VWAP
- Lower band = 2 standard deviations below VWAP
- **Use**: Extreme extension to upper band signals potential reversal
### EMAs (Orange and Red)
- **Orange line** = Fast EMA (9-period default)
- **Red line** = Slow EMA (20-period default)
- **Use**: Bearish cross or price rejection from EMAs confirms short
### HOD Line (Red, dashed)
- Shows the current day's high
- **Use**: Rejection from HOD is a key short signal
### Premarket High (Orange, dashed)
- Shows premarket session high
- **Use**: Failure to break PM high often signals weakness
## Signal Markers
### Individual Signal Markers (Small)
| Shape | Color | Signal |
|-------|-------|--------|
| ▼ Triangle | Purple | Parabolic Exhaustion |
| ✕ X-Cross | Blue | VWAP Rejection |
| ◆ Diamond | Yellow | Volume Climax |
| ● Circle | Orange | RSI Divergence |
| ■ Square | Red | Failed Breakout |
### Composite Short Signal (Large)
- **Large red triangle** with "SHORT" text
- Only appears when minimum signal threshold is met
- This is your primary trading signal
## Risk Level Lines
### Stop Loss (Red line)
- Calculated as: Entry + (ATR × Stop Multiple)
- Represents maximum acceptable loss
- **RESPECT THIS LEVEL**
### Target 1 (Light green line)
- First profit target at 1:1 risk/reward
- Consider taking partial profits here
### Target 2 (Dark green line)
- Second profit target at user-defined R:R
- Let winners run to this level
## Background Coloring
### Light Red Background
- Appears when composite short signal is active
- Indicates you should be looking for shorts, not longs
### Light Purple Background
- Appears during extreme parabolic extension
- Warning of potential imminent reversal
---
# Alert Configuration
## Available Alerts
### 1. Composite Short Signal
**Best for**: Primary trading signal
```
Condition: Composite short signal fires
Message: "PSSP: Short Signal Triggered - {ticker} at {close}"
```
### 2. Parabolic Exhaustion
**Best for**: Early warning of potential top
```
Condition: Parabolic exhaustion detected
Message: "PSSP: Parabolic exhaustion detected on {ticker}"
```
### 3. Volume Climax
**Best for**: Blow-off top identification
```
Condition: Volume climax occurs
Message: "PSSP: Volume climax / blow-off top on {ticker}"
```
### 4. Strong Short Setup (5+ Signals)
**Best for**: High-confidence opportunities only
```
Condition: 5 or more signals active
Message: "PSSP: STRONG short setup on {ticker}"
```
### 5. Very Strong Short Setup (6+ Signals)
**Best for**: Maximum confidence trades
```
Condition: 6 or more signals active
Message: "PSSP: VERY STRONG short setup on {ticker}"
```
### 6. Failed Breakout
**Best for**: Bull trap identification
```
Condition: Failed breakout detected
Message: "PSSP: Failed breakout detected on {ticker}"
```
### 7. Key Level Rejection
**Best for**: Resistance level plays
```
Condition: Key level rejection occurs
Message: "PSSP: Key level rejection on {ticker}"
```
## Setting Up Alerts in TradingView
1. Right-click on the chart
2. Select "Add Alert"
3. Set Condition to "Penny Stock Short Signal Pro"
4. Choose your desired alert condition
5. Configure notification method (popup, email, webhook, etc.)
6. Set expiration (or "Open-ended" for permanent)
7. Click "Create"
## Alert Strategy Recommendations
### For Active Day Traders
- Enable: Composite Short Signal, Volume Climax
- Set to: Popup + Sound
- Check frequently during market hours
### For Swing Traders
- Enable: Strong Short Setup (5+), Very Strong Short Setup (6+)
- Set to: Email + Mobile Push
- Review at key times (open, lunch, close)
### For Part-Time Traders
- Enable: Very Strong Short Setup (6+) only
- Set to: Email + SMS
- Only trade highest-conviction setups
---
# Trading Strategies
## Strategy 1: The Parabolic Fade
**Setup Requirements:**
- Parabolic Exhaustion signal ACTIVE
- Extension from VWAP ≥ 2.0 ATR
- Volume climax or declining volume on push
**Entry:**
- Short on first red candle after signal
- Or short on break below prior candle's low
**Stop Loss:**
- Above the high of the parabolic move
- Maximum: 1.5 ATR above entry
**Targets:**
- T1: VWAP (take 50% off)
- T2: Lower VWAP band or LOD
**Best Time:** 9:30-10:30 AM (morning runners)
---
## Strategy 2: VWAP Rejection Short
**Setup Requirements:**
- VWAP Rejection signal ACTIVE
- Price came from below VWAP
- Rejection candle has significant upper wick
**Entry:**
- Short on close below VWAP
- Or short on break below rejection candle low
**Stop Loss:**
- Above VWAP + 0.5 ATR
- Or above rejection candle high
**Targets:**
- T1: Lower VWAP band
- T2: Prior support or LOD
**Best Time:** Midday (11:00 AM - 2:00 PM)
---
## Strategy 3: HOD Failure Short
**Setup Requirements:**
- Level Rejection signal ACTIVE (HOD)
- Multiple tests of HOD without breakthrough
- Volume declining on each test
**Entry:**
- Short on confirmed HOD rejection
- Wait for close below the rejection candle
**Stop Loss:**
- Above HOD + 0.25 ATR (tight)
- Clear invalidation if HOD breaks
**Targets:**
- T1: VWAP
- T2: Morning support levels
**Best Time:** 10:30 AM - 12:00 PM
---
## Strategy 4: Volume Climax Fade
**Setup Requirements:**
- Volume Climax signal ACTIVE
- Volume ≥ 3x average on green candle
- Followed by bearish candle or upper wick
**Entry:**
- Short on first red candle after climax
- Or short on break below climax candle low
**Stop Loss:**
- Above climax candle high
- Give room for volatility spike
**Targets:**
- T1: 50% retracement of the run
- T2: VWAP or start of the run
**Best Time:** First hour of trading
---
## Strategy 5: The Full Composite (High Conviction)
**Setup Requirements:**
- Composite Short signal ACTIVE
- Minimum 4-5 individual signals
- Clear visual of signal markers clustering
**Entry:**
- Short immediately on composite signal
- Use market order for fast-moving stocks
**Stop Loss:**
- Use indicator's automatic stop level
- Do not deviate from system
**Targets:**
- T1: Indicator's T1 level (1:1)
- T2: Indicator's T2 level (2:1)
**Best Time:** Any time with sufficient signals
---
# Risk Management
## Position Sizing Formula
```
Position Size = (Account Risk %) / (Stop Loss %)
Example:
- Account: $25,000
- Risk per trade: 1% = $250
- Entry: $2.00
- Stop: $2.20 (10% stop)
- Position Size: $250 / 10% = $2,500 worth
- Shares: $2,500 / $2.00 = 1,250 shares
```
## Risk Rules
### The 1% Rule
Never risk more than 1% of your account on any single trade. For a $25,000 account, max risk = $250.
### The 2x Stop Rule
If your stop gets hit twice on the same stock, stop trading it for the day. The pattern isn't working.
### The Daily Loss Limit
Set a maximum daily loss (e.g., 3% of account). Stop trading if hit.
### The Size-Down Rule
After a losing trade, reduce your next position size by 50%. Rebuild after a winner.
## Short-Specific Risks
### The Short Squeeze
- Penny stocks can squeeze violently
- ALWAYS use stops
- Never "hope" a position comes back
- Size appropriately for volatility
### The Hard-to-Borrow
- Check borrow availability before trading
- High borrow fees eat into profits
- Some stocks become HTB mid-trade
### The Halt Risk
- Penny stocks can halt on volatility
- Position size for worst-case halt against you
- Halts can open significantly higher
---
# Best Practices
## DO's
✅ **Wait for multiple signals** - Single signals have lower accuracy
✅ **Trade with the trend** - Short when daily trend is down
✅ **Use the dashboard** - Check signal count before entering
✅ **Respect stops** - The indicator calculates them for a reason
✅ **Size appropriately** - Penny stocks are volatile; position small
✅ **Trade liquid stocks** - Volume ≥ 500K daily average
✅ **Know the catalyst** - Understand why the stock is moving
✅ **Take partial profits** - Secure gains at T1
✅ **Journal your trades** - Track what works and what doesn't
✅ **Time your entries** - Best shorts often come 10:30-11:30 AM
## DON'Ts
❌ **Don't short strong stocks** - If it won't go down, don't force it
❌ **Don't fight the tape** - A stock going up can keep going up
❌ **Don't average up on losers** - Adding to losing shorts is dangerous
❌ **Don't ignore the dashboard** - It exists to help you
❌ **Don't overtrade** - Quality over quantity
❌ **Don't short into news** - Wait for the reaction first
❌ **Don't trade the first 5 minutes** - Too chaotic for reliable signals
❌ **Don't hold overnight** - Penny stock gaps can destroy accounts
❌ **Don't trade without stops** - Ever.
❌ **Don't trade on tilt** - After losses, take a break
## Optimal Trading Windows
| Time (ET) | Quality | Notes |
|-----------|---------|-------|
| 9:30-9:35 | ⭐ | Too volatile, avoid |
| 9:35-10:30 | ⭐⭐⭐⭐⭐ | Best shorts, morning runners exhaust |
| 10:30-11:30 | ⭐⭐⭐⭐ | Secondary exhaustion, HOD rejections |
| 11:30-2:00 | ⭐⭐ | Midday lull, lower quality |
| 2:00-3:00 | ⭐⭐⭐ | Afternoon setups develop |
| 3:00-3:30 | ⭐⭐⭐⭐ | End of day momentum |
| 3:30-4:00 | ⭐⭐ | Closing volatility, risky |
---
# Troubleshooting
## Common Issues
### "Signals aren't appearing"
- Check that the relevant system is enabled in settings
- Ensure minimum signals threshold isn't too high
- Verify the stock has sufficient volume for calculations
### "Too many false signals"
- Increase minimum signals threshold
- Use more conservative settings (see Settings section)
- Focus on stocks with cleaner price action
### "Dashboard not showing"
- Ensure "Show Signal Dashboard" is enabled
- Check that your chart has enough space
- Try a different dashboard position
### "VWAP line is missing"
- VWAP requires intraday timeframes (1m, 5m, 15m, etc.)
- VWAP resets daily; won't show on daily+ charts
- Ensure "Show VWAP Line" is enabled
### "Stop loss seems too tight/wide"
- Adjust Stop ATR Multiple in Risk Management settings
- Lower multiple = tighter stop
- Higher multiple = wider stop
### "Alerts not triggering"
- Verify alert is set to the correct indicator
- Check that alert hasn't expired
- Ensure notification settings are configured in TradingView
## Performance Optimization
If the indicator is slow:
1. Reduce the number of visual elements shown
2. Disable unused signal systems
3. Use on fewer simultaneous charts
4. Close unused browser tabs
---
# Changelog
## Version 1.0 (Initial Release)
- 7 core detection systems implemented
- Real-time signal dashboard
- Automatic risk management calculations
- 7 alert conditions
- Full visual overlay system
- Comprehensive input settings
## Planned Features (Future Updates)
- Scanner integration for multi-stock screening
- Machine learning signal weighting
- Backtesting statistics panel
- Volume profile analysis
- Level 2 data integration (if available)
- Custom timeframe VWAP options
---
# Support & Feedback
## Reporting Issues
When reporting issues, please include:
1. TradingView username
2. Stock symbol and timeframe
3. Screenshot of the issue
4. Your indicator settings
5. Steps to reproduce
## Feature Requests
We welcome suggestions for improving PSSP. Consider:
- What specific pattern are you trying to catch?
- How would this help your trading?
- Any reference examples?
---
# Disclaimer
**IMPORTANT: This indicator is for educational and informational purposes only.**
- Past performance does not guarantee future results
- Short selling carries unlimited risk potential
- Always use proper position sizing and stop losses
- Paper trade before using real capital
- The creator assumes no liability for trading losses
- Consult a financial advisor before trading
**Trade at your own risk.**
---
*Penny Stock Short Signal Pro v1.0*
*Pine Script v6*
*© 2025*

EMA 5/9 Ribbon + VWAP + Trend Filters **Description:**
This indicator combines EMA ribbon analysis with VWAP and volume-based trend filters to help traders identify high-probability entries. It is designed for clarity, providing visual signals, trend bias, and key market metrics directly on the chart.
**Key Features:**
* EMA Ribbon (5 & 9) that changes color based on trend and VWAP cross.
* Buy/Sell signals with optional “strong” signals when trend and volume confirm.
* VWAP crossover arrows (yellow) highlight stronger trends.
* Sideways detection filter to reduce signals during choppy markets.
* Adjustable ribbon and sideways background colors via settings.
* Live trend table showing:
* Current trend bias (Bullish/Bearish/Sideways)
* Bullish vs Bearish volume percentage
* ATR for volatility insight
* Optional background highlight for sideways zones.
**User Inputs:**
* EMA lengths, ATR length, volume lookback
* Sideways detection toggle and sensitivity
* Table placement options (top-right, top-center, bottom-right, bottom-center)
* Customizable colors for bullish, bearish, VWAP, and sideways zones
**Benefits:**
* Quickly visualize trend direction and momentum.
* Avoid signals during sideways or low-volatility periods.
* Makes chart analysis faster and more intuitive.
* Fully customizable to match personal trading style.
**Recommended Use:**
Best used on intraday or swing charts to confirm trend and momentum. Combine with other analysis tools (support/resistance, candlestick patterns, or additional indicators) for higher confidence trades.

Wx Gann WindowsWx Gann Windows — Seasonal Time Windows & Forward Markers
Wx Gann Windows highlights the handful of Gann-style seasonal dates that matter most, without cluttering your chart. It draws subtle “time windows” around key dates each year and optionally projects the next 12 months of dates into the future so you can keep them in mind when planning trades or options spreads.
What it shows
1. Seasonal Windows (background bands)
• Equinox / Solstice windows (Spring, Summer, Autumn, Winter).
• Optional midpoint (cross-quarter) windows: early Feb / May / Aug / Nov.
• Each window is a small number of days (default 3) centered on the approximate calendar date, with a soft background band so price action remains in focus.
2. On-Chart Labels (optional)
• Small labels like “Spring Eq.”, “Winter Sol.”, “Feb Mid” printed just above the current chart’s price range.
• One label per window, on the first bar of the window.
3. Future Projections (next 12 months)
• For each key date, the script projects the next occurrence into the future.
• Draws a vertical dotted line from near the chart low to above the chart high, plus a label such as “Spring Eq. (next)” or “Aug Mid (next)”.
• This gives you a 12-month “time roadmap” for cycles-sensitive planning (e.g., options, swing trades) without manual date marking.
Inputs
Window Settings
• Equinox / Solstice Window (days) – size of the seasonal bands (default 3 days).
• Midpoint Window (days) – size of the mid-Feb / May / Aug / Nov bands.
Visibility
• Show Equinox & Solstice Windows – toggle main seasonal bands on/off.
• Show Midpoint Windows (Feb/May/Aug/Nov) – toggle cross-quarter bands.
• Show Labels (on windows) – show/hide the on-chart labels above price.
Future Projections
• Project Next 12 Months (future markers) – toggle the forward vertical lines + “(next)” labels.
How to use it
• Treat these dates as awareness windows, not prediction signals.
• Use them to:
• Be extra alert for potential turns, accelerations, or exhaustion.
• Tighten risk or avoid opening new positions right into a window if your system suggests caution.
• Plan options expiries or swing entries with time structure in mind.
Always confirm decisions with your own system (trend, structure, volume, breadth, macro), not the dates alone.
Notes & Disclaimer
• Dates are approximate calendar anchors inspired by Gann’s seasonal and cross-quarter work, using simple ±N-day windows.
• Works on any symbol and timeframe; windows are based on calendar dates, not bar count.
• This tool is educational and informational only. It does not place orders and is not financial advice. Always test and integrate with your own strategy and risk management.

[codapro] PressureBox Breakout Engine Full Breakdown PressureBox Breakout Engine is a revamped and expanded version of a prior post. This release includes a more educational breakdown and deeper configuration guidance, in response to user requests for clarity on how the system works and how to use it effectively.
This tool is a compression-detection and breakout-anticipation engine that blends Donchian channel logic, ATR filtering, and a proprietary “pressure” oscillator derived from volume-weighted momentum. It visually highlights real-time “compression zones” with dynamic shaded boxes and flags potential breakouts using configurable BUY/SELL markers.
It’s designed to help traders identify and analyze different market setups — including potential trend continuations, volatility breakouts, and range fade conditions — by surfacing key compression and pressure states visually on the chart.
Key Features
*Dynamic Compression Boxes: drawn when Donchian range < smoothed ATR threshold
*Breakout Flags: BUY/SELL alerts when price breaks outside compression range
*Custom Volume Pressure Score: MFI + CMF hybrid from -1 to +1
*Candle Overlap Filter: optional % overlap indicator for noise detection
*Adaptive Box Shading: transparency adjusts to pressure strength
*Clean Re-Anchoring Logic: boxes reset only when compression ends
*Full User Control: configure inputs for box length, blend logic, signal rules
How It Works
Compression Box Logic
A box is drawn when the Donchian range (e.g. high - low over N bars) falls below a moving ATR threshold.
The box dynamically extends and adjusts height/width until a breakout or timeout occurs.
Users can toggle whether Donchian uses highs/lows or closes and whether the box shows a midline.
Breakout Signal Logic
BUY signal: Close breaks above box high, with optional compression condition on the prior bar.
SELL signal: Close breaks below box low.
Signals use ATR-based offsets for clean separation on the chart.
Pressure Score Logic
Pressure is a weighted blend between:
MFI (Money Flow Index) — momentum-based
CMF (Chaikin Money Flow) — flow-based
The result is a smoothed -1 to +1 score that represents volume pressure.
This is used both for:
Box transparency (strong pressure = darker shading)
Optional overlay plot
Overlap Mode
Calculates smoothed % of how much recent candles overlap.
Useful for filtering non-directional chop and low-quality breakouts.
Can be toggled on/off as a separate overlay line.
⚙️ Default Optimized Settings
Setting Value
Donchian Length 8
ATR Length 13
ATR Multiplier 3.1
ATR SMA Length 21
Max Extend Bars 55
MFI Length 25
CMF Length 55
Blend Weight (MFI:CMF) 0.5
These are optimized for detecting tight consolidations and explosive breakout potential, especially on intraday 5m–15m charts across futures, forex, and crypto.
How to Use It
Watch for the compression box to form — this marks a squeeze zone.
Breakouts with BUY/SELL flags are most reliable after long compressions.
Adjust the Blend Weight to prioritize MFI (momentum) or CMF (flow).
Use Overlap % to filter sideways markets or low-quality signals.
Combine with support/resistance, VPA tools, or trend filters for layered setups.
Disclaimer
This tool was created using the CodaPro Pine Script architecture engine — designed to produce robust trading overlays, educational visuals, and automation-ready alerts.
It is provided strictly for educational purposes and does not constitute financial advice. Always backtest and demo before applying to real capital.

Target Lock Algo buy and Sell Signal by Amit NamdeoTarget Lock Algo: Professional Buy & Sell Signals
Target Lock Algo is a comprehensive, institutional-grade trading system designed to filter out market noise and provide high-probability entry signals with automated risk management. It combines Trend Flow, Market Structure (SMC), and Volatility Analysis into a single, clean interface.
Key Features
1. Precision Signal Engine
Trend-Following Logic: The core algorithm uses a smoothed Baseline to detect the dominant market flow. Signals are generated only when the trend flips (Green for Bullish, Red for Bearish).
"One-Shot" Execution: To prevent overtrading, the system never issues consecutive signals in the same direction. It forces a complete trend reversal before signaling again.
Whipsaw Protection: A built-in time filter (Min Bars) prevents signals from clustering together during choppy price action.
2. Institutional Filters (The "Safety Net")
200 EMA Major Trend Filter:
Buys are only enabled when price is ABOVE the 200 EMA.
Sells are only enabled when price is BELOW the 200 EMA.
This prevents catching falling knives or buying into a crash.
ADX Chop Filter:
The system actively monitors market strength using the Average Directional Index (ADX).
If the market enters a sideways "Chop Zone" (ADX < 20), all trading signals are hard-blocked.
Visual Aid: These zones can be highlighted with Gray Boxes to warn you to stay out.
3. Automated Risk Management (Target Lock)
When a signal is generated, the algorithm automatically calculates and draws the exact trade parameters on your chart:
⚡ ENTRY: The precise closing price of the signal candle.
🛑 STOP LOSS: Dynamic stop loss calculated using Market Volatility (ATR). If the market is volatile, the stop widens; if calm, it tightens.
🎯 TP 1, 💰 TP 2, 🚀 TP 3: Three take-profit levels calculated based on strict Risk-to-Reward ratios (1.5R, 2.5R, and 3.5R).
4. Premium Visual Interface
Glassmorphism Dashboard: A modern, transparent HUD in the top-right corner displays real-time data:
Current Trend: (Bullish 🟢 / Bearish 🔴)
Market State: (Active 🔥 / Ranging 💤)
Volatility: (Live ATR value)
SMC Overlay: Subtly plots pivot points and market structure breaks in the background to give you institutional context without cluttering the signals.
High-Contrast Design: Signals appear as modern "Neon Buttons," while TP/SL lines use rich, deep colors (Deep Emerald & Crimson) for professional visibility.
How to Trade with Target Lock Algo
Check the Dashboard: Ensure the Market State says "ACTIVE 🔥". If it says "RANGE 💤", be cautious.
Wait for the Button: Look for the "BUY NOW" (Neon Green) or "SELL NOW" (Neon Red) label.
Verify the Trend:
For BUY: Price should be above the white 200 EMA line.
For SELL: Price should be below the white 200 EMA line.
Execute: Enter the trade at the ⚡ ENTRY price.
Manage: Set your Stop Loss at the 🛑 SL line and take partial profits at TP 1 and TP 2. Leave a "runner" for TP 3 if the trend is strong.

Alpha Hunter System [MTF + Risk Manager] by Amit NamdeoThis is a comprehensive, "Institutional-Grade" Trend Following System. It is designed not just to give signals, but to filter out bad trades, manage risk automatically, and help you exit at the right time.
Here is a breakdown of exactly how your script works:
1. The Core Engine (High/Low Channel)
The Foundation: Instead of a single line, the script creates a Channel using two Exponential Moving Averages (EMAs).
Green Line: 50 EMA calculated on the Highs of the candles.
Red Line: 50 EMA calculated on the Lows of the candles.
The Logic: This creates a "No-Trade Zone" in the middle.
BUY Signal: Generated when price forcefully breaks above the Green High band.
SELL Signal: Generated when price forcefully breaks below the Red Low band.
2. The "Smart Filters" (Safety Mechanisms)
To prevent false signals (whipsaws), the script checks three separate conditions before showing a Buy or Sell label:
A. Sensitivity Filter (ATR): The price must not just touch the line; it must break it by a specific margin (based on Volatility/ATR). This filters out small wicks.
B. Volume Filter: A breakout is ignored if the Volume is low. The script requires the breakout candle's volume to be higher than the recent average. This ensures "Smart Money" supports the move.
C. Sideways Filter (ADX): Uses the Average Directional Index (ADX). If the trend is weak (ADX < 20), the channel turns Gray and blocks all signals. This saves you from trading in choppy, flat markets.
D. Multi-Timeframe (MTF) Consensus: This is the "60% Rule." The script secretly checks the trend on the 5m, 15m, 1H, 4H, and Daily charts. It only allows a signal if the majority of these timeframes agree with the direction.
3. Automatic Risk Management
This feature automates the math that professional traders usually do in Excel:
Dynamic Stop Loss (SL):
On a Buy, the SL is set to the Red (Low) Band.
On a Sell, the SL is set to the Green (High) Band.
Why? This adapts the SL to the current market volatility.
Take Profit Targets (TP):
It calculates your Risk (Entry - SL).
TP1: 1.5x Risk.
TP2: 2.5x Risk.
TP3: 4.0x Risk.
Visuals: It draws these lines on the chart immediately when a signal appears, so you know exactly where to place your orders.
4. Trailing Stop (The Purple Line)
What it is: A dynamic Purple Line that appears behind the candles.
How it works: It acts like a "Chandelier Exit."
As price moves in your favor, the line moves up to lock in profit.
It never moves backward.
Exit Rule: If a candle closes across this purple line, the trend is likely over, and you should exit.
Live Label: A label follows the line showing the exact price (e.g., "Trail SL: 1950.2") so you can update your order easily.
5. Alerts & Dashboard
Dashboard (Top Right): A live status panel showing:
Current Trend (Bullish/Bearish/Sideways).
MTF Consensus (Are the other timeframes agreeing?).
Volume Status (Pass/Fail).
Alerts: You can set phone/desktop notifications for:
Entries: Buy/Sell.
Targets: TP1, TP2, TP3 Hit.
Safety: Trailing Stop Hit (Exit trade).
Summary of Visual Colors
🟢 Green Channel: Bullish Trend (Look for Buys).
🔴 Red Channel: Bearish Trend (Look for Sells).
⚪ Gray Channel: Sideways Market (Do Not Trade).
🟣 Purple Line: Your Trailing Stop Loss.

My Swift-like Algo J.ALIMOJANIDSwift Algo Chart — Trend, Structure & ATR Risk
Swift Algo Chart is a trend-following trading indicator designed to provide clear bias, precise entries, and visual risk management.
It combines EMA trend direction, pullback-based signals, market structure (HH/HL/LH/LL), and ATR-based Stop Loss & Take Profit levels to help traders make disciplined decisions.
🔑 Key Features
Trend Regime Detection
Identifies LONG, SHORT, or NO TRADE conditions using Fast & Slow EMAs.
Pullback Entry Signals
Signals appear only in the direction of the active trend, with optional RSI confirmation.
ATR-Based Risk Levels
Automatically plots SL, TP1, and TP2, including exact price values on the chart.
Preview Levels
Shows projected SL/TP levels when a trend is active, even before an entry.
Market Structure Visualization
Marks HH / HL / LH / LL, draws structure lines, and highlights BOS and CHOCH.
Clean & Non-Repainting Logic
Uses confirmed pivots and closed candles for stability.
Strategy-Compatible
Can be used for discretionary trading or full strategy backtesting.
🧠 Best Used For
Crypto, Forex, Indices
15m to 4H timeframes
Traders who want structure + trend + risk clarity in one tool

eBacktesting - Learning: FVGeBacktesting - Learning: FVG is an indicator in the eBacktesting Learning series: a collection of tools designed to help new traders understand the most important concepts in trading through clear, visual examples directly on the chart.
This indicator highlights Fair Value Gaps (FVGs): areas where price moved so quickly that it left behind an imbalance. These zones often act like "magnets" for future price action and can become important areas to watch for reactions, continuations, or reversals.
To keep the chart clean and the learning process practical, FVGs are only displayed when they remain relevant, meaning they are not instantly cleared by the very next candle. This helps beginners focus on the imbalances that actually persist and are more likely to matter.
Each FVG is drawn as a zone with a midpoint line and will visually update as price interacts with it:
Touched when price trades into the zone
Filled when price completely clears the zone
These indicators are built to pair perfectly with eBacktesting extension, where traders can practice these concepts step-by-step. Backtesting concepts visually like this is one of the fastest ways to learn, build confidence, and improve trading performance.
Educational use only. Not financial advice.

EMA + PDH/PDL 2 Days [Scalping-Algo]🎯 Overview
A clean, focused scalping indicator designed for 2-minute and 4-minute stock charts. Combines trend-following EMAs with key daily support/resistance zones to identify high-probability scalp entries.
🛠️ What's Included
ComponentDescription🟡 EMA 13Fast momentum line🟣 EMA 48Medium trend filter🔴 EMA 200Major trend direction🔵 PDH/PDLPrevious day high & low zones🟠 PDH-2/PDL-22 days ago high & low zones
⏰ Session Filter
Only displays levels during regular trading hours (9:30 AM - 4:00 PM EST) to keep your chart clean during pre/post market.
📊 How to Use for Scalping
✅ Long Setup (2m/4m chart)
Price above EMA 200 (bullish bias)
Price pulls back to PDH/PDL zone or EMA 48
EMA 13 crosses above EMA 48
Enter on bounce from zone
Target: next resistance zone or 1:2 R/R
❌ Short Setup (2m/4m chart)
Price below EMA 200 (bearish bias)
Price rallies into PDH/PDL zone or EMA 48
EMA 13 crosses below EMA 48
Enter on rejection from zone
Target: next support zone or 1:2 R/R
💡 Pro Tips
TipWhy🔥 Trade the first hourMost volume & volatility🎯 Zone confluenceBest setups when PDH/PDL aligns with EMAs⚡ Quick exitsScalping = small gains, don't overstay🚫 Avoid chopSkip trades when price is stuck between zones📉 Respect EMA 200Don't long below it, don't short above it
🔵 Zone Colors Explained
Blue zones → Yesterday's high/low (stronger levels)
Orange zones → 2 days ago high/low (secondary levels)
Zone thickness → 20 ticks buffer for natural price noise
⚙️ Best Settings
TimeframeBest For2 minuteQuick scalps, 5-15 cent targets4 minuteSlightly larger moves, less noise
📌 Recommended Pairs
Works best on liquid stocks with tight spreads:
SPY, QQQ, AAPL, TSLA, AMD, NVDA, META, AMZN
⚠️ Risk Management
RuleSuggestion🛑 Stop lossBelow/above the zone (tight)🎯 Take profit1:2 or 1:3 risk/reward minimum📏 Position sizeMax 1-2% account risk per trade
🚀 Quick Start
Add indicator to 2m or 4m chart
Wait for price to reach a colored zone
Confirm trend direction with EMA 200
Look for EMA 13/48 alignment
Enter with tight stop, scale out at targets

Price Compression Scanner (Chartink Logic)Breakout above range high → BUY
🔹 Breakdown below range low → SELL
🔹 Best with volume expansion
🔹 Works well for swing trades & momentum breakouts
Highs
Highest High of last 10 days (ending 1 day agos) < Highest High of previous 10 days
Highest High of last 10 days < Highest High of earlier 10 days
➡️ Lower highs (falling resistance)
Lows
3. Lowest Low of last 10 days > Lowest Low of previous 10 days
4. Lowest Low of last 10 days > Lowest Low of earlier 10 days

Multi-Timeframe FVG (1H, 4H, Daily) - Color ShadesFVG charting in real time upon candle close. 1Hr, 4 Hr, Daily.
! hour darkest, 4 hour mid, daily lightest shade of color.

Dow Theory Cockpit [Analytics Pro]1. Overview and Key Features
The core philosophy of this tool is to "Eliminate market noise and pinpoint high-probability trade setups.
🤖 Triple-Logic Engine: Automatically detects three distinct strategies: Trend Following
(Breakout), Retracement (Dip), and Reversal (Sniper).
🛡️ Ironclad Protection: Features an ATR-based dynamic Stop Loss (SL). It automatically
positions your SL at levels resistant to "stop hunting" or market noise.
💰 Automatic Risk Management: The tool calculates and displays the optimal lot size based
on your SL distance, ensuring your risk amount remains constant regardless of market
volatility.
📊 Performance Visualization: Real-time Win Rate panel displaying data for "Today," "This
Month," "This Year," and "All Time.
🌍 Global Market Insights: Monitor not just your active chart, but also Gold, JPY, BTC, and
critical US/JP economic indicators (Interest Rates, Inflation, etc.) simultaneously.
2. Three Entry Signals
The tool automatically toggles between three optimized logics depending on market conditions
Signal Type Target & Strategy 🎯
SNIPER Reversal Captures "Tops and Bottoms." Detects RSI exhaustion + Bollinger
Band mean reversion to catch the start of a reversal.
DIP Trend Following Captures "Pullbacks." Picks up entries when price touches MAs or
retraces during a strong uptrend.
BREAK Trend Following Captures "Breakouts." Rides the momentum the moment price
breaks recent Highs or Lows.
💡 Pro Tip: When multiple conditions align, signals merge (e.g., "SNIPER & DIP") to keep
your chart clean and highlight high-conviction setups.
3. Dashboard Guide
The dual-panel interface is fully customizable in terms of visibility and placement.
① Main Analysis Panel (Default: Top Right)
In-depth analysis of the current currency pair.
・MAIN: Displays the pair and volatility status (HIGH VOL / NORMAL).
・Target RR: Your target Risk:Reward ratio (e.g., 1:1.5).
・🌊 Trend Monitor: Instantly check trend directions across 15M, 1H, 4H, and Daily timeframes.
・Strategic Note: When all timeframes align (Full Alignment), the signal is considered a "high-
probability" setup.
・📊 Win Rate: Tracks success rates and trade counts across four periods (Day, Mo, Yr, All).
・Risk: Shows current risk settings, spread, and account type.
② Market Scanner Panel (Default: Bottom Right)
Multi-market and fundamental surveillance.
・SCANNER: Constant monitoring of Gold, USDJPY, and Bitcoin. It alerts you immediately when
a trend or signal forms on these major assets.
・US/JP ECONOMY: Side-by-side comparison of essential fundamental data:
・Rate: Policy Interest Rates
・Inf%: Inflation (CPI)
・GDP: Economic Growth Rate
・Job: Unemployment / Payrolls
4. Trading Workflow
Follow these steps for the highest success rate:
1.STEP 1: Wait for SignalWait for the audio alert or the "BUY/SELL" label to appear.
Important: Never entry while the candle is still moving.
2.STEP 2: Filter ConfirmationJust before the candle closes, verify:
・MTF Panel: Are the 1H and 4H colors aligned with the signal? (Green for Buy, Red for Sell)
・MA Ribbon: Is the ribbon showing a clean, healthy spread?
3.STEP 3: Execution (At Candle Close)If the signal remains after the candle closes, enter at
the open of the next candle. Use the "Lot: X.XX" value shown on the blue label—this is your
safety-calculated lot size.
4.STEP 4: Exit Strategy (TP/SL)Immediately set your orders based on the lines on the chart:
・🟥 Red Line (SL): Positioned at 3x ATR to withstand noise.
・🟩 Green Line (TP): Optimized for consistent win rates.
5. Customization
・ : Set your Risk(%) per trade (Recommended: 1.0–2.0%). Adjust the SL Buffer (Default 3.0) to balance win rate versus lot size.
・ : Adjust font size (Tiny/Small/Normal) and panel width to fit your screen resolution.
・ : Customize colors and thickness to match your visual preference.

ABCD Harmonic Pattern Strategy (Bull + Bear) This script is a strategy implementation of the classic ABCD Harmonic Pattern, designed for market structure analysis, backtesting, and educational research.
The ABCD pattern is one of the foundational harmonic price patterns in technical analysis. Its Fibonacci ratio relationships were formalized and standardized within harmonic trading theory by Scott M. Carney, whose work helped define modern harmonic pattern rules.
This strategy is conceptually inspired by educational ABCD pattern logic shared by the TradingView author theEccentricTrader.
The code, structure, execution logic, filters, and risk management have been independently developed, reconstructed, and extended into a complete TradingView strategy.
What this strategy does
Detects bullish and bearish ABCD harmonic patterns based on price structure and Fibonacci ratios.
Reconstructs ABCD market structure logic for both directions instead of using a simple visual inversion.
Draws the ABCD legs, structure labels (A, B, C, D), and projection levels directly on the chart.
Generates long and short trade entries using confirmed ABCD structures.
Includes optional confluence filters, such as:
Higher-timeframe EMA trend filter
RSI strength filter
ATR volatility filter
Volume confirmation
Candle body confirmation
Minimum bounce distance from point D
Provides built-in risk management, including:
Configurable Stop Loss
Configurable Take Profit
Optional trailing stop
Designed for backtesting, parameter optimization, and analytical research.
Why this strategy is different
This script is not a simple indicator conversion nor a basic bullish/bearish mirror.
The ABCD pattern logic has been recreated at the structural level to better reflect how bullish and bearish market formations behave in real price action.
Key differences
Reconstructed bullish and bearish structures
Bullish and bearish ABCD patterns are independently defined using market structure logic, not just inverted visually.
Each direction has its own pivot relationships and validation rules to produce a more faithful representation of the ABCD pattern.
Structure-aware pattern validation
Pattern confirmation is based on price swings, structure continuity, and Fibonacci alignment, helping reduce distorted or forced patterns.
Strategy-based execution
Unlike indicator-only ABCD tools that only visualize patterns, this script uses strategy.entry and strategy.exit, enabling full backtesting and performance analysis.
Confluence-driven entries
Trade entries can require multiple confirmation layers beyond the pattern itself, helping reduce low-quality signals and overtrading.
Integrated risk management
Stop Loss, Take Profit, and optional trailing logic are applied consistently for both long and short positions.
Non-repainting design
Pattern detection and entries rely on confirmed bars (barstate.isconfirmed) and higher-timeframe data with lookahead_off, ensuring signals do not repaint historically.
Improved and controlled visualization
Pattern drawings, projections, and entry markers are managed with strict object limits to comply with TradingView performance and publishing requirements.
How to use
Add the strategy to a chart and select a symbol and timeframe.
Enable or disable filters under “Entry Filters (Confluence)”.
Configure Stop Loss, Take Profit, and trailing behavior under “TP/SL”.
Use pattern drawings and entry markers as visual and analytical confirmation, not as standalone trade signals.
Important notes
This script is provided for educational and research purposes only.
It does not provide financial or investment advice.
No profitability or performance is implied or guaranteed.
Past performance does not indicate future results.
Always test across multiple markets and timeframes and apply proper risk management.
Credits
ABCD Harmonic Pattern: Harmonic trading principles as formalized by Scott M. Carney.
Conceptual inspiration: Educational ABCD pattern logic shared by @theEccentricTrader on TradingView.
Pattern reconstruction, strategy logic, and risk management: Independent development.

Tableau Angle Pro - Complet Stable V2🇺🇸 ENGLISH DESCRIPTION
Angle Pro Dashboard — Multi-Timeframe (MTF) Momentum with Independent Calibration
OVERVIEW This indicator is a professional momentum analysis tool displaying MACD and KDJ dynamics across 7 simultaneous timeframes (from 30 seconds to 1 hour). It calculates the precise angle of indicators to help you measure real market velocity and trend conviction.
MAJOR UPDATE: INDEPENDENT CALIBRATION This version introduces Timeframe-Specific Calibration. You can now adjust the sensitivity of angles (DIF, DEA, J) individually for each interval. This feature allows you to normalize readings across different volatilities, ensuring a 45° angle on a 30s chart feels as significant as on a 1h chart.
KEY FEATURES
Multi-TF Dashboard: Monitor 30s, 1m, 3m, 5m, 15m, 30m, and 1h in one compact interface.
Precision Control: 7 dedicated setting groups to fine-tune indicator slopes per timeframe.
Angle Measurement: Displays slope in degrees. Steeper angles represent stronger momentum and trend strength.
Dynamic Color Coding: 6 intensity levels based on angle values.
Fully Customizable: Complete MACD/KDJ settings and a fully adjustable color palette.
TRADING INSIGHTS
Trend Cascade: Look for bright color alignment across multiple columns to confirm high-probability trend entries.
Fine-Tuning: Use the "Multi" settings in the calibration menus to increase or decrease sensitivity for specific timeframes based on the asset's current volatility.

CANSLIM Indicators plus FCF and stocks momentumThis is a comprehensive Trading View indicator that combines technical analysis with fundamental analysis to help you identify high-quality stock opportunities, inspired by IBD/CANSLIM methodology.
This indicator is an enhancement from @Fred6724 code base. Thanks @Fred6724 a lot!! With Claude assistance I enhanced to suit my need.
You now have a really powerful indicator that combines:
✅ Technical chart patterns (Cup, Double Bottom, Bases)
✅ Relative Strength analysis
✅ Complete fundamental dashboard with EPS, Sales, FCF, Margins, ROE
✅ Toggle ON/OFF the dashboard for clean charts
✅ Color-coded negative values
✅ Stock Bee momentum indicator
This is a professional-grade tool for finding high-quality growth stocks with strong fundamentals breaking out of proper bases. The FCF addition was done based on some model stocks study - it's one of the best indicators of real business quality!
First, I check for sales growth, if accelerating more good. Then if profitable(EPS) excellent, if not how is FCF.
With sales growth and FCF improving - you don't want to miss a strong monster stock - Study NYSE:CVNA and NASDAQ:ROOT
And finally— KISS . You don’t need to be a wizard of indicators or memorize every stock on the planet. Your real edge is staying simple: take clean setups, manage your risk like a pro, and let disciplined long‑term or swing trades compound your money.
If you need any other enhancements in the future, feel free to reach out. Happy trading! 📈

Supply & Demand (10-MTF) | StableThe Supply & Demand (10-MTF) indicator is a sophisticated technical analysis tool designed to identify high-probability institutional "buy" and "sell" zones across ten different timeframes simultaneously.
Core Functionality
The indicator works by scanning for displacement—sharp, aggressive price movements that leave behind "unfilled orders."
Zone Identification: It identifies a "Base" (the candle before the move) and a "Leg-out" (the momentum candles). If the leg-out meets your momentum strength requirements, a zone is drawn.
Multi-Timeframe Aggregation: Instead of switching between charts, a trader can see 1H Supply, 4H Demand, and Daily Supply zones all layered on a 5-minute chart.
Real-Time Invalidation: The indicator tracks whether price has "mitigated" (broken) a zone. Once a zone is breached by a wick or a close (depending on your settings), it can be hidden or marked as historic.
Why It’s Useful for Traders
1. Confluence Mapping (The "Nest" Strategy)
The most powerful use of this tool is finding Nested Zones. When a 15-minute Demand zone resides inside a 4-hour Demand zone, the probability of a reversal is significantly higher. This indicator makes these high-confluence areas visually obvious.
2. Institutional Footprint Tracking
Institutions do not buy or sell everything at once; they leave footprints in the form of supply and demand imbalances. This tool helps retail traders avoid "buying the top" or "selling the bottom" by showing where the big money actually entered the market.
3. Dynamic Stop Loss & Take Profit
Stop Loss: Traders can place stops just outside the structural boundary of a zone.
Take Profit: Traders can use the opposing HTF (Higher Timeframe) supply zone as a natural target for a long trade.
4. Time Efficiency
Managing 10 timeframes manually is mentally exhausting. This indicator automates the "top-down analysis" process, allowing you to focus on execution rather than chart flipping.

Chainbey Ai - Previous Day High & Low📌 Chainbey Ai – Previous Day High & Low (Source Candle)
This indicator automatically plots the Previous Day High (PDH) and Previous Day Low (PDL) on any intraday chart, starting from the exact candle where those levels were formed — not from the new day open. This removes visual gaps and gives a more accurate market structure view.
🔹 Key Features
✅ Accurate PDH & PDL levels based on the full previous trading day
🎯 Lines start from the actual high/low candle (no artificial gap)
🏷️ Optional PDH / PDL labels placed directly on source candles
🟦 Optional range background fill between PDH and PDL
📊 Works perfectly on 5m, 15m, 30m, 1H intraday charts
⚡ Lightweight, clean, and repaint-safe
🧠 Best Use Cases
Liquidity sweep & stop-hunt detection
Breakout vs fake-breakout analysis
Support / resistance from prior session
London & New York session bias confirmation
⚠️ Notes
Levels are calculated using the broker’s daily session
Designed for intraday trading, not daily/weekly charts

Cosmic Volume Analyzer [JOAT]
Cosmic Volume Analyzer - Astrophysics Edition
Overview
Cosmic Volume Analyzer is an open-source oscillator indicator that applies astrophysics-inspired concepts to volume analysis. It classifies volume into buy/sell categories, calculates volume flow, detects accumulation/distribution phases, identifies climax volume events, and uses gravitational and stellar mass analogies to visualize volume dynamics.
What This Indicator Does
The indicator calculates and displays:
Volume Classification - Categorizes each bar as CLIMAX_BUY, CLIMAX_SELL, HIGH_BUY, HIGH_SELL, NORMAL_BUY, or NORMAL_SELL
Volume Flow - Percentage showing buy vs sell pressure over a lookback period
Buy/Sell Volume - Separated volume based on candle direction
Accumulation/Distribution - Phase detection using Money Flow Multiplier
Volume Oscillator - Fast vs slow volume EMA comparison
Gravitational Pull - Volume-weighted price attraction metric
Stellar Mass Index - Volume ratio combined with price momentum
Black Hole Detection - Identifies extremely low volume periods (liquidity voids)
Supernova Events - Detects extreme volume with extreme price movement
Orbital Cycles - Sine-wave based cyclical visualization
How It Works
Volume classification uses volume ratio and candle direction:
classifyVolume(series float vol, series float close, series float open) =>
float avgVol = ta.sma(vol, 20)
float volRatio = avgVol > 0 ? vol / avgVol : 1.0
if volRatio > 1.5
if close > open
classification := "CLIMAX_BUY"
else
classification := "CLIMAX_SELL"
else if volRatio > 1.2
// HIGH_BUY or HIGH_SELL
else
// NORMAL_BUY or NORMAL_SELL
Volume flow separates buy and sell volume over a period:
calculateVolumeFlow(series float vol, series float close, simple int period) =>
float currentBuyVol = close > open ? vol : 0.0
float currentSellVol = close < open ? vol : 0.0
// Accumulate in buffers
float flow = (buyVolume - sellVolume) / totalVol * 100
Accumulation/Distribution uses the Money Flow Multiplier:
float mfm = ((close - low) - (high - close)) / (high - low)
float mfv = mfm * vol
float adLine = ta.cum(mfv)
if adLine > adEMA and ta.rising(adLine, 3)
phase := "ACCUMULATION"
else if adLine < adEMA and ta.falling(adLine, 3)
phase := "DISTRIBUTION"
Gravitational pull uses volume-weighted price distance:
gravitationalPull(series float vol, series float price, simple int period) =>
float massCenter = ta.vwma(price, period)
float distance = math.abs(price - massCenter)
float mass = vol / ta.sma(vol, period)
float gravity = distance > 0 ? mass / (distance * distance) : 0.0
Signal Generation
Signals are generated based on volume conditions:
Buy Climax: Volume exceeds 2 standard deviations above average on bullish candle
Sell Climax: Volume exceeds 2 standard deviations above average on bearish candle
Strong Buy Flow: Volume flow exceeds positive threshold (default 45%)
Strong Sell Flow: Volume flow exceeds negative threshold (default -45%)
Supernova: Volume 3x average AND price change 3x average
Black Hole: Volume 2 standard deviations below average
Dashboard Panel (Top-Right)
Volume Class - Current volume classification
Volume Flow - Buy/sell flow percentage
Buy Volume - Accumulated buy volume
Sell Volume - Accumulated sell volume
A/D Phase - ACCUMULATION/DISTRIBUTION/NEUTRAL
Volume Strength - Normalized volume strength
Gravity Pull - Current gravitational metric
Stellar Mass - Current stellar mass index
Cosmic Field - Combined cosmic field strength
Black Hole - Detection status and void strength
Signal - Current actionable status
Visual Elements
Volume Ratio Columns - Colored bars showing normalized volume
Volume Flow Line - Main oscillator showing flow direction
Flow EMA - Smoothed flow for trend reference
Volume Oscillator - Area plot showing fast/slow comparison
Gravity Field - Area plot showing gravitational pull
Orbital Cycle - Circle plots showing cyclical pattern
Stellar Mass Line - Line showing mass index
Climax Markers - Fire emoji for buy climax, snowflake for sell climax
Supernova Markers - Diamond shapes for extreme events
Black Hole Markers - X-cross for liquidity voids
A/D Phase Background - Subtle background color based on phase
Input Parameters
Volume Period (default: 20) - Period for volume calculations
Distribution Levels (default: 5) - Granularity of distribution analysis
Flow Threshold (default: 1.5) - Multiplier for flow significance
Accumulation Period (default: 14) - Period for A/D calculation
Gravitational Analysis (default: true) - Enable gravity metrics
Black Hole Detection (default: true) - Enable void detection
Stellar Mass Calculation (default: true) - Enable mass index
Orbital Cycles (default: true) - Enable cyclical visualization
Supernova Detection (default: true) - Enable extreme event detection
Suggested Use Cases
Identify accumulation phases for potential long entries
Watch for distribution phases as potential exit signals
Use climax volume as potential exhaustion indicators
Monitor volume flow for directional bias
Avoid trading during black hole (low liquidity) periods
Watch for supernova events as potential trend acceleration
Timeframe Recommendations
Best on 15m to Daily charts. Volume analysis requires sufficient trading activity for meaningful readings.
Limitations
Volume data quality varies by exchange and instrument
Buy/sell separation is based on candle direction, not actual order flow
Astrophysics concepts are analogies, not literal physics
A/D phase detection may lag during rapid transitions
Open-Source and Disclaimer
This script is published as open-source under the Mozilla Public License 2.0 for educational purposes. It does not constitute financial advice. Past performance does not guarantee future results. Always use proper risk management.
- Made with passion by officialjackofalltrades

Custom Weekly Volume Profile [Multi-Timeframe]Description: This indicator renders a high-precision Weekly Volume Profile that resets at the start of every trading week. Unlike standard fixed-range profiles, this script builds the profile bar-by-bar using lower timeframe data (e.g., 1-minute or 5-minute data) to ensure accuracy even on higher timeframe charts.
It is designed for traders who track the developing value of the current week (Auction Market Theory) and need specific alerts when price tests the edges of value.
Key Features:
Developing Weekly Profile:
The profile resets automatically at the beginning of the week (Sunday/Monday).
It tracks the Point of Control (POC), Value Area High (VAH), and Value Area Low (VAL) in real-time as the week progresses.
Previous Week Levels:
The script automatically stores the final levels (POC, VAH, VAL) of the previous week and projects them forward. This allows you to trade tests of the prior week's value.
Auto-Scaling Histogram:
Smart Width: The profile starts wider at the beginning of the week (when data is sparse) and automatically shrinks as the week progresses (Thursday/Friday) to keep your chart clean and readable.
Advanced Alerting:
Crossover Alerts: Trigger alerts when price crosses the developing VAH/VAL or the previous week's levels.
Time Window Filter: Includes a session input (default 08:30-15:00) to restrict alerts to specific trading hours, preventing notifications during low-volume overnight sessions.
Customization:
Precision: Adjustable "Row Size" and "Calculation Timeframe" to tune performance vs. accuracy.
Visuals: Full color control over the Value Area, Outer Volume, and Level Lines.
Settings:
Calculation Precision: Determines the lower timeframe used to calculate the volume (e.g., set to "5" for 5-minute precision).
Value Area %: Default is 70%, standard for AMT trading.
Timezone: Adjustable to ensure the weekly reset aligns with your local exchange time (e.g., America/Chicago for CME Futures).
Disclaimer: This script is for educational and informational purposes only. It does not constitute financial advice, trading recommendations, or a solicitation to buy or sell any financial instrument. Trading futures and other financial markets involves significant risk and is not suitable for every investor. Past performance of any trading system or methodology is not necessarily indicative of future results. The user assumes all responsibility for any trading decisions made based on the information provided by this tool. Use at your own risk.

Entropy Balance Oscillator [JOAT]
Entropy Balance Oscillator - Chaos Theory Edition
Overview
Entropy Balance Oscillator is an open-source oscillator indicator that applies chaos theory concepts to market analysis. It calculates market entropy (disorder/randomness), balance (price position within range), and various chaos metrics to identify whether the market is in an ordered, chaotic, or balanced state. This helps traders understand market regime and adjust their strategies accordingly.
What This Indicator Does
The indicator calculates and displays:
Entropy - Measures market disorder using return distribution analysis
Balance - Price position within the high-low range, normalized to -1 to +1
Lyapunov Exponent - Estimates sensitivity to initial conditions (chaos indicator)
Hurst Exponent - Measures long-term memory in price series (trend persistence)
Strange Attractor - Simulated attractor points for visualization
Bifurcation Detection - Identifies potential regime change points
Chaos Index - Combined entropy and volatility score
Market Phase - Classification as CHAOS, ORDER, or BALANCED
How It Works
Entropy is calculated using return distribution:
calculateEntropy(series float price, simple int period) =>
// Calculate returns and their absolute values
// Sum absolute returns for normalization
// Apply Shannon entropy formula: -sum(p * log(p))
float entropy = 0.0
for i = 0 to array.size(returns) - 1
float prob = math.abs(array.get(returns, i)) / sumAbs
if prob > 0
entropy -= prob * math.log(prob)
entropy
Balance measures price position within range:
calculateBalance(series float high, series float low, series float close, simple int period) =>
float range = high - low
float position = (close - low) / (range > 0 ? range : 1)
float balance = ta.ema(position, period)
(balance - 0.5) * 2 // Normalize to -1 to +1
Lyapunov Exponent estimates chaos sensitivity:
lyapunovExponent(series float price, simple int period) =>
float sumLog = 0.0
for i = 1 to period
float ratio = price > 0 ? math.abs(price / price ) : 1.0
if ratio > 0
sumLog += math.log(ratio)
lyapunov := sumLog / period
Hurst Exponent measures trend persistence:
H > 0.5: Trending/persistent behavior
H = 0.5: Random walk
H < 0.5: Mean-reverting behavior
Signal Generation
Phase changes and extreme conditions generate signals:
Chaos Phase: Normalized entropy exceeds chaos threshold (default 0.7)
Order Phase: Normalized entropy falls below order threshold (default 0.3)
Extreme Chaos: Entropy exceeds 1.5x chaos threshold
Extreme Order: Entropy falls below 0.5x order threshold
Bifurcation: Variance exceeds 2x average variance
Dashboard Panel (Top-Right)
Market Phase - Current phase (CHAOS/ORDER/BALANCED)
Entropy Level - Normalized entropy value
Balance - Current balance reading (-1 to +1)
Chaos Index - Combined chaos score percentage
Volatility - Current price volatility
Lyapunov Exp - Lyapunov exponent value
Hurst Exponent - Hurst exponent value
Chaos Score - Overall chaos assessment
Status - Current market status
Visual Elements
Entropy Line - Main oscillator showing normalized entropy
Entropy EMA - Smoothed entropy for trend reference
Balance Area - Filled area showing balance direction
Chaos/Order Thresholds - Horizontal dashed lines
Lyapunov Line - Step line showing Lyapunov exponent
Strange Attractor - Circle plots showing attractor points
Phase Space - Line showing phase space reconstruction
Phase Background - Background color based on current phase
Extreme Markers - X-cross for extreme chaos, diamond for extreme order
Bifurcation Markers - Circles at potential regime changes
Input Parameters
Entropy Period (default: 20) - Period for entropy calculation
Balance Period (default: 14) - Period for balance calculation
Chaos Threshold (default: 0.7) - Threshold for chaos phase
Order Threshold (default: 0.3) - Threshold for order phase
Lyapunov Exponent (default: true) - Enable Lyapunov calculation
Hurst Exponent (default: true) - Enable Hurst calculation
Strange Attractor (default: true) - Enable attractor visualization
Bifurcation Detection (default: true) - Enable bifurcation detection
Suggested Use Cases
Identify market regime for strategy selection (trend-following vs mean-reversion)
Watch for phase changes as potential trading environment shifts
Use Hurst exponent to assess trend persistence
Monitor chaos index for volatility regime awareness
Avoid trading during extreme chaos phases
Timeframe Recommendations
Best on 1H to Daily charts. Chaos metrics require sufficient data for meaningful calculations.
Limitations
Chaos theory concepts are applied as analogies, not rigorous mathematical implementations
Lyapunov and Hurst calculations are simplified approximations
Strange attractor visualization is conceptual
Bifurcation detection uses variance as proxy
Open-Source and Disclaimer
This script is published as open-source under the Mozilla Public License 2.0 for educational purposes. It does not constitute financial advice. Past performance does not guarantee future results. Always use proper risk management.
- Made with passion by officialjackofalltrades

Buy / Sell Volume HeaderBuy / Sell Volume Header
Description
- Buy / Sell Volume Header displays real-time buying and selling volume with percentages in a clean dashboard at the top or bottom of your chart. The indicator calculates buying pressure as volume weighted toward the close relative to the bar's range, and selling pressure as volume weighted toward the high.
- Perfect for day traders and scalpers who need instant visual confirmation of buying vs selling pressure without cluttering their chart with additional panes.
Key Features:
- Real-time buy/sell volume split with percentages
- Customizable lookback period (1 bar for current, or sum multiple bars)
- Adjustable table position (top/bottom, left/center/right)
- Five size options (Tiny to Huge)
- Color-coded: Green (buying volume), Red (selling volume)
- Clean, minimal design that doesn't obstruct price action
Calculation Method:
- Buying Volume = Total Volume × (Close - Low) / (High - Low)
- Selling Volume = Total Volume × (High - Close) / (High - Low)
How to Use:
- Select header location (default: Top Right) and table size (default: Normal). Set lookback period to 1 for current bar only, or higher values to see cumulative volume over multiple bars.
Reading the Display:
- Green Box (Left): Buying volume and percentage of total
- Red Box (Right): Selling volume and percentage of total
- Numbers update in real-time on every tick
Trading Applications:
- Trend Confirmation:
- In uptrends, buying volume should consistently be >60%.
- In downtrends, selling volume should be >60%. Divergences warn of potential reversals.
Breakout Validation:
- Valid breakouts show 70%+ volume in breakout direction.
- Breakouts with <55% directional volume often fail.
Reversal Signals:
- When price makes new high but buying volume drops below 50%, watch for reversal. When price makes new low but selling volume drops below 50%, watch for bounce.
Scalping Entry:
- Enter long when buying volume spikes above 65-70% with price momentum. Enter short when selling volume spikes above 65-70% with price momentum.
Best Practices:
- Use lookback=1 for intraday scalping. Use lookback=3-5 for swing context. Combine with price action for confirmation. Volume percentages work best on liquid instruments (MNQ, MES, stocks with high volume).
NPR21
Disclaimer
The information and publications are not meant to be, and do not constitute, financial, investment, trading, or other types of advice or recommendations supplied or endorsed by TradingView.
