Day Color CandlesThe script uses TradingView’s built-in dayofweek value (where Monday = 1 and Sunday = 7) to detect the current bar’s weekday.
For each weekday, a specific color is assigned — green for Monday, blue for Tuesday, purple for Wednesday, orange for Thursday, yellow for Friday, gray for Saturday, and red for Sunday.
Instead of plotting new candles, the script uses barcolor() to recolor the existing chart candles. This avoids conflicts with TradingView’s rule that a script may contain only one main declaration. The price data remains unchanged — only the visual appearance of the candles is modified to help the user visually separate trading days.
Cari skrip untuk "candle"

Momentum Candle V3 by Sekolah TradingMomentum Candle v3 by Sekolah Trading
Description:
Momentum Candle v3 is a technical indicator designed to identify market momentum signals based on price movement within a single candle. The indicator measures the size of the candle's body and wick to determine if the market is showing strong bullish or bearish momentum.
Key Features:
Candle Size: Measures price movement within a single candle to assess market momentum.
Short Wick: Focuses on wick length, with short wicks indicating that the closing price is more significant than the opening price.
Bullish/Bearish Momentum: Provides bullish signals when the closing price is higher than the open, and bearish signals when the closing price is lower than the open.
Customizable Minimum Body: Users can adjust the minimum body size for XAUUSD and USDJPY pairs according to their trading preferences.
Timeframe: Works on M5 and M15 timeframes for XAUUSD and USDJPY currency pairs.
How to Use:
Bullish Signal: The indicator signals bullish momentum when the candle body is sufficiently large and the wick is short, with the closing price higher than the open.
Bearish Signal: The indicator signals bearish momentum when the candle body is sufficiently large and the wick is short, with the closing price lower than the open.
Pip Parameters: Adjust the pip values for XAUUSD and USDJPY according to market conditions or your trading preferences.
Note: This indicator is a tool for technical analysis and does not guarantee specific trading results. It is recommended to use it alongside other strategies and analyses for better accuracy.
Realistic Backtest Results:
To ensure transparency and honesty in the backtest, here are some key factors to consider:
Position Size: The backtest uses a realistic position size of about 5-10% of the account equity per trade.
Commission & Slippage: A commission of 0.1% per trade and slippage of 1 pip were used in the backtest simulation to reflect real market conditions.
Number of Trades: The backtest sample includes more than 100 trades for a representative result.
Example of Backtest Results:
Profitability: The backtest results on XAUUSD and USDJPY show consistent performance with this strategy on the M5 and M15 timeframes.
Commission and Slippage: Adjusting for commission and slippage showed better accuracy under more realistic market scenarios.
How to Use the Indicator:
Signals from this indicator can be used to confirm market momentum in trending conditions. However, it is highly recommended to combine this indicator with other technical analysis tools to minimize the risk of false signals.
Important Notes:
Honesty & Transparency: This indicator is designed to provide signals based on technical analysis and does not guarantee specific trading results.
No Over-Claims: The backtest results displayed represent realistic scenarios and are not intended to promise certain profits.
Original Content: The code for this indicator is original and does not violate any copyrights.
Tagging:
Smart Tags: Momentum, Candle, XAUUSD, USDJPY, Bullish, Bearish, M5, M15, Technical Indicator, Market Momentum.

HTF Candles & Levels Visualizer - SRHTF Candles & Levels Visualizer is a clean higher‑timeframe visualization tool designed to complement any trading strategy by giving clear context of larger‑TF structure directly on your current chart. It plots the previous high and low for up to three user‑selectable timeframes, and draws them as extended levels with optional labels, making it easy to see where current price sits relative to key higher‑timeframe zones.
The script also renders compact proxy candles for each selected timeframe to the right of current price, so you can visually track HTF candle development without switching charts. Each HTF slot has independent settings: timeframe, color, number of displayed candles, and visibility toggles, along with global controls for line style, label size, candle spacing, and colors.
This tool does not generate trading signals; it focuses purely on multi‑timeframe context and market structure visualization to support your own entries, exits, and risk management.

RTH vs ETH Candle StylingRTH vs ETH Candle Styling — Clean Session-Based Candle Filters
This indicator restyles the chart’s candles based on session type:
🟩 RTH (Regular Trading Hours — 09:30 to 16:00 EST)
RTH candles display normal, full-color price action, showing momentum clearly during the primary US session.
⬛ ETH (Extended Hours Trading)
All ETH candles are converted into hollow, black-outline candles, with:
Transparent bodies
Black borders
Black wicks
This creates an immediate visual separation between overnight price action (ETH) and the high-liquidity RTH session—reducing noise and helping traders focus on true market structure.
🔥 Why Use This?
Cleaner chart during overnight chop
Easy to distinguish RTH orderflow from ETH drift
Enhances gap logic, session deviations, and liquidity mapping
Makes your main RTH setups stand out instantly
⚙ Inputs
Adjustable RTH session (default: 09:30–16:00 EST)
Adjustable timezone (default: America/New_York)
GLOBAL SETTINGS TO CHANGE-Change-settings-symbol-candles-uncheck all

1h Hollow Candle on 5m - SSThis indicator displays 1-hour candles on a 5-minute chart using a clean, minimal visual style designed for intraday traders who want to track higher-timeframe structure without cluttering the chart.
The higher-timeframe (HTF) candles are drawn as hollow outlines, which makes them easy to read while keeping the underlying 5-minute price action fully visible. Each 1-hour candle includes:
Wicks (high & low)
Open/close borders
Color-coded direction (green = bullish, red = bearish)
Transparent body so they never block real candles
This is ideal for traders who want to:
Identify HTF structure during scalping
Spot key reversals inside hourly candles
Track premium/discount zones relative to each 1h candle
Improve top-down analysis without switching timeframes

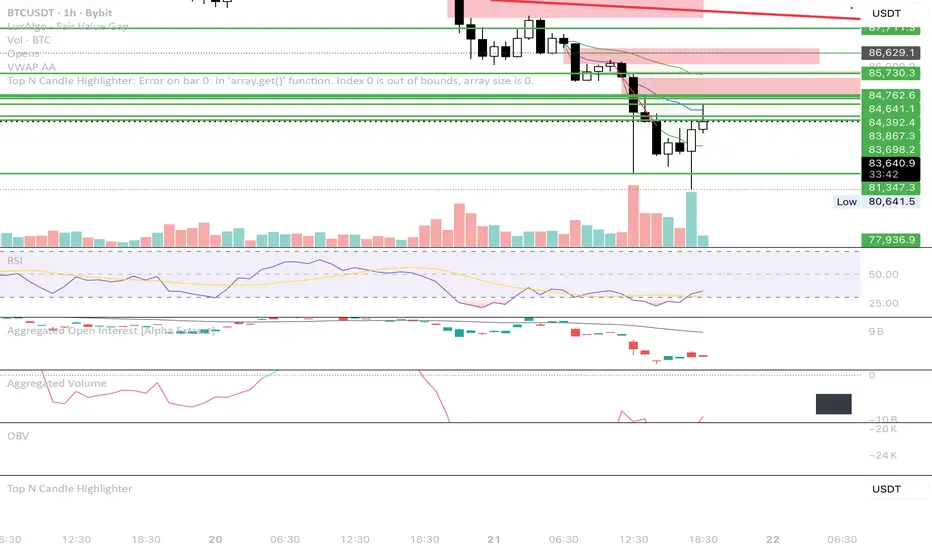
Top N Candle HighlighterTrack highest candle sizes on current timeframes. This short script:
1. Tracks the **top N largest candles** on the current chart
2. Option to use **body size** or **full candle range**
3. Highlights candles using `box.new()` (fully v6 compatible)
4. Optionally shows **rank and size labels**
5. Handles red, green, and doji candles differently with color
Volume Biased CandlesVolume Biased Candles
This indicator visualizes the underlying volume polarity of price action by coloring candles based on directional volume bias over a rolling bucket of bars.
Instead of reading price alone, each candle reflects whether buying or selling pressure has dominated within its recent volume structure — giving a more intuitive picture of volume sentiment beneath price movement.
🔹 How it works
Bucket Size (n) → defines how many candles are aggregated to evaluate directional volume bias
For each bucket, total up-volume and down-volume are compared to determine overall market pressure
Volume Bias Score → a continuous ratio from -1 to +1, representing the relative dominance of buyers or sellers
Candles are colored according to the active bias — green for positive (buying), red for negative (selling)
🔹 Use cases
Visualize shifts in market control without needing divergence overlays
Combine with delta divergence or price structure tools to validate entries and exits
Simplify volume and price insights into an intuitive, single-chart visualization
✨ Volume Biased Candles transforms standard candles into a live sentiment gauge, revealing whether the dominant flow behind price movement is bullish or bearish.

Apex Edge – HTF Overlay Candles“Trade your 5m chart with the eyes of the 1H — Apex Edge brings higher-timeframe structure and liquidity sweeps directly onto your execution chart.”
Apex Edge – HTF Overlay Candles
The Apex Edge – HTF Overlay Candles indicator overlays higher-timeframe (HTF) candles directly onto your lower-timeframe chart. Instead of flipping between timeframes, you see HTF structure “breathe” live on your execution chart.
What It Does
• HTF Body Boxes → open/close zones drawn as semi-transparent rectangles.
• HTF Wick Boxes → high/low extremes projected as envelopes around each body.
• Midpoint Line → a dynamic equilibrium line that flips bias as price trades above or below.
• Sweep Arrows → one-time markers showing the first liquidity raid at HTF highs or lows.
Under the Hood
This isn’t just a visual overlay — it’s engineered for accuracy and performance in PineScript.
1. HTF Data Retrieval
• Uses request.security() to import open, high, low, close, time from any selected HTF.
• lookahead=barmerge.lookahead_off ensures OHLC values update bar by bar as the HTF
candle builds.
• When the HTF bar closes, boxes and midpoint lock to historical values — matching the
native HTF chart exactly.
2. Box Construction
• Body box: built from HTF open → close.
• Wick box: built from HTF high → low.
• Boxes extend dynamically across each HTF period, updating in real time, then freeze at
close.
3. Midpoint Logic
• (htfOpen + htfClose) / 2 calculates intrabar midpoint.
• Line drawn edge-to-edge across the active HTF body.
• Style, width, color, and opacity are user-controlled.
4. Sweep Detection
• Flags (sweepedHigh / sweepedLow) prevent clutter: only the first tap per side per HTF
candle is marked.
• Lower-timeframe price breaking the HTF high/low triggers the sweep arrow.
• Arrows are offset above/below wick envelopes for clean visuals.
5. Customisation
• Every layer (body, wick, midpoint, arrows) has independent color + opacity settings.
• Arrow size, arrow color, and transparency are adjustable.
• Default HTF = 1H (perfect for 5m/15m traders) but can be switched to 30m, 4H, Daily,
etc.
Why It’s Useful
• HTF intent + LTF execution without chart hopping.
• Liquidity mapping: see where liquidity is swept in real time.
• Bias clarity: midpoint line defines HTF equilibrium.
• Clean signals: only the first sweep prints — no spam.
What Makes It Different
Most MTF overlays just plot candles or single lines. This tool:
• Splits body vs wick zones for institutional precision.
• Updates live intrabar (no repainting).
• Highlights liquidity sweeps clearly.
• Built for readability and professional use — not another retail signal toy.
Cheat-Sheet Playbook
1️⃣ Structure Bias
• Above midpoint line = bullish intent.
• Below midpoint line = bearish intent.
• Chop around midpoint = no clear direction.
2️⃣ Liquidity Sweeps
• ▲ Green up arrow below wick box = sell-side liquidity taken → watch for longs.
• ▼ Red down arrow above wick box = buy-side liquidity taken → watch for shorts.
• First sweep is the cleanest.
3️⃣ Trade Logic
• Body box = where institutions transact.
• Wick box = liquidity traps.
• Midpoint = bias filter.
• Best setups occur when sweep + midpoint flip align.
4️⃣ Example (5m + 1H Overlay)
1. ▲ Green up arrow prints below HTF wick.
2. Price reclaims the body box.
3. Midpoint flips to support.
4. Enter long → stop below sweep → targets = midpoint first, opposite wick second.
In short:
• Boxes = structure
• Wicks = liquidity pools
• Midpoint = bias line
• Arrows = liquidity sweeps
This is your SMC edge on one chart — HTF structure and liquidity fused directly into your execution timeframe.

Hilly's Reversal Scalping Strategy - 5 Min CandlesHow to Use
Copy the Code: Copy the script above.
Paste in TradingView: Open TradingView, go to the Pine Editor (bottom of the chart), paste the code, and click “Add to Chart.”
Set Timeframe: Ensure the chart is set to 5-minute candles (TradingView: right-click chart > Timeframe > 5 Minutes).
Check for Errors: Verify no errors appear in the Pine Editor console.
Apply to Chart: Use a liquid crypto pair (e.g., BTC/USDT, ETH/USDT on Binance or Coinbase).
Verify Signals:
Green “BUY” labels and triangle-up arrows for bullish reversals (e.g., bullish engulfing, hammer, doji, morning star, three white soldiers, double bottom in a downtrend).
Red “SELL” labels and triangle-down arrows for bearish reversals (e.g., bearish engulfing, shooting star, doji, evening star, three black crows, double top in an uptrend).
Green/red background highlights for signal candles.
Backtest: Use TradingView’s Strategy Tester to evaluate performance over 1–3 months, checking Net Profit, Win Rate, and Drawdown.
Demo Test: Run on a demo account to confirm signal visibility and performance before trading with real funds.
Troubleshooting
If Errors Occur: If any errors appear in TradingView’s Pine Editor console (e.g., “Syntax error” or “Invalid argument”), please share the exact error messages to diagnose environment-specific issues.
Signal Overload: If too many signals appear, increase patternLookback to 15 or set volFilter = volume > volMa * 2.0.
Missed Signals: If signals are too rare, set useVolumeFilter=false or reduce patternLookback to 5.
Additional Features: If you need alerts, other indicators (e.g., EMA, RSI), or dynamic arrow sizing, please specify. Note that dynamic sizing caused errors previously, so I’ve kept size=size.normal.

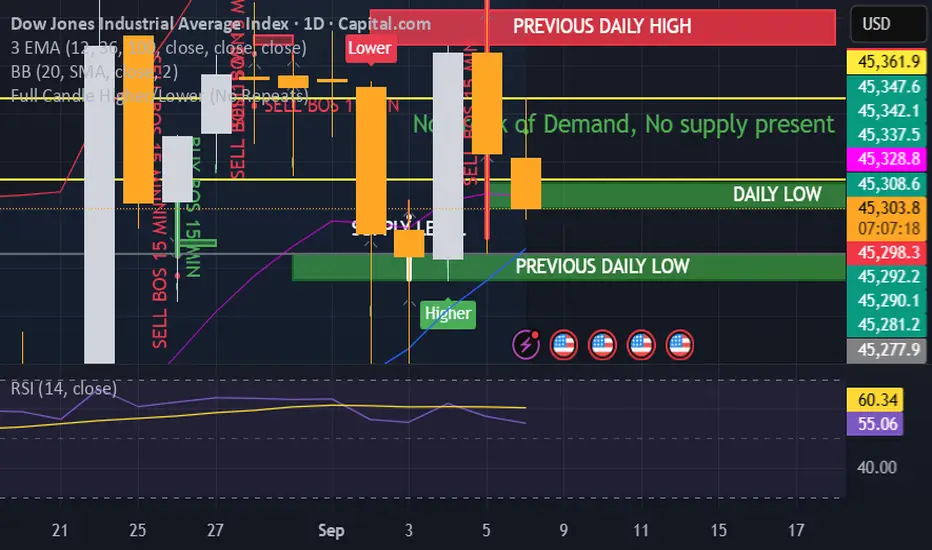
Full Candle Higher/Lower (No Repeats)🔎 What the Script Does (Pine Script v6)
Keeps track of the last signal
Uses a persistent variable lastSignal (initialized once as "none").
Ensures that if a signal repeats consecutively, it won’t be triggered again.
Defines the conditions for a “Higher” or “Lower” candle sequence
Higher condition:
Current close > previous high, AND previous low ≤ the high of two bars ago.
→ This means the candle has fully broken higher.
Lower condition:
Current close < previous low, AND previous high ≥ the low of two bars ago.
→ This means the candle has fully broken lower.
Checks for new signals only
If a candle meets the condition and the last signal wasn’t the same, a new signal is triggered.
Updates lastSignal to prevent repeats.
Plots labels/arrows
A “Higher” signal shows a green label below the bar.
A “Lower” signal shows a red label above the bar.
Sets alerts
So you can be notified in TradingView whenever a “Higher” or “Lower” flag is detected.
📊 Trading Logic in Words
The indicator is looking for full candle breakouts.
If a candle closes above the previous high (with some confirmation from older bars), it flags it as a “Higher” signal.
If a candle closes below the previous low (with similar confirmation), it flags it as a “Lower” signal.
It avoids duplicate consecutive signals by remembering what the last one was.
✅ Why It’s Useful
Helps traders spot momentum continuation candles (strong push candles).
Reduces noise by not repeating the same signal multiple times in a row.
Works like a breakout detector that tells you when the market is making a new leg up or new leg down.
50% of Previous 1H Candle (Color Logic)📌 Script Title: 50% Midpoint of Previous 1H Candle (Color Coded)
📝 Description:
This indicator draws a horizontal line at the 50% (midpoint) of the most recently closed 1-hour candle, helping traders visualize intraday support/resistance and sentiment bias.
🔹 Key Features:
Plots the midpoint of the last 1H candle as a horizontal line.
Color-coded line and label:
🟢 Green: Previous candle was bullish
🔴 Red: Previous candle was bearish
⚪ Gray: Neutral (doji or equal open/close)
Displays the exact price level with a floating label.
Works on any lower timeframe chart (e.g., 5m, 15m, 30m).
Automatically updates every hour after the 1H candle closes.
📈 Use Cases:
Trade around the 1H midpoint as a dynamic pivot zone.
Confirm or fade price breakouts/rejections at this level.
Use it with trendlines, supply/demand zones, or VWAP.
🔍 Technical Notes:
The midpoint is calculated using:
Midpoint = (High + Low) / 2
from the most recent closed 1H candle.
Color logic is based on whether the 1H candle closed above or below its open.
🚀 Enhancement Ideas (future updates):
Add optional alerts on cross of the midpoint.
Show multiple historical midpoint levels.
Input toggle to enable/disable color coding.
Whether you’re scalping intraday or watching for reaction zones, this tool gives you a clean, real-time level to anchor your trades around.
Happy trading! 💹
— Built with ❤️ in Pine Script v6

VWMA CandlesVWMA Candles – Smarter Candle Coloring with Volume Awareness
This indicator enhances your chart candles by showing their relationship to the Volume-Weighted Moving Average (VWMA). It visually integrates the VWMA and price action, making it easier to spot momentum shifts, value zones, and price interaction with volume-weighted levels. I saw this indicator idea from TrendSpider on threads and decided to try and make my own. This is my first publicly shared script so go easy on me!
IN ORDER FOR THE COLOR CODING TO WORK PROPERLY, YOU MUST:
GO TO -> CHART SETTINGS -> SYMBOLS AND DISABLE BODIES, BORDERS, AND WICKS.
How it works:
The VWMA is plotted on your chart with a customizable band around it.
Candles change color depending on their position relative to the VWMA and its band:
Green → Price is above the VWMA (bullish bias).
Orange → Price is near or touching the VWMA/band (potential reaction zone).
Red → Price is below the VWMA (bearish bias).
You can choose between custom candles (full plotcandle styling) or simply recolor your existing chart candles with barcolor.
Customization options:
Select how the band is calculated: by % of VWMA, ATR multiple, or Ticks/Points.
Adjust colors separately for candle body, wick, and border.
Choose to show/hide the VWMA line and the band fill.
Fine-tune transparency for a clean look on any chart background.
Why traders use it:
Quickly spot when price is stretched away from the VWMA (overextended conditions).
Identify when candles are interacting with the VWMA (potential support/resistance).
Add volume-sensitivity to your trend analysis compared to standard moving averages.
Authors Note: The default settings work well with stocks on the weekly timeframe, although this can be used on any timeframe. The settings are highly adjustable for you to tune it to your liking.

HTF Candles [theUltimator5]Overlay higher timeframe candles on any lower timeframe chart with real-time updates.
This indicator displays the full structure of each higher timeframe (HTF) candle—including open-close bodies and full wicks—directly on your current chart. Great for multi-timeframe traders who want to align short-term entries with broader market context.
🔹 Features:
View higher timeframe candles (e.g., 1H, 4H, Daily) on intraday charts
Dynamic candle bodies that update in real-time
Accurate wick representation with auto-redrawing
Customizable bullish/bearish colors and transparency
Efficient object management for minimal clutter
🛠️ How to Use:
Add this indicator to a lower timeframe chart (e.g., 1m, 5m, or 15m).
Select a higher timeframe (must be greater than your chart timeframe).
Customize your candle colors and transparency for better visibility.
Watch as each higher timeframe candle evolves live with every bar.
📌 Example: Use a 5-minute chart with a 1-hour HTF overlay to track hourly market structure without switching timeframes.

HTF OHLC Candle + 50% @MaxMaseratiHTF OHLC Candle + 50% @MaxMaserati
This advanced multi-timeframe indicator displays higher timeframe OHLC data as visual candle boxes and extended key levels on lower timeframe charts, providing essential context for institutional trading decisions.
Core Functionality:
Multi-Timeframe Box Display:
Main Timeframe Box (Default H4): Shows complete higher timeframe candles as colored boxes with separate body and wick visualization, including bullish (green) and bearish (red) candle representation with customizable transparency levels.
Independent Box 2 (Default M15): Secondary timeframe display with lime/fuchsia color scheme, allowing traders to monitor intermediate timeframes simultaneously with different visual styling.
Independent Box 3 (Default H1): Third independent timeframe with blue/orange color scheme, providing additional context for multi-timeframe analysis and confluence identification.
OHLC Level Analysis:
Each timeframe box includes individual Open, High, Low, and Close level lines with customizable colors and visibility settings. These levels act as key support and resistance zones that institutional traders often respect.
50% Retracement Levels:
Automatic calculation and display of 50% levels between each timeframe's high and low, representing critical equilibrium zones where price often finds support or resistance during retracements.
Extended Line System:
Current Live Timeframe Extended Lines: Real-time extension of the forming candle's Open, High, Low, and 50% levels with customizable line weights and label positioning.
TF2 Extended Lines (Default H4): Previous completed candle's key levels extended forward, showing immediate higher timeframe reference points for current price action.
TF3 Extended Lines (Default Daily): Longer-term reference levels from daily or weekly timeframes, providing macro trend context and major institutional levels.
Key Features:
Smart Timeframe Detection: Only displays boxes for timeframes higher than the current chart timeframe, preventing redundant information and maintaining chart clarity.
Global Box Limit Control: Intelligent cleanup system that maintains optimal performance by limiting total displayed elements while preserving the most recent and relevant timeframe periods.
Comprehensive Customization: Full control over colors, transparency, line weights, label sizes, and visibility for each timeframe component, allowing personalized setups for different trading styles.
Label System: Automatic timeframe identification labels (H4, M15, D1, etc.) positioned on each box for instant timeframe recognition and clear multi-timeframe organization.
Current Candle Options: Optional display of forming/current candles for each timeframe, enabling real-time monitoring of developing price action and potential setup completion.
This indicator is essential for traders utilizing multi-timeframe analysis, institutional trading concepts, and higher timeframe confluence strategies, providing clear visual representation of key levels and candle structures that drive major market movements.

Digital Clock with Candle Alert📊 Digital Clock with Candle Alert
A sleek, customizable digital clock for your trading charts that displays real-time with seconds and provides visual alerts before new candles form. Never miss a candle entry again!
✨ Key Features:
- Real-time Digital Clock - Shows hours, minutes, and seconds in your chosen timezone
- Visual Candle Alerts - Blinking notification before new candles form
- Multi-Timeframe Alerts - Get alerts for any timeframe regardless of your chart period
- Fully Customizable - Colors, size, position, and alert timing all configurable
- Half-Second Blinking - Eye-catching 2Hz blink rate for maximum visibility
- 6 Timezone Options - Exchange, UTC, New York, London, Tokyo, Sydney
🎯 Use Cases:
- Scalping - Know exactly when the next candle will form
- Entry Timing - Perfect for strategies that enter on new candles
- Multi-Timeframe Trading - Monitor higher timeframe candles while on lower timeframes
- General Awareness - Always know the current time in your trading timezone
⚙️ Settings:
Time Settings:
- Timezone selection (Exchange default or specific zones)
Display Options:
- Text and background colors for normal operation
- Alert colors for blinking state
- Text size (tiny to huge)
- Position (9 locations on chart)
Alert Configuration:
- Enable/disable blinking alerts
- Select timeframe to monitor
- Alert lead time (5 seconds to 1 hour)
📝 Important Notes:
- Clock updates depend on incoming price ticks
- During low-volume periods, updates may be less frequent
- Works best on liquid instruments during active market hours
- Alert timeframe is independent of your chart timeframe
💡 Tips:
- Use contrasting alert colors for maximum visibility
- Set lead time based on your reaction needs
- Position clock where it won't obstruct price action
- Try red background with white text for urgent alerts
🔄 Version 1.0 - Initial release

50/100 EMA Crossover with Candle Confirmation📘 **50/100 EMA Crossover with Candle Confirmation – Strategy Description**
The **50/100 EMA Crossover with Candle Confirmation** is a trend-following strategy designed to filter high-probability entries by combining exponential moving average (EMA) crossovers with strong price action confirmation. This strategy aims to reduce false signals commonly associated with EMA-only systems by requiring a **candle close confirmation in the direction of the trend**, making it more reliable for intraday or swing trading across Forex, crypto, and stock markets.
---
### 🔍 **Core Logic**
* The strategy is based on the interaction of the **50 EMA** (fast-moving average) and the **100 EMA** (slow-moving average).
* **Trend direction** is determined by the crossover:
* **Bullish Trend**: When the 50 EMA crosses **above** the 100 EMA.
* **Bearish Trend**: When the 50 EMA crosses **below** the 100 EMA.
* To **filter out false breakouts**, a **candle confirmation** is used:
* For a **Buy signal**: After a bullish crossover, wait for a strong bullish candle (e.g., full-body green candle) to **close above both EMAs**.
* For a **Sell signal**: After a bearish crossover, wait for a strong bearish candle to **close below both EMAs**.
---
### ✅ **Entry Conditions**
**Buy Entry:**
* 50 EMA crosses above 100 EMA.
* Latest candle closes **above both EMAs**.
* Candle must be bullish (green/full body preferred).
**Sell Entry:**
* 50 EMA crosses below 100 EMA.
* Latest candle closes **below both EMAs**.
* Candle must be bearish (red/full body preferred).
---
### 🛑 **Exit or Take-Profit Options**
* **Fixed TP/SL**: 1:2 or 1:3 risk-reward.
* **Trailing Stop**: Based on recent swing highs/lows or ATR.
* **EMA Exit**: Exit trade when the candle closes on the opposite side of 50 EMA.
---
### ⚙️ **Best Settings**
* **Timeframes**: 5M, 15M, 1H, 4H (works well on most).
* **Markets**: Forex, Crypto (e.g., BTC/ETH), Indices (e.g., NASDAQ, NIFTY50).
* **Recommended filters**:
* Use with RSI divergence or volume confirmation.
* Avoid using during high-impact news (especially on lower timeframes).
---
### 🧠 **Why This Works**
The 50/100 EMA crossover provides a **medium-term trend signal**, reducing noise seen in fast EMAs (like 9 or 21). The candle confirmation adds a **momentum filter**, ensuring price supports the directional bias. This makes it suitable for traders who want a balance of trend and entry precision without overcomplicating with too many indicators.
---
### 📈 **Advantages**
* Simple yet effective for identifying trends.
* Filters out fakeouts using candle confirmation.
* Easy to automate in Pine Script or other trading bots.
* Can be combined with support/resistance or SMC zones for better confluence.
---
### ⚠️ **Limitations**
* May lag slightly in ranging markets.
* Late entries possible due to confirmation candle.
* Works best with additional volume or volatility filter.

IU Inside/Harami candlestick patternDESCRIPTION
The IU Inside/Harami Candlestick Pattern indicator is designed to detect bullish and bearish inside bar formations, also known as Harami patterns. This tool gives users flexibility by allowing pattern detection based on candle wicks, bodies, or a combination of both. It highlights detected patterns using colored boxes and optional text labels on the chart, helping traders quickly identify areas of consolidation and potential reversals.
USER INPUTS :
Pattern Recognition Based on =
Choose between "Wicks", "Body", or "Both" to determine how the inside candle pattern is identified.
Show Box =
Toggle the appearance of colored boxes that highlight the pattern zone.
Show Text =
Toggle on-screen labels for "Bullish Inside" or "Bearish Inside" when patterns are detected.
INDICATOR LOGIC :
Bullish Inside Bar (Harami) is detected when:
* The current candle's high is lower and low is higher than the previous candle (wick-based),
* or the current candle’s open and close are inside the previous candle’s body (body-based),
* and the current candle is bullish while the previous is bearish.
Bearish Inside Bar (Harami) is detected when:
* The current candle's high is lower and low is higher than the previous candle (wick-based),
* or the current candle’s open and close are inside the previous candle’s body (body-based),
* and the current candle is bearish while the previous is bullish.
The user can choose wick-based, body-based, or both logics for pattern confirmation.
Boxes are drawn between the highs and lows of the pattern, and alert messages are generated upon confirmation.
Optional labels show the pattern name for quick visual identification.
WHY IT IS UNIQUE :
Offers three different logic modes: wick-based, body-based, or combined.
Highlights patterns visually with customizable boxes and labels.
Includes built-in alerts for immediate notifications.
Uses clean and transparent plotting without repainting.
HOW USER CAN BENEFIT FROM IT :
Receive real-time alerts when Inside/Harami patterns are formed.
Use the boxes and text labels to spot price compression zones and breakout potential.
Combine it with other tools like trendlines or support/resistance for enhanced accuracy.
Suitable for scalpers, swing traders, and price action traders looking to trade inside bar breakouts or reversals.
DISCLAIMER :
This indicator is not financial advice, it's for educational purposes only highlighting the power of coding( pine script) in TradingView, I am not a SEBI-registered advisor. Trading and investing involve risk, and you should consult with a qualified financial advisor before making any trading decisions. I do not guarantee profits or take responsibility for any losses you may incur.

Impulsive Candle Detector TRW [3-in-1]Impulsive Candle Detector
Description: professor Michael impulsive candle but 3 -1 code by me
The Impulsive Candle Detector is a powerful tool designed to identify and highlight three different types of impulsive candles on your TradingView chart—all in a single, customizable indicator. Each impulsive candle type uses its own configurable settings, allowing traders to easily visualize various market dynamics without crowding their charts with multiple indicators.
How it works:
The indicator detects “impulsive” candles based on custom thresholds for candle range, volume, and body-to-wick ratio.
Each of the three types is independently configurable with its own parameters (length for averages, size multiplier, volume multiplier, body ratio, and color).
When an impulsive candle is detected, the corresponding bar is colored and can optionally display a label above the candle indicating its type.
Separate alerts can be set for each impulsive candle type, enabling you to react to different market conditions instantly.
Features:
Three independent impulsive candle detection types, all in one indicator
Adjustable settings for each type (range, volume, body ratio, and color)
Clean, uncluttered chart view
Custom bar coloring and optional labels for instant visual recognition
Supports individual alert notifications for each impulsive candle type
Perfect for:
Traders looking to spot strong market moves or volatility spikes
Those who want to monitor multiple impulsive candle patterns without overlapping indicators
Anyone who values clean and customizable charting solutions

Unified Sentiment Candles Overlay (SMA)Unified Sentiment Candles (SMA) Indicator
The Unified Sentiment Candles (SMA) is a custom overlay indicator designed to provide a smoothed visualization of market sentiment by plotting synthetic candles based on the Simple Moving Average (SMA) of open, high, low, and close prices. It helps traders identify trend direction and potential reversals more clearly.
How to Use:
- Observe Candle Colors: Green candles indicate bullish sentiment (close ≥ open), while red candles suggest bearish sentiment (close < open).
- Trend Identification: Consistent green candles point to an uptrend, whereas consistent red candles may signal a downtrend.
- Support & Resistance Zones: The SMA-based candles smooth out short-term volatility, assisting in spotting key support and resistance levels.
- Entry & Exit Signals: Look for color changes or candle pattern formations within the synthetic candles to time entries and exits more effectively.
Settings:
SMA Length : Adjust this parameter to control the smoothing period. A shorter length makes the indicator more responsive, while a longer length smooths out more noise.
This indicator is best used in conjunction with other technical analysis tools to confirm signals and improve trading accuracy.
This script is open-source and licensed under the Mozilla Public License 2.0. Use and modify it at your own discretion.

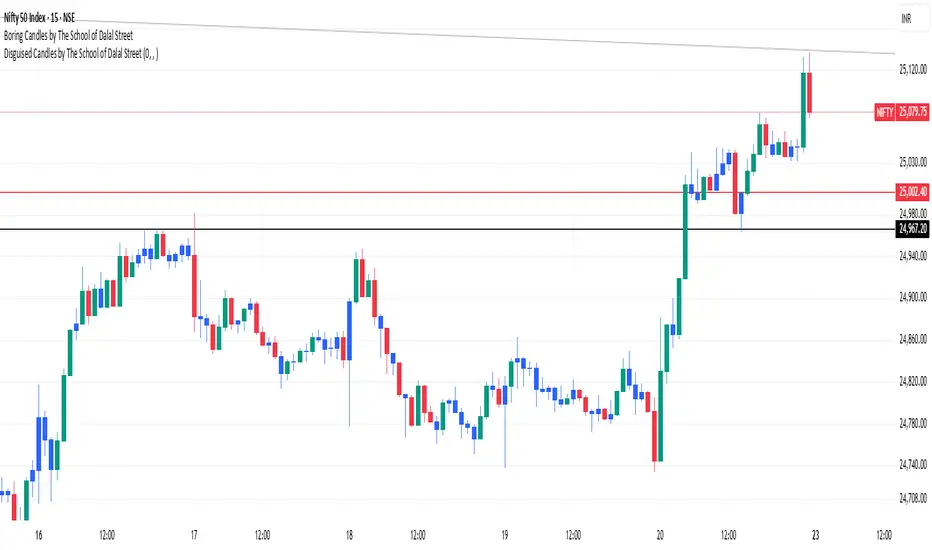
Boring Candles by The School of Dalal StreetThis indicator highlights the "boring" candles. These are candles where the body is less than 50% in length as compared to the high and low length. This allows us to quickly find the lower timeframe demand/supply without switching the chart timeframe. The use case is to quickly find our targets based on lower time frames.
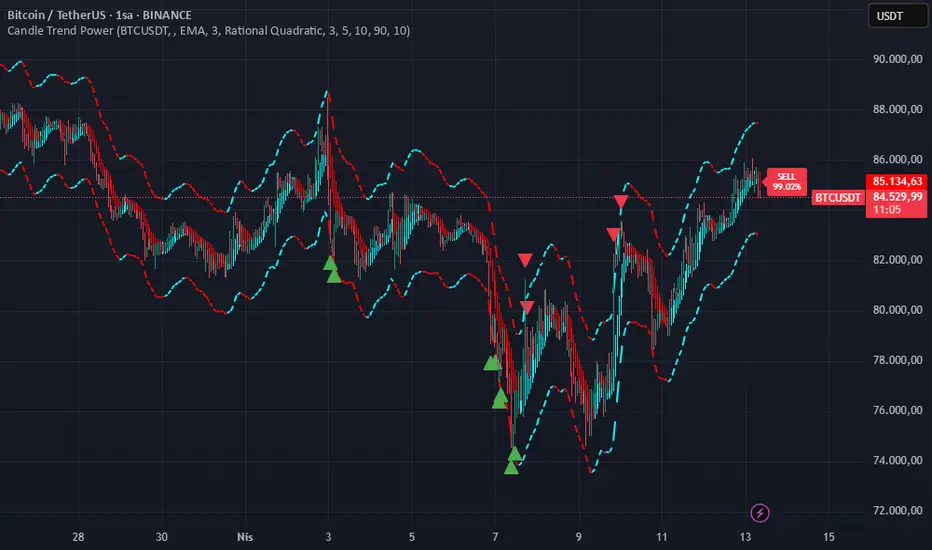
Candle Trend PowerThe Candle Trend Power is a custom technical indicator designed for advanced trend analysis and entry signal generation. It combines multiple smoothing methods, candle transformations, and volatility bands to visually and analytically enhance your trading decisions.
🔧 Main Features:
📉 Custom Candle Types
It transforms standard OHLC candles into one of several advanced types:
Normal Candles, Heikin-Ashi, Linear Regression, Rational Quadratic (via kernel filtering), McGinley Dynamic Candles
These transformations help traders better see trend continuations and reversals by smoothing out market noise.
🧮 Smoothing Method for Candle Data
Each OHLC value can be optionally smoothed using:
EMA, SMA, SMMA (RMA), WMA, VWMA, HMA, Mode (Statistical mode) Or no smoothing at all.
This flexibility is useful for customizing to different market conditions.
📊 Volatility Bands
Volatility-based upper and lower bands are calculated using:
Band = price ± (price% + ATR * multiplier)
They help identify overbought/oversold zones and potential reversal points.
📍 Candle Color Logic
Each candle is colored:
Cyan (#00ffff) if it's bullish and stronger than the previous candle
Red (#fd0000) if it's bearish and weaker
Alternating bar index coloring improves visual clarity.
📈 Trend Momentum Labels
The script includes a trend strength estimation using a smoothed RSI:
If the candle is bullish, it shows a BUY label with the overbought offset.
If bearish, it shows a SELL label with the oversold offset.
These labels are dynamic and placed next to the bar.
📍 Signal Markers
It also plots triangles when the price crosses the volatility bands:
Triangle up for potential long
Triangle down for potential short
✅ Use Case Summary
This script is mainly used for:
Visual trend confirmation with enhanced candles
Volatility-based entry signals
RSI-based trend momentum suggestions
Integrating different smoothing & transformation methods to fine-tune your strategy
It’s a flexible tool for both manual traders and automated system developers who want clear, adaptive signals across different market conditions.
💡 What's Different
🔄 Candle Type Transformations
⚙️ Custom Candle Smoothing
📉 Candle's Multi-level Volatility Bands
🔺 Dynamic Entry Signals (Buy/Sell Labels)
❗Important Note:
This script is provided for educational purposes and does not constitute financial advice. Traders and investors should conduct their research and analysis before making any trading decisions.
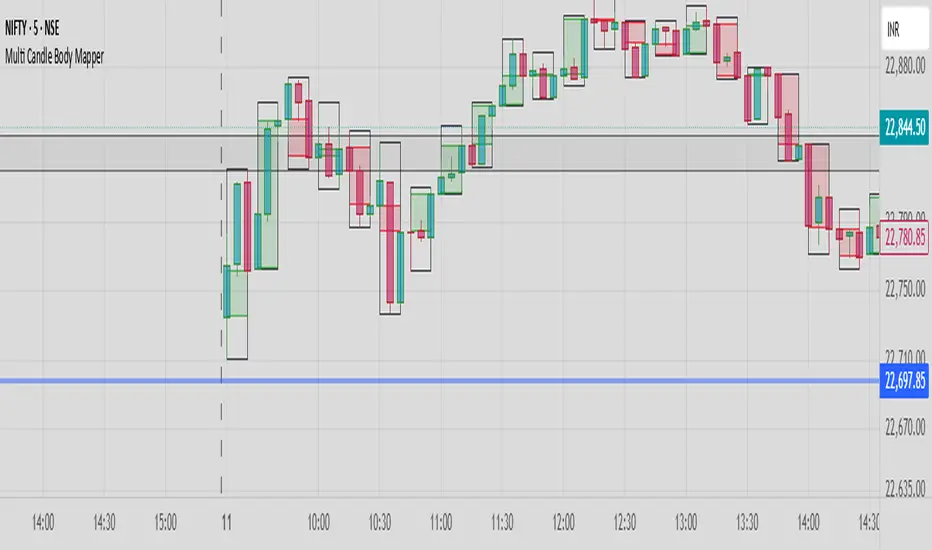
Multi Candle Body MapperMulti Candle Body Mapper
Visualize higher-timeframe candle structure within lower timeframes — without switching charts.
This tool maps grouped candle bodies and wicks (e.g., 15min candles on a 5min chart) using precise boxes and lines. Ideal for intraday traders who want to analyze market intent, body bias, and wick rejection in a compressed, organized view.
Features:
Visualize 3, 6, or 12 candle groups (e.g., 15min / 30min / 1H views)
Body box shows bullish/bearish color with adjustable transparency
Wick box shows high-low range with adjustable thickness and color
Dashed line at group close level for market direction hint
Full color customization
Toggle individual elements ON/OFF
Clean overlay – doesn’t interfere with price candles
Great for spotting:
Hidden support/resistance
Momentum buildup
Reversal traps and continuation setups
Keep your chart simple but smarter — all without changing your timeframe.
Engulfing Candle Indicator with Single AlertEngulfing Candle Indicator with Alerts
This custom Pine Script indicator identifies Bullish and Bearish Engulfing Candles on the price chart, which are key reversal patterns. A Bullish Engulfing occurs when a smaller bearish candle is completely engulfed by a subsequent bullish candle, signaling a potential upward trend. Conversely, a Bearish Engulfing happens when a bullish candle is engulfed by a following bearish candle, indicating a possible downward trend.
The indicator highlights these patterns on the chart with green arrows for Bullish Engulfing and red arrows for Bearish Engulfing. It also includes an alert system that notifies the user whenever either of these patterns occurs.
The script uses an Average True Range (ATR) filter to ensure that the engulfing candles have sufficient size relative to market volatility. Additionally, users can adjust the minimum engulfing size to fine-tune the signal.
