IU Bigger than range strategyDESCRIPTION
IU Bigger Than Range Strategy is designed to capture breakout opportunities by identifying candles that are significantly larger than the previous range. It dynamically calculates the high and low of the last N candles and enters trades when the current candle's range exceeds the previous range. The strategy includes multiple stop-loss methods (Previous High/Low, ATR, Swing High/Low) and automatically manages take-profit and stop-loss levels based on user-defined risk-to-reward ratios. This versatile strategy is optimized for higher timeframes and assets like BTC but can be fine-tuned for different instruments and intervals.
USER INPUTS:
Look back Length: Number of candles to calculate the high-low range. Default is 22.
Risk to Reward: Sets the target reward relative to the stop-loss distance. Default is 3.
Stop Loss Method: Choose between:(Default is "Previous High/Low")
- Previous High/Low
- ATR (Average True Range)
- Swing High/Low
ATR Length: Defines the length for ATR calculation (only applicable when ATR is selected as the stop-loss method) (Default is 14).
ATR Factor: Multiplier applied to the ATR to determine stop-loss distance(Default is 2).
Swing High/Low Length: Specifies the length for identifying swing points (only applicable when Swing High/Low is selected as the stop-loss method).(Default is 2)
LONG CONDITION:
The current candle’s range (absolute difference between open and close) is greater than the previous range.
The closing price is higher than the opening price (bullish candle).
SHORT CONDITIONS:
The current candle’s range exceeds the previous range.
The closing price is lower than the opening price (bearish candle).
LONG EXIT:
Stop-loss:
- Previous Low
- ATR-based trailing stop
- Recent Swing Low
Take-profit:
- Defined by the Risk-to-Reward ratio (default 3x the stop-loss distance).
SHORT EXIT:
Stop-loss:
- Previous High
- ATR-based trailing stop
- Recent Swing High
Take-profit:
- Defined by the Risk-to-Reward ratio (default 3x the stop-loss distance).
ALERTS:
Long Entry Triggered
Short Entry Triggered
WHY IT IS UNIQUE:
This strategy dynamically adapts to different market conditions by identifying candles that exceed the previous range, ensuring that it only enters trades during strong breakout scenarios.
Multiple stop-loss methods provide flexibility for different trading styles and risk profiles.
The visual representation of stop-loss and take-profit levels with color-coded plots improves trade monitoring and decision-making.
HOW USERS CAN BENEFIT FROM IT:
Ideal for breakout traders looking to capitalize on momentum-driven price moves.
Provides flexibility to customize stop-loss methods and fine-tune risk management parameters.
Helps minimize drawdowns with a strong risk-to-reward framework while maximizing profit potential.
Cari skrip untuk "bear"

Keltner Channel StrategyOverview
The Keltner Channel Strategy is a powerful trend-following and mean-reversion system that leverages the Keltner Channels, EMA crossovers, and ATR-based stop-losses to optimize trade entries and exits. This strategy has proven to be highly effective, particularly when applied to Gold (XAUUSD) and other commodities with strong trend characteristics.
📈 How It Works
This strategy incorporates two trading approaches: 1️⃣ Keltner Channel Reversal Trades – Identifies overbought and oversold conditions when price touches the outer bands.
2️⃣ Trend Following Trades – Uses the 9 EMA & 21 EMA crossover, with confirmation from the 50 EMA, to enter trades in the direction of the trend.
🔍 Entry & Exit Criteria
📊 Keltner Channel Entries (Reversal Strategy)
✅ Long Entry: When the price crosses below the lower Keltner Band (potential reversal).
✅ Short Entry: When the price crosses above the upper Keltner Band (potential reversal).
⏳ Exit Conditions:
Long positions close when price crosses back above the mid-band (EMA-based).
Short positions close when price crosses back below the mid-band (EMA-based).
📈 Trend Following Entries (Momentum Strategy)
✅ Long Entry: When the 9 EMA crosses above the 21 EMA, and price is above the 50 EMA (bullish momentum).
✅ Short Entry: When the 9 EMA crosses below the 21 EMA, and price is below the 50 EMA (bearish momentum).
⏳ Exit Conditions:
Long positions close when the 9 EMA crosses back below the 21 EMA.
Short positions close when the 9 EMA crosses back above the 21 EMA.
📌 Risk Management & Profit Targeting
ATR-based Stop-Losses:
Long trades: Stop set at 1.5x ATR below entry price.
Short trades: Stop set at 1.5x ATR above entry price.
Take-Profit Levels:
Long trades: Profit target 2x ATR above entry price.
Short trades: Profit target 2x ATR below entry price.
🚀 Why Use This Strategy?
✅ Works exceptionally well on Gold (XAUUSD) due to high volatility.
✅ Combines reversal & trend strategies for improved adaptability.
✅ Uses ATR-based risk management for dynamic position sizing.
✅ Fully automated alerts for trade entries and exits.
🔔 Alerts
This script includes automated TradingView alerts for:
🔹 Keltner Band touches (Reversal signals).
🔹 EMA crossovers (Momentum trades).
🔹 Stop-loss & Take-profit activations.
📊 Ideal Markets & Timeframes
Best for: Gold (XAUUSD), NASDAQ (NQ), Crude Oil (CL), and trending assets.
Recommended Timeframes: 15m, 1H, 4H, Daily.
⚡️ How to Use
1️⃣ Add this script to your TradingView chart.
2️⃣ Select a 15m, 1H, or 4H timeframe for optimal results.
3️⃣ Enable alerts to receive trade notifications in real time.
4️⃣ Backtest and tweak ATR settings to fit your trading style.
🚀 Optimize your Gold trading with this Keltner Channel Strategy! Let me know how it performs for you. 💰📊

ICT Bread and Butter Sell-SetupICT Bread and Butter Sell-Setup – TradingView Strategy
Overview:
The ICT Bread and Butter Sell-Setup is an intraday trading strategy designed to capitalize on bearish market conditions. It follows institutional order flow and exploits liquidity patterns within key trading sessions—London, New York, and Asia—to identify high-probability short entries.
Key Components of the Strategy:
🔹 London Open Setup (2:00 AM – 8:20 AM NY Time)
The London session typically sets the initial directional move of the day.
A short-term high often forms before a downward push, establishing the daily high.
🔹 New York Open Kill Zone (8:20 AM – 10:00 AM NY Time)
The New York Judas Swing (a temporary rally above London’s high) creates an opportunity for short entries.
Traders fade this move, anticipating a sell-off targeting liquidity below previous lows.
🔹 London Close Buy Setup (10:30 AM – 1:00 PM NY Time)
If price reaches a higher timeframe discount array, a retracement higher is expected.
A bullish order block or failure swing signals a possible reversal.
The risk is set just below the day’s low, targeting a 20-30% retracement of the daily range.
🔹 Asia Open Sell Setup (7:00 PM – 2:00 AM NY Time)
If institutional order flow remains bearish, a short entry is taken around the 0-GMT Open.
Expect a 15-20 pip decline as the Asian range forms.
Strategy Rules:
📉 Short Entry Conditions:
✅ New York Judas Swing occurs (price moves above London’s high before reversing).
✅ Short entry is triggered when price closes below the open.
✅ Stop-loss is set 10 pips above the session high.
✅ Take-profit targets liquidity zones on higher timeframes.
📈 Long Entry (London Close Reversal):
✅ Price reaches a higher timeframe discount array between 10:30 AM – 1:00 PM NY Time.
✅ A bullish order block confirms the reversal.
✅ Stop-loss is set 10 pips below the day’s low.
✅ Take-profit targets 20-30% of the daily range retracement.
📉 Asia Open Sell Entry:
✅ Price trades slightly above the 0-GMT Open.
✅ Short entry is taken at resistance, targeting a quick 15-20 pip move.
Why Use This Strategy?
🚀 Institutional Order Flow Tracking – Aligns with smart money concepts.
📊 Precise Session Timing – Uses market structure across London, New York, and Asia.
🎯 High-Probability Entries – Focuses on liquidity grabs and engineered stop hunts.
📉 Optimized Risk Management – Defined stop-loss and take-profit levels.
This strategy is ideal for traders looking to trade with institutions, fade liquidity grabs, and capture high-probability short setups during the trading day. 📉🔥

BTCUSD with adjustable sl,tpThis strategy is designed for swing traders who want to enter long positions on pullbacks after a short-term trend shift, while also allowing immediate short entries when conditions favor downside movement. It combines SMA crossovers, a fixed-percentage retracement entry, and adjustable risk management parameters for optimal trade execution.
Key Features:
✅ Trend Confirmation with SMA Crossover
The 10-period SMA crossing above the 25-period SMA signals a bullish trend shift.
The 10-period SMA crossing below the 25-period SMA signals a bearish trend shift.
Short trades are only taken if the price is below the 150 EMA, ensuring alignment with the broader trend.
📉 Long Pullback Entry Using Fixed Percentage Retracement
Instead of entering immediately on the SMA crossover, the strategy waits for a retracement before going long.
The pullback entry is defined as a percentage retracement from the recent high, allowing for an optimized entry price.
The retracement percentage is fully adjustable in the settings (default: 1%).
A dynamic support level is plotted on the chart to visualize the pullback entry zone.
📊 Short Entry Rules
If the SMA(10) crosses below the SMA(25) and price is below the 150 EMA, a short trade is immediately entered.
Risk Management & Exit Strategy:
🚀 Take Profit (TP) – Fully customizable profit target in points. (Default: 1000 points)
🛑 Stop Loss (SL) – Adjustable stop loss level in points. (Default: 250 points)
🔄 Break-Even (BE) – When price moves in favor by a set number of points, the stop loss is moved to break-even.
📌 Extra Exit Condition for Longs:
If the SMA(10) crosses below SMA(25) while the price is still below the EMA150, the strategy force-exits the long position to avoid reversals.
How to Use This Strategy:
Enable the strategy on your TradingView chart (recommended for stocks, forex, or indices).
Customize the settings – Adjust TP, SL, BE, and pullback percentage for your risk tolerance.
Observe the plotted retracement levels – When the price touches and bounces off the level, a long trade is triggered.
Let the strategy manage the trade – Break-even protection and take-profit logic will automatically execute.
Ideal Market Conditions:
✅ Trending Markets – The strategy works best when price follows strong trends.
✅ Stocks, Indices, or Forex – Can be applied across multiple asset classes.
✅ Medium-Term Holding Period – Suitable for swing trades lasting days to weeks.

Grease Trap V1.0The Grease Trap V1.0 indicator is a dynamic, Fibonacci-based strategy that calculates unique moving averages to generate trading signals. Below is an overview of its main components and functionality:
How It Works
Fibonacci Grouped Averages:
Dynamic Fibonacci Sequence:
The indicator uses a custom function that dynamically builds a Fibonacci sequence. The user can set the number of Fibonacci elements for two separate calculations:
One for the Indicator Average (default: 9 elements).
One for the Base Average (default: 14 elements).
Grouped Averaging:
Using these Fibonacci numbers, the script groups historical closing prices into segments. For each group (with a length determined by a Fibonacci number), it computes an average. These individual group averages are then averaged together to produce a single dynamic average.
Plotting and Visual Cues:
Two Lines:
The indicator plots two lines on the chart:
Primary Dynamic Fibonacci Grouped Average
Base Dynamic Fibonacci Grouped Average
Color Coding:
The colors of these lines change based on their relationship to the current high price and to each other. For example, if the primary average is above the high or crosses above the base average, it might be shown in green or yellow, whereas certain conditions trigger red, signaling caution.
Crossover Dots:
When the primary average crosses above the base (a bullish signal), a green dot is plotted. Conversely, when it crosses below (a bearish signal), a red dot is displayed. These dots help visually pinpoint the moments of potential trade entry or exit.
Trading Signals and Orders:
Buy Signal:
Triggered when the primary average crosses above the base average. On a buy signal:
If in a short position, it closes that position.
Then, it enters a long position.
Sell Signal:
Triggered when the primary average crosses below the base average. On a sell signal:
If in a long position, it closes that position.
Then, it enters a short position.
Profit Target Management:
The indicator includes automated profit management:
For long positions, it sets an exit order when the price rises by a user-defined percentage (default: 2%).
For short positions, it sets an exit order when the price falls by a similar percentage.
Alerts:
The script is equipped with alert conditions. Traders receive notifications whenever a buy or sell signal is generated, helping them stay on top of potential trading opportunities.
Customization
User Inputs:
Traders can adjust:
The number of Fibonacci elements for each average calculation.
Profit target percentages for both long and short positions.
Data Length Requirement:
The script ensures it uses at least 200 data points (or the total number of available bars, whichever is greater) for a robust calculation of the averages.
In Summary
The Grease Trap V1.0 indicator combines the mathematical elegance of Fibonacci sequences with dynamic grouped averaging. It offers:
Innovative Moving Averages: Based on Fibonacci groupings of historical price data.
Clear Visual Cues: Through color-coded lines and crossover dots.
Automated Trading Actions: With built-in order management and profit targets.
Alert Notifications: So traders are instantly aware of key market signals.
This makes the Grease Trap V1.0 a comprehensive tool for both signal generation and automated strategy execution, suitable for traders looking to integrate Fibonacci principles into their trading systems.

Heiken Ashi Supertrend ATR-SL StrategyThis indicator combines Heikin Ashi candle pattern analysis with Supertrend to generate high-probability trading signals with built-in risk management. It identifies potential entries and exits based on specific Heikin Ashi candlestick formations while providing automated ATR-based stop loss management.
Trading Logic:
The system generates long signals when a green Heikin Ashi candle forms with no bottom wick (indicating strong bullish momentum). Short signals appear when a red Heikin Ashi candle forms with no top wick (showing strong bearish momentum). The absence of wicks on these candles signals a high-conviction market move in the respective direction.
Exit signals are triggered when:
1. An opposite pattern forms (red candle with no top wick exits longs; green candle with no bottom wick exits shorts)
2. The ATR-based stop loss is hit
3. The break-even stop is activated and then hit
Technical Approach:
- Select Heiken Ashi Canldes on your Trading View chart. Entried are based on HA prices.
- Supertrend and ATR-based stop losses use real price data (not HA values) for trend determination
- ATR-based stop losses automatically adjust to market volatility
- Break-even functionality moves the stop to entry price once price moves a specified ATR multiple in your favor
Risk Management:
- Default starting capital: 1000 units
- Default risk per trade: 10% of equity (customizable in strategy settings)
- Hard Stop Loss: Set ATR multiplier (default: 2.0) for automatic stop placement
- Break Even: Configure ATR threshold (default: 1.0) to activate break-even stops
- Appropriate position sizing relative to equity and stop distance
Customization Options:
- Supertrend Settings:
- Enable/disable Supertrend filtering (trade only in confirmed trend direction)
- Adjust Factor (default: 3.0) to change sensitivity
- Modify ATR Period (default: 10) to adapt to different timeframes
Visual Elements:
- Green triangles for long entries, blue triangles for short entries
- X-marks for exits and stop loss hits
- Color-coded position background (green for long, blue for short)
- Clearly visible stop loss lines (red for hard stop, white for break-even)
- Comprehensive position information label with entry price and stop details
Implementation Notes:
The indicator tracks positions internally and maintains state across bars to properly manage stop levels. All calculations use confirmed bars only, with no repainting or lookahead bias. The system is designed for swing trading on timeframes from 1-hour and above, where Heikin Ashi patterns tend to be more reliable.
This indicator is best suited for traders looking to combine the pattern recognition strengths of Heikin Ashi candles with the trend-following capabilities of Supertrend, all while maintaining disciplined risk management through automated stops.

PVSRA v5Overview of the PVSRA Strategy
This strategy is designed to detect and capitalize on volume-driven threshold breaches in price candles. It operates on the premise that when a high-volume candle breaks a critical price threshold, not all orders are filled within that candle’s range. This creates an imbalance—similar to a physical system being perturbed—causing the price to revert toward the level where the breach occurred to “absorb” the residual orders.
Key Features and Their Theoretical Underpinnings
Dynamic Volume Analysis and Threshold Detection
Volume Surges as Market Perturbations:
The script computes a moving average of volume over a short window and flags moments when the current volume significantly exceeds this average. These surges act as a perturbation—injecting “energy” into the market.
Adaptive Abnormal Volume Threshold:
By calculating a dynamic abnormal threshold using a daily volume average (via an 89-period VWMA) and standard deviation, the strategy identifies when the current volume is abnormally high. This mechanism mirrors the idea that when a system is disturbed (here, by a volume surge), it naturally seeks to return to equilibrium.
Candle Coloring and Visual Signal Identification
Differentiation of Candle Types:
The script distinguishes between bullish (green) and bearish (red) candles. It applies different colors based on the strength of the volume signal, providing a clear, visual representation of whether a candle is likely to trigger a price reversion.
Implication of Unfilled Orders:
A red (bearish) candle with high volume implies that sell pressure has pushed the price past a critical threshold—yet not all buy orders have been fulfilled. Conversely, a green (bullish) candle indicates that aggressive buying has left pending sell orders. In both cases, the market is expected to reverse toward the breach point to restore balance.
Trade Execution Logic: Normal and Reversal Trades
Normal Trades:
When a high-volume candle breaches a threshold and meets the directional conditions (e.g., a red candle paired with price above a daily upper band), the strategy enters a trade anticipating a reversion. The underlying idea is that the market will move back to the level where the threshold was crossed—clearing the residual orders in a manner analogous to a system following the path of least resistance.
Reversal Trades:
The strategy also monitors for clusters of consecutive signals within a short lookback period. When multiple signals accumulate, it interprets this as the market having overextended and, in a corrective move, reverses the typical trade direction. This inversion captures the market’s natural tendency to “correct” itself by moving in discrete, quantized steps—each step representing the absorption of a minimum quantum of order imbalance.
Risk and Trade Management
Stop Loss and Take Profit Buffers:
Both normal and reversal trades include predetermined buffers for stop loss and take profit levels. This systematic risk management approach is designed to capture the anticipated reversion while minimizing potential losses, aligning with the idea that market corrections follow the most energy-efficient path back to equilibrium.
Symbol Flexibility:
An option to override the chart’s symbol allows the strategy to be applied consistently across different markets, ensuring that the volume and price dynamics are analyzed uniformly.
Conceptual Bridge: From Market Dynamics to Trade Execution
At its core, the strategy treats market price movements much like a physical system that seeks to minimize “transactional energy” or inefficiency. When a price candle breaches a key threshold on high volume, it mimics an injection of energy into the system. The subsequent price reversion is the market’s natural response—moving in the most efficient path back to balance. This perspective is akin to the principle of least action, where the system evolves along the trajectory that minimizes cumulative imbalance, and it acknowledges that these corrections occur in discrete steps reflective of quantized order execution.
This unified framework allows the PVSRA strategy to not only identify when significant volume-based threshold breaches occur but also to systematically execute trades that benefit from the expected corrective moves.

RSI + Stochastic + WMA StrategyThis script is designed for TradingView and serves as a trading strategy (not just a visual indicator). It's intended for backtesting, strategy optimization, or live trading signal generation using a combination of popular technical indicators.
📊 Indicators Used in the Strategy:
Indicator Description
RSI (Relative Strength Index) Measures momentum; identifies overbought (>70) or oversold (<30) conditions.
Stochastic Oscillator (%K & %D) Detects momentum reversal points via crossovers. Useful for timing entries.
WMA (Weighted Moving Average) Identifies the trend direction (used as a trend filter).
📈 Trading Logic / Strategy Rules:
📌 Long Entry Condition (Buy Signal):
All 3 conditions must be true:
RSI is Oversold → RSI < 30
Stochastic Crossover Upward → %K crosses above %D
Price is above WMA → Confirms uptrend direction
👉 Interpretation: Market was oversold, momentum is turning up, and price confirms uptrend — bullish entry.
📌 Short Entry Condition (Sell Signal):
All 3 conditions must be true:
RSI is Overbought → RSI > 70
Stochastic Crossover Downward → %K crosses below %D
Price is below WMA → Confirms downtrend direction
👉 Interpretation: Market is overbought, momentum is turning down, and price confirms downtrend — bearish entry.
🔄 Strategy Execution (Backtesting Logic):
The script uses:
pinescript
Copy
Edit
strategy.entry("LONG", strategy.long)
strategy.entry("SHORT", strategy.short)
These are Pine Script functions to place buy and sell orders automatically when the above conditions are met. This allows you to:
Backtest the strategy
Measure win/loss ratio, drawdown, and profitability
Optimize indicator settings using TradingView Strategy Tester
📊 Visual Aids (Charts):
Plots WMA Line: Orange line for trend direction
Overbought/Oversold Zones: Horizontal lines at 70 (red) and 30 (green) for RSI visualization
⚡ Strategy Type Summary:
Category Setting
Strategy Type Momentum Reversal + Trend Filter
Timeframe Flexible (Works best on 1H, 4H, Daily)
Trading Style Swing/Intraday
Risk Profile Medium to High (due to momentum triggers)
Uses Leverage Possible (adjust risk accordingly)

Volume Block Order AnalyzerCore Concept
The Volume Block Order Analyzer is a sophisticated Pine Script strategy designed to detect and analyze institutional money flow through large block trades. It identifies unusually high volume candles and evaluates their directional bias to provide clear visual signals of potential market movements.
How It Works: The Mathematical Model
1. Volume Anomaly Detection
The strategy first identifies "block trades" using a statistical approach:
```
avgVolume = ta.sma(volume, lookbackPeriod)
isHighVolume = volume > avgVolume * volumeThreshold
```
This means a candle must have volume exceeding the recent average by a user-defined multiplier (default 2.0x) to be considered a significant block trade.
2. Directional Impact Calculation
For each block trade identified, its price action determines direction:
- Bullish candle (close > open): Positive impact
- Bearish candle (close < open): Negative impact
The magnitude of impact is proportional to the volume size:
```
volumeWeight = volume / avgVolume // How many times larger than average
blockImpact = (isBullish ? 1.0 : -1.0) * (volumeWeight / 10)
```
This creates a normalized impact score typically ranging from -1.0 to 1.0, scaled by dividing by 10 to prevent excessive values.
3. Cumulative Impact with Time Decay
The key innovation is the cumulative impact calculation with decay:
```
cumulativeImpact := cumulativeImpact * impactDecay + blockImpact
```
This mathematical model has important properties:
- Recent block trades have stronger influence than older ones
- Impact gradually "fades" at rate determined by decay factor (default 0.95)
- Sustained directional pressure accumulates over time
- Opposing pressure gradually counteracts previous momentum
Trading Logic
Signal Generation
The strategy generates trading signals based on momentum shifts in institutional order flow:
1. Long Entry Signal: When cumulative impact crosses from negative to positive
```
if ta.crossover(cumulativeImpact, 0)
strategy.entry("Long", strategy.long)
```
*Logic: Institutional buying pressure has overcome selling pressure, indicating potential upward movement*
2. Short Entry Signal: When cumulative impact crosses from positive to negative
```
if ta.crossunder(cumulativeImpact, 0)
strategy.entry("Short", strategy.short)
```
*Logic: Institutional selling pressure has overcome buying pressure, indicating potential downward movement*
3. Exit Logic: Positions are closed when the cumulative impact moves against the position
```
if cumulativeImpact < 0
strategy.close("Long")
```
*Logic: The original signal is no longer valid as institutional flow has reversed*
Visual Interpretation System
The strategy employs multiple visualization techniques:
1. Color Gradient Bar System:
- Deep green: Strong buying pressure (impact > 0.5)
- Light green: Moderate buying pressure (0.1 < impact ≤ 0.5)
- Yellow-green: Mild buying pressure (0 < impact ≤ 0.1)
- Yellow: Neutral (impact = 0)
- Yellow-orange: Mild selling pressure (-0.1 < impact ≤ 0)
- Orange: Moderate selling pressure (-0.5 < impact ≤ -0.1)
- Red: Strong selling pressure (impact ≤ -0.5)
2. Dynamic Impact Line:
- Plots the cumulative impact as a line
- Line color shifts with impact value
- Line movement shows momentum and trend strength
3. Block Trade Labels:
- Marks significant block trades directly on the chart
- Shows direction and volume amount
- Helps identify key moments of institutional activity
4. Information Dashboard:
- Current impact value and signal direction
- Average volume benchmark
- Count of significant block trades
- Min/Max impact range
Benefits and Use Cases
This strategy provides several advantages:
1. Institutional Flow Detection: Identifies where large players are positioning themselves
2. Early Trend Identification: Often detects institutional accumulation/distribution before major price movements
3. Market Context Enhancement: Provides deeper insight than simple price action alone
4. Objective Decision Framework: Quantifies what might otherwise be subjective observations
5. Adaptive to Market Conditions: Works across different timeframes and instruments by using relative volume rather than absolute thresholds
Customization Options
The strategy allows users to fine-tune its behavior:
- Volume Threshold: How unusual a volume spike must be to qualify
- Lookback Period: How far back to measure average volume
- Impact Decay Factor: How quickly older trades lose influence
- Visual Settings: Labels and line width customization
This sophisticated yet intuitive strategy provides traders with a window into institutional activity, helping identify potential trend changes before they become obvious in price action alone.

IU BBB(Big Body Bar) StrategyDESCRIPTION
The IU BBB (Big Body Bar) Strategy is a price action-based trading strategy that identifies high-momentum candles with significantly larger body sizes compared to the average. It enters trades when a strong bullish or bearish move occurs and manages risk using an ATR-based trailing stop-loss system.
USER INPUTS:
- Big Body Threshold – Defines how many times larger the candle body should be compared to the average body ( default is 4 ).
- ATR Length – The period for the Average True Range (ATR) used in the trailing stop-loss calculation ( default is 14 ).
- ATR Factor – Multiplier for ATR to determine the trailing stop distance ( default is 2 ).
LONG CONDITION:
- The current candle’s body is greater than the average body size multiplied by the Big Body Threshold.
- The closing price is higher than the opening price (bullish candle).
SHORT CONDITION:
- The current candle’s body is greater than the average body size multiplied by the Big Body Threshold.
- The closing price is lower than the opening price (bearish candle).
LONG EXIT:
- ATR-based trailing stop-loss dynamically adjusts, locking in profits as the price moves higher.
SHORT EXIT:
- ATR-based trailing stop-loss dynamically adjusts, securing profits as the price moves lower.
WHY IT IS UNIQUE:
- Unlike traditional momentum strategies, this system adapts to volatility by filtering trades based on relative candle size.
- It incorporates an ATR-based trailing stop-loss, ensuring risk management and profit protection.
- The strategy avoids choppy market conditions by only trading when significant momentum is present.
HOW USERS CAN BENEFIT FROM IT:
- Catch Strong Price Moves – The strategy helps traders enter trades when the market shows decisive momentum.
- Effective Risk Management – The ATR-based trailing stop ensures that winning trades remain profitable.
- Works Across Markets – Can be applied to stocks, forex, crypto, and indices with proper optimization.
- Fully Customizable – Users can adjust sensitivity settings to match their trading style and time frame.

RSI, Volume, MACD, EMA ComboRSI + Volume + MACD + EMA Trading System
This script combines four powerful indicators—Relative Strength Index (RSI), Volume, Moving Average Convergence Divergence (MACD), and Exponential Moving Average (EMA)—to create a comprehensive trading strategy for better trend confirmation and trade entries.
How It Works
RSI (Relative Strength Index)
Helps identify overbought and oversold conditions.
Used to confirm momentum strength before taking a trade.
Volume
Confirms the strength of price movements.
Avoids false signals by ensuring there is sufficient trading activity.
MACD (Moving Average Convergence Divergence)
Confirms trend direction and momentum shifts.
Provides buy/sell signals through MACD line crossovers.
EMA (Exponential Moving Average)
Acts as a dynamic support and resistance level.
Helps filter out trades that go against the overall trend.
Trading Logic
Buy Signal:
RSI is above 50 (bullish momentum).
MACD shows a bullish crossover.
The price is above the EMA (trend confirmation).
Volume is increasing (strong participation).
Sell Signal:
RSI is below 50 (bearish momentum).
MACD shows a bearish crossover.
The price is below the EMA (downtrend confirmation).
Volume is increasing (intense selling pressure).
Backtesting & Risk Management
The strategy is optimized for scalping on the 1-minute timeframe (adjustable for other timeframes).
Default settings use realistic commission and slippage to simulate actual trading conditions.
A stop-loss and take-profit system is integrated to manage risk effectively.
This script is designed to help traders filter out false signals, improve trend confirmation, and increase trade accuracy by combining multiple indicators in a structured way.

Pure Price Action StrategyTest Price Action Strategy from Lux Pure Price Action Indicator
How This Strategy Works:
Recognizing Trends & Reversals:
Break of Structure (BOS): A bullish signal indicating a trend continuation.
Market Structure Shift (MSS): A bearish signal indicating a potential reversal.
Analyzing Market Momentum:
It uses recent highs and lows to confirm whether the price is making higher highs (bullish) or lower lows (bearish).
Customizing Visualization Styles:
Buy signals (BUY Signal) are plotted as green upward arrows.
Sell signals (SELL Signal) are plotted as red downward arrows.
Stop-Loss (SL) & Take-Profit (TP): Configurable via percentage input.

Fibonacci-Only Strategy V2Fibonacci-Only Strategy V2
This strategy combines Fibonacci retracement levels with pattern recognition and statistical confirmation to identify high-probability trading opportunities across multiple timeframes.
Core Strategy Components:
Fibonacci Levels: Uses key Fibonacci retracement levels (19% and 82.56%) to identify potential reversal zones
Pattern Recognition: Analyzes recent price patterns to find similar historical formations
Statistical Confirmation: Incorporates statistical analysis to validate entry signals
Risk Management: Includes customizable stop loss (fixed or ATR-based) and trailing stop features
Entry Signals:
Long entries occur when price touches or breaks the 19% Fibonacci level with bullish confirmation
Short entries require Fibonacci level interaction, bearish confirmation, and statistical validation
All signals are visually displayed with color-coded markers and dashboard
Trading Method:
When a triangle signal appears, open a position on the next candle
Alternatively, after seeing a signal on a higher timeframe, you can switch to a lower timeframe to find a more precise entry point
Entry signals are clearly marked with visual indicators for easy identification
Risk Management Features:
Adjustable stop loss (percentage-based or ATR-based)
Optional trailing stops for protecting profits
Multiple take-profit levels for strategic position exit
Customization Options:
Timeframe selection (1m to Daily)
Pattern length and similarity threshold adjustment
Statistical period and weight configuration
Risk parameters including stop loss and trailing stop settings
This strategy is particularly well-suited for cryptocurrency markets due to their tendency to respect Fibonacci levels and technical patterns. Crypto's volatility is effectively managed through the customizable stop-loss and trailing-stop mechanisms, making it an ideal tool for traders in digital asset markets.
For optimal performance, this strategy works best on higher timeframes (30m, 1h and above) and is not recommended for low timeframe scalping. The Fibonacci pattern recognition requires sufficient price movement to generate reliable signals, which is more consistently available in medium to higher timeframes.
Users should avoid trading during sideways market conditions, as the strategy performs best during trending markets with clear directional movement. The statistical confirmation component helps filter out some sideways market signals, but it's recommended to manually avoid ranging markets for best results.

Vortex Sniper XVortex Sniper X – Trend-Following Strategy
🔹 Purpose
Vortex Sniper X is a trend-following strategy designed to identify strong market trends and enter trades in the direction of momentum. By combining multiple technical indicators, this strategy helps traders filter out false signals and only take trades with high confidence.
🔹 Indicator Breakdown
1️⃣ Vortex Indicator (Trend Direction & Strength)
Identifies the trend direction based on the relationship between VI+ and VI-.
Bullish Signal: VI+ crosses above VI-.
Bearish Signal: VI- crosses above VI+.
The wider the gap between VI+ and VI-, the stronger the trend’s momentum.
2️⃣ Relative Momentum Index (RMI – Momentum Confirmation)
Confirms whether price momentum supports the trend direction.
Long confirmation: RMI is rising and above the threshold.
Short confirmation: RMI is falling and below the threshold.
Filters out weak trends that lack sufficient momentum.
3️⃣ McGinley Dynamic (Trend Baseline Filter)
A dynamic moving average that adjusts to market volatility for smoother trend identification.
Long trades only if price is above the McGinley Dynamic.
Short trades only if price is below the McGinley Dynamic.
Prevents trading in choppy or sideways markets.
🔹 Strategy Logic & Trade Execution
✅ Entry Conditions
A trade is executed only when all three indicators confirm alignment:
Trend Confirmation: McGinley Dynamic defines the trend direction.
Vortex Signal: VI+ > VI- (bullish) or VI- > VI+ (bearish).
Momentum Confirmation: RMI must agree with the trend direction.
✅ Exit Conditions
Trend Reversal: If the opposite trade condition is met, the current position is closed.
Trend Weakness: If the trend weakens (detected via trend shifts), the position is exited.
🔹 Take-Profit System
The strategy follows a multi-stage profit-taking approach to secure gains:
Take Profit 1 (TP1): 50% of the position is closed at the first target.
Take Profit 2 (TP2): The remaining 50% is closed at the second target.
🔹 Risk Management (Important Notice)
🔴 This strategy does NOT include a stop-loss by default.
Trades rely on trend reversals or early exits to close positions.
Users should manually configure a stop-loss if risk management is required.
💡 Suggested risk management options:
Set a stop-loss at a recent swing high/low or an important support/resistance level.
Adjust position sizing according to personal risk tolerance.
🔹 Default Backtest Settings
To ensure realistic backtesting, the following settings are used:
Initial Capital: $1,000
Position Sizing: 10% of equity per trade
Commission: 0.05%
Slippage: 1 pip
Date Range: Can be adjusted for different market conditions
🔹 How to Use This Strategy
📌 To get the best results, follow these steps:
Apply the strategy to any TradingView chart.
Backtest before using it in live conditions.
Adjust the indicator settings as needed.
Set a manual stop-loss if required for your trading style.
Use this strategy in trending markets—avoid sideways conditions.
⚠️ Disclaimer
🚨 Trading involves risk. This strategy is for educational purposes only and should not be considered financial advice.
Past performance does not guarantee future results.
Users are responsible for managing their own risk.
Always backtest strategies before applying them in live trading.
🚀 Final Notes
Vortex Sniper X provides a structured approach to trend-following trading, ensuring:
✔ Multi-indicator confirmation for higher accuracy.
✔ Momentum-backed entries to avoid weak trends.
✔ Take-profit targets to secure gains.
✔ No repainting—historical performance aligns with live execution.
This strategy does not include a stop-loss, so users must apply their own risk management methods.

Long-Only MTF EMA Cloud StrategyOverview:
The Long-Only EMA Cloud Strategy is a powerful trend-following strategy designed to help traders identify and capitalize on bullish market conditions. By utilizing an Exponential Moving Average (EMA) Cloud, this strategy provides clear and reliable signals for entering long positions when the market trend is favorable. The EMA cloud acts as a visual representation of the trend, making it easier for traders to make informed decisions. This strategy is ideal for traders who prefer to trade in the direction of the trend and focus exclusively on long positions.
Key Features:
EMA Cloud:
The strategy uses two EMAs (short and long) to create a dynamic cloud.
The cloud is bullish when the short EMA is above the long EMA, indicating a strong upward trend.
The cloud is bearish when the short EMA is below the long EMA, indicating a downward trend or consolidation.
Long Entry Signals:
A long position is opened when the EMA cloud turns bullish, which occurs when the short EMA crosses above the long EMA.
This crossover signals a potential shift in market sentiment from bearish to bullish, providing an opportunity to enter a long trade.
Adjustable Timeframe:
The EMA cloud can be calculated on the same timeframe as the chart or on a higher/lower timeframe for multi-timeframe analysis.
This flexibility allows traders to adapt the strategy to their preferred trading style and time horizon.
Risk Management:
The strategy includes adjustable stop loss and take profit levels to help traders manage risk and lock in profits.
Stop loss and take profit levels are calculated as a percentage of the entry price, ensuring consistency across different assets and market conditions.
Alerts:
Built-in alerts notify you when a long entry signal is generated, ensuring you never miss a trading opportunity.
Alerts can be customized to suit your preferences, providing real-time notifications for potential trades.
Visualization:
The EMA cloud is plotted on the chart, providing a clear visual representation of the trend.
Buy signals are marked with a green label below the price bar, making it easy to identify entry points.
How to Use:
Add the Script:
Add the script to your chart in TradingView.
Set EMA Lengths:
Adjust the Short EMA Length and Long EMA Length in the settings to suit your trading style.
For example, you might use a shorter EMA (e.g., 21) for more responsive signals or a longer EMA (e.g., 50) for smoother signals.
Choose EMA Cloud Resolution:
Select the EMA Cloud Resolution (timeframe) for the cloud calculation.
You can choose the same timeframe as the chart or a different timeframe (higher or lower) for multi-timeframe analysis.
Adjust Risk Management:
Set the Stop Loss (%) and Take Profit (%) levels according to your risk tolerance and trading goals.
For example, you might use a 1% stop loss and a 2% take profit for a 1:2 risk-reward ratio.
Enable Alerts:
Enable alerts to receive notifications for long entry signals.
Alerts can be configured to send notifications via email, SMS, or other preferred methods.
Monitor and Trade:
Monitor the chart for buy signals and execute trades accordingly.
Use the EMA cloud as a visual guide to confirm the trend direction before entering a trade.
Ideal For:
Trend-Following Traders: This strategy is perfect for traders who prefer to trade in the direction of the trend and capitalize on sustained price movements.
Long-Only Traders: If you prefer to focus exclusively on long positions, this strategy provides a clear and systematic approach to identifying bullish opportunities.
Multi-Timeframe Analysts: The adjustable EMA cloud resolution allows you to analyze trends across different timeframes, making it suitable for both short-term and long-term traders.
Risk-Averse Traders: The inclusion of stop loss and take profit levels helps manage risk and protect your capital.

MACD Crossover Strategy MACD Crossover Strategy:
This strategy is based on the Moving Average Convergence Divergence (MACD) indicator, a popular tool used in technical analysis to identify potential trend changes and momentum in price movements. The strategy focuses on MACD crossovers within a specific "important zone" to generate trading signals.
Key Components:
1. MACD Calculation: The strategy uses customizable parameters for fast length (default 12), slow length (default 26), and signal length (default 9) to calculate the MACD line and signal line.
2. Important Zone: Defined by upper and lower thresholds (default 0.5 and -0.5), this zone helps filter out potentially less significant crossovers.
3. Entry Conditions:
- Long (Buy) Entry: When the MACD line crosses above the signal line within the important zone.
- Short (Sell) Entry: When the MACD line crosses below the signal line within the important zone.
4. Exit Conditions: The strategy closes positions on opposite crossover signals. Long positions are closed on bearish crossovers, and short positions on bullish crossovers.
5. Visualization:
- MACD line (blue) and signal line (orange) are plotted.
- The zero line, upper threshold, and lower threshold are displayed for reference.
- Buy signals are represented by green triangles at the bottom of the chart.
- Sell signals are shown as red triangles at the top of the chart.
This strategy aims to capture trend changes while filtering out potentially false signals that occur when the MACD is at extreme values. By focusing on crossovers within the important zone, the strategy attempts to identify more reliable trading opportunities.
Traders can adjust the MACD parameters and the important zone thresholds to fine-tune the strategy for different assets or timeframes. As with any trading strategy, it's crucial to thoroughly backtest and consider risk management before using it in live trading.

Hierarchical + K-Means Clustering Strategy===== USER GUIDE =====
Hierarchical + K-Means Clustering Strategy
OVERVIEW:
This strategy combines hierarchical clustering and K-means algorithms to analyze market volatility patterns
and generate trading signals. It uses a modified SuperTrend indicator with ATR-based volatility clustering
to identify potential trend changes and market conditions.
KEY FEATURES:
- Advanced volatility analysis using hierarchical clustering and K-means algorithms
- Modified SuperTrend indicator for trend identification
- Multiple filter options including moving average and ADX trend strength
- Volume-based exit mechanism to protect profits
- Customizable appearance settings
SETTINGS EXPLANATION:
1. SuperTrend Settings:
- ATR Length: Period for ATR calculation (default: 11)
- SuperTrend Factor: Multiplier for ATR to determine trend bands (default: 3)
2. Hierarchical Clustering Settings:
- Training Data Length: Number of bars used for clustering analysis (default: 200)
3. Appearance Settings:
- Transparency 1 & 2: Control the opacity of trend lines and fills
- Bullish/Bearish Color: Colors for uptrend and downtrend visualization
4. Time Settings:
- Start Year/Month: Define when the strategy should start executing trades
5. Filter Settings:
- Moving Average Filter: Uses SMA to filter trades (only enter when price is on correct side of MA)
- Trend Strength Filter: Uses ADX to ensure trades are taken in strong trend conditions
6. Volume Stop Loss Settings:
- Volume Ratio Threshold: Controls sensitivity of volume-based exits
- Monitoring Delay Bars: Number of bars to wait before monitoring volume for exit signals
HOW TO USE:
1. Apply the indicator to your chart
2. Adjust settings according to your trading preferences and timeframe
3. Long signals appear when price crosses above the SuperTrend line (▲k marker)
4. Short signals appear when price crosses below the SuperTrend line (▼k marker)
5. The strategy automatically manages exits based on volume balance conditions
INTERPRETATION:
- Green line/area: Bullish trend - consider long positions
- Red line/area: Bearish trend - consider short positions
- Yellow line: Moving average for additional trend confirmation
- Volume balance exits occur when buying/selling pressure equalizes
RECOMMENDED TIMEFRAMES:
This strategy works best on 1H, 4H, and daily charts for most markets.
For highly volatile assets, shorter timeframes may also be effective.
RISK MANAGEMENT:
Always use proper position sizing and consider setting additional stop losses
beyond the strategy's built-in exit mechanisms.
===== END OF USER GUIDE =====

TMA StrategyThe **TMA Strategy** is a trend-following strategy that leverages **Smoothed Moving Averages (SMMA)** and **candlestick patterns** to identify high-probability trading opportunities. It is designed for traders who want to capture strong trends while minimizing noise from short-term fluctuations.
**Key Features:**
✔ **Multiple Smoothed Moving Averages (SMMA):** Uses 21, 50, 100, and 200-period SMMAs to identify market trends and key support/resistance zones.
✔ **Candlestick Pattern Confirmation:** Incorporates **3-line strike** and **engulfing candle** patterns to confirm trade entries.
✔ **Dynamic Trend Filter:** A **2-period EMA** ensures that trades align with the dominant trend, reducing false signals.
✔ **Customizable Session Filter:** Allows users to enable/disable trading within specific market sessions (New York, London, Tokyo, etc.), ensuring trades are executed only during high-liquidity hours.
✔ **Risk Management:** Uses predefined exit conditions based on EMA/SMMA crossovers to lock in profits and minimize losses.
**Trading Logic:**
📌 **Long Entry:**
- Bullish Engulfing or 3-Line Strike pattern appears.
- Price is above the 200 SMMA.
- 2 EMA confirms an uptrend.
- Trade executes if session filter allows.
📌 **Short Entry:**
- Bearish Engulfing or 3-Line Strike pattern appears.
- Price is below the 200 SMMA.
- 2 EMA confirms a downtrend.
- Trade executes if session filter allows.
📌 **Exit Conditions:**
- Long trades exit when EMA(2) crosses **below** SMMA(200).
- Short trades exit when EMA(2) crosses **above** SMMA(200).
**Ideal Markets & Timeframes:**
✅ Best suited for **Forex, Stocks, and Crypto** markets.
✅ Works well on **higher timeframes (15m, 1H, 4H, Daily)** for stronger trend confirmation.
📢 **Disclaimer:**
This strategy is for educational purposes only. Backtest results do not guarantee future performance. Always use proper risk management and test in a demo account before live trading.
🚀 **Try the TMA Strategy now and enhance your trend-following approach!**

Destroyer LifeDestroyer Life Strategy - High-Frequency Long & Short Trading
Overview:
The Destroyer Life strategy is an advanced cryptocurrency trading algorithm designed for high-frequency execution on the 15-second timeframe. It combines CRT (Candle Range Trend) and Turtle Soup trading logic with multi-timeframe analysis to optimize entries and exits for both long and short trades. This strategy is specifically optimized for high-volatility crypto pairs, such as SOL/USD on MEXC, ensuring precise execution with minimal drawdown.
Key Features:
15-Second Timeframe Execution: Optimized for ultra-short-term trading.
Long & Short Strategy: Simultaneously identifies profitable buy and sell opportunities.
CRT & Turtle Soup Logic: Leverages price action patterns for enhanced trade accuracy.
Higher Timeframe Analysis (HTF): Incorporates liquidity zones, fair value gaps (FVG), and breaker blocks for context-aware trading.
Dynamic Position Sizing: Uses an adjustable leverage multiplier for risk-controlled trade sizing.
Commission Optimization: Ensures profitability even with trading fees.
Strict Risk Management: Implements exit conditions based on liquidity structure and trend reversals.
Strategy Performance (Backtested on SOL/USD - MEXC):
Overall Profitability: ~80% win rate in backtesting.
Net Profit: $3,151.12 (6.30% ROI).
Gross Profit: $3,795.68 (7.59%).
Gross Loss: $644.56 (1.29%).
Long Trades Profit: $1,459.05 (2.92%).
Short Trades Profit: $1,692.07 (3.38%).
Commission Paid: $924.82.
Minimum Trade Holding Period: 1-minute cooldown between trades.
Trading Logic:
Entry Conditions:
Long Trades: Triggered when the price enters a liquidity void and aligns with higher timeframe bullish bias.
Short Trades: Triggered when price approaches a resistance level with bearish higher timeframe confluence.
CRT & Turtle Soup Patterns: Identifies reversals by analyzing breakout and fake-out structures.
Exit Conditions:
Long Positions Close: Upon price exceeding a 3.88% profit threshold or reversing below an HTF structure.
Short Positions Close: Upon reaching a similar 3.88% threshold or showing strong bullish signals.
Dynamic Position Sizing:
Uses a leverage-based calculation that adapts trade size based on volatility.
Liquidity Awareness:
Tracks Mitigation Blocks (MB), Fair Value Gaps (FVG), Buy/Sell-Side Liquidity (BSL/SSL) to determine optimal execution.
Best Use Cases:
Scalpers & High-Frequency Traders: Those looking for rapid trade execution with short holding periods.
Crypto Traders Focused on Low Timeframes: Optimized for 15-second price action.
Traders Utilizing Liquidity Concepts: Built to exploit liquidity traps and inefficiencies.
Risks & Considerations:
High-Frequency Execution Requires Low Latency: Ensure your broker or exchange supports fast order execution.
Backtested Results May Vary: Real-time performance depends on market conditions.
Commission & Fees Impact Profits: Consider exchanges with low fees to maximize strategy efficiency.
Final Thoughts:
The Destroyer Life Strategy is designed for serious traders looking to take advantage of high-volatility markets with a structured, liquidity-based approach. By combining price action, liquidity concepts, and adaptive risk management, it provides a solid framework for executing high-probability trades on crypto markets.
🚀 Ready to take your trading to the next level? Try Destroyer Life today and dominate the markets!

TEMA OBOS Strategy PakunTEMA OBOS Strategy
Overview
This strategy combines a trend-following approach using the Triple Exponential Moving Average (TEMA) with Overbought/Oversold (OBOS) indicator filtering.
By utilizing TEMA crossovers to determine trend direction and OBOS as a filter, it aims to improve entry precision.
This strategy can be applied to markets such as Forex, Stocks, and Crypto, and is particularly designed for mid-term timeframes (5-minute to 1-hour charts).
Strategy Objectives
Identify trend direction using TEMA
Use OBOS to filter out overbought/oversold conditions
Implement ATR-based dynamic risk management
Key Features
1. Trend Analysis Using TEMA
Uses crossover of short-term EMA (ema3) and long-term EMA (ema4) to determine entries.
ema4 acts as the primary trend filter.
2. Overbought/Oversold (OBOS) Filtering
Long Entry Condition: up > down (bullish trend confirmed)
Short Entry Condition: up < down (bearish trend confirmed)
Reduces unnecessary trades by filtering extreme market conditions.
3. ATR-Based Take Profit (TP) & Stop Loss (SL)
Adjustable ATR multiplier for TP/SL
Default settings:
TP = ATR × 5
SL = ATR × 2
Fully customizable risk parameters.
4. Customizable Parameters
TEMA Length (for trend calculation)
OBOS Length (for overbought/oversold detection)
Take Profit Multiplier
Stop Loss Multiplier
EMA Display (Enable/Disable TEMA lines)
Bar Color Change (Enable/Disable candle coloring)
Trading Rules
Long Entry (Buy Entry)
ema3 crosses above ema4 (Golden Cross)
OBOS indicator confirms up > down (bullish trend)
Execute a buy position
Short Entry (Sell Entry)
ema3 crosses below ema4 (Death Cross)
OBOS indicator confirms up < down (bearish trend)
Execute a sell position
Take Profit (TP)
Entry Price + (ATR × TP Multiplier) (Default: 5)
Stop Loss (SL)
Entry Price - (ATR × SL Multiplier) (Default: 2)
TP/SL settings are fully customizable to fine-tune risk management.
Risk Management Parameters
This strategy emphasizes proper position sizing and risk control to balance risk and return.
Trading Parameters & Considerations
Initial Account Balance: $7,000 (adjustable)
Base Currency: USD
Order Size: 10,000 USD
Pyramiding: 1
Trading Fees: $0.94 per trade
Long Position Margin: 50%
Short Position Margin: 50%
Total Trades (M5 Timeframe): 128
Deep Test Results (2024/11/01 - 2025/02/24)BTCUSD-5M
Total P&L:+1638.20USD
Max equity drawdown:694.78USD
Total trades:128
Profitable trades:44.53
Profit factor:1.45
These settings aim to protect capital while maintaining a balanced risk-reward approach.
Visual Support
TEMA Lines (Three EMAs)
Trend direction is indicated by color changes (Blue/Orange)
ema3 (short-term) and ema4 (long-term) crossover signals potential entries
OBOS Histogram
Green → Strong buying pressure
Red → Strong selling pressure
Blue → Possible trend reversal
Entry & Exit Markers
Blue Arrow → Long Entry Signal
Red Arrow → Short Entry Signal
Take Profit / Stop Loss levels displayed
Strategy Improvements & Uniqueness
This strategy is based on indicators developed by "l_lonthoff" and "jdmonto0", but has been significantly optimized for better entry accuracy, visual clarity, and risk management.
Enhanced Trend Identification with TEMA
Detects early trend reversals using ema3 & ema4 crossover
Reduces market noise for a smoother trend-following approach
Improved OBOS Filtering
Prevents excessive trading
Reduces unnecessary risk exposure
Dynamic Risk Management with ATR-Based TP/SL
Not a fixed value → TP/SL adjusts to market volatility
Fully customizable ATR multiplier settings
(Default: TP = ATR × 5, SL = ATR × 2)
Summary
The TEMA + OBOS Strategy is a simple yet powerful trading method that integrates trend analysis and oscillators.
TEMA for trend identification
OBOS for noise reduction & overbought/oversold filtering
ATR-based TP/SL settings for dynamic risk management
Before using this strategy, ensure thorough backtesting and demo trading to fine-tune parameters according to your trading style.

Breakouts With Timefilter Strategy [LuciTech]This strategy captures breakout opportunities using pivot high/low breakouts while managing risk through dynamic stop-loss placement and position sizing. It includes a time filter to limit trades to specific sessions.
How It Works
A long trade is triggered when price closes above a pivot high, and a short trade when price closes below a pivot low.
Stop-loss can be set using ATR, prior candle high/low, or a fixed point value. Take-profit is based on a risk-reward multiplier.
Position size adjusts based on the percentage of equity risked.
Breakout signals are marked with triangles, and entry, stop-loss, and take-profit levels are plotted.
moving average filter: Bullish breakouts only trigger above the MA, bearish breakouts below.
The time filter shades the background during active trading hours.
Customization:
Adjustable pivot length for breakout sensitivity.
Risk settings: percentage risked, risk-reward ratio, and stop-loss type.
ATR settings: length, smoothing method (RMA, SMA, EMA, WMA).
Moving average filter (SMA, EMA, WMA, VWMA, HMA) to confirm breakouts.

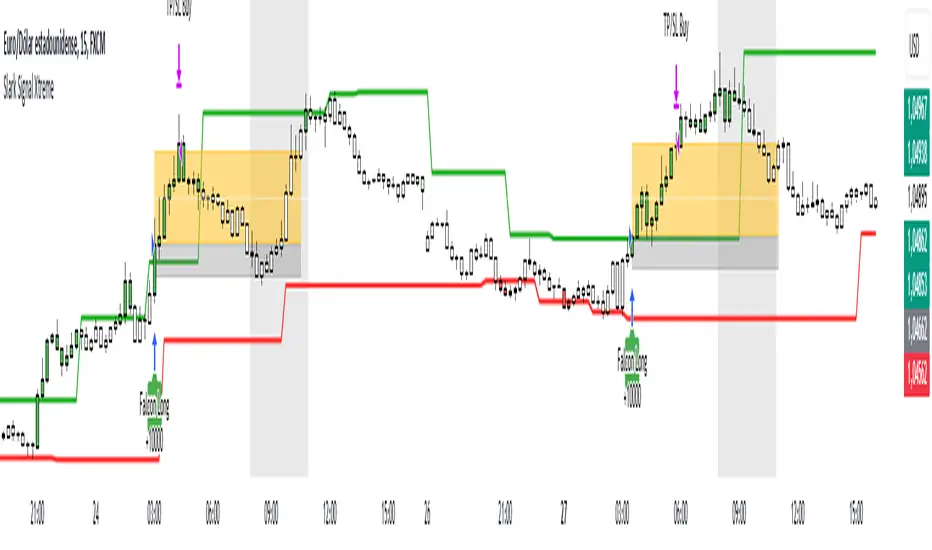
Slark Signal XtremeStrategy Description: Slark Signal Xtreme
The Slark Signal Xtreme is an innovative trading strategy designed to identify and capitalize on market opportunities by leveraging pivots, trend breakouts, and dynamic risk management. This strategy combines day-of-week and time filters with a ticks-based Stop Loss (SL) and Take Profit (TP) system, delivering customized signals and real-time alerts. Ideal for traders seeking a structured and highly customizable approach, Slark Signal Xtreme also incorporates advanced visual tools for efficient trade management.
Key Features:
Pivot- and Breakout-Based Signals: Utilizes pivot detection (highs/lows) combined with an ATR-based slope calculation to pinpoint trend changes and potential entry or exit points.
Dynamic Stop-Loss (SL) and Take-Profit (TP) Levels: Automatically calculates SL and TP based on the entry price and user-defined tick settings, adapting to volatility and optimizing risk management.
Time and Day Filters: Allows you to select specific days of the week and trading sessions during which signals are generated, avoiding low-liquidity periods or unwanted high volatility.
Customizable Risk Management: Lets you define the number of ticks for SL and TP, trading hours, initial capital, pyramiding, and commissions, tailoring the strategy to various risk profiles and assets.
Enhanced Visualization:
- SL and TP Boxes: Displays rectangular boxes on the chart indicating SL and TP levels, streamlining trade management.
- Candle Color Changes: Candles can be colored according to price position relative to pivot lines (bullish, bearish, or neutral).
- Session Highlight: Shades the chart background during the selected trading hours, providing immediate context on when the strategy is active.
Automated Alerts: Generates customizable alerts in TradingView whenever a buy or sell signal is triggered, detailing the timing, instrument, and SL/TP levels.
How the Strategy Works:
Technical Indicator Calculations:
- Pivot High/Low and Slope: Identifies price pivot points and calculates slope (based on ATR) to measure trend strength.
- Time and Day Filters: Signals only trigger within the specified days and hours, helping avoid undesirable market conditions.
Generating Buy and Sell Signals:
- Buy Signal (Long): Activated when price breaks above a downward pivot-based trendline or meets the condition for higher pivots.
- Sell Signal (Short): Activated when price breaks below an upward pivot-based trendline or meets the condition for lower pivots.
- Operation Conditions: Signals are only generated on selected days and during chosen trading hours, avoiding periods of low liquidity or excessive volatility.
Dynamic SL and TP Calculation:
- Stop-Loss (SL) and Take-Profit (TP): Determined by the entry price ± a user-defined number of ticks.
- SL and TP Visualization: Boxes are drawn on the chart from the entry price to SL/TP levels, enabling clear visual reference for trade management.
Order Execution and Alerts:
- Order Execution: When a signal is generated, Slark Signal Xtreme automatically opens a long or short position in TradingView’s backtesting environment.
- Alerts: Customizable alerts can be set up to provide real-time notifications (via TradingView or third-party integrations), offering essential details like instrument, time, SL/TP, etc.
Trade Management and Monitoring:
- Automatic Closure: Each trade is automatically closed upon reaching its SL or TP, ensuring disciplined risk control.
- Trade Summary: TradingView’s built-in reporting tools list all trades with cumulative results, simplifying performance evaluation.
Additional Visualization:
- Candle Coloring by Trend: Candles can be colored bullish, bearish, or neutral based on the pivot-driven trend detection.
- Operational Range Highlighting: The chart background is shaded during the permitted trading hours, clarifying when the strategy is active and enhancing visibility.
---
Strategy Properties (Important)
This backtest was conducted in TradingView under the following configuration:
Initial Capital: 1000 USD
Order Size: 10,000 contracts (adjust according to the traded asset)
Commission: 0.05 USD per order
Slippage: 1 tick
Pyramiding: 1 order
Price Verification for Limit Orders: 0 ticks
Recalculate on Every Tick & On Bar Close: Enabled
Bar Magnifier for Backtesting Precision: Enabled
These properties provide a realistic view of the strategy’s performance. However, default parameters may vary depending on each user or market:
Order Size: Should be calculated according to the asset traded and your desired risk level.
Commission and Slippage: Costs can vary by market and instrument; there is no universal default that guarantees realistic results.
All users are strongly recommended to adjust these properties within the script settings to match their own trading accounts and platforms, ensuring the most accurate backtest results.
---
Backtesting Results:
- Net Profit: +28.70
- Total Trades: 397
- Winning Trades: 138
- Win Rate: 34.76%
- Profit Factor: 1.07
- Sharpe Ratio: 1.25
- Sortino Ratio: 1.45
- Average Bars per Trade: 24
- Average Profit per Trade: 1.45
These numbers provide an overview of the strategy’s historical performance, demonstrating its potential for profitability given appropriate risk management.
---
Interpretation of Results:
- The strategy can be profitable despite a relatively modest win rate, thanks to a suitable risk-reward ratio.
- A profit factor of 1.07 indicates that total profits slightly exceed total losses.
- It is essential to monitor drawdown and ensure it aligns with your personal risk tolerance.
---
Risk Warning:
Trading leveraged financial instruments carries a high level of risk and may not be suitable for all investors. Before trading, carefully consider your investment objectives, experience level, and risk tolerance. Past performance does not guarantee future results. Always perform additional testing and adjust the strategy to your specific needs.
---
What Makes This Strategy Original?
Focus on Pivots and Time/Day Filters: Rather than purely relying on momentum indicators, Slark Signal Xtreme uses pivot-based signals and scheduling filters to capture higher-liquidity, directional market moves.
Dynamic Risk Management: Ticks-based SL/TP and customizable trading sessions enable precise adaptation to various markets and trading styles.
Advanced Visualization Tools: SL/TP boxes, candle coloring, and session highlights streamline market interpretation and facilitate real-time decision-making.
Seamless Alert Integration: Although native TradingView alerts are provided, it can be integrated with third-party messaging services (Telegram, Discord, etc.) for enhanced automation.
---
Additional Considerations
Continuous Testing and Optimization: Regularly backtest and fine-tune parameters (SL, TP, time filters, etc.) to accommodate changing market conditions.
Complementary Analysis: Combine this strategy with other technical or fundamental tools to confirm signals.
Rigorous Risk Management: Ensure SL/TP levels and position sizes conform to your overall risk management plan.
Updates and Support: Future updates and improvements may be released based on community feedback. For questions or suggestions, feel free to reach out.
---
Example Configuration
Assume you want to run Slark Signal Xtreme with these settings:
Trading Days: Monday to Friday
Trading Hours: 8:00 to 11:00 (exchange or broker time)
Stop Loss (SL) in Ticks: 100
Take Profit (TP) in Ticks: 300
SL/TP Box Extension: 20 bars
Initial Capital: 1000 USD
Risk per Trade: 1% of capital
Commissions & Slippage: 0.05 USD commission, 1 tick slippage
---
Conclusion
The Slark Signal Xtreme strategy delivers a robust and adaptable solution by merging pivots, time/day filters, flexible risk parameters, and advanced visualization. Its distinctive and customizable design makes it a powerful resource for traders aiming to diversify their methods and exploit trend breakouts under specific conditions. Fully compatible with TradingView, Slark Signal Xtreme can enhance your trading toolkit and foster a more systematic approach to your operations.
---
Final Disclaimer:
Financial markets are inherently volatile and pose significant risks. This strategy should be employed as part of a comprehensive trading plan and does not guarantee positive outcomes. Always consult a qualified financial advisor before making investment decisions. The use of Slark Signal Xtreme is solely at the user’s discretion, who must evaluate personal risk tolerance and financial objectives.
Enhanced BarUpDn StrategyEnhanced BarUpDn Strategy
The Enhanced BarUpDn Strategy is a refined price action-based trading approach that identifies market trends and reversals using bar formations. It focuses on detecting bullish and bearish momentum by analyzing consecutive price bars and key support/resistance levels.
Key Features:
✅ Trend Confirmation – Uses a combination of bar patterns and indicators (e.g., moving averages, RSI) to confirm momentum shifts.
✅ Entry Signals – A buy signal is triggered when an "Up Bar" (higher high, higher low) follows a bullish setup; a sell signal when a "Down Bar" (lower high, lower low) confirms bearish momentum.
✅ Enhanced Filters – Incorporates volume analysis and additional conditions to reduce false signals.
✅ Stop-Loss & Risk Management – Uses recent swing highs/lows for stop placement and dynamic trailing stops for maximizing gains.
