Breadth Indicators NYSE Percent Above Moving AverageBreadth Indicators NYSE - transmits the processed data from the Barchart provider
NYSE - Breadth Indicators
S&P 500 - Breadth Indicators
DOW - Breadth Indicators
RUSSEL 1000 - Breadth Indicators
RUSSEL 2000 - Breadth Indicators
RUSSEL 3000 - Breadth Indicators
Moving Average - 5, 20, 50, 100, 150, 200
The "Percentage above 50-day SMA" indicator measures the percentage of stocks in the index trading above their 50-day moving average. It is a useful tool for assessing the general state of the market and identifying overbought and oversold conditions.
One way to use the "Percentage above 50-day SMA" indicator in a trading strategy is to combine it with a long-term moving average to determine whether the trend is bullish or bearish. Another way to use it is to combine it with a short-term moving average to identify pullbacks and rebounds within the overall trend.
The purpose of using the "Percentage above 50-day SMA" indicator is to participate in a larger trend with a better risk-reward ratio. By using this indicator to identify pullbacks and bounces, you can reduce the risk of entering trades at the wrong time.
Bull Signal Recap:
150-day EMA of $SPXA50R crosses above 52.5 and remains above 47.50 to set the bullish tone.
5-day EMA of $SPXA50R moves below 40 to signal a pullback
5-day EMA of $SPXA50R moves above 50 to signal an upturn
Bear Signal Recap:
150-day EMA of $SPXA50R crosses below 47.50 and remains below 52.50 to set the bearish tone.
5-day EMA of $SPXA50R moves above 60 to signal a bounce
5-day EMA of $SPXA50R moves below 50 to signal a downturn
Tweaking
There are numerous ways to tweak a trading system, but chartists should avoid over-optimizing the indicator settings. In other words, don't attempt to find the perfect moving average period or crossover level. Perfection is unattainable when developing a system or trading the markets. It is important to keep the system logical and focus tweaks on other aspects, such as the actual price chart of the underlying security.
What do levels above and below 50% signify in the long-term moving average?
A move above 52.5% is deemed bullish, and below 47.5% is deemed bearish. These levels help to reduce whipsaws by using buffers for bullish and bearish thresholds.
How does the short-term moving average work to identify pullbacks or bounces?
When using a 5-day EMA, a move below 40 signals a pullback, and a move above 60 signals a bounce.
How is the reversal of pullback or bounce identified?
A move back above 50 after a pullback or below 50 after a bounce signals that the respective trend may be resuming.
How can you ensure that the uptrend has resumed?
It’s important to wait for the surge above 50 to ensure the uptrend has resumed, signaling improved breadth.
Can the system be tweaked to optimize indicator settings?
While there are various ways to tweak the system, seeking perfection through over-optimizing settings is advised against. It's crucial to keep the system logical and focus tweaks on the price chart of the underlying security.
RUSSIAN \ Русская версия.
Индикатор "Процент выше 50-дневной скользящей средней" измеряет процент акций, торгующихся в индексе выше их 50-дневной скользящей средней. Это полезный инструмент для оценки общего состояния рынка и выявления условий перекупленности и перепроданности.
Один из способов использования индикатора "Процент выше 50-дневной скользящей средней" в торговой стратегии - это объединить его с долгосрочной скользящей средней, чтобы определить, является ли тренд бычьим или медвежьим. Другой способ использовать его - объединить с краткосрочной скользящей средней, чтобы выявить откаты и отскоки в рамках общего тренда.
Цель использования индикатора "Процент выше 50-дневной скользящей средней" - участвовать в более широком тренде с лучшим соотношением риска и прибыли. Используя этот индикатор для выявления откатов и отскоков, вы можете снизить риск входа в сделки в неподходящее время.
Краткое описание бычьего сигнала:
150-дневная ЕМА на уровне $SPXA50R пересекает отметку 52,5 и остается выше 47,50, что задает бычий настрой.
5-дневная ЕМА на уровне $SPXA50R опускается ниже 40, сигнализируя об откате
5-дневная ЕМА на уровне $SPXA50R поднимается выше 50, сигнализируя о росте
Обзор медвежьих сигналов:
150-дневная ЕМА на уровне $SPXA50R пересекает уровень ниже 47,50 и остается ниже 52,50, что указывает на медвежий настрой.
5-дневная ЕМА на уровне $SPXA50R поднимается выше 60, сигнализируя о отскоке
5-дневная ЕМА на уровне $SPXA50 опускается ниже 50, что сигнализирует о спаде
Корректировка
Существует множество способов настроить торговую систему, но графологам следует избегать чрезмерной оптимизации настроек индикатора. Другими словами, не пытайтесь найти идеальный период скользящей средней или уровень пересечения. Совершенство недостижимо при разработке системы или торговле на рынках. Важно поддерживать логику системы и уделять особое внимание другим аспектам, таким как график фактической цены базовой ценной бумаги.
Что означают уровни выше и ниже 50% в долгосрочной скользящей средней?
Движение выше 52,5% считается бычьим, а ниже 47,5% - медвежьим. Эти уровни помогают снизить риски, используя буферы для бычьих и медвежьих порогов.
Как краткосрочная скользящая средняя помогает идентифицировать откаты или отскоки?
При использовании 5-дневной ЕМА движение ниже 40 указывает на откат, а движение выше 60 указывает на отскок.
Как определяется разворот отката или отскока?
Движение выше 50 после отката или ниже 50 после отскока сигнализирует о возможном возобновлении соответствующего тренда.
Как вы можете гарантировать, что восходящий тренд возобновился?
Важно дождаться скачка выше 50, чтобы убедиться в возобновлении восходящего тренда, сигнализирующего о расширении диапазона.
Можно ли настроить систему для оптимизации настроек индикатора?
Хотя существуют различные способы настройки системы, не рекомендуется стремиться к совершенству с помощью чрезмерной оптимизации настроек. Крайне важно сохранить логичность системы и сфокусировать изменения на ценовом графике базовой ценной бумаги.
Cari skrip untuk "bear"

RSI ATR Range [SS]Hey everyone,
Over the course of the last year I had a bunch of requests to do something with RSI. I did do an RSI expected move plotter, but the requests were to overhaul RSI and make it better I guess.
So here is my attempt!
This is the RSI ATR plotter. Its similar to my RSI expected move plotter, however, it gives you the ATR ranges associated with the current RSI value. This allows you to conceptualize RSI in a different way. Instead of looking for "oversold" over "overbought", you can actually just see the expected high to open range and the expected open to low range based on the current RSI.
This will allow you to determine such things as:
a) Is it likely to be bullish?
b) Is it likely to be bearish?
c) The average move, in a dollar amount, associated with this RSI.
In addition to presenting RSI in terms of ranges as opposed to the actual RSI value, the indicator will also signal likely reversal areas. Whenever there is a huge spike in RSI and range, whether it be up or down, this generally corresponds to an imminent reversal. The indicator is programmed to recognize this and plot little grey circles to notify you of an impending reversal.
Let's take a look at some reversal examples using NVDA:
In the chart above, we can see that the RSI signaled a reversal. As it was part of a downtrend, the reversal was bullish.
Let's look at a top reversal:
The chart above shows a likely downside reversal.
And some little bounce reversals here and there:
In addition to showing you the ATR range and reversals, the indicator will show you the RSI in a bar graph format:
You won't be able to look for RSI divergences, if you are a believer of those. However, you can definitely visualize them in the ATR ranges which are directly affected by the RSI readings.
Aspects of the indicator:
Bull ranges are displayed in green.
Bear ranges are displayed in red.
When green is present we know its entering or currently in a bullish RSI range:
Inversely, when it starts to shift red, we know we are entering a bearish RSI range:
There is a border that circles the range. It will be green when we are in a bullish range and red when we are in a bearish range. In addition to these 2 signals, the RSI bar chart itself will turn green in bullish ranges, and red in bearish ranges.
Here is bullish:
Here is bearish:
Customizability
You can customize the Source input for the RSI (default is close). As well as the length (default is 14).
The ATR length is defaulted to 500. My suggestion is to leave this be. You can increase it but I would not suggest decreasing it as it may omit some of the RSI ranges from its history.
And that is the indicator my friends! Hope you enjoy!
As always, safe trades!

Unmitigated Liquidity Imbalances [AlgoAlpha]🎉 Introducing the Unmitigated Liquidity Imbalance Indicator by AlgoAlpha! 🎉
Dive into the depths of market analytics with our "Unmitigated Liquidity Imbalance" indicator. This tool harnesses unique algorithms to detect liquidity imbalances between bulls and bears, helping traders spot trends and potential entry and exit points with greater accuracy. 📈🚀
🔍 Key Features:
🌟 Advanced Analysis : Analyses candle direction and length to forecast market peaks and valleys.
🎨 Customizable Visuals : Tailor the chart with your choice of bullish green or bearish red to reflect different market conditions.
🔄 Real-Time Updates : Continuously updates to reflect live market changes.
🔔 Configurable Alerts : Set up alerts for key trading signals such as bullish and bearish reversals, as well as trend shifts.
📐 How to Use:
🛠 Add the Indicator : Add the indicator to your favourites and customize the settings to suite your needs.
📊 Market Analysis : Monitor the oscillator threshold; readings above 0.5 suggest bullish sentiment, while below 0.5 indicate bearish conditions. And reversal signals are displayed to show potential entry points.
🔔 Set Alerts : Enable notifications for reversal conditions or trend changes to seize trading opportunities without constant chart watching.
🧠 How It Works:
The core mechanism of the indicator is based on detecting changes in candlestick size and direction to identify bullish and bearish liquidity levels from the peak & valley indicator's logic. By comparing the length of a current candle to the previous one and checking the change in direction, it pinpoints moments where market sentiment could be shifting, indicating if the liquidity at that point is bullish or bearish. The script then looks at what percentage of the past few unmitigated levels are bullish or bearish based on a customizable lookback and determines the liquidity imbalance which can then be interpreted as trend.
Empower your trading with the Unmitigated Liquidity Imbalance indicator and navigate the markets with confidence and precision. 🌟💹
Happy trading, and may your charts be ever in your favour! 🥳✨
💎 Related Indicator

RSI Divergence AlertsIndicator Description: RSI Divergence Alerts
The RSI Divergence indicator is a technical analysis tool that identifies divergences between the Relative Strength Index (RSI) and the price of an asset. The RSI is a momentum indicator that measures the speed and magnitude of recent changes in an asset's price, while divergences occur when there is a disparity between price movements and the RSI.
Indicator Customization:
Overbought and Oversold: The indicator allows you to customize the overbought and oversold levels of the RSI. This allows traders to adjust parameters according to their preferences and the historical behavior of the asset in question.
Indicator Settings and Recommended Adjustments:
Max Bar Distance: This parameter determines the maximum distance allowed between two low or high points for a divergence to be recognized. A higher value may result in more signals, but may also increase the number of false signals. It is recommended to adjust this value based on the volatility of the asset and the time period in which it is being traded.
RSI Length: This is the time period used to calculate the RSI. A longer period smoothes the indicator, while a shorter period makes it more sensitive to price changes. The default value is 14, but traders can adjust it based on their trading strategy and the asset's volatility.
RSI Overbought and Oversold: These values determine the levels at which the RSI is considered overbought and oversold, respectively. The default value for overbought is 75 and for oversold is 35. Traders can adjust these values according to the asset's volatility and its historical analysis. For example, in more volatile assets, it may be useful to use more extreme levels, such as 80 for overbought and 20 for oversold.
When adjusting indicator settings, traders must consider the balance between sensitivity and accuracy. Careful tuning of these parameters can help filter out false signals and identify more reliable trading opportunities.
The alerts functionality in this RSI Divergence indicator is designed to notify traders when a bearish divergence or a bullish divergence is detected. Here's how it works:
Conditionally Triggered Alerts:
Alerts are triggered based on the boolean variables bearishDivergence and bullishDivergence.
If bearishDivergence is true, it indicates that a bearish divergence has been detected.
If bullishDivergence is true, it indicates that a bullish divergence has been detected.
Alert Message:
When a divergence is detected, an alert message is generated to inform the trader about the event.
The message includes details about the divergence, such as the difference in the RSI value between the two points forming the divergence.
For example, for a bearish divergence, the message will include the phrase "Bearish RSI Divergence Detected" and the RSI difference between the high and low points of the divergence.
Alert Frequency:
Alerts are configured to be triggered once per bar close (alert.freq_once_per_bar_close), which means the alert will only be sent once at the close of each bar.
This helps to avoid multiple alerts for the same divergence during the same time period.
Additional Alert Conditions:
In addition to conditionally triggered alert messages, alert conditions are defined for both bearish and bullish divergences.
These alert conditions are useful for configuring custom alerts on trading platforms that support running Pine Script code.
Overall, this alert functionality allows traders to stay informed about potential trading opportunities based on divergences detected by the indicator. This can help traders make faster and more informed decisions in their trading processes.

Algoflow's Levels PlotterAlgoflow's Levels Plotter - Indicator
Release Date: Jan. 15, 2024
Release version: v3 r1
Release notes date: Jan. 15, 2024
Overview
Parses user's input of levels to be plotted and labeled on the chart for NQ & ES futures
Features
Quick plotting of predetermined price levels.
- Type or copy from another source of values in a predetermined output format.
Supports separate line plotting for Weekly, OVN and RTH values
- Plot only Weekly, OVN or RTH levels, or all
- Configure colors separately for Inflection Points, Weekly, OVN & RTH levels
- Shift/place price labels separately to easily identify levels
User Impacts of Changes
Requires users to remove previous version and re-add indicator "Algoflow's Levels Plotter", then re-add values. Colors and shift values will need to be re-entered and/or reconfigured
Support
Questions, feedbacks, and requests are welcomed. Please feel free to use Comments or direct private message via TradingView.
Quick usage notes:
The indicator allows you to enter data for both ES & NQ at the same time. This is useful in single chart window/layout situations, like viewing on the phone. When you switch between futures, the data is already there.
If you leave the entries blank, nothing will be plotted. This is useful if you want to have separate charts for ES & NQ. So you can just enter only the relevant data of either.
As an indicator, input values are saved within it, until it is removed from the chart. Input for one chart will not update other charts of the same ticker, even in the same layout.
The easiest and quickest way to share the inputs across all charts and layouts is to use the Indicator Templates feature.
- After input values are entered (for both ES & NQ futures) via the indicator's Settings, select ""Save as Default"".
- Click on ""Indicator Templates"" (4 squares icon), and click on ""Save Indicator template...""
- Remove the previous version of the indicator in other charts.
- Click on ""Indicator Templates"" icon, and select the newly created template. Repeat this for other charts of the same futures ticker
The labels can be disabled in settings > Style tab. Use the Inputs tab to configure orientation (left or right of current bar on chart), and how much spacing from the current (in distance of bars)
Format example:
Primary directional inflection point: 1234
For Bulls: 1244.25, 1254, 1264.50
For Bears: 1224, 1214, 1204
Changes
v3 r1 - Fixed erroneous default values in Weekly input sections. Added options to en/disable display of each set (session) of levels. Default label text size to normal, from small.
- Jan 15, 2024
v2 r9 - Added support for USTEC & US500.
- Dec. 10, 2023
v2 r8 - Added configuration features for users to modify the labels' text colors and size. Simplified code further by moving inputs processing modules into a single user function.
- Oct. 31, 2023
v2 r7 - Added support for the micro NQ & ES. Modified to ignore string case in inputs
- Oct 18, 2023
v2 r4 - Added support of weekly lines and labels features. Began the process of optimizing/simplifying code
- Oct. 15, 2023
v2 r3 - Made Inflection Point levels' colors configurable
- Oct. 04, 2023
v2 r2 - Removed comments & debug codes from development build revision #518
- Oct. 04, 2023
v2 r1 - Released from development revision #518. Major rewrite to fix previous and overlapping plots of lines and labels.
- Oct. 04, 2023
v1 r2 - First release of indicator
- Oct. 02, 2023

MACD-all in one_Pro[vn]👉 Hello traders.
Introducing the "MACD-All-in-One" indicator including functions:
• Automatically scan MACD-Histogram divergence
• Automatically scan MACD-Histogram divergence-missing right shoulder
• Automatically scan the Engulfing candlestick pattern when the MACD line crosses the Signal line
• Automatically create warnings when there are signals of Regular divergence, missing right shoulder divergence, Engulfing candlestick pattern
Explain:
💥1. Regular divergence
1.1 Bullish divergence
+ The price creates the next bottom lower than the previous bottom
+ The histogram of the next bottom is higher than the previous bottom and is located below the 0 axis (between the two histogram bottoms there must be a histogram located on the 0 axis for clear distinction)(Hình 1)👇👇
1.2 Bearish divergence
+ The price creates a higher peak than the previous peak
+ The histogram of the next bottom is lower than the previous bottom and is above the 0 axis (between the two histogram peaks there must be a histogram below the 0 axis for clear distinction)(Hình 2)👇👇
💥2. Divergence lacking right shoulder
2.1 Bullish divergence missing the right shoulder
+ The price creates the next bottom lower than the previous bottom
+ The histogram of the posterior bottom does not form and the histogram is still above the zero line (only the histogram of the previous bottom is below the zero line)
+ The meaning is that when the price creates a lower bottom but the buying force is already very strong, the histogram of the next bottom does not form and the price will increase(hình 3&4)👇👇
2.2 Bearish divergence missing the right shoulder
+ The price creates a higher peak than the previous peak
+ The histogram of the next peak does not form and the histogram is still below the zero line (only the histogram of the previous peak is on the zero line)
+ The meaning is that when the price creates a higher peak but the buying force has weakened, the histogram of the next bottom does not form and the price will go down.(hình 5 & 6)👇👇
💥3. Engulfing candlestick pattern
When the MACD and Signal lines intersect and there appears a pair of engulfing (completely) candlesticks, that candlestick will be marked as 'E⌃' in green (bullish engulfing) or 'E⌄' in red (Bearish engulfing)(hình 7 & 8)👇👇
💥4. Automatic alerts include 5 levels: Bull, Bear, Bullish Engulfing, Bearish Engulfing, bullish divergence missing the shoulder, bearish divergence missing the shoulder
//-------------------------Extra feature: Impulse System
This indicator also includes the “Impulse System”. The Impulse System is based on two indicators, a 13-day exponential moving average and the MACD-Histogram, and identifies inflection points where a trend speeds up or slows down. The moving average identifies the trend, while the MACD-Histogram measures momentum. This unique indicator combination is color coded into the price bars or macd histogram bars for easy reference.
Calculation:
Green Price Bar: (13-period EMA > previous 13-period EMA) and
(MACD-Histogram > previous period's MACD-Histogram)
Red Price Bar: (13-period EMA < previous 13-period EMA) and
(MACD-Histogram < previous period's MACD-Histogram)
Histogram bars are colored blue when conditions for a Red Histogram Bar or Green Histogram Bar are not met. The MACD-Histogram is based on MACD(12,26,9).
The Impulse System works more like a censorship system. Green histogram bars show that the bulls are in control of both trend and momentum as both the 13-day EMA and MACD-Histogram are rising (you don't have permission to sell). A red histogram bar indicates that the bears have taken control because the 13-day EMA and MACD Histogram are falling (you don't have permission to buy). A blue histogram bar indicates mixed technical signals, with neither buying nor selling pressure predominating (either both buying or selling are permitted).
-------------------------------//
💥5. Additional:
+Shows a pair of EMA12 vs EMA24.
+Shows Keltner Channels (using ATR) are volatility-based envelopes set above and below an exponential moving average.
//-------------------------------------------------------------------------------------------------------------//
✍️Conclude:
From this indicator there are 3 ways to trade:
• Method 1: Enter an order following the automatic Bull or Bear signal when the indicator appears
• Method 2: Enter an order following the automatic signal of the green vertical line (Long) or the red vertical line (Short) when the indicator appears
• Method 3: Enter orders according to the pair of engulfing candles 'E⌃' or 'E⌄' (because this is a combination of the method of engulfing candles and 2 MA lines intersecting each other)
• From this indicator, I created a "bot" that scans for "right shoulder missing divergence" signals for 40 trading pairs at the same time in real time. (hình 9)👇👇👇
//---------------------------------------------------------------------------------------------------------------
👉 Xin chào trader Việt Nam.
Giới thiệu chỉ báo "MACD-Tất cả trong một " bao gồm các chức năng:
• Tự động quét phân kì MACD-Histogram
• Tự động quét phân kì MACD-Histogram-thiếu vai phải
• Tự động quét mô hình nến nhấn chìm(Engulfing) khi đường MACD cắt đường Signal
• Tự động tạo cảnh báo khi có tín hiệu phân kì thường(Regular) , phân kì thiếu vai phải, mô hình nến Engulfing
Diễn giải:
💥1. Phân kì thường
1.1 Phân kì tăng
+ Giá tạo đáy sau thấp hơn đáy trước
+ Histogram của đáy sau cao hơn đáy trước và nằm bên dưới trục số 0(giữa hai đáy histogram phải có histogram nằm trên trục số 0 để phân biệt rõ ràng)(Hình 1 bên trên)☝️☝️
1.2 Phân kì giảm
+ Giá tạo đỉnh sau cao hơn đỉnh trước
+ Histogram của đáy sau thấp hơn đáy trước và nằm trên trên trục số 0(giữa hai đỉnh histogram phải có histogram nằm dưới trục số 0 để phân biệt rõ ràng)(Hình 2 bên trên)☝️☝️
💥2. Phân kì thiếu vai phải
2.1 Phân kì tăng thiếu vai phải
+ Giá tạo đáy sau thấp hơn đáy trước
+ Histogram của đáy sau không hình thành và histogram vẫn nằm bên trên trục số 0(chỉ có histogram của đáy trước dưới trục số 0)
+ Ý nghĩa rằng khi giá tạo đáy sau thấp hơn nhưng lực mua đã rất mạnh làm cho histogram đáy sau không hình thành và giá sẽ tăng lên(Hình 3 vs 4 bên trên)☝️☝️
2.2 Phân kì giảm thiếu vai phải
+ Giá tạo đỉnh sau cao hơn đỉnh trước
+ Histogram của đỉnh sau không hình thành và histogram vẫn nằm bên dưới trục số 0(chỉ có histogram của đỉnh trước trên trục số 0)
+ Ý nghĩa rằng khi giá tạo đỉnh sau cao hơn nhưng lực mua đã yếu dần làm cho histogram đáy sau không hình thành và giá sẽ đi xuống(Hình 5 vs 6 bên trên)☝️☝️
💥3.mô hình nến nhấn chìm
Khi hai đường MACD và Signal cắt nhau mà tại đó xuất hiện cặp nến nhấn chìm (hoàn toàn) thì trên thanh nến đó sẽ đánh dấu là 'E⌃' màu xanh (nhấn chìm tăng) hay 'E⌄' màu đỏ(nhấn chìm giảm)(Hình 7 vs 8 bên trên)☝️☝️
💥4. Cảnh báo tự động bao gồm có 5 mức : Bull, Bear, Bullish Engulfing, Bearish Engulfing, phân kì tăng thiếu vai, phân kì giảm thiếu vai
//--------------------Tính năng bổ sung: Hệ thống Impulse(xung)
Chỉ báo này cũng bao gồm “Hệ thống xung”. Hệ thống Impulse dựa trên hai chỉ báo, đường trung bình động hàm mũ EMA13 và Biểu đồ MACD, đồng thời xác định các điểm uốn trong đó xu hướng tăng tốc hoặc chậm lại. Đường trung bình động xác định xu hướng, trong khi biểu đồ MACD đo động lượng. Sự kết hợp chỉ báo độc đáo này được sơn thanh biểu đồ macd-histogram để dễ tham khảo.
Phép tính:
Thanh giá xanh lá : (EMA13 kỳ > EMA 13 kỳ trước đó) và (histogram sau > histogram trước)
Thanh giá màu đỏ: (EMA13 kỳ < EMA 13 kỳ trước đó) và (histogram sau < histogram trước)
Thanh biểu đồ có màu xanh lam khi các điều kiện cho histogram màu đỏ hoặc histogram màu xanh lá không được đáp ứng. Biểu đồ MACD dựa trên MACD(12,26,9).
Lưu ý: Hệ thống Impulse hoạt động giống một hệ thống kiểm duyệt hơn. Các thanh biểu đồ màu xanh lá cho thấy phe bò đang kiểm soát cả xu hướng và động lượng vì cả EMA13 và MACD-Histogram đều tăng (bạn không được phép bán). Thanh biểu đồ màu đỏ cho biết phe gấu đã nắm quyền kiểm soát vì biểu đồ EMA13 và MACD histogram đang giảm (bạn không được phép mua). Thanh biểu đồ màu xanh lam biểu thị các tín hiệu kỹ thuật hỗn hợp, không có áp lực mua và bán chiếm ưu thế (cho phép cả mua hoặc bán).
-------------------------//
💥5. Bổ sung:
+ Hiển thị một cặp EMA12 vs EMA24.
+ Hiển thị Kênh Keltner (sử dụng ATR) là các đường bao dựa trên mức độ biến động được đặt ở trên và dưới đường trung bình động hàm mũ.
//----------------------------------------------------------------------------------------------------------------//
✍️Kết luận:
Từ chỉ báo này có 3 cách giao dịch:
• Cách 1: Vào lệnh theo tín hiệu tự động Bull hoặc Bear khi chỉ báo hiện ra
• Cách 2: Vào lệnh theo tín hiệu tự động đường dọc xanh(Long) hoặc đường dọc đỏ(Short) khi chỉ báo hiện ra
• Cách 3: Vào lệnh theo cặp nến nhấn chìm 'E⌃' hay 'E⌄'(vì đây là tổng hợp từ phương pháp của nến nhấn chìm và 2 đường MA cắt nhau)
• Từ chỉ báo này tôi có lập nên "con bot" quét tín hiệu "phân kì thiếu vai phải " cùng lúc 40 cặp giao dịch theo thời gian thực. (Hình 9 bên trên)☝️☝️☝️

Machine Learning: Support and Resistance [YinYangAlgorithms]Overview:
Support and Resistance is normally based upon Pivot Points and Highest Highs and Lowest Lows. Many times coders even incorporate Volume, RSI and other factors into the equation. However there may be a downside to doing a pure technical approach based on historical levels. We live in a time where Machine Learning is becoming more and more used; thus we have decided to create a Machine Learning Support and Resistance Projection based Indicator. Rather than using traditional Support and Resistance calculations using historical data, we have taken a rather different approach. This Indicator instead attempts to Predict and Project where Support and Resistance locations will be based on a Machine Learning Model using a form of KNN (k-Nearest Neighbors).
Since this indicator creates a Projection of where it deems Support and Resistance will be, it has the ability to move its Support and Resistance before the price even gets to it if it believes it will surpass its projections. This may create a more accurate placement of Support and Resistance as they’re not based on historical levels.
This Indicator does not Repaint.
How it works:
This Indicator makes its projections based on the source you provide (by default close) of the previous bar and submits the source, RSI and EMA to our Projection Function to get its projection of the current bar.
The Projection function essentially calculates potential movement after finding the differences between the source the MA from the current bar, previous bar and average over the span of Machine Learning Length.
Potential movement is defined as:
Average Difference + Average(Machine Learning Average, Average Last Distance)
Average Difference: (Absolute value of Current Source - Current MA) - (Absolute value of Machine Learning Average - Machine Learning MA)
Average Last Distance: Average(Current Source - Current MA, Previous Source - Previous MA)
It then predicts the next bars directional movement (bullish or bearish bar) using several factors:
Previous Source > Previous MA
Current Source - Current MA > Average Source - Average MA
Current RSI > Previous RSI
Current RSI > 30 and Previous RSI <= 30
Current RSI < 70 and Previous RSI >= 70
This helps us to predict the direction the next bar may move.
We then calculate a multiplier that we apply to our Potential Movement value to get our final result which is our Current Bars Close Projection.
Our multiplier is calculated using:
(Current RSI > 30 and Previous RSI <= 30) OR (Current RSI < 70 and Previous RSI >= 70)
Current Source - Current MA > Previous Source - Previous MA
We then create an array and fill it with the previous X projections (Machine Learning Length) and send it to another function. This function, if told to, will sort the data accordingly and then output the KNN average of the length given.
We calculate and plot various KNN lengths to create different Zones:
Strong Support: Length of 2 but sort the data Ascending (low to high)
Strong Resistance: Length of 2 but sort the data Descending (high to low)
Support: Length of Machine Length Length / 10 or Min of 2 sorted by Ascending
Resistance: Length of Machine Length Length / 10 or Min of 2 sorted by Descending
There are also 4 other plots you may be wondering what they are, there is your AVG, VWMA, Long Term Memory and Current Projection.
By default your Current Projection is disabled in settings but you can enable it if you are curious to see how the projections for each close are calculated. It is, however, not a crucial point of interest (white line).
The average is simply the average value of the Machine Learning Data (purple line).
The VWMA is a VWMA calculation applied to our Data over a length specified in settings (by default 1)(blue line). The VWMA is crucial when combined with the Avg as they can cross over and under each other. These crosses represent potential Bullish and Bearish zones.
Lastly, but certainly not least, we have the Long Term Memory (maroon line). The Long Term Memory can be displayed either as an ‘Average’, ‘Hard Line’ or ‘None’. The Long Term Average is only updated every Machine Learning Length Bar Index’s and is populated with the average of the Machine Learning Data. For Instance, if Machine Learning Length is set to 100, the Long Term Memory is only updated every 100 bars, and since its length is the same as the Machine Learning Length, that means its data is composed of 10,000 bars worth of data. The Long Term Memory may be very beneficial for determining where Support and Resistance lie over the Long Term within a Machine Learning Algorithm. When set to ‘Average’ it plots the connection lines diagonally, and although they may be more visually appealing, they’re less useful when it comes to actually seeing support and resistance as generally speaking, support and resistance lie on the horizontal. When set to ‘Hard Line’ the Long Term Memory is connected with hard lines and holds the price value until the next time it is updated. This makes it much more useful for potentially identifying Support and Resistance.
Tutorial:
Here is an overview of what the Indicator looks like, now let's start to dissect it.
In the example above we can see how all of the lines between the Major Support and Resistance zones may act as BOTH Support and Resistance depending on which side the price is currently on. In the circle on the left, we can see how it can fluctuate between the two. If you look at the circle on the right, we can see how the Average line acts as a strong support before it fails to maintain it. Generally speaking, most Support and Resistance locations may potentially fail to hold after 3 tests, as the Average did in this example.
As you can see, the Support and Resistance doesn’t wait to be tested before adjusting, which is why there are 2 lines which create their zones. The inner line is the Support/Resistance and the outer line is the Strong Support/Resistance. The Yellow Circle shows the inner line was able to calculate the moving resistance correctly and then adjusted accordingly as it was projecting the price to keep increasing. However, if you look at the White Circle, you can see that since there was first a crash, and then parabolic movement, that the inner zone could not move and predict the resistance as well as the outer zone could.
We consider the price to be ‘Overvalued’ when it is above the VWMA (blue line) and ‘Undervalued’ when it is below the VWMA. It is considered ‘fair’ price when it is within the VWMA to Average zone (between the blue and purple lines). If you look at the example above, you’ll notice where the two yellow circles are, it is not only considered ‘Overvalued’, but it then proceeds to ride the inner resistance line upwards. This is common when the market is overly bullish and vice versa when it is bearish. Please keep in mind, although it is common, it doesn’t mean a correction can’t happen.
In this example above we look at the last bull run that may have started due to the halving. This bull run was very bullish as you can see in the example above. The price was constantly sitting within the Resistance Zone and the VWMA that was very close to it was constantly acting as a Support. Naturally, due to the Algorithm used in this Indicator, as the momentum starts to slow down, the VWMA (blue line) will start to space out more and more from the Resistance Zone. This doesn’t mean the momentum is gone, it just means it may be slowing down.
Unfortunately we have to study the Bear Market with a different perspective than the Bull Market. However, there are still some similarities within the two. If you refer to the example above and the previous example, you can clearly see that the Bull Market loves to stay with the Resistance Zone and use the VWMA as a Support. However, the Bear Market does not. This is a normal occurrence, however we can see from the example above you may see a correction / horizontal movement when the Outer Support Line is touched. If you look at all 3 yellow circles, the Outer Support Line was touched, then either a small correction or horizontal consolidation occurred.
We will conclude our Tutorial here, hopefully you’ll be able to benefit from a moving Support and Resistance calculated with Machine Learning that projects its locations, rather than using traditional calculations.
Settings:
Source: This source is the base for all our calculations
Machine Learning Length: How much projection data are we storing and using to make calculations.
Smoothing Length: We need to smooth calculations such as RSI, EMA and VWMA. What length are we smoothing it with?
VWMA ML Projection Length: How far into our Machine Learning data should we average for our VWMA. Please note the 'Smoothing Length' is still applied here after getting the Projection Average.
Long Term Memory: Long term memory has the same storage length but is only updated once per Machine Learning Length. For instance, if Machine Learning Length is 100, it will save the Average of our data once every 100 bars. This means its memory is an average of 10,000 bars of Machine Learning. 'Average' connects its values diagonally whereas 'Hard Line' holds its value until it changes.
Use Average Last Distance In Potential Movement: This can help accuracy but generally also displaces the Support and Resistance by projecting it further.
Show Current Projection: Projections occur for each bar, and our Machine Learning utilizes these projections by storing and evaluating them. This toggle will display the Current Projection Line which is used to create all our Projections.
If you have any questions, comments, ideas or concerns please don't hesitate to contact us.
HAPPY TRADING!

YinYang MomentumOverview:
YinYang Momentum is a Price, Volume and Momentum Oscillator. Its job is to help you see swings in momentum and the strength of it. It also creates signals (Blood Diamond (Bear) and Support Cross (Bull)) where these momentum swings may occur. YinYang Momentum features 3 Price and 3 Volume 'Mountains with Ice'. There are Predictive, Regular and Confirming Mountains. You have the ability to overlay them on top of each other which helps to decipher momentum swings. The Volume Mountains are very important for showing the strength behind the Price Mountains and their Signals. If you look, you'll notice, as the 'Ice' starts to curve into the 'Mountains' it signals a potential shift in Momentum. The green Mountain is the Predictive, the Blue is the Regular and the Purple is the Confirming. You'll also notice that the Predictive Mountains movements happen first and move much more drastically. When you notice the regular starts to follow suit, there is a potential for a momentum shift. Shortly after, a signal will occur if this shift is actually happening. You can also check the Confirming Mountain for more confirmation (however, leaving the Confirming Mountain active can be a little confusing and make it harder to read signals). YinYang Momentum also features Information Tables. These tables display how the Blood Diamonds and Support Cross' are fairing on different Timeframes. This way, you'll be able to see if it's in a Bullish or Bearish state on critical Time Frames no matter what Timeframe you're trading on.
Before we move onto the tutorial, let's discuss what each of these Mountains and Ice are and how they work. All of our Mountains and Ice are calculated using the same algorithm but with varying sources, lengths and multipliers. We are essentially calculating differences in movement and then sending those differences into an EMA for the Mountain Base and SMA for the mountain Ice. The values we use for the Predictive are much lower and therefore occur much quicker as they aren’t averaged out on longer lengths/time frames; this helps to make it more of a leading Indicator which may predict momentum changes. Our Regular is over a medium length and multipliers that result in a smooth but generally also gradual movement that helps reliability; this helps it act as more of an ‘in the now’ Indication of momentum changes. Our Confirming uses lengths and multipliers that are of a higher value and longer span; this makes it more difficult to use for determining entry / exit locations as it's more of a lagging indicator, but it helps to add confirmation as to whether the momentum change has occurred and wasn't a false signal.
Tutorial:
YinYang Momentum may look like a lot is going on.. And well that’s cause there is.. But that doesn’t mean it's confusing or hard to read once you know what you’re looking for!
To make this tutorial a little easier to understand, let's turn off a few settings and dissect this indicator one thing at a time. YinYang Momentum features Price and Volume mountains. Currently in the photo above we have 2 Price Mountains and 1 Volume Mountain turned on (this is how it's set by default and how we recommend using it), however there are 3 Mountains available for both Price and Volume:
Predictive
Regular
Confirming
We are going to deactivate everything so it's the Regular Price Mountain + Ice enabled.
Now that it is just the Regular Price Mountain and Ice it is much easier to teach and understand. As you can see there are two different colors on the mountain. The dark blue is the Mountain and the light blue is the Ice.
The Ice moves before the mountain does and when the momentum happens it is larger than it (below or above). When the momentum starts to change however, the Ice curves inside of the mountain. As you can see here, where the BUY signal (red cross) is, the Ice curves into the mountain; also where the SELL signal (red circle) is, the Ice curves into the mountain. The Ice curving into the mountain is a very important leading indication that momentum is changing and the Signals (crosses and diamonds) help solidify this momentum change.
The Index levels for YinYang Momentum is a little different than most oscillators that range from 0-100. Instead YinYang Momentum’s neutral level is 0 and it ranges from -100 to 100. For these reasons, the Viable Range for Buying is -40 to -70 and the Optimal Range for Buying is -70 to -100. For Selling, the Viable Range is 40 to 70 and the Optimal Range is 70 to 100.
If you look at the example above, you can see whenever it has been in the optimal range and the signal occurred, it may potentially be an amazing time to buy or sell. However, when it is within the Viable Range it can be hit or miss. The reason for this is because we are only looking at the Regular Price Mountain and Ice. Once we turn on the Predictive Price and Regular Volume we will have a much clearer idea as to what is noise and what is a true purchase signal. Why don’t we turn on Predictive Price Mountains and Ice so you can see what we’re talking about:
So there are 2 big things that changed when we added the predictive price mountains + ice.
We can see that where the orange circle is, is just noise, it isn’t a viable buy signal.
We can see that where the red circle is, is actually a better spot to sell than the previous marked white circle slightly to the right of it.
We will explain why both above are true, but first let's explain how we were able to deduce this information.
There are 5 rules when deciphering if the signal is a true signal or just noise.
You want the predictive mountain to be decently spaced out from the regular mountain. Refer to the example above how that should look. Remember it's predictive so with parabolic movements it will get quite spaced out. If the price went up but slowly, it generally won’t be as spaced and isn’t as strong of a signal predictor.
You want the Ice to be of a decent size and to curve in on both the Predictive and Regular Mountains. Both arrows (red and white circle arrows) are pointing to Ice that does just that. The Predictive mountain is of decent size and spaced out and the Ice curves in sharply on the Predictive, before curving in sharply on the Regular and then we get both Predictive and Regular Support Cross on the Same Bar.
When you get the Signals (Predictive and Regular) the amount of bars between them matters a lot! On the same Bar is ideal, however 1-2, max 3 bars between them is acceptable. Any more than 3 bars spacing and it's too risky of a signal because that means momentum change was happening but then stopped before picking back up. This doesn’t mean it can’t be a good signal, it just means it is much more risky and we don’t recommend it.
You don’t want Signal Clustering. You can see an example of this from the picture above. Signal Clustering is where signals are back to back over and over. During this time the momentum is in a consolidation phase and easily swaps back and forth between signals. These signals are not reliable and should not be traded on. We only want to act on clear momentum based signals.
Last but certainly not least, actually, the most important! Ensure that the Mountain + Ice for both the Predictive and Regular is at the bare minimum touching (preferably inside) the Viable Range. The Optimal range is best, but most mountains don’t make it that far. Viable Range is where you will make most of your trades from. Sometimes a great signal happens with all 5 of these rules but it is only touching the Viable Range right at 40 or -40. This CAN be okay, but is also much more risky than if it was at 50 to 60 or -50 to -60.
Based on the 5 rules mentioned, take a second and look back at the photo where we initially added the Predictive Price mountains and Ice, can you decipher why the orange circle is just noise, and can you see why the red circle is a better sell location than the white circle slightly to the right of it?
Let’s bring that photo back up now and let’s discuss this:
Let's start with the orange circle:
This orange circle, without the predictive, was hard to tell if it was a good location to buy or not, but the second we turned it on we could clearly see it was just noise.
The spacing between the Predictive mountains and the Regular is almost non-existent.
There was signal clustering shortly before this signal.
Remember, there doesn’t have to be many rules broken for a signal to be either too risky or not valid at all. The safest trades are ones where it meets the requirements of all 5 rules (6 once we talk about volume, but 5 price rules).
Now, let's discuss the red circle:
This red circle, although it could have been chosen with just the regular, was much more noticeable with the predictive added on top.
It has a perfect spacing between the Predictive and the Regular all the way to the peak.
The Ice is large and both curve in very nicely towards the mountains.
The signals are within 2 bars apart from each other.
There is no signal clustering.
The Predictive is within the Viable Range and the Regular is just touching it.
For these reasons, the red circle actually would have been where you sold and not the white circle beside it.
This pretty much covers the Price Mountains, but wait! The most important Cherry on Top to your decision making process is coming next!
We have just enabled our Regular Volume Mountains and Ice (which are the black mountains + ice). As you can see, we have circled what we call the ‘Perfect Combo’. This Perfect combo is when you have all 5 Price rules met COMBINED with a high volume mountain. The Volume Mountain and Ice act as strength. They aren’t biased towards bulls or bears, they simply show strength to whatever signal is present with it.
For example, if all 5 rules are met with Price on a Blood Diamond (Bear) Signal and there is a High Volume Mountain then this is also a ‘Perfect Combo’. That Blood Diamond signal will potentially have great strength behind it. The Viable and Optimal Ranges don’t apply to volume mountains. Any volume mountain, even close to the Viable Range, is considered to be a very high mountain. High volume is when the mountain is above 0 and low volume is when it's below 0. Any signal with low volume has less of a chance of being correct, regardless of whether it abides by all 5 price rules.
You can see here that the 5 Price rules are achieved but the volume mountain is low. It is at -25. Since the 5 Price rules are right, there is still a decent amount of accuracy to this signal and the price did plummet after, but not nearly as much as it would have if the volume mountain was high with it.
We have turned our Confirming Price Mountain on here so you can get an idea of what it looks like and how it’s used. If you refer to the Support Crosses and Blood Diamonds circled in white, you’ll see that although they both received their signals on the Predictive and Regular, neither of them received it on the Confirming. This shows that these signals lost momentum shortly after. However if you look at both the red and green circles, you’ll see that they both received their confirming signals and that it helped give those signals momentum. The Confirming Price Mountain is meant to help confirm if the momentum change is still on track and the max 3 bars from the regular signal rule still applies to it. However its height within the viable and optimal range is important, just not as relevant
Before we move on to our Information Tables we want to take a second just to discuss our Volume Mountains and Ice. We haven’t had a chance yet to discuss the Predictive or Confirming Volume. When it comes to our Volume Mountains + Ice, we don’t recommend having more than 1 on at a time. The reason we have included the Predictive and Confirming is in case you find they suit your Trading Style best, not necessarily to be used the same way the Price Mountains and Ice are. The main reason for this is due to the fact that the Volume Mountains are much smaller and when overlaid on top of each other can make a confusing blur that is hard to decipher.
In this example above we have enabled both Predictive and Regular Volume just so you can understand what we are talking about. The two together can be rather confusing and actually interfere with your decision making process. For this reason, we highly recommend finding the Volume Mountain that suits your trading style best and solely sticking to that.
Our Predictive Volume Mountains and Ice may help sense volume changes before they’ve even happened. This can be very useful if your Trading Style revolves around heavy volume changes.
Our Confirming Volume Mountains and Ice are much slower and smaller, but they help show the movement of volume that has occurred already. This can be used to help see the movement of volume without fearing it may or may not happen.
Our Information Tables are there to show you valuable information on whether it is in a state of Support Cross or Blood Diamond on 6 different Time Frames at the same time. The % it shows you displays how much of a price change has occurred since that signal has happened. It is important to note, if for instance you see it is in a state of Support Cross but the % is negative, this generally means it is going to switch to Blood Diamond soon and vice versa. Therefore if you are in a trade, especially on a lower Time Frame and you are watching the 1 Day or a higher Time Frame and notice that the % is getting less and less, it may be a good time to get out.
We will conclude our Tutorial here. If you have any Questions, Concerns, Suggestions or Comments please don’t hesitate to contact us.
Settings:
1. Show Predictive to Confirmed Trendline:
The Predictive to Confirmed Trendline is very useful for seeing when the predictive (Support Cross or Blood Diamond) has hit the confirmed (It’s a strong confirmation that the trend may be shifting). This trendline also features a Moving Average which helps give you a solid marker for when the Regular / Predictive mountains cross under or over it that a momentum swing may occur. Somewhat like when the RSI crosses above/below its Moving Average it dictates momentum change, that is likewise how to interpret when it happens with the mountains and this trendline.
2. Show Price Ice and Mountains based on:
The Price Ice and Mountains are very important when it comes to deciphering signal strength. For example, When the mountains are very low (regular and predictive) and are between the 2 red line (undervalued) or even possibly below the bottom red line, and the Ice on the mountains starts to curve into the mountains and then the Predictive and Regular Support Cross occur; this is a very strong Bullish Signal. But wait, that's not all, the cherry on top is when the volume mountain (black) is ALSO high while this occurs; the Volume Mountain adds Strength to the signal. When the volume mountain is high too during this ‘Perfect Combo’ this may potentially lead to very bullish price movement occurring soon. Here is an overview of each mountain:
2.1. Predictive: Are the least reliable, but they move first and nothing will move without the predictive moving first, and getting you ready.
2.2. Regular: Are the most accurate, they don't signify strength on its own, but they sure show some momentum.
2.3. Confirming: Are slightly behind when it comes to displaying data, and therefore shouldn't be used for entry / exit, but rather to show if the trend movement has truly been confirmed or not.
When the Ice starts to curve into the Mountain, (either upward or below) it signifies possible momentum change. There are Crosses (Bull), and Diamonds (Bear) to show when they've crossed. Cross' and Diamonds balance each other out and therefore there can never be more than 1 in a row (of the same type). When the Ice and Mountain size is very large (between 40 and 70), and the predictive Ice starts to curve into its mountain, and then the predictive curves into the Regular, and the Regular Ice is curving into its Mountain, then it may have some strong weight behind that signal.\nIMPORTANT: refer to Volume tooltip below for how to increase the signal strength even more.
3. Show Volume Ice and Mountains based on:
The Volume Ice and Mountains are for giving strength to the Price's signals and Size. When there is the perfect combo (described above) AND the Volume Ice + Mountain is high, then there may be a lot of strength to that Price signals (whether it is Cross (Bull), or Diamond (Bear)).
IMPORTANT: High volume mountains, unlike Price, don't mean good or bad. Volume shows strength to the Price, and therefore if there are high Volume mountains during a Diamond (Bearish), then there may be a lot of strength to that signal and vice versa.
4. Show Information Tables:
Information tables are used to display 6 different Time Frames and whether or not each time frame is in a state of Blood Diamond (red) or Support Cross (green). They also show how much % in price has changed since the current signal happened. These are very useful for seeing how the price is fairing on different Time Frames without having to constantly change your timeframe. For instance, maybe you base your entry off the 1 day time frame but then you swing trade on the 15 minute. Well, after you’ve confirmed your entry position and are sitting on the 15 minute, you can stay on the 15 minute and see how it is fairing on the 1 day, 5 minute or whatever time frame you choose. This way you aren’t distracted from the trade at hand. All of these Time Frames can be adjusted in the Settings (GUI) to whatever resolution you wish.
5. Res1 / Res2/ Res3 / Res4 / Res5 / Res6:
These represent the different resolutions (Time Frames) being used in your information tables and can be modified to display whatever resolution works best for your trading style. By default they are:
Res1: Current Timeframe
Res2: 15 Minute
Res3: 1 Hour
Res4: 4 Hour
Res5: 1 Day
Res6: 1 Week
Backup Res (not changeable): 5 Minute (this is only used if your Current Timeframe in Res1 is a duplicate of one of the other resolutions)
HAPPY TRADING!

Supply Demand Profiles [LuxAlgo]The Supply Demand Profiles is a charting tool that measures the traded volume at all price levels on the market over a specified time period and highlights the relationship between the price of a given asset and the willingness of traders to either buy or sell it, in other words, highlights key concepts as significant supply & demand zones, the distribution of the traded volume, and market sentiment at specific price levels within a specified time period, allowing traders to reveal dominant and/or significant price levels and to analyze the trading activity of a particular user-selected range.
In other words, this tool highlights key concepts as significant supply & demand zones, the distribution of the traded volume, and market sentiment at specific price levels within a specified time period, allowing traders to reveal dominant and/or significant price levels and to analyze the trading activity of a particular user-selected range.
Besides having the tool as a combo tool, the uniqueness of this version of the tool compared to its early versions is its ability to benefit from different volume data sources and its ability to use a variety of different polarity methods, where polarity is a measure used to divide the total volume into either up volume (trades that moved the price up) or down volume (trades that moved the price down).
🔶 USAGE
Supply & demand zones are presented as horizontal zones across the selected range, hence adding the ability to visualize the price interaction with them
By default, the right side of the profile is the volume profile which highlights the distribution of the traded activity at different price levels, emphasizing the value area, the range of price levels in which the specified percentage of all volume was traded during the time period, and levels of significance, such as developing point of control line, value area high/low lines, and profile high/low labels
The left side of the profile is the sentiment profile which highlights the market sentiment at specific price levels
🔶 DETAILS
🔹 Volume data sources
The users have the option to select volume data sources as either 'volume' (regular volume) or 'volume delta', where volume represents all the recorded trades that occur at a given bar and volume delta is the difference between the buying and the selling volume, that is, the net demand at a given bar
🔹 Polarity methods
The users are able to choose the methods of how the tool to take into consideration the polarity of the bar (the direction of a bar, green (bullish) or red (bearish) bar) among a variety of different options, such as 'bar polarity', 'bar buying/selling pressure', 'intrabar (chart bars at a lower timeframe than the chart's) polarity', 'intrabar buying/selling pressure', and 'heikin ashi bar polarity'.
Finally, the interactive mode of the tool is activated, as such users can easily modify the intervals of their interest just by selecting the indicator and moving the points on the chart
🔶 SETTINGS
The script takes into account user-defined parameters and plots the profiles and zones
🔹 Calculation Settings
Volume Data Source and Polarity: This option is to set the desired volume data source and polarity method
Lower Timeframe Precision: This option is applicable in case any of the 'Intrabar (LTF)' options are selected, please check the tooltip for further details
Value Area Volume %: Specifies the percentage for the value area calculation
🔹 Presentation Settings
Supply & Demand Zones: Toggles the visibility of the supply & demand zones
Volume Profile: Toggles the visibility of the volume profile
Sentiment Profile: Toggles the visibility of the sentiment profile
🔹 Presentation, Others
Value Area High (VAH): Toggles the visibility of the VAH line and color customization option
Point of Control (POC): Toggles the visibility of the developing POC line and color customization option
Value Area Low (VAL): Toggles the visibility of the VAL line and color customization option
🔹 Supply & Demand, Others
Supply & Demand Threshold %: This option is used to set the threshold value to determine supply & demand zones
Supply/Demand Zones: Color customization option
🔹 Volume Profile, Others
Profile, Up/Down Volume: Color customization option
Value Area, Up/Down Volume: Color customization option
🔹 Sentiment Profile, Others
Sentiment, Bullish/Bearish: Color customization option
Value Area, Bullish/Bearish: Color customization option
🔹 Others
Number of Rows: Specify how many rows the profile will have
Placment: Specify where to display the profile
Profile Width %: Alters the width of the rows in the profile, relative to the profile range
Profile Price Levels: Toggles the visibility of the profile price levels
Profile Background, Color: Fills the background of the profile range
Value Area Background, Color: Fills the background of the value area range
Start Calculation/End Calculation: The tool is interactive, where the user may modify the range by selecting the indicator and moving the points on the chart or can set the start/end time using these options
🔶 RELATED SCRIPTS
Volume-Profile
Volume-Profile-Maps
Volume-Delta

Multi-Timeframe Trend Detector [Alifer]Here is an easy-to-use and customizable multi-timeframe visual trend indicator.
The indicator combines Exponential Moving Averages (EMA), Moving Average Convergence Divergence (MACD), and Relative Strength Index (RSI) to determine the trend direction on various timeframes: 15 minutes (15M), 30 minutes (30M), 1 hour (1H), 4 hours (4H), 1 day (1D), and 1 week (1W).
EMA Trend : The script calculates two EMAs for each timeframe: a fast EMA and a slow EMA. If the fast EMA is greater than the slow EMA, the trend is considered Bullish; if the fast EMA is less than the slow EMA, the trend is considered Bearish.
MACD Trend : The script calculates the MACD line and the signal line for each timeframe. If the MACD line is above the signal line, the trend is considered Bullish; if the MACD line is below the signal line, the trend is considered Bearish.
RSI Trend : The script calculates the RSI for each timeframe. If the RSI value is above a specified Bullish level, the trend is considered Bullish; if the RSI value is below a specified Bearish level, the trend is considered Bearish. If the RSI value is between the Bullish and Bearish levels, the trend is Neutral, and no arrow is displayed.
Dashboard Display :
The indicator prints arrows on the dashboard to represent Bullish (▲ Green) or Bearish (▼ Red) trends for each timeframe.
You can easily adapt the Dashboard colors (Inputs > Theme) for visibility depending on whether you're using a Light or Dark theme for TradingView.
Usage :
You can adjust the indicator's settings such as theme (Dark or Light), EMA periods, MACD parameters, RSI period, and Bullish/Bearish levels to adapt it to your specific trading strategies and preferences.
Disclaimer :
This indicator is designed to quickly help you identify the trend direction on multiple timeframes and potentially make more informed trading decisions.
You should consider it as an extra tool to complement your strategy, but you should not solely rely on it for making trading decisions.
Always perform your own analysis and risk management before executing trades.
The indicator will only show a Dashboard. The EMAs, RSI and MACD you see on the chart image have been added just to demonstrate how the script works.
DETAILED SCRIPT EXPLANATION
INPUTS:
theme : Allows selecting the color theme (options: "Dark" or "Light").
emaFastPeriod : The period for the fast EMA.
emaSlowPeriod : The period for the slow EMA.
macdFastLength : The fast length for MACD calculation.
macdSlowLength : The slow length for MACD calculation.
macdSignalLength : The signal length for MACD calculation.
rsiPeriod : The period for RSI calculation.
rsiBullishLevel : The level used to determine Bullish RSI condition, when RSI is above this value. It should always be higher than rsiBearishLevel.
rsiBearishLevel : The level used to determine Bearish RSI condition, when RSI is below this value. It should always be lower than rsiBullishLevel.
CALCULATIONS:
The script calculates EMAs on multiple timeframes (15-minute, 30-minute, 1-hour, 4-hour, daily, and weekly) using the request.security() function.
Similarly, the script calculates MACD values ( macdLine , signalLine ) on the same multiple timeframes using the request.security() function along with the ta.macd() function.
RSI values are also calculated for each timeframe using the request.security() function along with the ta.rsi() function.
The script then determines the EMA trends for each timeframe by comparing the fast and slow EMAs using simple boolean expressions.
Similarly, it determines the MACD trends for each timeframe by comparing the MACD line with the signal line.
Lastly, it determines the RSI trends for each timeframe by comparing the RSI values with the Bullish and Bearish RSI levels.
PLOTTING AND DASHBOARD:
Color codes are defined based on the EMA, MACD, and RSI trends for each timeframe. Green for Bullish, Red for Bearish.
A dashboard is created using the table.new() function, displaying the trend information for each timeframe with arrows representing Bullish or Bearish conditions.
The dashboard will appear in the top-right corner of the chart, showing the Bullish and Bearish trends for each timeframe (15M, 30M, 1H, 4H, 1D, and 1W) based on EMA, MACD, and RSI analysis. Green arrows represent Bullish trends, red arrows represent Bearish trends, and no arrows indicate Neutral conditions.
INFO ON USED INDICATORS:
1 — EXPONENTIAL MOVING AVERAGE (EMA)
The Exponential Moving Average (EMA) is a type of moving average (MA) that places a greater weight and significance on the most recent data points.
The EMA is calculated by taking the average of the true range over a specified period. The true range is the greatest of the following:
The difference between the current high and the current low.
The difference between the previous close and the current high.
The difference between the previous close and the current low.
The EMA can be used by traders to produce buy and sell signals based on crossovers and divergences from the historical average. Traders often use several different EMA lengths, such as 10-day, 50-day, and 200-day moving averages.
The formula for calculating EMA is as follows:
Compute the Simple Moving Average (SMA).
Calculate the multiplier for weighting the EMA.
Calculate the current EMA using the following formula:
EMA = Closing price x multiplier + EMA (previous day) x (1-multiplier)
2 — MOVING AVERAGE CONVERGENCE DIVERGENCE (MACD)
The Moving Average Convergence Divergence (MACD) is a popular trend-following momentum indicator used in technical analysis. It helps traders identify changes in the strength, direction, momentum, and duration of a trend in a financial instrument's price.
The MACD is calculated by subtracting a longer-term Exponential Moving Average (EMA) from a shorter-term EMA. The most commonly used time periods for the MACD are 26 periods for the longer EMA and 12 periods for the shorter EMA. The difference between the two EMAs creates the main MACD line.
Additionally, a Signal Line (usually a 9-period EMA) is computed, representing a smoothed version of the MACD line. Traders watch for crossovers between the MACD line and the Signal Line, which can generate buy and sell signals. When the MACD line crosses above the Signal Line, it generates a bullish signal, indicating a potential uptrend. Conversely, when the MACD line crosses below the Signal Line, it generates a bearish signal, indicating a potential downtrend.
In addition to the MACD line and Signal Line crossovers, traders often look for divergences between the MACD and the price chart. Divergence occurs when the MACD is moving in the opposite direction of the price, which can suggest a potential trend reversal.
3 — RELATIVE STRENGHT INDEX (RSI):
The Relative Strength Index (RSI) is another popular momentum oscillator used by traders to assess the overbought or oversold conditions of a financial instrument. The RSI ranges from 0 to 100 and measures the speed and change of price movements.
The RSI is calculated based on the average gain and average loss over a specified period, commonly 14 periods. The formula involves several steps:
Calculate the average gain over the specified period.
Calculate the average loss over the specified period.
Calculate the relative strength (RS) by dividing the average gain by the average loss.
Calculate the RSI using the following formula: RSI = 100 - (100 / (1 + RS))
The RSI oscillates between 0 and 100, where readings above 70 are considered overbought, suggesting that the price may have risen too far and could be due for a correction. Readings below 30 are considered oversold, suggesting that the price may have dropped too much and could be due for a rebound.
Traders often use the RSI to identify potential trend reversals. For example, when the RSI crosses above 30 from below, it may indicate the start of an uptrend, and when it crosses below 70 from above, it may indicate the start of a downtrend. Additionally, traders may look for bullish or bearish divergences between the RSI and the price chart, similar to the MACD analysis, to spot potential trend changes.

Sublime Trading | Trend Strength FilterWhat kind of traders/investors are we?
We are trend followers. Our scripts are designed to be used on the higher timeframes (weekly/daily) to catch the large moves/trends in the market.
Most have heard of long-term trend following. Few know how to execute the strategy.
Our scripts are designed specifically to identify and invest in long-term market trends.
What does this script do?
Identifying trends is at the heart of sound investing.
This script is colour coded to help identify long-term trends and environments where you will want to consider taking positions.
It is also designed to identify sideways/consolidating markets, environments where you will want to consider standing aside.
How is the trailing stoploss produced?
The script uses two sets of Bollinger Bands, one with setting Standard Deviation 1 and the other with Standard Deviation 2.
These settings help to create 3 zones - Buy, Sell and Stand Aside.
The bars will change colour according to which zone they are in.
The Buy zone is colour-coded green, and when a bull market or the start of a bull trend is in play. The green switches from light green to dark green as the asset’s price moves above the Buy zone.
This switch in colour serves as a warning that a reversal/pullback may occur next from bullish to bearish.
The Sell zone is colour-coded red and when a bear market or the start of a bear trend is in play. The red switches from light red to dark red as the asset’s price moves below the Sell zone.
This switch in colour serves as a warning that a reversal/pullback may occur next from bearish to bullish.
The Stand Aside is confirmed when the colour-code changes to grey. This may not necessarily mean a trend reversal but simply a time to apply patience before a trend continuation.
A sustained mixture of red, green and grey bars confirms a consolidation or sideways market and when investors/traders will want to stand aside and consider another asset.
What is the best timeframe to use the script?
Long-term trends are identified on the daily and weekly timeframes where traders and investors take fewer positions but hold for longer time periods.
We recommend using the script in unison on the weekly and daily timeframes.
When both timeframes fall into the Buy zone and colour-coded green, it signifies a strong bull market.
When both timeframes fall into the Sell zone and colour-coded red, it signifies a strong bear market.
When there is a mixture of green, red and grey bars across the two timeframes, it signifies a sideways market and when investors stand aside and protect their capital.
The weekly timeframe will also help mask the noise on the daily timeframe, allowing you to hold positions longer.
The Trailing Strength Filter script is for investors who want to identify and invest in long-term trends whilst simultaneously eliminating intraday swings.
What makes this script unique?
Identifying the start of long-term trends and then riding out established trends are among the main struggles budding investors face. This script has been coded specifically for the daily and weekly timeframe to:
Seamlessly identify the start, middle and end of trends
Align with the market and remove social media noise calling market tops and bottoms
Allow for discretion when entering but particularly exiting of positions if a market trend has not ended
This trend filter script ensures alignment with long-term market trends.

MACD-AS MTF [JoseMetal]============
ENGLISH
============
- Description:
This script is a modification of the Moving Average Convergence Divergence (MACD) of Thomas Aspray, and called as MACD-AS and you may get earlier signals than MACD.
On this (my version) you have several extra elements and customization.
Foremost (of course) you have the MACD-AS, which is the HISTOGRAM, also, it has a SIGNAL line (which smooths the MACD-AS), and finally, a higher timeframe oscillator based on one of the previous values (custom).
- Visuals, features, customization:
You can show/hide any of the components with a checkbox (MACD-AS, Signal and HTF Oscillator).
The timeframe for the higher timeframe oscillator is customizable, but by default is automatic and multiplies the chart timeframe by 3: 5m > 15m, 15m > 45m etc.
So we have the MACD-AS as a histogram, with 2 optional color schemes and custom transparency, it works similar to the original MACD, oscillating around the 0 level. Green colors (bull) if above 0, red (bear) below 0.
Smoothed MACD-AS makes the Signal line, going up (bull) shows green color, down (bear) red, changes from one to another also prints a colored dot. There's another feature which darkens the color when the momentum is losing strength, a strength filter input is available for that purpose but the default 0.5 works well.
The higher timeframe oscillator (it's called "oscillator" because you can pick if you want to show the MACD-AS or Signal line of the higher timeframe), is always shown as a line, colors work similar to the Signal line, but BLUE for bull and PINK for bear.
Finally, the background color just changes from green (bull) to red (bear) and vice versa if the Signal line is above or below the 0 line to show bull/bear trend too, this is slower than other indicator signals as well.
- Usage and recommendations:
You can use this script as default MACD, the difference is that you'll use the DOTs of the Signal line (when changing green to red and vice versa) as crossovers on the classic MACD.
You can also use the higher timeframe oscillator as a trend filter to not to trade against it, ex: if the HTF is bull, don't try to SHORT.
My favorite usage is to find DIVERGENCES with the MACD-AS (histogram) with the HTF MACD-AS histogram as well, having 2 confirmations, ex: 5m divergence + 15m divergence.
As always, suggestions are welcome.
Enjoy!
============
ESPAÑOL
============
- Descripción:
Este script es una modificación del Moving Average Convergence Divergence (MACD) de Thomas Aspray, y llamado como MACD-AS, se pueden obtener señales más tempranas que con el MACD.
En ésta (mi versión) tiene varios elementos adicionales y personalización.
En primer lugar (por supuesto) tienes el MACD-AS, que es el HISTOGRAMA, también, tiene una línea de SEÑAL (que suaviza el MACD-AS), y por último, un oscilador de marco de tiempo superior basado en uno de los valores anteriores (personalizado).
- Visuales, características, personalización:
Puedes mostrar/ocultar cualquiera de los componentes con un checkbox (MACD-AS, Señal y Oscilador HTF).
La temporalidad para el oscilador HTF es personalizable, pero por defecto es automático y multiplica la temporalidad del gráfico por 3: 5m > 15m, 15m > 45m etc.
El MACD-AS (histograma), con 2 esquemas de color opcionales y transparencia personalizada, funciona de forma similar al MACD original, oscilando alrededor del nivel 0. Colores verdes (alcista) si está por encima de 0, rojo (bajista) por debajo de 0.
El suavizado del MACD-AS hace la línea de señal, subiendo (alcista) muestra color verde, bajando (bajista) rojo, cambios de uno a otro también imprime un punto de color. Hay otra característica que oscurece el color cuando el impulso está perdiendo fuerza, una entrada de filtro de fuerza está disponible para ese propósito, pero el valor predeterminado 0,5 funciona bien.
El oscilador de temporalidad superior (se llama "oscilador" porque puedes elegir si quieres mostrar el MACD-AS o la línea de señal), siempre se muestra como una línea, los colores funcionan de forma similar a la línea de señal, pero AZUL para alcista y ROSA para bajista.
Por último, el color de fondo sólo cambia de verde (alcista) a rojo (bajista) y viceversa si la línea de señal está por encima o por debajo de la línea 0 para mostrar la tendencia alcista / bajista también, eso si, resulta más lento que otros avisos del indicador.
- Uso y recomendaciones:
Puedes usar este script como el MACD clásico, la diferencia es que usarán los PUNTOS de la línea de Señal (cuando cambie de verde a rojo y viceversa) como cruces en el MACD clásico.
También puedes usar el oscilador de mayor temporalidad como filtro de tendencia para no operar en contra de ella, ej: si el HTF es alcista, no intentes SHORTs.
Mi uso favorito es encontrar DIVERGENCIAS con el MACD-AS (histograma) y el HTF MACD-AS, teniendo 2 confirmaciones, ej: 5m divergencia + 15m divergencia.
Como siempre, las sugerencias son bienvenidas.
¡Que lo disfrutéis!

Directional Volume EStimate from Price Action (RedK D_VESPA)The "Directional Volume EStimate from Price Action (RedK D_VESPA)" is another weapon for the VPA (Volume Price Analysis) enthusiasts and traders who like to include volume-based insights & signals to their trading. The basic concept is to estimate the sell and buy split of the traded volume by extrapolating the price action represented by the shape of the associated price bar. We then create and plot an average of these "estimated buy & sell volumes" - the estimated average Net Volume is the balance between these 2 averages.
D_VESPA uses clear visualizations to represent the outcomes in a less distracting and more actionable way.
How does D_VESPA work?
-------------------------------------
The key assumption is that when price moves up, this is caused by "buy" volume (or increasing demand), and when the price moves down, this is due to "selling" volume (or increasing supply). Important to note that we are making our Buy/sell volume estimates here based on the shape of the price bar, and not looking into lower time frame volume data - This is a different approach and is still aligned to the key concepts of VPA.
Originally this work started as an improvement to my Supply/Demand Volume Viewer (V.Viewer) , I ended up re-writing the whole thing after some more research and work on VPA, to improve the estimation, visualization and usability / tradability.
Think of D_VESPA as the "Pro" version of V.Viewer -- and please go back and review the details of V.Viewer as the root concepts are the same so I won't repeat them here (as it comes to exploring Balance Zone and finding Price Convergence/Divergence)
Main Features of D_VESPA
--------------------------------------
- Update Supply/Demand calculation to include 2-bar gaps (improved algo)
- Add multiple options for the moving average (MA type) for the calculation - my preference is to use WMA
- Add option to show Net Volume as 3-color bars
- Visual simplification and improvements to be less distracting & more actionable
- added options to display/hide main visuals while maintaining the status line consistency (Avg Supply, Avg Demand, Avg Net)
- add alerts for NetVol moving into Buy (crosses 0 up) or Sell (crosses 0 down) modes - or swing from one mode to the other
(there are actually 2 sets of alerts, one set for the main NetVol plot, and the other for the secondary TF NetVol - give user more options on how to utilize D_VESPA)
Quick techie piece, how does the estimated buy/sell volume algo work ?
------------------------------------------------------------------------------------------
* per our assumption, buy volume is associated with price up-moves, sell volume is associated with price down-moves
* so each of the bulls and bears will get the equivalent of the top & bottom wicks,
* for up bars, bulls get the value of the "body", else the bears get the "body"
* open gaps are allocated to bulls or bears depending on the gap direction
The below sketch explains how D_VESPA estimates the Buy/Sell Volume split based on the bar shape (including gap) - the example shows a bullish bar with an opening gap up - but the concept is the same for a down-bar or a down-gap.
I kept both the "Volume Weighted" and "2-bar Gap Impact" as options in the indicator settings - these 2 options should be always kept selected. They are there for those who would like to experiment with the difference these changes have on the buy/sell estimation. The indicator will handle cases where there is no volume data for the selected symbol, and in that case, it will simply reflect Average Estimated Bull/Bear ratio of the price bar
The Secondary TF Est Average Net Volume:
---------------------------------------------------------
I added the ability to plot the Estimate Average Net Volume for a secondary timeframe - options 1W, 1D, 1H, or Same as Chart.
- this feature provides traders the confidence to trade the lower timeframes in the same direction as the prevailing "market mode"
- this also adds more MTF support beyond the existing TradingView's built-in MTF support capability - experiment with various settings between exposing the indicator's secondary TF plot, and changing the TF option in the indicator settings.
Note on the secondary TF NetVol plot:
- the secondary TF needs to be set to same as or higher TF than the chart's TF - if not, a warning sign would show and the plot will not be enabled. for example, a day trader may set the secondary TF to 1Hr or 1Day, while looking at 5min or 15min chart. A swing/trend trader who frequently uses the daily chart may set the secondary TF to weekly, and so on..
- the secondary TF NetVol plot is hidden by default and needs to be exposed thru the indicator settings.
the below chart shows D_VESPA on a the same (daily) chart, but with secondary TF plot for the weekly TF enabled
Final Thoughts
-------------------
* RedK D_VESPA is a volume indicator, that estimates buy/sell and net volume averages based on the price action reflected by the shape of the price bars - this can provide more insight on volume compared to the classic volume/VolAverage indicator and assist traders in exploring the market mode (buyers/sellers - bullish/bearish) and align trades to it.
* Because D_VESPA is a volume indicator, it can't be used alone to generate a trading signal - and needs to be combined with other indicators that analysis price value (range), momentum and trend. I recommend to at least combine D_VESPA with a variant of MACD and RSI to get a full view of the price action relative to the prevailing market and the broader trend.
* I found it very useful to take note and "read" how the Est Buy vs Est Sell lines move .. they sort of "tell a story" - experiment with this on your various chart and note the levels of estimate avg demand vs estimate avg supply that this indicator exposes for some very valuable insight about how the chart action is progressing. Please feel free to share feedback below.

Crypto Trend IndicatorThe Crypto Trend Indicator is a trend-following indicator specifically designed to identify bullish and bearish trends in the price of Bitcoin, and other cryptocurrencies. This indicator doesn't provide explicit instructions on when to buy or sell, but rather offers an understanding of whether the trend is bullish or bearish. It's important to note that this indicator is only useful for trend trading.
The band is a visual representation of the 30-day and 60-day Exponential Moving Average (EMA). When the 30-day EMA is above the 60-day EMA, the trend is bullish and the band is green. When the 30-day EMA is below the 60-day EMA, the trend is bearish and the band is red. When the 30-day EMA starts to converge with the 60-day EMA, the trend is neutral and the band is grey.
The line is a visual representation of the 20-week Simple Moving Average (SMA) in the daily timeframe. "Bull" and "Bear" signals are generated when the 20-day EMA is either above or below the 20-week SMA, in conjunction with a bullish or bearish trend. When the band is green and the 20-day EMA is above the 20-week SMA, a “Bull” signal emerges. When the band is red and the 20-day EMA is below the 20-week SMA, a “Bear” signal emerges. The 20-week SMA can potentially also function as a leading indicator, as substantial price deviations from the SMA typically indicate an overextended market.
While this indicator has traditionally identified bullish and bearish trends in various cryptocurrency assets, past performance does not guarantee future results. Therefore, it is advisable to supplement this indicator with other technical tools. For instance, range-bound indicators can greatly improve the decision-making process when planning for entries and exits points.

GKD-C Adaptive Digital Kahler Variety RSI w/ DZ [Loxx]Giga Kaleidoscope GKD-C Adaptive Digital Kahler Variety RSI w/ DZ is a Confirmation module included in Loxx's "Giga Kaleidoscope Modularized Trading System".
█ Giga Kaleidoscope Modularized Trading System
What is Loxx's "Giga Kaleidoscope Modularized Trading System"?
The Giga Kaleidoscope Modularized Trading System is a trading system built on the philosophy of the NNFX (No Nonsense Forex) algorithmic trading.
What is the NNFX algorithmic trading strategy?
The NNFX (No-Nonsense Forex) trading system is a comprehensive approach to Forex trading that is designed to simplify the process and remove the confusion and complexity that often surrounds trading. The system was developed by a Forex trader who goes by the pseudonym "VP" and has gained a significant following in the Forex community.
The NNFX trading system is based on a set of rules and guidelines that help traders make objective and informed decisions. These rules cover all aspects of trading, including market analysis, trade entry, stop loss placement, and trade management.
Here are the main components of the NNFX trading system:
1. Trading Philosophy: The NNFX trading system is based on the idea that successful trading requires a comprehensive understanding of the market, objective analysis, and strict risk management. The system aims to remove subjective elements from trading and focuses on objective rules and guidelines.
2. Technical Analysis: The NNFX trading system relies heavily on technical analysis and uses a range of indicators to identify high-probability trading opportunities. The system uses a combination of trend-following and mean-reverting strategies to identify trades.
3. Market Structure: The NNFX trading system emphasizes the importance of understanding the market structure, including price action, support and resistance levels, and market cycles. The system uses a range of tools to identify the market structure, including trend lines, channels, and moving averages.
4. Trade Entry: The NNFX trading system has strict rules for trade entry. The system uses a combination of technical indicators to identify high-probability trades, and traders must meet specific criteria to enter a trade.
5. Stop Loss Placement: The NNFX trading system places a significant emphasis on risk management and requires traders to place a stop loss order on every trade. The system uses a combination of technical analysis and market structure to determine the appropriate stop loss level.
6. Trade Management: The NNFX trading system has specific rules for managing open trades. The system aims to minimize risk and maximize profit by using a combination of trailing stops, take profit levels, and position sizing.
Overall, the NNFX trading system is designed to be a straightforward and easy-to-follow approach to Forex trading that can be applied by traders of all skill levels.
Core components of an NNFX algorithmic trading strategy
The NNFX algorithm is built on the principles of trend, momentum, and volatility. There are six core components in the NNFX trading algorithm:
1. Volatility - price volatility; e.g., Average True Range, True Range Double, Close-to-Close, etc.
2. Baseline - a moving average to identify price trend
3. Confirmation 1 - a technical indicator used to identify trends
4. Confirmation 2 - a technical indicator used to identify trends
5. Continuation - a technical indicator used to identify trends
6. Volatility/Volume - a technical indicator used to identify volatility/volume breakouts/breakdown
7. Exit - a technical indicator used to determine when a trend is exhausted
What is Volatility in the NNFX trading system?
In the NNFX (No Nonsense Forex) trading system, ATR (Average True Range) is typically used to measure the volatility of an asset. It is used as a part of the system to help determine the appropriate stop loss and take profit levels for a trade. ATR is calculated by taking the average of the true range values over a specified period.
True range is calculated as the maximum of the following values:
-Current high minus the current low
-Absolute value of the current high minus the previous close
-Absolute value of the current low minus the previous close
ATR is a dynamic indicator that changes with changes in volatility. As volatility increases, the value of ATR increases, and as volatility decreases, the value of ATR decreases. By using ATR in NNFX system, traders can adjust their stop loss and take profit levels according to the volatility of the asset being traded. This helps to ensure that the trade is given enough room to move, while also minimizing potential losses.
Other types of volatility include True Range Double (TRD), Close-to-Close, and Garman-Klass
What is a Baseline indicator?
The baseline is essentially a moving average, and is used to determine the overall direction of the market.
The baseline in the NNFX system is used to filter out trades that are not in line with the long-term trend of the market. The baseline is plotted on the chart along with other indicators, such as the Moving Average (MA), the Relative Strength Index (RSI), and the Average True Range (ATR).
Trades are only taken when the price is in the same direction as the baseline. For example, if the baseline is sloping upwards, only long trades are taken, and if the baseline is sloping downwards, only short trades are taken. This approach helps to ensure that trades are in line with the overall trend of the market, and reduces the risk of entering trades that are likely to fail.
By using a baseline in the NNFX system, traders can have a clear reference point for determining the overall trend of the market, and can make more informed trading decisions. The baseline helps to filter out noise and false signals, and ensures that trades are taken in the direction of the long-term trend.
What is a Confirmation indicator?
Confirmation indicators are technical indicators that are used to confirm the signals generated by primary indicators. Primary indicators are the core indicators used in the NNFX system, such as the Average True Range (ATR), the Moving Average (MA), and the Relative Strength Index (RSI).
The purpose of the confirmation indicators is to reduce false signals and improve the accuracy of the trading system. They are designed to confirm the signals generated by the primary indicators by providing additional information about the strength and direction of the trend.
Some examples of confirmation indicators that may be used in the NNFX system include the Bollinger Bands, the MACD (Moving Average Convergence Divergence), and the MACD Oscillator. These indicators can provide information about the volatility, momentum, and trend strength of the market, and can be used to confirm the signals generated by the primary indicators.
In the NNFX system, confirmation indicators are used in combination with primary indicators and other filters to create a trading system that is robust and reliable. By using multiple indicators to confirm trading signals, the system aims to reduce the risk of false signals and improve the overall profitability of the trades.
What is a Continuation indicator?
In the NNFX (No Nonsense Forex) trading system, a continuation indicator is a technical indicator that is used to confirm a current trend and predict that the trend is likely to continue in the same direction. A continuation indicator is typically used in conjunction with other indicators in the system, such as a baseline indicator, to provide a comprehensive trading strategy.
What is a Volatility/Volume indicator?
Volume indicators, such as the On Balance Volume (OBV), the Chaikin Money Flow (CMF), or the Volume Price Trend (VPT), are used to measure the amount of buying and selling activity in a market. They are based on the trading volume of the market, and can provide information about the strength of the trend. In the NNFX system, volume indicators are used to confirm trading signals generated by the Moving Average and the Relative Strength Index. Volatility indicators include Average Direction Index, Waddah Attar, and Volatility Ratio. In the NNFX trading system, volatility is a proxy for volume and vice versa.
By using volume indicators as confirmation tools, the NNFX trading system aims to reduce the risk of false signals and improve the overall profitability of trades. These indicators can provide additional information about the market that is not captured by the primary indicators, and can help traders to make more informed trading decisions. In addition, volume indicators can be used to identify potential changes in market trends and to confirm the strength of price movements.
What is an Exit indicator?
The exit indicator is used in conjunction with other indicators in the system, such as the Moving Average (MA), the Relative Strength Index (RSI), and the Average True Range (ATR), to provide a comprehensive trading strategy.
The exit indicator in the NNFX system can be any technical indicator that is deemed effective at identifying optimal exit points. Examples of exit indicators that are commonly used include the Parabolic SAR, the Average Directional Index (ADX), and the Chandelier Exit.
The purpose of the exit indicator is to identify when a trend is likely to reverse or when the market conditions have changed, signaling the need to exit a trade. By using an exit indicator, traders can manage their risk and prevent significant losses.
In the NNFX system, the exit indicator is used in conjunction with a stop loss and a take profit order to maximize profits and minimize losses. The stop loss order is used to limit the amount of loss that can be incurred if the trade goes against the trader, while the take profit order is used to lock in profits when the trade is moving in the trader's favor.
Overall, the use of an exit indicator in the NNFX trading system is an important component of a comprehensive trading strategy. It allows traders to manage their risk effectively and improve the profitability of their trades by exiting at the right time.
How does Loxx's GKD (Giga Kaleidoscope Modularized Trading System) implement the NNFX algorithm outlined above?
Loxx's GKD v1.0 system has five types of modules (indicators/strategies). These modules are:
1. GKD-BT - Backtesting module (Volatility, Number 1 in the NNFX algorithm)
2. GKD-B - Baseline module (Baseline and Volatility/Volume, Numbers 1 and 2 in the NNFX algorithm)
3. GKD-C - Confirmation 1/2 and Continuation module (Confirmation 1/2 and Continuation, Numbers 3, 4, and 5 in the NNFX algorithm)
4. GKD-V - Volatility/Volume module (Confirmation 1/2, Number 6 in the NNFX algorithm)
5. GKD-E - Exit module (Exit, Number 7 in the NNFX algorithm)
(additional module types will added in future releases)
Each module interacts with every module by passing data between modules. Data is passed between each module as described below:
GKD-B => GKD-V => GKD-C(1) => GKD-C(2) => GKD-C(Continuation) => GKD-E => GKD-BT
That is, the Baseline indicator passes its data to Volatility/Volume. The Volatility/Volume indicator passes its values to the Confirmation 1 indicator. The Confirmation 1 indicator passes its values to the Confirmation 2 indicator. The Confirmation 2 indicator passes its values to the Continuation indicator. The Continuation indicator passes its values to the Exit indicator, and finally, the Exit indicator passes its values to the Backtest strategy.
This chaining of indicators requires that each module conform to Loxx's GKD protocol, therefore allowing for the testing of every possible combination of technical indicators that make up the six components of the NNFX algorithm.
What does the application of the GKD trading system look like?
Example trading system:
Backtest: Strategy with 1-3 take profits, trailing stop loss, multiple types of PnL volatility, and 2 backtesting styles
Baseline: Hull Moving Average
Volatility/Volume: Hurst Exponent
Confirmation 1: Adaptive Digital Kahler Variety RSI w/ DZ as shown on the chart above
Confirmation 2: Williams Percent Range
Continuation: Fisher Transform
Exit: Rex Oscillator
Each GKD indicator is denoted with a module identifier of either: GKD-BT, GKD-B, GKD-C, GKD-V, or GKD-E. This allows traders to understand to which module each indicator belongs and where each indicator fits into the GKD protocol chain.
Giga Kaleidoscope Modularized Trading System Signals (based on the NNFX algorithm)
Standard Entry
1. GKD-C Confirmation 1 Signal
2. GKD-B Baseline agrees
3. Price is within a range of 0.2x Volatility and 1.0x Volatility of the Goldie Locks Mean
4. GKD-C Confirmation 2 agrees
5. GKD-V Volatility/Volume agrees
Baseline Entry
1. GKD-B Baseline signal
2. GKD-C Confirmation 1 agrees
3. Price is within a range of 0.2x Volatility and 1.0x Volatility of the Goldie Locks Mean
4. GKD-C Confirmation 2 agrees
5. GKD-V Volatility/Volume agrees
6. GKD-C Confirmation 1 signal was less than 7 candles prior
Continuation Entry
1. Standard Entry, Baseline Entry, or Pullback; entry triggered previously
2. GKD-B Baseline hasn't crossed since entry signal trigger
3. GKD-C Confirmation Continuation Indicator signals
4. GKD-C Confirmation 1 agrees
5. GKD-B Baseline agrees
6. GKD-C Confirmation 2 agrees
1-Candle Rule Standard Entry
1. GKD-C Confirmation 1 signal
2. GKD-B Baseline agrees
3. Price is within a range of 0.2x Volatility and 1.0x Volatility of the Goldie Locks Mean
Next Candle:
1. Price retraced (Long: close < close or Short: close > close )
2. GKD-B Baseline agrees
3. GKD-C Confirmation 1 agrees
4. GKD-C Confirmation 2 agrees
5. GKD-V Volatility/Volume agrees
1-Candle Rule Baseline Entry
1. GKD-B Baseline signal
2. GKD-C Confirmation 1 agrees
3. Price is within a range of 0.2x Volatility and 1.0x Volatility of the Goldie Locks Mean
4. GKD-C Confirmation 1 signal was less than 7 candles prior
Next Candle:
1. Price retraced (Long: close < close or Short: close > close )
2. GKD-B Baseline agrees
3. GKD-C Confirmation 1 agrees
4. GKD-C Confirmation 2 agrees
5. GKD-V Volatility/Volume Agrees
PullBack Entry
1. GKD-B Baseline signal
2. GKD-C Confirmation 1 agrees
3. Price is beyond 1.0x Volatility of Baseline
Next Candle:
1. Price is within a range of 0.2x Volatility and 1.0x Volatility of the Goldie Locks Mean
3. GKD-C Confirmation 1 agrees
4. GKD-C Confirmation 2 agrees
5. GKD-V Volatility/Volume Agrees
█ GKD-C Adaptive Digital Kahler Variety RSI w/ DZ
What is Digital Kahler?
From Philipp Kahler's article for www.traders-mag.com, August 2008. "A Classic Indicator in a New Suit: Digital Stochastic"
Digital Indicators
Whenever you study the development of trading systems in particular, you will be struck in an extremely unpleasant way by the seemingly unmotivated indentations and changes in direction of each indicator. An experienced trader can recognise many false signals of the indicator on the basis of his solid background; a stupid trading system usually falls into any trap offered by the unclear indicator course. This is what motivated me to improve even further this and other indicators with the help of a relatively simple procedure. The goal of this development is to be able to use this indicator in a trading system with as few additional conditions as possible. Discretionary traders will likewise be happy about this clear course, which is not nerve-racking and makes concentrating on the essential elements of trading possible.
How Is It Done?
The digital stochastic is a child of the original indicator. We owe a debt of gratitude to George Lane for his idea to design an indicator which describes the position of the current price within the high-low range of the historical price movement. My contribution to this indicator is the changed pattern which improves the quality of the signal without generating too long delays in giving signals. The trick used to generate this “digital” behavior of the indicator. It can be used with most oscillators like RSI or CCI.
First of all, the original is looked at. The indicator always moves between 0 and 100. The precise position of the indicator or its course relative to the trigger line are of no interest to me, I would just like to know whether the indicator is quoted below or above the value 50. This is tantamount to the question of whether the market is just trading above or below the middle of the high-low range of the past few days. If the market trades in the upper half of its high-low range, then the digital stochastic is given the value 1; if the original stochastic is below 50, then the value –1 is given. This leads to a sequence of 1/-1 values – the digital core of the new indicator. These values are subsequently smoothed by means of a short exponential moving average . This way minor false signals are eliminated and the indicator is given its typical form.
This indicator contains 7 different types of RSI:
RSX
Regular
Slow
Rapid
Harris
Cuttler
Ehlers Smoothed
What is RSI?
RSI stands for Relative Strength Index . It is a technical indicator used to measure the strength or weakness of a financial instrument's price action.
The RSI is calculated based on the price movement of an asset over a specified period of time, typically 14 days, and is expressed on a scale of 0 to 100. The RSI is considered overbought when it is above 70 and oversold when it is below 30.
Traders and investors use the RSI to identify potential buy and sell signals. When the RSI indicates that an asset is oversold, it may be considered a buying opportunity, while an overbought RSI may signal that it is time to sell or take profits.
It's important to note that the RSI should not be used in isolation and should be used in conjunction with other technical and fundamental analysis tools to make informed trading decisions.
What is RSX?
Jurik RSX is a technical analysis indicator that is a variation of the Relative Strength Index Smoothed ( RSX ) indicator. It was developed by Mark Jurik and is designed to help traders identify trends and momentum in the market.
The Jurik RSX uses a combination of the RSX indicator and an adaptive moving average (AMA) to smooth out the price data and reduce the number of false signals. The adaptive moving average is designed to adjust the smoothing period based on the current market conditions, which makes the indicator more responsive to changes in price.
The Jurik RSX can be used to identify potential trend reversals and momentum shifts in the market. It oscillates between 0 and 100, with values above 50 indicating a bullish trend and values below 50 indicating a bearish trend . Traders can use these levels to make trading decisions, such as buying when the indicator crosses above 50 and selling when it crosses below 50.
The Jurik RSX is a more advanced version of the RSX indicator, and while it can be useful in identifying potential trade opportunities, it should not be used in isolation. It is best used in conjunction with other technical and fundamental analysis tools to make informed trading decisions.
What is Slow RSI?
Slow RSI is a variation of the traditional Relative Strength Index ( RSI ) indicator. It is a more smoothed version of the RSI and is designed to filter out some of the noise and short-term price fluctuations that can occur with the standard RSI .
The Slow RSI uses a longer period of time than the traditional RSI , typically 21 periods instead of 14. This longer period helps to smooth out the price data and makes the indicator less reactive to short-term price fluctuations.
Like the traditional RSI , the Slow RSI is used to identify potential overbought and oversold conditions in the market. It oscillates between 0 and 100, with values above 70 indicating overbought conditions and values below 30 indicating oversold conditions. Traders often use these levels as potential buy and sell signals.
The Slow RSI is a more conservative version of the RSI and can be useful in identifying longer-term trends in the market. However, it can also be slower to respond to changes in price, which may result in missed trading opportunities. Traders may choose to use a combination of both the Slow RSI and the traditional RSI to make informed trading decisions.
What is Rapid RSI?
Same as regular RSI but with a faster calculation method
What is Harris RSI?
Harris RSI is a technical analysis indicator that is a variation of the Relative Strength Index ( RSI ). It was developed by Larry Harris and is designed to help traders identify potential trend changes and momentum shifts in the market.
The Harris RSI uses a different calculation formula compared to the traditional RSI . It takes into account both the opening and closing prices of a financial instrument, as well as the high and low prices. The Harris RSI is also normalized to a range of 0 to 100, with values above 50 indicating a bullish trend and values below 50 indicating a bearish trend .
Like the traditional RSI , the Harris RSI is used to identify potential overbought and oversold conditions in the market. It oscillates between 0 and 100, with values above 70 indicating overbought conditions and values below 30 indicating oversold conditions. Traders often use these levels as potential buy and sell signals.
The Harris RSI is a more advanced version of the RSI and can be useful in identifying longer-term trends in the market. However, it can also generate more false signals than the standard RSI . Traders may choose to use a combination of both the Harris RSI and the traditional RSI to make informed trading decisions.
What is Cuttler RSI?
Cuttler RSI is a technical analysis indicator that is a variation of the Relative Strength Index ( RSI ). It was developed by Curt Cuttler and is designed to help traders identify potential trend changes and momentum shifts in the market.
The Cuttler RSI uses a different calculation formula compared to the traditional RSI . It takes into account the difference between the closing price of a financial instrument and the average of the high and low prices over a specified period of time. This difference is then normalized to a range of 0 to 100, with values above 50 indicating a bullish trend and values below 50 indicating a bearish trend .
Like the traditional RSI , the Cuttler RSI is used to identify potential overbought and oversold conditions in the market. It oscillates between 0 and 100, with values above 70 indicating overbought conditions and values below 30 indicating oversold conditions. Traders often use these levels as potential buy and sell signals.
The Cuttler RSI is a more advanced version of the RSI and can be useful in identifying longer-term trends in the market. However, it can also generate more false signals than the standard RSI . Traders may choose to use a combination of both the Cuttler RSI and the traditional RSI to make informed trading decisions.
What is Ehlers Smoothed RSI?
Ehlers smoothed RSI is a technical analysis indicator that is a variation of the Relative Strength Index ( RSI ). It was developed by John Ehlers and is designed to help traders identify potential trend changes and momentum shifts in the market.
The Ehlers smoothed RSI uses a different calculation formula compared to the traditional RSI . It uses a smoothing algorithm that is designed to reduce the noise and random fluctuations that can occur with the standard RSI . The smoothing algorithm is based on a concept called "digital signal processing" and is intended to improve the accuracy of the indicator.
Like the traditional RSI , the Ehlers smoothed RSI is used to identify potential overbought and oversold conditions in the market. It oscillates between 0 and 100, with values above 70 indicating overbought conditions and values below 30 indicating oversold conditions. Traders often use these levels as potential buy and sell signals.
The Ehlers smoothed RSI can be useful in identifying longer-term trends and momentum shifts in the market. However, it can also generate more false signals than the standard RSI . Traders may choose to use a combination of both the Ehlers smoothed RSI and the traditional RSI to make informed trading decisions.
What is a Vertical Horizontal Filter?
The Vertical Horizontal Filter (VHF) is a technical indicator used in trading to identify whether a market is trending or in a sideways trading range. It was developed by Adam White, and is based on the concept that markets tend to exhibit more volatility when they are trending, and less volatility when they are in a sideways range.
The VHF is calculated by taking the ratio of the range of the high and low prices over a specified period to the total range of prices over the same period. The resulting ratio is then multiplied by 100 to create a percentage value.
If the VHF is above a certain threshold, typically 60, it is considered to be indicating a trending market. If it is below the threshold, it is indicating a sideways trading range.
Traders use the VHF to help identify market conditions and to adjust their trading strategies accordingly. In a trending market, traders may look for opportunities to enter or exit positions based on the direction of the trend, while in a sideways trading range, traders may look for opportunities to buy at the bottom of the range and sell at the top.
The VHF can also be used in conjunction with other technical indicators, such as moving averages or momentum indicators, to help confirm trading signals. For example, if the VHF is indicating a trending market and the moving average is also indicating a trend, this may provide a stronger signal to enter or exit a trade.
One potential limitation of the VHF is that it can be less effective in markets that are transitioning between trending and sideways trading ranges. During these periods, the VHF may not accurately reflect the current market conditions, and traders may need to use other indicators or methods to help identify the current trend.
In summary, the Vertical Horizontal Filter (VHF) is a technical indicator used in trading to identify whether a market is trending or in a sideways trading range. It is based on the concept that markets exhibit more volatility when they are trending, and less volatility when they are in a sideways range. Traders use the VHF to help identify market conditions and adjust their trading strategies accordingly.
What are Dynamic Zones?
As explained in "Stocks & Commodities V15:7 (306-310): Dynamic Zones by Leo Zamansky, Ph .D., and David Stendahl"
Most indicators use a fixed zone for buy and sell signals. Here’ s a concept based on zones that are responsive to past levels of the indicator.
One approach to active investing employs the use of oscillators to exploit tradable market trends. This investing style follows a very simple form of logic: Enter the market only when an oscillator has moved far above or below traditional trading lev- els. However, these oscillator- driven systems lack the ability to evolve with the market because they use fixed buy and sell zones. Traders typically use one set of buy and sell zones for a bull market and substantially different zones for a bear market. And therein lies the problem.
Once traders begin introducing their market opinions into trading equations, by changing the zones, they negate the system’s mechanical nature. The objective is to have a system automatically define its own buy and sell zones and thereby profitably trade in any market — bull or bear. Dynamic zones offer a solution to the problem of fixed buy and sell zones for any oscillator-driven system.
An indicator’s extreme levels can be quantified using statistical methods. These extreme levels are calculated for a certain period and serve as the buy and sell zones for a trading system. The repetition of this statistical process for every value of the indicator creates values that become the dynamic zones. The zones are calculated in such a way that the probability of the indicator value rising above, or falling below, the dynamic zones is equal to a given probability input set by the trader.
To better understand dynamic zones, let's first describe them mathematically and then explain their use. The dynamic zones definition:
Find V such that:
For dynamic zone buy: P{X <= V}=P1
For dynamic zone sell: P{X >= V}=P2
where P1 and P2 are the probabilities set by the trader, X is the value of the indicator for the selected period and V represents the value of the dynamic zone.
The probability input P1 and P2 can be adjusted by the trader to encompass as much or as little data as the trader would like. The smaller the probability, the fewer data values above and below the dynamic zones. This translates into a wider range between the buy and sell zones. If a 10% probability is used for P1 and P2, only those data values that make up the top 10% and bottom 10% for an indicator are used in the construction of the zones. Of the values, 80% will fall between the two extreme levels. Because dynamic zone levels are penetrated so infrequently, when this happens, traders know that the market has truly moved into overbought or oversold territory.
Calculating the Dynamic Zones
The algorithm for the dynamic zones is a series of steps. First, decide the value of the lookback period t. Next, decide the value of the probability Pbuy for buy zone and value of the probability Psell for the sell zone.
For i=1, to the last lookback period, build the distribution f(x) of the price during the lookback period i. Then find the value Vi1 such that the probability of the price less than or equal to Vi1 during the lookback period i is equal to Pbuy. Find the value Vi2 such that the probability of the price greater or equal to Vi2 during the lookback period i is equal to Psell. The sequence of Vi1 for all periods gives the buy zone. The sequence of Vi2 for all periods gives the sell zone.
In the algorithm description, we have: Build the distribution f(x) of the price during the lookback period i. The distribution here is empirical namely, how many times a given value of x appeared during the lookback period. The problem is to find such x that the probability of a price being greater or equal to x will be equal to a probability selected by the user. Probability is the area under the distribution curve. The task is to find such value of x that the area under the distribution curve to the right of x will be equal to the probability selected by the user. That x is the dynamic zone.
What is Adaptive Digital Kahler Variety RSI w/ DZ?
We first calculate the VHF filter, we then inject that period output into an RSI calculation, we apply a Digital Kahler filter to this output, and finally, we create Dynamic Zones to determine oscillator extremes. There are four types of signals: Slope, Static Zero-line, Dynamic Levels, and Dynamic Middle
Requirements
Inputs
Confirmation 1 and Solo Confirmation: GKD-V Volatility / Volume indicator
Confirmation 2: GKD-C Confirmation indicator
Outputs
Confirmation 2 and Solo Confirmation Complex: GKD-E Exit indicator
Confirmation 1: GKD-C Confirmation indicator
Continuation: GKD-E Exit indicator
Solo Confirmation Simple: GKD-BT Backtest strategy
Additional features will be added in future releases.

Jerry J8 30-123 Spy Dashboard ProPlease watch the J8 Scalping Tutorial Video below for a walkthrough on how these indicators work.
This script is used in conjunction with Jerry J8 30-123 SPY Scalping PRO” Indicator(which creates the buy and sell orders as a strategy). The Dashboard shows the 4 main criteria statuses from the strategy. I find the dashboard makes scalping the SPY much easier.
This study project is designed for scalping options that expire daily with bull put and bear call credit spreads on a 3 minute chart. The name 30_123 is a reference to 4 main criteria being met to give a green light for a potential trade. The criteria:
* 30 = 30 minute trend
* 1 = 3 minute trend
* 2 = Moving average criteria
* 3 = RSI criteria
4 = Secondary trend. Bonus if in sync but not a requirement.
* The strategy also utilizes momentum as a criteria but this is not shown on the dashboard.
This indicator is designed to trade options that expire daily including the SPY, IWM, QQQ, and NDX. However, it can be used with multiple symbols on a 3 minute chart.
When the 30_123 conditions are all green with all criteria are met a bull signal is created.
When the 30_123 conditions are all red with all criteria are met a bear signal is created.
This study is the dashboard that is designed to show how the main J8 strategy indicator is working and it shows which criteria have been met. Additionally there are multiple user INPUTS that you can adjust for the 4 main criteria plus inputs to help you with your credit spread criteria.
For example, if the SPY is at 400 we could have an order to sell a BULL PUT CREDIT SPREAD and I would likely sell the 398p and buy the 397p; The 398p delta would be approximately -.2. The spread position profits with any close over 398 and/or can be closed early with a bullish price move. IMPORTANT: If the SPY closed the day at $399 on the chart it would look like a loss based on the buy and sell orders but the spread would be a full profit since the close was above 398.
---- IRON CONDOR
For the SPY ticker only an iron condor label is generated when the SPY is trading sideways and meets specified criteria. When the criteria is met the Iron Condor label appears and it provides a recommendation for what option to buy and sell. The iron condor recommendations can be adjusted with user inputs.
This Indicator dashboard shows the criteria labels and colors the criteria as green if bullish and red if bearish. When the criteria are not met the dashboard shows “NO CLEAR SIGNAL”. There is also a label that shows whether you are looking for bullish or bearish positions based on the 30 minute trend.
The chart shown on the indicator is the RSI and for this indicator an RSI over 50 is bullish and under 50 is bearish. The line color shows the RSI trend. RSI OB (overbought) and OS (oversold) areas are shaded. The RSI can remain in an OB or OS state for a prolonged period and while some people use OB and OS as a reversal signal I use it as a strong trend indication and recognize it will not last forever. You can SET the OB and OS levels with inputs.
---- USER INPUTS
Paint Bars: Turns on/off the candle coloring. Default is OFF.
Iron Condor Settings: Defaults are what I use and can be used as a guide.
Criteria: Trend, moving averages, and RSI settings can all be adjusted.
---- SETUP & HINTS
Add "Jerry J8 30-123 SPY Scalping PRO” indicator to show bull and bear signals
Add "Jerry J8 MACD Optimal Entry Zone” indicator to show best MACD range for entry
I also like to add "Jerry Momentum Dream" indicator to see the momentum
With this indicator we’re looking for the 30, 1, 2, and 3 criteria to be met which increases our likelihood of success. IMPORTANT. Never automatically enter a position without reviewing the other indicators and drawing your own conclusions. You want to choose the entries that are the most appealing to you that take into account volume, time of day, and risk/reward. Positions should be closed based on your risk/reward goals.
Indicators are not a magic pill and should be used to support trading decisions, not to make them for you. Past performance is not a guarantee of future returns. The results of individual stocks/indexes with any strategy do not constitute proof they will repeat in the future.
DISCLAIMER: The information contained in our scripts/indicators/ideas does not constitute financial advice or a solicitation to buy or sell any securities of any type. Trading and investing in the stock market and cryptocurrencies involves substantial risk of loss and is not suitable for every investor. I’m NOT a financial adviser. All trading strategies are used at your own risk.
Please Use the AUTHOR’s INSTRUCTIONS link below for more information.
NOTE: The PERFORMANCE SUMMARY below does not accurately reflect the trading strategy because the entry orders generated in the strategy are based on the stock price and our actual order is a credit spread that is profitable even if the price moves against us a little bit. What could show as a loss in the strategy could be a profit in the credit spread.

[blackcat] L3 Super Best Cost LineLevel: 3
Background
As suggested by @hedan1, he made a suggestion: this indicator can be further optimized to develop a dull line to filter the overall direction, and then use the sensitive line as a confirmation signal to enter.
One of my favourite tool to see fast trends which is simple but powerful. It runs under below market logic.
Function
With @hedan1's idea, the 1st thing i come up with is a two-layer structure: the inner sensitive part is the best cost line indicator, the outer layer is a supertrend indicator to control the overall trend direction.
Best cost line is a tool to model the people's mood and preference in the market. I define a typical price as wcx, when wcx is above the best cost line, which means traders are willing to use higher price to buy, then if you long, you are following the trend and make profit. On the other hand, if wcx is below the best cost line, which means traders are NOT willing to pursue higher price (maybe due to continous stop loss or sth other), then you should at least not long or if you are agressive in style, you may consider short.
That is it. Do you think it is simple and powerful enough?
Remarks
L: long entry, yellow
XL: close long, fuchsia
S: short entry, green
XS: close short, red
inner bullish: yellow color
inner bearish: fuchsia color
outer bullish: green color
outer bearish: red color
inner indicator : the best cost line
outer indicator : supertrend
also, i improved the display fucntinon remove some blur lines with linebr feature.
Feedbacks are appreciated.
Buy Sell IndicatorThis Buy Sell Indicator uses price action calculations to determine the bullish or bearish nature of the current market and then calculates if the price action is strong enough to give a signal. The indicator is fully adjustable so you can fine tune it to fit your specific trading style with Scalp Mode, Swing Mode, Long Swing Mode and candle trailing length. It also has an automatic trailing stop loss and take profit features that can be customized.
For price action identification, scalp mode looks at the candle body, candle wicks and size of the body and wicks and compares all of that to the previous candle to see if it is bullish or bearish. Swing mode will compare the current candle to the last 2 candles and long swing mode will compare the current candle to the last 10 candles. It’s looking for higher highs & lower lows, if the candle body is large or small and much more.
There are also filters that prevent signals from being given when the candle is small or has not made a higher high or lower low compared to the previous candle and multiple other filters to help hold positions longer. Once the price action direction has been confirmed, then the script looks at a massive amount of other calculations to determine if a signal should be given or not. These calculations are made up of all of my best indicators combined into a master signal generator as well as more new calculations from things I have learned over time and tested extensively that have not been made available to the public until now.
Price action as well as many other factors will all have to be confirming the direction before a signal can come in, but it reacts very quickly so it can give early signals at the first sign of reversal. Fine tune your settings to match your trading style from within the input settings and then look for potential reversal areas and take signals that appear in that reversal area for the highest probability of winning trades. I decided not to include any support or resistance or similar tools in order to keep the indicator lightweight and respond as fast as possible as well as update the candles as quickly as possible. This also lets you keep your charts clean and only use the support & resistance tools that you prefer since everyone has a different trading style.
HIGHER TIMEFRAME AND/OR MARKET SCANNER
There is also a higher timeframe scanner available as a separate indicator titled Buy Sell Signal Scanner that you can find on my profile. It can be customized to show you up to 8 higher timeframes of your current ticker or any other ticker you like. This is useful for trading with the trend of the higher timeframes or you can set it to the same timeframe as your chart and scan other tickers that usually move together or opposite for extra confirmation. Each ticker/timeframe will be displayed in a table on the chart and colored green or red depending if it is currently bullish or bearish. If you are using a different timeframe than the current chart, then it will display the timeframe next to the ticker name.
HOW TO USE
CANDLES
The candles will paint blue or orange according to the price action detected. This can be customized or turned on/off and will follow the price action according to the trade mode settings. Using these candle colors helps to get rid of anxiety when watching candles come in that are in the opposite direction of your trade. I highly recommend using this feature as it helps you control your emotions much better during trading.
TRADE MODE
The trade mode settings let you choose between Scalp Mode, Swing Mode and Long Swing mode. They all use the same price calculations, but each mode has its own filters to hold through ranging price action in a slightly different way. You can also adjust the candle trailing length to make it hold positions even longer. The candle trailing length will not let a signal come in until there is a higher high or lower low than the previous X number of candles from this setting.
Scalp mode will get you in and out of positions the earliest. Swing mode will hold signals longer by filtering out ranging price action. Long swing mode uses even more filtering to hold positions even longer than swing mode and let price range more without calling out every move. Each one of these modes will also be affected by the candle trailing length.
It should be noted that using swing mode and long swing mode or increasing the candle trailing length will make the signals not perform as well when price action is whipsawing up and down and also will not have as early of entries and exits as scalp mode due to the range breaks that are needed for a signal to be given. That being said, it will hold positions much longer when markets are trending and still have great entries and exits, so use the longer settings when markets are trending and then switch to scalp mode when the market is chopping around and moving sideways for best results.
Scalp Mode
Swing Mode
Long Swing Mode
STOPLOSS
There is an automatic stoploss feature as well. It calculates the average candle height and adds/subtracts that from the highest high or lowest low of the past X number of candles according to your Stoploss Candle Trail Length. Use a lower number for a tight trailing stoploss and increase the number for a more loose stoploss. You can also customize the color of the stoploss line and label or turn it off if you prefer. The stoploss will update on every candle for proper trailing but it will not switch to an opposing signal until the candle closes with a new signal.
TAKE PROFIT
There is an automatic take profit level generator as well that also uses the average candle height for its calculations. There are 3 settings that let you set the average candle size multiplier for each take profit level. The default settings are evenly spaced at 3, 6 and 9 times the average candle height from where the most recent signal locked in at candle close. Adjust these numbers to suit your preference. You can also customize the color of the take profit lines and label or turn it off if you prefer. The take profit levels will not change to an opposing signal until the opposing signal is confirmed on the candle close.
Auto Stoploss & Take Profit
SIGNALS
The default signals are green and red arrows. The color can be adjusted in the settings or you can turn the bull or bear signals on or off if you only want entry signals for the direction of the trend.
VOLUME SPIKE SUPPORT & RESISTANCE
There are volume based auto support & resistance levels that are off by default, but can be turned on in the settings. It calculates the average volume over multiple periods and gets the average of that and then looks for volume spikes that were greater than the average, multiplied by the volume spike multiplier in the settings. If set to 3, then the volume spike will need to be 3 times or higher than the average volume bar for a level to show up. Increase or decrease this number to get more or less levels.
VOLUME WARNING
If volume is very low compared to normal, then a volume warning label will appear at the top of the chart letting you know that volume is very low and to trade with caution. I recommend not trading during those times though as price can whipsaw very easily.
ALERTS
There are also alerts that can be triggered for buy signals as well as sell signals. They are set to only send signals when the bar is confirmed so you won’t get alerts for signals that repaint while the candle is still open. You can use these alerts to send signals to your own trading bot if you choose to.
MARKETS
This buy sell indicator can be used on any market with price data such as stocks, crypto, forex and futures.
TIMEFRAMES
This buy sell indicator can be used on any timeframe.
PAIRINGS
We recommend pairing this Buy Sell Indicator with our Buy Sell Signal Scanner so you can check other timeframes and trade with the trend or use the scanner to look at other markets that move together or opposite of the ticker you are trading for extra confirmation of direction.

[E5 Trading] Advanced RSIAdvanced RSI Overview
The traditional RSI momentum indicator measures the magnitude of price changes over a user-specified period to determine overbought and oversold conditions in the price of an asset.
E5 Trading Advanced RSI adds several sophisticated features to enhance the analysis of RSI to detect early signs of trend reversals and continuations.
Advanced capabilities include customizable fast and slow RSI moving averages, RSI Bollinger Bands, relative overbought and oversold signals, and regular and hidden divergences.
These features provide traders with opportunities to identify confluence using other E5 Trading indicator suite signals and increase the probability of entering winning trades.
RSI Moving Averages
RSI moving average crossovers help determine momentum shifts in the overall trend, similar to price moving average crossovers.
Set the moving average type (default: EMA ), fast-moving RSI period (default: 3), and slow-moving RSI period (default: 5).
When the fast-moving RSI crosses above the slow-moving RSI, bullish. When the fast-moving RSI crosses under the slow-moving RSI, bearish.
The Moving Average Fill feature (default: On) colors the area between the fast-moving and slow-moving RSI lines with bullish and bearish momentum shading.
RSI Bollinger Bands
Like Bollinger Bands for price action, RSI Bollinger Bands can be used as moving oversold and overbought thresholds, which adjust with the RSI oscillator based on its volatility.
When RSI breaks out above the upper RSI Bollinger Band, the asset is overbought on a relative basis, given its price history.
When RSI breaks out below the lower RSI Bollinger Band, the asset is oversold on a relative basis.
Evaluating RSI on a relative basis is more reliable than evaluating RSI on an absolute basis with fixed 30/70 thresholds for oversold/overbought, which traditional RSI analysis relies on.
This is because rigid 30/70 thresholds are arbitrary rules-of-thumb that may (or may not) be relevant to current market conditions.
When RSI is riding the upper or lower Bollinger Bands and breaks towards the middle, this reversion to the mean (i.e., basis line) can signal that the trend may be reversing.
Toggle to turn on the basis (i.e., mean) line of the RSI Bollinger Bands.
The basis line can also be used as a support line when RSI values are above it or as a resistance line when RSI values are below it.
Relative Oversold | Overbought
Relative Oversold | Overbought signals (i.e., dots) provide the Advanced RSI trader with the means to identify trend reversal or continuation opportunities that most traders will miss.
Relative Oversold | Overbought signals reflect an adaptive approach that normalizes RSI data relative to the trend using RSI Bollinger Bands.
These signals improve the reliability of RSI oversold and overbought signals compared to traditional methods and eliminate the need to trade within the confines of fixed 30/70 RSI thresholds.
Signals will appear even when the standard RSI line may be far away from the generally accepted oversold and overbought thresholds (i.e., 30 and 70, respectively).
Advanced RSI Divergences
Divergences occur when a technical indicator, like an oscillator, moves in the opposite direction of the price.
They often serve as an early warning of a trend reversal (via regular divergence signals) or trend continuation (via hidden divergence signals).
Regular divergences provide an early warning signal of potential trend reversals (i.e., trend weakening).
Hidden divergences provide an early warning signal of potential trend continuation (i.e., trend strength).
Regular and Hidden divergences flag in real-time when 'Potential' (default) is selected as the Divergences Confirmation State.
This feature is a leading indicator that provides the trader with an early warning of a potential trend change (regular divergences) or trend continuation (hidden divergences).
Potential RSI regular divergence signals are plotted directly on the RSI chart, with bullish and bearish divergences flagging with an ‘R’ below and above the RSI line, respectively.
Potential RSI hidden divergence signals are plotted directly on the RSI chart, with bullish and bearish divergences flagging with an ‘H’ below and above the RSI line, respectively.
Confirmed RSI regular divergence signals are plotted directly on the RSI chart, with bullish and bearish divergences flagging with an ‘R-Bull’ below and 'R-Bear' above the RSI line, respectively.
Confirmed RSI hidden divergence signals are plotted directly on the RSI chart, with bullish and bearish divergences flagging with an ‘H-Bull’ below and 'H-Bear' above the RSI line, respectively.
Always practice risk management: Use proper position sizing and a stop-loss on every trade.

Options Scalping by harsh gbychi this is my script.
Bank Nifty Live OI Change Chart can give very useful clues for intraday support and resistance levels for Bank Nifty. If there is more addition in Open Interest at 12200 Calls, that would mean most market players are comfortable writing call options at this level because they believe it to be a strong resistance. That would be bearish indication for BankNifty.
Similarly is there is highest writing in 12000 Puts that would indicate strong intraday support at that level.
Third Scenario: There is good amount of Open Interest increase in 12000 PE and 12200 CE –> this means we should expect a range bound session for the day, as both bears and bulls are comfortable holding the 12200 and 12000 levels respectively.
Following factors could improve reliability of BankNifty OI Change analysis:
1) Put Call Ratio: Higher PCR means bullishness. If there is more writing at 12000PE and PCR is high and increasing during the day that would add to bullish scenario
If the PCR is declining for the day and more writing happening at 12200CE then this adds to bearishness.
2) Close to expiry: The closer to expiry we are, the more reliable the ‘Open Interest’ analysis. Early in the series, the OI analysis is less reliable.
3) More Players: As the number of players increase, the OI analysis become more reliable.
4) Bid-ask Spread: The lower the bid-ask spread the more reliable the OI analysis.
5) Technical Indicators: The best trades are found by combining OI analysis with other technical indicators. MACD, RSI, Channel lines and EW count give best results with Open Interest Analysis.
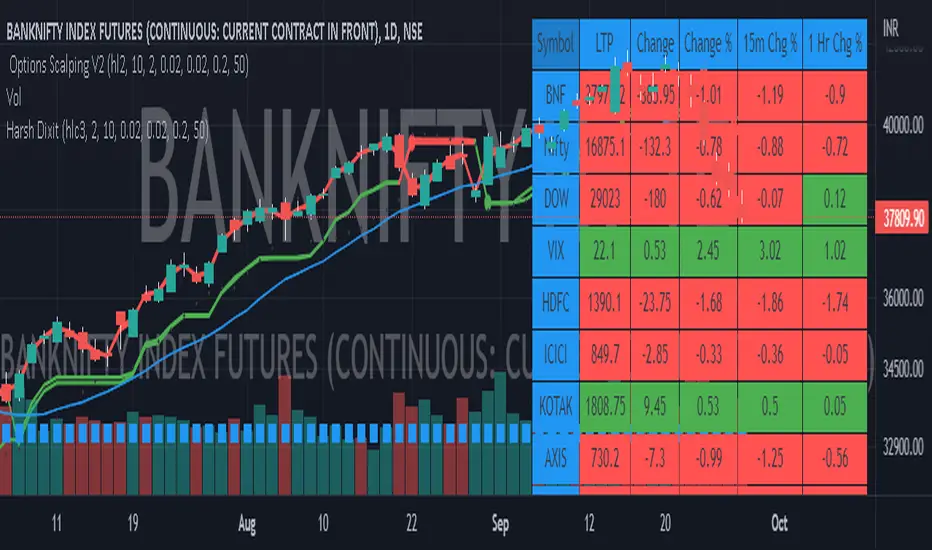
Rollover LTEThis indicator shows where price needs to be and when in order to cause the 20-sma and 50-sma moving averages to change directions. A change in direction requires the slope of a moving average to change from negative to positive or from positive to negative. When a moving average changes direction, it can be said that it has “rolled over” or “rolled up,” with the latter only applying if slope went from negative to positive.
Theory:
In order to solve for the price of the current bar that will cause the moving average to roll up, the slope from the previous bar’s average to the current bar’s average must be set equal to zero which is to say that the averages must be the same.
For the 20-sma, the equation simply stated in words is as follows:
Current MA as a function of current price and previous 19 values = previous MA which is fixed based on previous 20 values
The denominators which are both 20 cancel and the previous 19 values cancel. What’s left is current price on the left side and the value from 20 bars ago on the right.
Current price = value from 20 bars ago
and since the equation was set up for solving for the price of the current bar that will cause the MA to roll over
Rollover price = value from 20 bars ago
This makes plotting rollover price, both current and forecasted, fairly simple, as it’s merely the closing price plotted with an offset to the right the same distance as the moving average length.
Application:
The 20-sma and 50-sma rollover prices are plotted because they are considered to be the two most important moving averages for rollover analysis. Moving average lengths can be modified in the indicator settings. The 20-sma and 20-sma rollover price are both plotted in white and the 50-sma and 50-sma rollover price are both plotted in blue. There are two rollover prices because the 20-sma rollover price is the price that will cause the 20-sma to roll over and the 50-sma rollover price is the price that will cause the 50-sma to roll over. The one that's vertically furthest away from the current price is the one that will cause both to rollover, as should become clearer upon reading the explanation below.
The distance between the current price and the 20-sma rollover price is referred to as the “rollover strength” of the price relative to the 20-sma. A large disparity between the current price and the rollover price suggests bearishness (negative rollover strength) if the rollover price is overhead because price would need to travel all that distance in order to cause the moving average to roll up. If the rollover price and price are converging, as is often the case, a change in moving average and price direction becomes more plausible. The rollover strengths of the 20-sma and 50-sma are added together to calculate the Rollover Strength and if a negative number is the result then the background color of the plot cloud turns red. If the result is positive, it turns green. Rollover Strength is plotted below price as a separate indicator in this publication for reference only and it's not part of this indicator. It does not look much different from momentum indicators. The code is below if anybody wants to try to use it. The important thing is that the distances between the rollover prices and the price action are kept in mind as having shrinking, growing, or neutral bearish and bullish effects on current and forecasted price direction. Trades should not be entered based on cloud colorization changes alone.
If you are about to crash into a wall of the 20-sma rollover price, as is indicated on the chart by the green arrow, you might consider going long so long as the rollover strength, both current and forecasted, of the 50-sma isn’t questionably bearish. This is subject to analysis and interpretation. There was a 20-sma rollover wall as indicated with yellow arrow, but the bearish rollover strength of the 50-sma was growing and forecasted to remain strong for a while at that time so a long entry would have not been suggested by both rollover prices. If you are about to crash into both the 20-sma and 50-sma rollover prices at the same time (not shown on this chart), that’s a good time to place a trade in anticipation of both slopes changing direction. You may, in the case of this chart, see that a 20-sma rollover wall precedes a 50-sma rollover convergence with price and anticipate a cascade which turned out to be the case with this recent NQ rally.
Price exiting the cloud entirely to either the upside or downside has strong implications. When exiting to the downside, the 20-sma and 50-sma have both rolled over and price is below both of them. The same is true for upside exits. Re-entering the cloud after a rally may indicate a reversal is near, especially if the forecasted rollover prices, particularly the 50-sma, agree.
This indicator should be used in conjunction with other technical analysis tools.
Additional Notes:
The original version of this script which will not be published was much heavier, cluttered, and is not as useful. This is the light version, hence the “LTE” suffix.
LTE stands for “long-term evolution” in telecommunications, not “light.”
Bar colorization (red, yellow, and green bars) was added using the MACD Hybrid BSH script which is another script I’ve published.
If you’re not sure what a bar is, it’s the same thing as a candle or a data point on a line chart. Every vertical line showing price action on the chart above is a bar and it is a bar chart.
sma = simple moving average
Rollover Strength Script:
// This source code is subject to the terms of the Mozilla Public License 2.0 at mozilla.org
// © Skipper86
//@version=5
indicator(title="Rollover Strength", shorttitle="Rollover Strength", overlay=false)
source = input.source(close)
length1 = input.int(20, "Length 1", minval=1)
length2 = input.int(50, "Length 2", minval=1)
RolloverPrice1 = source
RolloverPrice2 = source
RolloverStrength1 = source-RolloverPrice1
RolloverStrength2 = source-RolloverPrice2
RolloverStrength = RolloverStrength1 + RolloverStrength2
Color1 = color.rgb(155, 155, 155, 0)
Color2 = color.rgb(0, 0, 200, 0)
Color3 = color.rgb(0, 200, 0, 0)
plot(RolloverStrength, title="Rollover Strength", color=Color3)
hline(0, "Middle Band", color=Color1)
//End of Rollover Strength Script

Heiken Ashi MTF Oracle [JoseMetal]============
ENGLISH
============
- Description:
This indicator shows a 3 Multi Time Frame (MTF) Heiken Ashi candlestick oracle.
It shows 3 different lines with changes between bullish and bearish Heiken Ashi candlesticks for 3 automatic or custom timeframes.
It has alerts for LONG and SHORT (when all timeframes agree in the same candle).
- Visual:
Each line represents the color of the Heiken Ashi candlestick on a different timeframe, by default, green is bullis and red is bearish.
A square (configurable) shows the change between bullish and bearish.
When the combination of the 3 timeframes occur (3 bull or bear) the background is highlighted, after that as long as they agree the background will remain with that color.
- Customization:
As usual in my indicators, everything is customizable, timeframes are auto, but you can pick yours, colors, figures etc.
- Usage and recommendations:
Everything is good by default, it's recommended to use a x3 or x4 multiplier for the timeframes, example: 5 min, 15 min, 45 min or 5 min, 20 min and 60 min.
Personally, I use this in 1-3 min for scalping getting the very first time the 3 timeframes agree usually gives awesome entries.
Enjoy!
============
ESPAÑOL
============
- Descripción:
Este indicador muestra un oráculo de velas Heiken Ashi en 3 temporalidades diferentes (MTF).
Muestra 3 líneas diferentes con cambios entre velas Heiken Ashi alcistas y bajistas para 3 marcos temporales automáticos o personalizados.
Tiene alertas para LONG y SHORT (cuando todas las temporalidades coinciden en la misma vela).
- Visual:
Cada línea representa el color de la vela Heiken Ashi en un marco temporal diferente, por defecto, el verde es alcista y el rojo es bajista.
Un cuadrado (configurable) muestra el cambio entre alcista y bajista.
Cuando se produce la combinación de los 3 temporalidades (3 alcistas o bajistas) el fondo se resalta, después mientras coincidan el fondo permanecerá con ese color.
- Personalización:
Como es habitual en mis indicadores, todo es personalizable, los marcos de tiempo son automáticos, pero puedes elegir los tuyos, colores, figuras, etc.
- Uso y recomendaciones:
Todo está bien por defecto, se recomienda usar un multiplicador x3 o x4 para las temporalidades, ejemplo: 5 min, 15 min, 45 min o 5 min, 20 min y 60 min.
Personalmente, uso éste indicador en 1-3 min para scalping, si entras la primera vez que las 3 temporalidades coinciden sueles coger un muy buen movimiento.
¡Que lo disfrutéis!
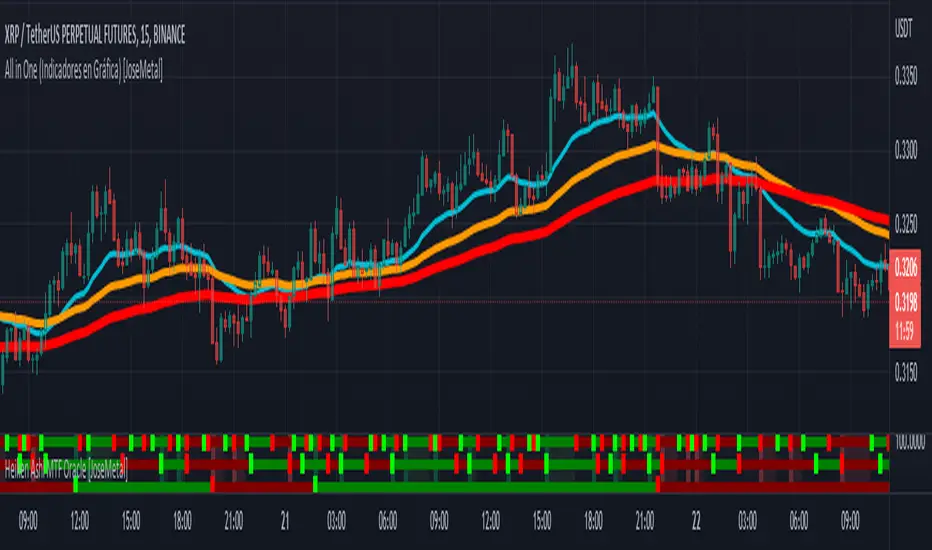
Oxy CandlestickOxymoronic (oxy) candlesticks often appear at significant levels in a chart and can indicate increased probabilities of directional moves.
Typically, green candles are hollow and red candles are filled. An oxymoronic candle is colored bullishly but filled bearishly (solid green) or vice versa (hollow red).
Oxy flags occur when:
1) Price gaps up and closes lower than the open but above the last close. A solid green (or black) candle is bearish.
2) Price gaps down and closes higher than the open but below the last close. A hollow red candle is bullish.
An oxy candle indicates one of three things:
1) Price is going up (bullish oxy)
2) Price is going down (bearish oxy)
3) Price will return to this level (either)
#1 and #2 are the default meaning. If those don't play out then look for #3.
As is the case with most indicators, it is best not to use this indicator in isolation, but to combine it with other forms of analysis to increase your probabilities and to identify significant levels.
