Divergence Stoch RSI[mado]Divergence screener for Stoch RSI
Regular Bullish: "D" navy label
Hidden Bullish: "H" navy label
Regular Bearish: "D" red label
Hidden Bearish: "H" red label
Cari skrip untuk "bear"
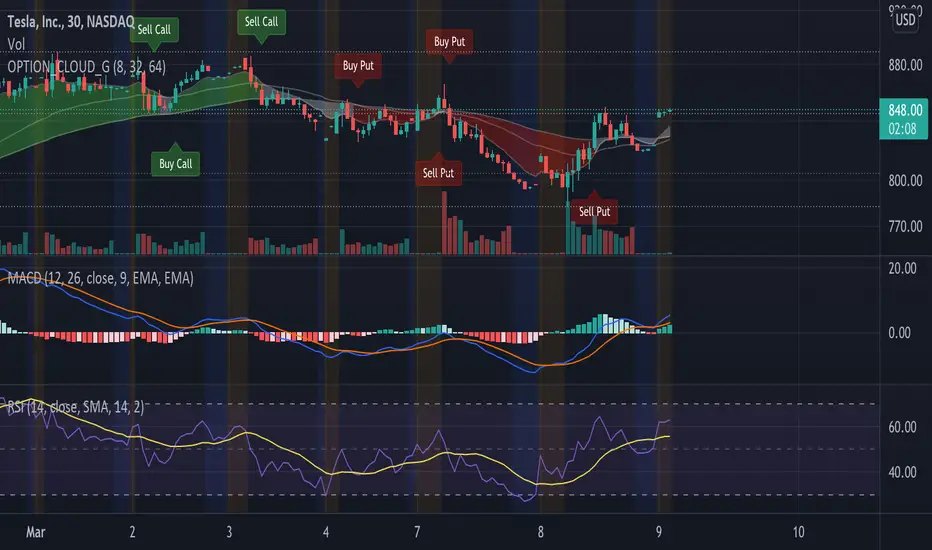
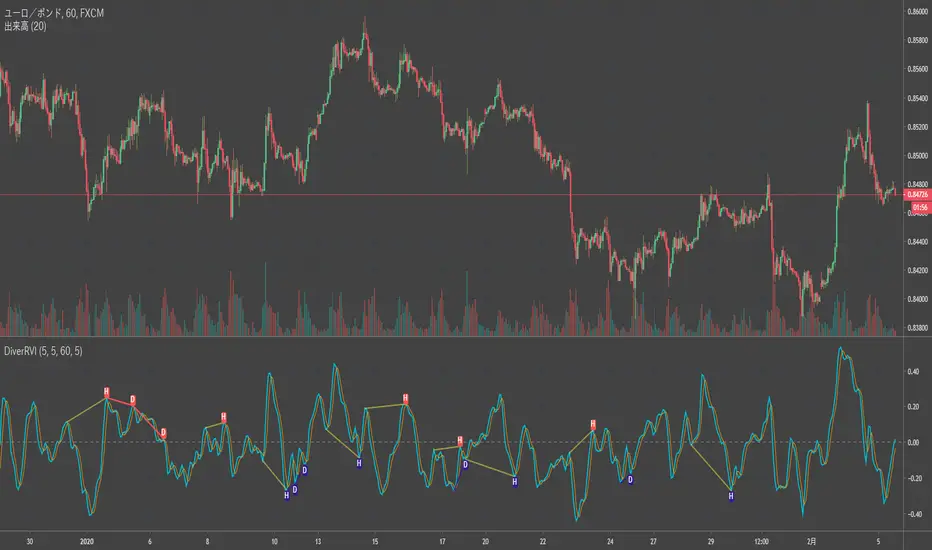
Divergence RVI[mado]Divergence screener for RVI
Regular Bullish: "D" navy label
Hidden Bullish: "H" navy label
Regular Bearish: "D" red label
Hidden Bearish: "H" red label
Divergence OBV RSI[mado]Divergence screener for OBV RSI
Regular Bullish: "D" navy label
Hidden Bullish: "H" navy label
Regular Bearish: "D" red label
Hidden Bearish: "H" red label
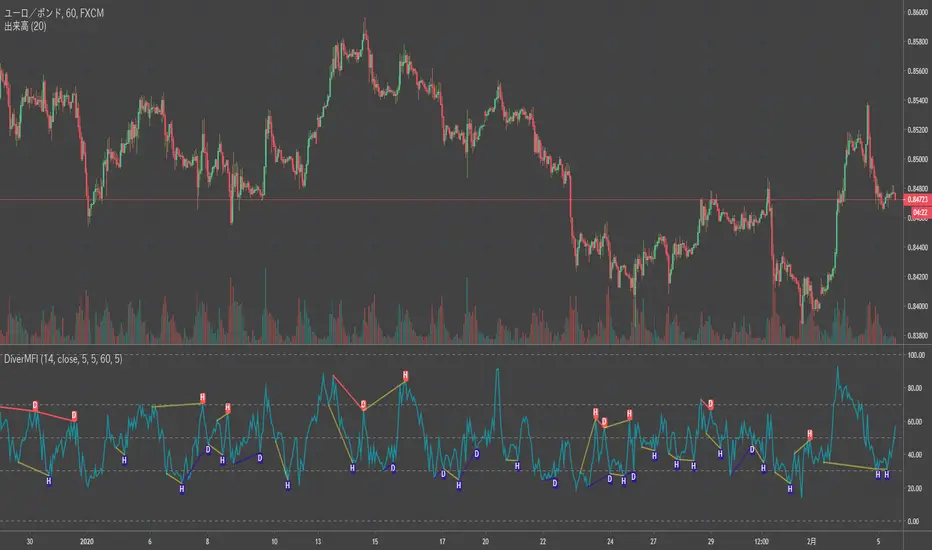
Divergence MFI[mado]Divergence screener for MFI
Regular Bullish: "D" navy label
Hidden Bullish: "H" navy label
Regular Bearish: "D" red label
Hidden Bearish: "H" red label
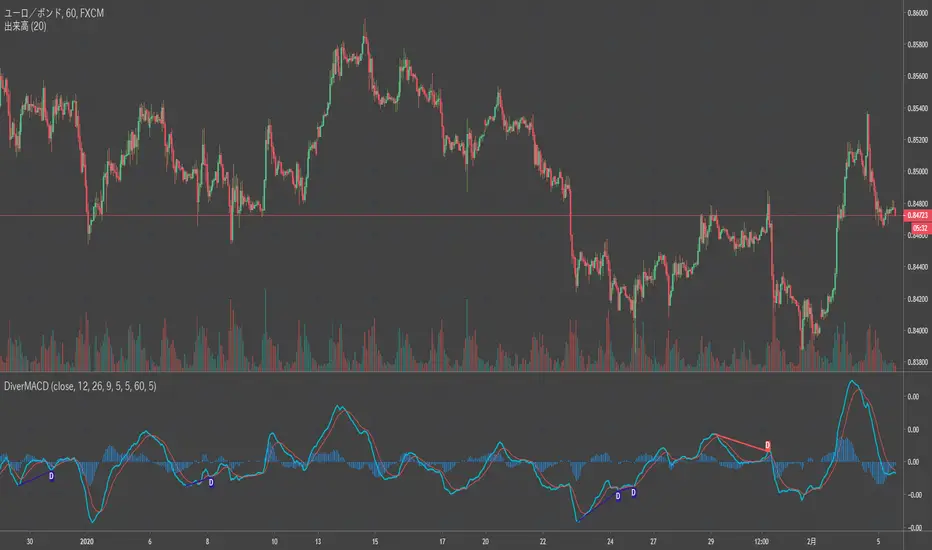
Divergence MACD [mado]Divergence screener for MACD
Regular Bullish: "D" navy label
Hidden Bullish: "H" navy label
Regular Bearish: "D" red label
Hidden Bearish: "H" red label
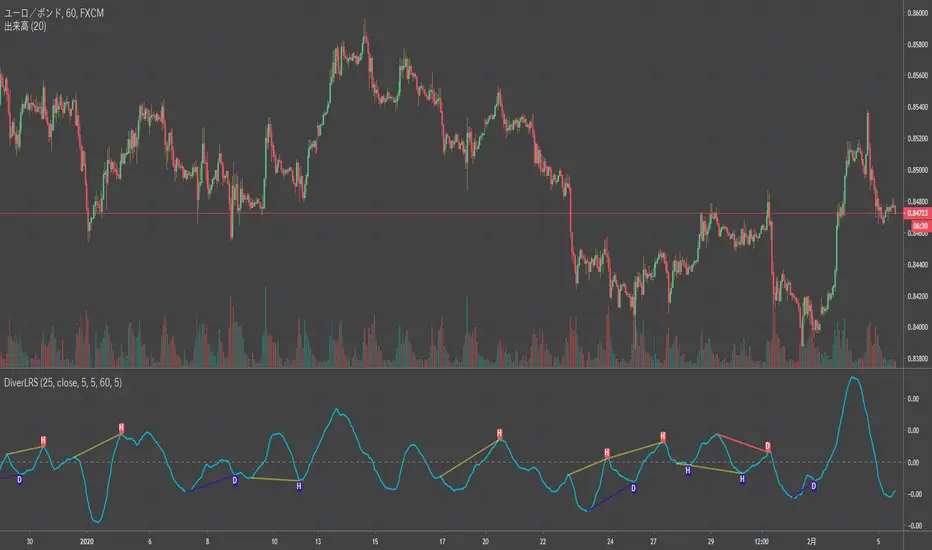
Divergence LinerRegressionSlope[mado]Divergence screener for LinerRegressionSlope
Regular Bullish: "D" navy label
Hidden Bullish: "H" navy label
Regular Bearish: "D" red label
Hidden Bearish: "H" red label
Divergence KlingerVolumeOscillator [mado]Divergence screener for KVO
Regular Bullish: "D" navy label
Hidden Bullish: "H" navy label
Regular Bearish: "D" red label
Hidden Bearish: "H" red label
Divergence CCI [mado]Divergence screener for CCI
Regular Bullish: "D" navy label
Hidden Bullish: "H" navy label
Regular Bearish: "D" red label
Hidden Bearish: "H" red label
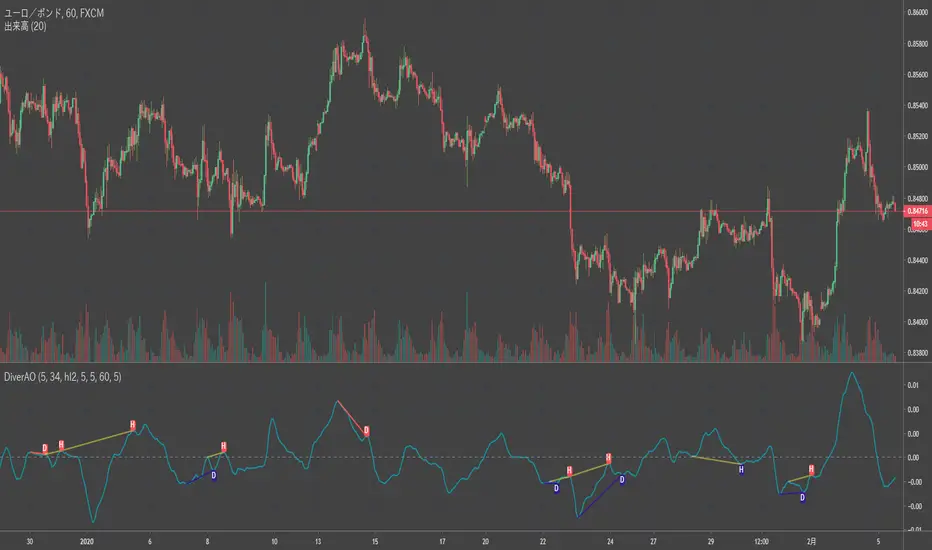
Divergence Awesome Oscillator [mado]Divergence screener for Awesome Oscillator
Regular Bullish: "D" navy label
Hidden Bullish: "H" navy label
Regular Bearish: "D" red label
Hidden Bearish: "H" red label
Elder impulse system with double exponential moving average dema
This version of impulse uses the double exponential moving average instead of the typical ema both to calculate macd and the moving slow and fast moving average that are plotted.
The impulse system :
The Impulse System combines two simple but powerful indicators.
One measures market inertia, the other its momentum. When both
point in the same direction, they identify an impulse worth following.
We get an entry signal when both indicators get in gear.
The Impulse System uses an exponential moving average to find
uptrends and downtrends. When the EMA rises, it shows that inertia
favors the bulls. When EMA falls, inertia works for the bears. The sec-
ond component is MACD-Histogram, an oscillator whose slope reflects
changes of power among bulls or bears. When MACD-Histogram rises,
it shows that bulls are becoming stronger. When it falls, it shows that
bears are growing stronger.
The Impulse System flags those bars where both the inertia and the
momentum point in the same direction. When both the EMA and
MACD-Histogram rise, they show that bulls are roaring and the uptrend
is accelerating.
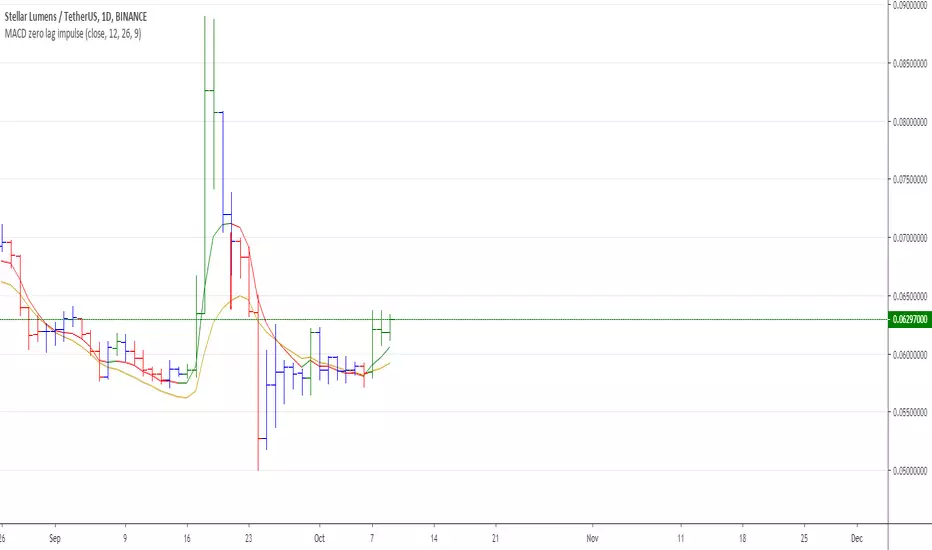
MACD Zero lag impulse systemThis version of impulse uses the double exponential moving average instead of the typical ema.
The impulse system :
The Impulse System combines two simple but powerful indicators.
One measures market inertia, the other its momentum. When both
point in the same direction, they identify an impulse worth following.
We get an entry signal when both indicators get in gear.
The Impulse System uses an exponential moving average to find
uptrends and downtrends. When the EMA rises, it shows that inertia
favors the bulls. When EMA falls, inertia works for the bears. The sec-
ond component is MACD-Histogram, an oscillator whose slope reflects
changes of power among bulls or bears. When MACD-Histogram rises,
it shows that bulls are becoming stronger. When it falls, it shows that
bears are growing stronger.
The Impulse System flags those bars where both the inertia and the
momentum point in the same direction. When both the EMA and
MACD-Histogram rise, they show that bulls are roaring and the uptrend
is accelerating.
Elder impulse system with barcolor + Safezone stops + emasThe impulse system :
The Impulse System combines two simple but powerful indicators.
One measures market inertia, the other its momentum. When both
point in the same direction, they identify an impulse worth following.
We get an entry signal when both indicators get in gear.
The Impulse System uses an exponential moving average to find
uptrends and downtrends. When the EMA rises, it shows that inertia
favors the bulls. When EMA falls, inertia works for the bears. The sec-
ond component is MACD-Histogram, an oscillator whose slope reflects
changes of power among bulls or bears. When MACD-Histogram rises,
it shows that bulls are becoming stronger. When it falls, it shows that
bears are growing stronger.
The Impulse System flags those bars where both the inertia and the
momentum point in the same direction. When both the EMA and
MACD-Histogram rise, they show that bulls are roaring and the uptrend
is accelerating.
The SafeZone Stop :
Once in a trade, where should you put your stop? This is one of the
hardest questions in technical analysis. After answering it, you’ll face
an even harder one—when and where to move that stop with the pas-
sage of time. Put a stop too close and it’ll get whacked by some mean-
ingless intraday swing. Put it too far, and you’ll have very skimpy
protection.
The Parabolic System, described in Trading for a Living, tried to
tackle this problem by moving stops closer to the market each day,
accelerating whenever a stock or a commodity reached a new extreme.
The trouble with Parabolic was that it kept moving even if the market
stayed flat and often got hit by meaningless noise.
SafeZone trails prices with stops tight enough to protect
capital but remote enough to keep clear of most random fluctuations.
Engineers design filters to suppress noise and allow the signal to come
through. If the trend is the signal, then the countertrend motion is the
noise. When the trend is up, we can define noise as that part of each
day’s range that protrudes below the previous day’s low. When the trend
is down, we can define noise as that part of each day’s range that pro-
trudes above the previous day’s high. SafeZone measures market noise
and places stops at a multiple of noise level away from the market.
We can make our lookback period 100 days or so if we want to aver-
age long-term market behavior.
SafeZone offers an original approach to placing stops. It monitors
changes in prices and adapts stops to the current levels of activity. It
places stops at individually tailored distances rather than at obvious
support and resistance levels.
Absolute Strength MTF IndicatorIntroduction
The non-signal version of the absolute strength indicator from fxcodebase.com requested by ernie76 . This indicator originally from mt4 aim to estimate the bullish/bearish force of the market by using various methods.
The Indicator
Two lines are plotted, a bull line (blue) representing the bullish/buying force and a bear one (red) representing the bearish/selling force, when the bull line is greater than the bear line the market is considered to be strongly bullish, else strongly bearish.
The indicator use various method, Rsi, stochastic, adx. The Rsi method is the one by default.
The stochastic method is less reactive but smoother
The Adx method is way different, while the other two methods make the bull and bear lines somewhat uncorrelated, the adx method focus more on the overall market strength than individual buyer/seller strength.
The smoothing method use 3 different filters, SMA, EMA and LSMA, LSMA is more reactive than the two previous one while EMA is just more computer efficient.
It is possible to use price data of different time frames for the calculation of the indicator.
Stochastic method with 4 hour price close as source.
Conclusion
A classic indicator who can be derived into a lot of ways using a more adaptive architecture or recursion. Hope you find it a use :)
A big thanks to ernie76 for the request and the support/testing of the indicator
Feel free to pm me for any request.
Ichimoku Kinko Hyo: Basic StrategyIchimoku Kinko Hyo: Basic Strategy
Entry/Exit orders are placed when three basic signals are triggered.
Ichimoku Signals:
1) Tenkan-Sen/Kijun-Sen Cross
Bullish: Tenkan-Sen is above the Kijun-Sen.
Bearish: Tenkan-Sen is below the Kijun-Sen.
2) Chikou-Span Cross
Bullish: Chikou-Span is above the close of 26 bars ago.
Bearish: Chikou-Span is below the close of 26 bars ago.
3) Price versus Kumo Cloud
Bullish: Close is above the Kumo Cloud.
Bearish: Close is below the Kumo Cloud.
Notes:
1) Long-only or short-only direction is feasible by checkbox. Stop and reverse strategy is taken by default.
2) Built-in Ichimoku indicator is strictly wrong because of counting one extra bar for all Ichimoku components.
Including the current bar like moving average is correct way in Japan. This problem is fixed in my script.
Smart Fear & Greed Index [MarkitTick]💡 This comprehensive technical tool is designed to quantify market sentiment on an asset-specific basis, translating complex price action into a singular, normalized gauge of "Fear" and "Greed." While traditional Fear & Greed indices rely on macro-economic data (like put/call ratios or junk bond demand) generally applied to the broad S&P 500, this script calculates a localized index for the specific chart you are viewing. It synthesizes Momentum, Volatility, Volume, and Price Positioning into a bounded 0-100 oscillator, aiming to identify psychological extremes where market reversals are statistically more likely to occur.
✨ Originality and Utility
● Asset-Specific Sentiment Analysis
Most sentiment tools are external to the chart (e.g., news sentiment or broad market indices). The Smart Fear & Greed Index is unique because it internalizes this logic, creating a bespoke psychological profile for any ticker—whether it is Crypto, Forex, or Stocks. It allows traders to see if *this specific asset* is overheated (Greed) or oversold (Fear) relative to its own recent history.
● The "Buy the Fear, Sell the Greed" Logic
The script employs a contrarian color-coding philosophy aligned with the famous investment adage: "Be fearful when others are greedy, and greedy when others are fearful."
When the indicator shows Fear (Low values), it colors the zone Green, signaling a potential buying opportunity (discount).
When the indicator shows Greed (High values), it colors the zone Red, signaling potential downside risk (premium).
● Integrated Divergence Detection
Unlike standard oscillators that leave interpretation entirely to the user, this tool includes an automated divergence engine. It detects discrepancies between the sentiment index and price action, plotting lines and labels to highlight potential exhaustion points before they become obvious on the price chart.
🔬 Methodology and Concepts
The calculation is driven by a custom User-Defined Type (UDT) called QuantEngine , which aggregates four distinct technical "pillars" to form the final Composite Index.
• Pillar 1: Momentum (RSI)
The engine utilizes the Relative Strength Index to measure the velocity and magnitude of directional price movements. High momentum contributes to the "Greed" score, while collapsing momentum contributes to "Fear."
• Pillar 2: Volatility (Inverted Normalized ATR)
This component interprets volatility through a psychological lens.
Low Volatility is interpreted as complacency or "Greed" (steady uptrends often have low vol).
High Volatility is interpreted as "Fear" (panic selling and erratic ranges often spike volatility).
The script normalizes the Average True Range (ATR) and inverts it so that stability adds to the score, and instability subtracts from it.
• Pillar 3: Volume Strength
Volume is analyzed relative to its moving average. However, raw volume isn't enough; the engine applies directional logic.
High relative volume on an Up-Close adds to the Greed score.
High relative volume on a Down-Close subtracts, adding to the Fear score.
• Pillar 4: Price Position (Stochastic)
This calculates where the current close sits relative to the recent High-Low range. Closing near the highs indicates confidence (Greed), while closing near the lows indicates pessimism (Fear).
• The Composite & Smoothing
These four metrics are averaged to create a raw composite, which is then smoothed via an Exponential Moving Average (EMA) to filter out noise and produce the final, readable "Smart Fear & Greed" line.
🎨 Visual Guide
● The Oscillator Line
This is the primary fluctuating line that moves between 0 and 100.
Values > 50 suggest positive sentiment.
Values < 50 suggest negative sentiment.
● Color-Coded Zones
The plot changes color dynamically to reflect the psychological state:
Red (70-100): Extreme Greed. The market may be irrationally exuberant.
Orange (60-70): Greed. Strong bullish conviction.
Yellow (40-60): Neutral. Indecisive or transitionary market.
Light Green (30-40): Fear. Sentiment is turning bearish.
Bright Green (0-30): Extreme Fear. Panic selling, often a precursor to a value bounce.
● Background Highlights
A semi-transparent Red Background appears when the index breaches 75, warning of a potential "Top."
A semi-transparent Green Background appears when the index drops below 25, highlighting a potential "Bottom."
● Divergence Elements
Red Lines/Labels ("Bear"): Bearish Divergence. Price makes a Higher High, but the Index makes a Lower High. This suggests momentum is waning despite rising prices.
Green Lines/Labels ("Bull"): Bullish Divergence. Price makes a Lower Low, but the Index makes a Higher Low. This suggests selling pressure is drying up.
📖 How to Use
• Identifying Reversals
Wait for the oscillator to enter "Extreme" zones. Do not trade immediately upon entry; wait for the line to exit the extreme zone to confirm the reversal. For example, if the line hits 80 (Red) and then crosses back down below 70, it signals that Greed is fading.
• Trend Continuation
In a strong trend, the indicator may hover in the Greed (Orange) or Fear (Light Green) zones for extended periods. In these cases, use the Neutral (Yellow) zone crosses as re-entry signals in the direction of the trend.
• Divergence Confirmation
Use the automated divergence lines as high-conviction triggers. If the background turns Green (Extreme Fear) AND a Bullish Divergence label appears, it provides a stronger technical case for a long position than the zone alone.
⚙️ Inputs and Settings
● Calculation Settings
Global Lookback Period (Default: 21): The core lookback window for RSI, ATR, Volume, and Stochastic calculations. Increasing this makes the index slower and less reactive; decreasing it makes it faster.
Smoothing Length (Default: 5): Determines how smooth the final line is. Higher numbers reduce "whipsaws" but add lag.
Color Main Chart Candles : Colors the chart bars based on Fear/Greed sentiment.
● Divergence Settings
Divergence Lookback (Default: 5): Determines the pivot strength required to register a high or low for divergence checks.
Show Divergence Lines/Labels: Toggles to hide visual clutter if you only want to see the oscillator.
🔍 Deconstruction of the Underlying Scientific and Academic Framework
● Normalization Theory
The core scientific principle here is Min-Max Normalization. The script takes heterogeneous data types—Price (Dollars/Cents), Volume (Shares/Contracts), and Volatility (Points)—and standardizes them into a unit-less distribution between 0 and 100. This allows for the summation of disparate market forces into a single vector.
● Mean Reversion and Oscillator Bounds
The indicator relies on the statistical concept of Mean Reversion. Markets, like elastic bands, can only stretch so far from their average valuation (represented by the 50 line) before snapping back. The "Extreme" zones (Upper and Lower deciles) represent areas of statistical improbability where the likelihood of a continuation decreases and the likelihood of a reversion increases.
● Divergence and Momentum Theory
The divergence logic is grounded in the principle that momentum precedes price. Mathematically, price is the integral of velocity. When the derivative (momentum/sentiment) approaches zero or reverses while the function (price) continues, it signals a non-sustainable anomaly in the data series, often resolved by a price correction.
⚠️ Disclaimer
All provided scripts and indicators are strictly for educational exploration and must not be interpreted as financial advice or a recommendation to execute trades. I expressly disclaim all liability for any financial losses or damages that may result, directly or indirectly, from the reliance on or application of these tools. Market participation carries inherent risk where past performance never guarantees future returns, leaving all investment decisions and due diligence solely at your own discretion.
Unreached Highs/Lows Oscillator [LuxAlgo]The Unreached Highs/Lows Oscillator highlights the amount of unreached high/low prices as a percentage over time, helping visualize trend strength and momentum from bullish and bearish market participants.
🔶 USAGE
This indicator measures the strength of directional price movements, helping traders visualize the strength of both the bullish and bearish market participants.
When prices are moving up with strength, the price structure will not come back to retest previous lows. Therefore, unreached lows keep adding up.
When prices are moving down with strength, they will not retest previous highs; therefore, unreached highs keep adding up.
As we can see on the chart, high readings of unreached highs (red) and low readings of unreached lows (green) are considered bearish, and a downtrend in price confirms this bias. Conversely, high readings of unreached lows and low readings of unreached highs are considered bullish. On the chart, this is reflected as an uptrend.
Additionally, the oscillator can reveal significant breakouts on the chart, with unreached highs or lows decreasing rapidly indicating that a large number of highs/lows have been reached.
Due to the oscillator being normalized, overbought and oversold levels are included.
In this gold chart, we have different examples of how to use the tool in conjunction with price behavior to understand the market. Let's dissect it step by step:
1. Uptrend: Bullish readings are above 80, and bearish readings are below 20. The market is trending up.
2. Range: Mixed readings around 50 for both bullish and bearish; the market is ranging.
3. Uptrend: The same as before. Bullish above 80 and bearish below 20.
4. Pullback: A bullish dip below 80 to 50 and a bearish reading below 20 indicates a pullback.
5. Range: Mixed readings. In this case, it is bullish above and below 80 and bearish above and below 20. The market is ranging.
6. Uptrend: Bullish above 80 and bearish below 20; the market keeps moving up.
7. Pullback: Bullish dips below 80 and bearish rises to 50 indicate a pullback.
8. Uptrend: As before, bullish is above 80 and bearish is below 20; the market is trending up.
This Bitcoin chart shows how to use extreme readings of 0 and 100 to detect potential reversals. When both readings are at extreme opposites, we set the threshold level at 100 and 0 instead of the default levels of 80 and 20 to better identify these areas.
As we can see, extreme readings at points 1 and 5 identify major reversals that lead to a change in trend. Extreme readings at points 2, 3, 4, and 6 identify minor reversals that do not lead to a change in trend.
From the settings panel, traders can adjust the length parameter. A smaller value measures smaller price movements, while a larger value measures larger price movements. A length value of 20 is used by default.
The chart shows how different values affect bullish and bearish measures.
🔶 SETTINGS
Length: Select the maximum number of highs and lows to be used.
🔹 Style
Bullish: Select a color for unreached lows.
Bearish: Select a color for unreached highs.
Top Threshold: Select the top threshold level and color. Enable the Auto feature to choose the default color.
Bottom Threshold: Select the bottom threshold level and color. Enable the Auto feature to choose the default color.
Order Blocks INDIBOT 3D | INDIBOT ABO SALTAN 11 //@version=6
indicator("Order Blocks INDIBOT 3D | INDIBOT ABO SALTAN ", overlay = true,
max_boxes_count = 500, max_labels_count = 500, max_lines_count = 500, max_polylines_count = 100, max_bars_back = 5000)
//#region CONSTANTS
// Core constants that control stored OB capacity and label size.
const int MAX_STORED_OBS = 50
const int retestSize = 4
//#endregion
//#region INPUTS
// Core user controls for OB behavior, volume delta, 3D style and alerts.
grpOB = "ORDER BLOCKS"
swingLen = input.int(5, "Swing Length", minval = 1, group = grpOB, inline = "sw", display = display.none)
bullObColor = input.color(color.new(color.teal, 55), "", group = grpOB, inline = "sw")
bearObColor = input.color(color.new(color.red, 55), "", group = grpOB, inline = "sw")
invMethod = input.string("Wick", "Invalidation", options = , group = grpOB, display = display.none)
showNearestX = input.int(3, "Show Nearest", minval = 1, maxval = 20, group = grpOB, display = display.none)
extendZones = input.int(10, "Extend Zones", minval = 0, group = grpOB,
tooltip = "This will extend the zones by X candles.", display = display.none)
showRetestLbl = input.bool(true, "Retest Labels", group = grpOB, inline = "tog")
hideInvalid = input.bool(true, "Hide Invalidated Zones", group = grpOB, inline = "tog")
grpVD = "VOLUME DELTA"
vdEnable = input.bool(true, "Enable", group = grpVD, inline = "vd")
vdBullColor = input.color(color.new(color.teal, 65), "", group = grpVD, inline = "vd")
vdBearColor = input.color(color.new(color.red, 65), "", group = grpVD, inline = "vd")
vd3D = input.bool(true, "3D", group = grpVD, inline = "3d", tooltip = "Adds 3D-style depth faces.") and vdEnable
vd3DDepth = input.int(5, "", group = grpVD, inline = "3d", minval = 1, maxval = 5, display = display.none)
displayStyle = input.string("Vertical", "Display Style", options = , group = grpVD,
tooltip = "Horizontal: split shown top/bottom.\nVertical: split shown left/right across the zone.", display = display.none)
vdTfIn = input.timeframe("", "Volume Delta Timeframe", group = grpVD,
tooltip = "Lower timeframe used to estimate delta")
showTotalVol = input.bool(true, "Display Total Volume", group = grpVD,
tooltip = "Displays total volume (Bull+Bear) from the active delta source.", inline = "vd2") and vdEnable
showDeltaPct = input.bool(true, "Show Delta %", group = grpVD, inline = "vd2",
tooltip = "Shows bullish vs bearish volume split.\nIf selected TF is lower than chart TF, uses LTF data; otherwise uses chart TF.") and vdEnable
vdTextColor = input.color(color.white, "", group = grpVD, inline = "vd2")
grpAL = "ALERTS"
alBullOB = input.bool(true, "Bullish Order Block", group = grpAL, inline = "oba")
alBearOB = input.bool(true, "Bearish Order Block", group = grpAL, inline = "oba")
alBullRetest = input.bool(true, "Bullish OB Retest", group = grpAL, inline = "obr")
alBearRetest = input.bool(true, "Bearish OB Retest", group = grpAL, inline = "obr")
//#endregion
//#region TYPES
// Custom structs for order blocks and 3D poly drawing.
type PolyParams
array points
color lineColor
color fillColor
int lineWidth
type ObRec
int leftIndex
int leftTime
int createdIndex
int createdTime
float top
float bottom
bool isBull
bool active
bool retested
int retestIndex
int retestTime
int invalidIndex
int invalidTime
float bullVol
float bearVol
float totalVol
float bullPct
float bearPct
bool hasDelta
type RetestRec
int barIndex
bool isBull
int obLeftIndex
int obCreatedIndex
//#endregion
//#region GENERIC HELPERS
// Small utilities: clearing drawings, geometry helpers, nearest-OB picking.
method clearAll(array bx, array pl, array lb) =>
if bx.size() > 0
for i = 0 to bx.size() - 1
bx.get(i).delete()
bx.clear()
if pl.size() > 0
for i = 0 to pl.size() - 1
pl.get(i).delete()
pl.clear()
if lb.size() > 0
for i = 0 to lb.size() - 1
lb.get(i).delete()
lb.clear()
// Builds a simple side face for 3D-style boxes using chart points.
method sideBox(array pts, int x, float btm, float top, float depthY, int widthX) =>
pts.unshift(chart.point.from_index(x, btm))
pts.unshift(chart.point.from_index(x + widthX, btm + depthY))
pts.unshift(chart.point.from_index(x + widthX, top + depthY))
pts.unshift(chart.point.from_index(x, top))
pts.unshift(chart.point.from_index(x, btm))
// Returns true if a candle's high/low intersects the OB zone.
touchesZone(float zTop, float zBot, float cHigh, float cLow) =>
cHigh >= zBot and cLow <= zTop
// Distance from price to zone in price units, used to rank nearest zones.
zoneDistance(float px, float zTop, float zBot) =>
px > zTop ? px - zTop : px < zBot ? zBot - px : 0.0
// Inserts a distance+index pair into a sorted list, capped at kMax.
method insertBest(array dists, array idxs, float dist, int idx, int kMax) =>
if dists.size() == 0
dists.push(dist)
idxs.push(idx)
else
int pos = dists.size()
if dists.size() > 0
for j = 0 to dists.size() - 1
if dist < dists.get(j)
pos := j
break
dists.insert(pos, dist)
idxs.insert(pos, idx)
while dists.size() > kMax
dists.pop()
idxs.pop()
// Picks the k nearest bull/bear OBs to current price (optionally including invalid).
pickNearest(array store, bool wantBull, int kMax, bool includeInvalid) =>
array dists = array.new_float()
array idxs = array.new_int()
if store.size() > 0
for i = 0 to store.size() - 1
ObRec ob = store.get(i)
if ob.isBull == wantBull
bool ok = includeInvalid ? true : ob.active
if ok
float dist = zoneDistance(close, ob.top, ob.bottom)
dists.insertBest(idxs, dist, i, kMax)
idxs
formatVol(float v) =>
str.tostring(v, format.volume)
//#endregion
//#region VOLUME ENGINE (CHART OR LOWER TF)
// Per-bar total / bull / bear volume
tfSec(string tf) =>
timeframe.in_seconds(tf)
int chartSec = tfSec(timeframe.period)
int srcSec = tfSec(vdTfIn)
bool useLtf = not na(chartSec) and not na(srcSec) and srcSec < chartSec
getBarVols() =>
float tot = na
float bull = na
float bear = na
if not useLtf or vdTfIn == ""
float v = volume
bool up = close > open
bool dn = close < open
tot := v
bull := up ? v : 0.0
bear := dn ? v : 0.0
else
array oArr = request.security_lower_tf(syminfo.tickerid, vdTfIn, open)
array cArr = request.security_lower_tf(syminfo.tickerid, vdTfIn, close)
array vArr = request.security_lower_tf(syminfo.tickerid, vdTfIn, volume)
float tSum = 0.0
float bSum = 0.0
float sSum = 0.0
int n = array.size(vArr)
if n > 0
for i = 0 to n - 1
float v2 = array.get(vArr, i)
float o2 = array.get(oArr, i)
float c2 = array.get(cArr, i)
tSum += v2
if c2 > o2
bSum += v2
else if c2 < o2
sSum += v2
tot := tSum
bull := bSum
bear := sSum
= getBarVols()
//#endregion
//#region POC ENGINE (MOST-TOUCHED PRICE + VOLUME)
// Finds a POC between swing and BOS, then aggregates volume.
findMostTouchedPrice(int fromIdx, int toIdx, int nBins) =>
int span = toIdx - fromIdx
if span <= 0 or na(fromIdx) or na(toIdx)
else
float minP = 1e10
float maxP = -1e10
for idx = fromIdx to toIdx
int rel = bar_index - idx
if rel >= 0
float lo = low
float hi = high
if not na(lo) and not na(hi)
if lo < minP
minP := lo
if hi > maxP
maxP := hi
if not (minP < maxP)
else
float step = (maxP - minP) / nBins
step := step <= 0 ? syminfo.mintick : step
array diffCnt = array.new_float(nBins, 0.0)
for idx = fromIdx to toIdx
int rel2 = bar_index - idx
if rel2 >= 0
float lo2 = low
float hi2 = high
if not na(lo2) and not na(hi2)
int sBin = int(math.floor((lo2 - minP) / step))
int eBin = int(math.floor((hi2 - minP) / step))
sBin := sBin < 0 ? 0 : sBin > nBins - 1 ? nBins - 1 : sBin
eBin := eBin < 0 ? 0 : eBin > nBins - 1 ? nBins - 1 : eBin
float cStart = diffCnt.get(sBin)
diffCnt.set(sBin, cStart + 1.0)
if eBin + 1 < nBins
float cEnd = diffCnt.get(eBin + 1)
diffCnt.set(eBin + 1, cEnd - 1.0)
int bestBin = 0
float bestCnt = 0.0
float runCnt = 0.0
for i = 0 to nBins - 1
runCnt += diffCnt.get(i)
if runCnt > bestCnt
bestCnt := runCnt
bestBin := i
float poc = minP + (bestBin + 0.5) * step
// Aggregates total / bull / bear volume at a single price level (POC) for a range.
volumeAtPrice(int fromIdx, int toIdx, float poc) =>
int touches = 0
float totVol = 0.0
float bullVol = 0.0
float bearVol = 0.0
int span = toIdx - fromIdx
if not na(poc) and span >= 0
for step = 0 to span
int idx = toIdx - step
int rel = bar_index - idx
if rel >= 0
float lo = low
float hi = high
if not na(lo) and not na(hi) and lo <= poc and hi >= poc
touches += 1
float vTot = barTotVol
float vBull = barBullVol
float vBear = barBearVol
if not na(vTot)
totVol += vTot
if not na(vBull)
bullVol += vBull
if not na(vBear)
bearVol += vBear
// Wrapper: find POC first, then compute volume at that POC for the BOS range.
calcMostTouchedPriceVol(int fromIdx, int toIdx, int nBins) =>
= findMostTouchedPrice(fromIdx, toIdx, nBins)
= volumeAtPrice(fromIdx, toIdx, poc)
//#endregion
//#region ORDER BLOCK ENGINE (POC-BASED)
// Detects swing highs/lows, confirms BOS, anchors OB at first POC touch.
var array obs = array.new()
var array obRetests = array.new()
var int lastBullRetestBar = na
var int lastBearRetestBar = na
var float shPrice = na
var int shIdx = na
var float slPrice = na
var int slIdx = na
bool evNewBullOB = false
bool evNewBearOB = false
bool evBullRetest = false
bool evBearRetest = false
float ph = ta.pivothigh(high, swingLen, swingLen)
float pl = ta.pivotlow(low, swingLen, swingLen)
if not na(ph)
shPrice := ph
shIdx := bar_index - swingLen
if not na(pl)
slPrice := pl
slIdx := bar_index - swingLen
bool bosBearNow = not na(slPrice) and bar_index > slIdx and close < slPrice and close >= slPrice
bool bosBullNow = not na(shPrice) and bar_index > shIdx and close > shPrice and close <= shPrice
bool bosBear = bosBearNow
bool bosBull = bosBullNow
// Precompute BOS ranges and POC stats in global scope
int bosIdxBear = bar_index - 1
int fromIdxBear = slIdx
int toIdxBear = bosIdxBear
= calcMostTouchedPriceVol(fromIdxBear, toIdxBear, 40)
int bosIdxBull = bar_index - 1
int fromIdxBull = shIdx
int toIdxBull = bosIdxBull
= calcMostTouchedPriceVol(fromIdxBull, toIdxBull, 40)
// Keeps OB array trimmed to recent history and limits max stored OBs.
pruneObs() =>
int minLeft = math.max(0, bar_index - 4999)
if obs.size() > 0
for i = obs.size() - 1 to 0
ObRec ob = obs.get(i)
if ob.leftIndex < minLeft
obs.remove(i)
while obs.size() > MAX_STORED_OBS
bool removed = false
if obs.size() > 0
for j = obs.size() - 1 to 0
ObRec ob2 = obs.get(j)
if not ob2.active
obs.remove(j)
removed := true
break
if not removed and obs.size() > 0
obs.pop()
// Creates and seeds an OB record using a POC-anchored candle and BOS volumes.
addObFromPoc(int baseIdx, float top, float bottom, bool isBull, float totSeed, float bullSeed, float bearSeed, int createdIdx) =>
int offLeft = bar_index - baseIdx
int offCreated = bar_index - createdIdx
int leftTime = time
int createdTm = time
float tot = totSeed
float bVol = bullSeed
float sVol = bearSeed
bool hasDelta = tot > 0.0
float bullPct = hasDelta ? math.round((bVol / tot) * 100.0) : 50.0
float bearPct = hasDelta ? 100.0 - bullPct : 50.0
obs.unshift(ObRec.new(baseIdx, leftTime, createdIdx, createdTm, top, bottom, isBull,
true, false, na, na, na, na, bVol, sVol, tot, bullPct, bearPct, hasDelta))
pruneObs()
// Returns true if a proposed zone overlaps any active OB
obOverlapsActive(float zoneTop, float zoneBottom) =>
float zTop = math.max(zoneTop, zoneBottom)
float zBot = math.min(zoneTop, zoneBottom)
bool overlaps = false
if obs.size() > 0
for i = 0 to obs.size() - 1
ObRec ob = obs.get(i)
if ob.active
float oTop = math.max(ob.top, ob.bottom)
float oBot = math.min(ob.top, ob.bottom)
bool rangeOverlap = zTop >= oBot and zBot <= oTop
if rangeOverlap
overlaps := true
break
overlaps
// Returns true if there is a price gap between anchorIdx and bosIdx.
hasGapBetween(int anchorIdx, int bosIdx, bool isBull) =>
bool gap = false
int fromIdx = math.min(anchorIdx, bosIdx)
int toIdx = math.max(anchorIdx, bosIdx)
if toIdx - fromIdx >= 1
for absIdx = fromIdx + 1 to toIdx
int relNow = bar_index - absIdx
int relPrev = relNow + 1
if relNow >= 0 and relPrev >= 0
float hiPrev = high
float loPrev = low
float hiNow = high
float loNow = low
if not na(hiPrev) and not na(loPrev) and not na(hiNow) and not na(loNow)
if isBull
if loNow > hiPrev
gap := true
break
else
if hiNow < loPrev
gap := true
break
gap
// Bearish BOS → Bearish OB
if bosBear
int bosIdx = bosIdxBear
int fromIdx = fromIdxBear
int toIdx = toIdxBear
if not na(pocB) and touchesB > 0 and not na(fromIdx) and not na(toIdx)
int spanB = toIdx - fromIdx
int bestIdx = na
float runMaxHigh = na
if spanB >= 0
for step = 0 to spanB
int idx = toIdx - step
int rel = bar_index - idx
if rel >= 0
float lo = low
float hi = high
if not na(lo) and not na(hi)
runMaxHigh := na(runMaxHigh) ? hi : math.max(runMaxHigh, hi)
bool touches = lo <= pocB and hi >= pocB
if touches and hi == runMaxHigh
bestIdx := idx
bool gapLeg = not na(bestIdx) ? hasGapBetween(bestIdx, bosIdx, false) : false
if not na(bestIdx) and not gapLeg
int relBest = bar_index - bestIdx
float top = high
float bottom = low
if not obOverlapsActive(top, bottom)
addObFromPoc(bestIdx, top, bottom, false, totVolB, bullVolB, bearVolB, bosIdx)
evNewBearOB := true
slPrice := na
slIdx := na
// Bullish BOS → Bullish OB
if bosBull
int bosIdx2 = bosIdxBull
int fromIdx2 = fromIdxBull
int toIdx2 = toIdxBull
if not na(pocH) and touchesH > 0 and not na(fromIdx2) and not na(toIdx2)
int spanH = toIdx2 - fromIdx2
int bestIdx2 = na
float runMinLow = na
if spanH >= 0
for step = 0 to spanH
int idx2 = toIdx2 - step
int rel2 = bar_index - idx2
if rel2 >= 0
float lo2 = low
float hi2 = high
if not na(lo2) and not na(hi2)
runMinLow := na(runMinLow) ? lo2 : math.min(runMinLow, lo2)
bool touches = lo2 <= pocH and hi2 >= pocH
if touches and lo2 == runMinLow
bestIdx2 := idx2
bool gapLeg2 = not na(bestIdx2) ? hasGapBetween(bestIdx2, bosIdx2, true) : false
if not na(bestIdx2) and not gapLeg2
int relBest2 = bar_index - bestIdx2
float top2 = high
float bottom2 = low
if not obOverlapsActive(top2, bottom2)
addObFromPoc(bestIdx2, top2, bottom2, true, totVolH, bullVolH, bearVolH, bosIdx2)
evNewBullOB := true
shPrice := na
shIdx := na
// Invalidation and retest detection for existing OBs.
if obs.size() > 0
for i = 0 to obs.size() - 1
ObRec ob = obs.get(i)
if ob.active
bool invalid = false
int invIdx = na
int invTime = na
if ob.isBull
if invMethod == "Wick"
invalid := low < ob.bottom
invIdx := bar_index
invTime := time
else
if bar_index > 0
invalid := close < ob.bottom
invIdx := bar_index - 1
invTime := time
else
if invMethod == "Wick"
invalid := high > ob.top
invIdx := bar_index
invTime := time
else
if bar_index > 0
invalid := close > ob.top
invIdx := bar_index - 1
invTime := time
if invalid
ob.active := false
ob.invalidIndex := invIdx
ob.invalidTime := invTime
bool retestPrev = false
int retestBar = na
int retestTm = na
if bar_index > 0
if ob.isBull
bool opensAbovePrev = open > ob.top
bool closesAbovePrev = close > ob.top
bool wickTouchesPrev = low <= ob.top and low >= ob.bottom
retestPrev := opensAbovePrev and closesAbovePrev and wickTouchesPrev
else
bool opensBelowPrev = open < ob.bottom
bool closesBelowPrev = close < ob.bottom
bool wickTouchesPrev = high >= ob.bottom and high <= ob.top
retestPrev := opensBelowPrev and closesBelowPrev and wickTouchesPrev
if retestPrev
retestBar := bar_index - 1
retestTm := time
if retestPrev and not na(retestBar) and retestBar > ob.createdIndex
ob.retested := true
ob.retestIndex := retestBar
ob.retestTime := retestTm
int lastSideBar = ob.isBull ? lastBullRetestBar : lastBearRetestBar
bool canLog = na(lastSideBar) or retestBar - lastSideBar >= 4
if canLog
obRetests.unshift(RetestRec.new(retestBar, ob.isBull, ob.leftIndex, ob.createdIndex))
if ob.isBull
evBullRetest := true
lastBullRetestBar := retestBar
else
evBearRetest := true
lastBearRetestBar := retestBar
obs.set(i, ob)
//#endregion
//#region DRAW ENGINE (ZONES + VOLUME + 3D)
// Handles all boxes, polylines and labels for OBs and 3D faces.
bool showVD = vdEnable
bool isVert = displayStyle == "Vertical"
bool isHorz = not isVert
float dayAtr = ta.atr(14)
var array allBoxes = array.new()
var array allPolys = array.new()
var array allLabels = array.new()
drawPoly(PolyParams pp) =>
if not na(pp) and not na(pp.points) and pp.points.size() > 0
allPolys.unshift(polyline.new(points = pp.points, line_color = pp.lineColor, fill_color = pp.fillColor))
method pushBox(array store, box b) =>
store.unshift(b)
method pushLabel(array store, label l) =>
store.unshift(l)
// Chooses base colors for OB zones depending on vdEnable and bull/bear type.
obColors(ObRec ob) =>
color bullCol = vdEnable ? vdBullColor : bullObColor
color bearCol = vdEnable ? vdBearColor : bearObColor
color baseCol = ob.isBull ? bullCol : bearCol
color faded = ob.active ? baseCol : color.new(baseCol, 85)
// Computes right-most bar index for drawing an OB, considering extension and invalidation.
obRightIndex(ObRec ob) =>
int activeRight = bar_index + extendZones
if ob.active
activeRight
else
na(ob.invalidIndex) ? activeRight : ob.invalidIndex
// Draws the main OB zone box on the chart.
drawObZoneBox(ObRec ob, color faded) =>
int xR = obRightIndex(ob)
int xL = ob.leftIndex
int minBar = bar_index - 4999
if xL < minBar
xL := minBar
xR := math.max(xR, xL)
box bx = box.new(left = xL, right = xR, top = ob.top, bottom = ob.bottom, xloc = xloc.bar_index, bgcolor = faded, border_color = na, border_width = 0)
allBoxes.pushBox(bx)
// Draws a retest marker (triangle) when price revisits an OB.
drawRetestLabels(array bullAct, array bearAct, array bullInv, array bearInv) =>
int ret = 0
if showRetestLbl and obRetests.size() > 0
int minBar = bar_index - 4999
int lastBullLbl = na
int lastBearLbl = na
for i = obRetests.size() - 1 to 0
RetestRec r = obRetests.get(i)
if r.barIndex < minBar or r.barIndex > bar_index
RetestRec _trash = obRetests.remove(i)
else
bool hasDisplayedParent = false
if r.isBull
if bullAct.size() > 0
for j = 0 to bullAct.size() - 1
ObRec ob = obs.get(bullAct.get(j))
if ob.leftIndex == r.obLeftIndex and ob.createdIndex == r.obCreatedIndex
hasDisplayedParent := true
break
if not hasDisplayedParent and not hideInvalid and bullInv.size() > 0
for j = 0 to bullInv.size() - 1
ObRec ob = obs.get(bullInv.get(j))
if ob.leftIndex == r.obLeftIndex and ob.createdIndex == r.obCreatedIndex
hasDisplayedParent := true
break
else
if bearAct.size() > 0
for j = 0 to bearAct.size() - 1
ObRec ob = obs.get(bearAct.get(j))
if ob.leftIndex == r.obLeftIndex and ob.createdIndex == r.obCreatedIndex
hasDisplayedParent := true
break
if not hasDisplayedParent and not hideInvalid and bearInv.size() > 0
for j = 0 to bearInv.size() - 1
ObRec ob = obs.get(bearInv.get(j))
if ob.leftIndex == r.obLeftIndex and ob.createdIndex == r.obCreatedIndex
hasDisplayedParent := true
break
if not hasDisplayedParent
continue
int age = bar_index - r.barIndex
if age >= 0 and age <= 4999
if r.isBull
if not na(lastBullLbl) and r.barIndex - lastBullLbl < 3
continue
lastBullLbl := r.barIndex
else
if not na(lastBearLbl) and r.barIndex - lastBearLbl < 3
continue
lastBearLbl := r.barIndex
float yPrice = close
color baseCol = r.isBull ? bullObColor : bearObColor
st = r.isBull ? label.style_triangleup : label.style_triangledown
yl = r.isBull ? yloc.belowbar : yloc.abovebar
label newLbl = label.new(r.barIndex, yPrice, "", xloc = xloc.bar_index, yloc = yl, style = st,
color = color.new(baseCol, 0), textcolor = color.new(baseCol, 0), size = retestSize, force_overlay = true)
allLabels.pushLabel(newLbl)
ret
// Returns geometry used for volume overlay and 3D top view.
obGeom(ObRec ob) =>
int rawL = ob.leftIndex
int rawR = obRightIndex(ob)
int minBar = bar_index - 4999
int xL = math.max(rawL, minBar)
int xR = math.max(rawR, xL)
int widthX = vd3DDepth
int xR2 = xR + widthX
float yT = ob.top
float yB = ob.bottom
float h = yT - yB
// Converts bull/bear percentages into display strings (if enabled).
deltaTexts(float bullPct, float bearPct) =>
string bullTxt = showDeltaPct ? str.tostring(bullPct) + "%" : ""
string bearTxt = showDeltaPct ? str.tostring(bearPct) + "%" : ""
// Draws a text label with total volume on the right-bottom corner of the OB.
drawTotalVolLabel(int xL, int xR, float yT, float yB, float h, float total) =>
if showTotalVol
int cx = xR - 1
if cx < xL
cx := xL
float cy = yB + h * 0.25
string txt = formatVol(total)
label lb = label.new(cx, cy, txt, xloc = xloc.bar_index, style = label.style_label_right,
textcolor = vdTextColor, color = #ffffff00, size = size.small, force_overlay = true)
allLabels.pushLabel(lb)
// Fills the OB with bull/bear split either vertically or horizontally.
drawDeltaFills(int xL, int xR, float yT, float yB, float h, float bullPct, string bullTxt, string bearTxt) =>
color bullCol = vdEnable ? vdBullColor : bullObColor
color bearCol = vdEnable ? vdBearColor : bearObColor
if isVert
int splitX = xL + int((xR - xL) * (bullPct / 100.0))
splitX := xR - xL >= 2 ? math.max(xL + 1, math.min(xR - 1, splitX)) : xL
box bBull = box.new(xL, yT, splitX, yB, xloc = xloc.bar_index, bgcolor = bullCol, border_width = 0, text = bullTxt, text_color = vdTextColor, text_size = size.small)
box bBear = box.new(splitX, yT, xR, yB, xloc = xloc.bar_index, bgcolor = bearCol, border_width = 0, text = bearTxt, text_color = vdTextColor, text_size = size.small)
allBoxes.pushBox(bBull)
allBoxes.pushBox(bBear)
else
float midY = yB + h * (bullPct / 100.0)
box bBull = box.new(xL, midY, xR, yB, xloc = xloc.bar_index, bgcolor = bullCol, border_width = 0, text = bullTxt, text_color = vdTextColor, text_size = size.small)
box bBear = box.new(xL, yT, xR, midY, xloc = xloc.bar_index, bgcolor = bearCol, border_width = 0, text = bearTxt, text_color = vdTextColor, text_size = size.small)
allBoxes.pushBox(bBull)
allBoxes.pushBox(bBear)
// Track first visible bar index for 3D top face clipping.
var int leftVisIdx = na
if na(leftVisIdx) and time >= chart.left_visible_bar_time
leftVisIdx := bar_index
// Draws the 3D front faces and top faces based on bull/bear split and style.
drawDelta3D(int xL, int xR, int widthX, int xR2, float yT, float yB, float h, float bullPct) =>
color bullCol = vdEnable ? vdBullColor : bullObColor
color bearCol = vdEnable ? vdBearColor : bearObColor
float depthY = dayAtr * (0.1 * vd3DDepth)
int visibleLeft = na(leftVisIdx) ? xL : math.max(xL, leftVisIdx)
int visibleRight = xR
if isHorz
float midY = yB + h * (bullPct / 100.0)
if bullPct > 0
array ptsFrontBull = array.new()
ptsFrontBull.sideBox(xR, yB, midY, depthY, widthX)
drawPoly(PolyParams.new(ptsFrontBull, color.new(chart.fg_color, 90), color.new(bullCol, 70), 1))
if bullPct < 100
array ptsFrontBear = array.new()
ptsFrontBear.sideBox(xR, midY, yT, depthY, widthX)
drawPoly(PolyParams.new(ptsFrontBear, color.new(chart.fg_color, 90), color.new(bearCol, 70), 1))
if visibleRight > visibleLeft
array ptsTop = array.new()
ptsTop.unshift(chart.point.from_index(visibleRight + widthX, yT + depthY))
ptsTop.unshift(chart.point.from_index(visibleLeft + widthX, yT + depthY))
ptsTop.unshift(chart.point.from_index(visibleLeft, yT))
ptsTop.unshift(chart.point.from_index(visibleRight, yT))
ptsTop.unshift(chart.point.from_index(visibleRight + widthX, yT + depthY))
drawPoly(PolyParams.new(ptsTop, color.new(chart.fg_color, 90), color.new(bearCol, 70), 1))
else
array ptsFront = array.new()
ptsFront.sideBox(xR, yB, yT, depthY, widthX)
drawPoly(PolyParams.new(ptsFront, color.new(chart.fg_color, 90), color.new(bearCol, 70), 1))
if visibleRight > visibleLeft
float frac = bullPct / 100.0
int bullRight = visibleLeft + int((visibleRight - visibleLeft) * frac)
bullRight := math.max(visibleLeft, math.min(visibleRight, bullRight))
if bullPct > 0 and bullRight > visibleLeft
array ptsTopBull = array.new()
ptsTopBull.unshift(chart.point.from_index(bullRight + widthX, yT + depthY))
ptsTopBull.unshift(chart.point.from_index(visibleLeft + widthX, yT + depthY))
ptsTopBull.unshift(chart.point.from_index(visibleLeft, yT))
ptsTopBull.unshift(chart.point.from_index(bullRight, yT))
ptsTopBull.unshift(chart.point.from_index(bullRight + widthX, yT + depthY))
drawPoly(PolyParams.new(ptsTopBull, color.new(chart.fg_color, 90), color.new(bullCol, 70), 1))
if bullPct < 100 and visibleRight > bullRight
array ptsTopBear = array.new()
ptsTopBear.unshift(chart.point.from_index(visibleRight + widthX, yT + depthY))
ptsTopBear.unshift(chart.point.from_index(bullRight + widthX, yT + depthY))
ptsTopBear.unshift(chart.point.from_index(bullRight, yT))
ptsTopBear.unshift(chart.point.from_index(visibleRight, yT))
ptsTopBear.unshift(chart.point.from_index(visibleRight + widthX, yT + depthY))
drawPoly(PolyParams.new(ptsTopBear, color.new(chart.fg_color, 90), color.new(bearCol, 70), 1))
// Draws a full OB: zone, retest label, volume fill and 3D faces.
drawZoneAndVolume(ObRec ob) =>
= obColors(ob)
drawObZoneBox(ob, faded)
if showVD and ob.hasDelta
= obGeom(ob)
= deltaTexts(ob.bullPct, ob.bearPct)
drawTotalVolLabel(xL, xR, yT, yB, h, ob.totalVol)
drawDeltaFills(xL, xR, yT, yB, h, ob.bullPct, bullTxt, bearTxt)
if vd3D
drawDelta3D(xL, xR, widthX, xR2, yT, yB, h, ob.bullPct)
true
// Clear all previous drawings each bar before re-rendering current selection.
allBoxes.clearAll(allPolys, allLabels)
// Pick active and invalid OBs based on hideInvalid + showNearestX.
array bullActive = array.new_int()
array bearActive = array.new_int()
array bullInvalid = array.new_int()
array bearInvalid = array.new_int()
if hideInvalid
bullActive := pickNearest(obs, true, showNearestX, false)
bearActive := pickNearest(obs, false, showNearestX, false)
else
bullActive := pickNearest(obs, true, showNearestX, false)
bearActive := pickNearest(obs, false, showNearestX, false)
if obs.size() > 0
for i = 0 to obs.size() - 1
ObRec o = obs.get(i)
if not o.active
if o.isBull
bullInvalid.push(i)
else
bearInvalid.push(i)
if bearInvalid.size() > 0 and not hideInvalid
for i = 0 to bearInvalid.size() - 1
ObRec ob = obs.get(bearInvalid.get(i))
drawZoneAndVolume(ob)
if bearActive.size() > 0
for i = 0 to bearActive.size() - 1
ObRec ob = obs.get(bearActive.get(i))
drawZoneAndVolume(ob)
if bullInvalid.size() > 0 and not hideInvalid
for i = 0 to bullInvalid.size() - 1
ObRec ob = obs.get(bullInvalid.get(i))
drawZoneAndVolume(ob)
if bullActive.size() > 0
for i = 0 to bullActive.size() - 1
ObRec ob = obs.get(bullActive.get(i))
drawZoneAndVolume(ob)
// Draw all stored retest events on top of zones
drawRetestLabels(bullActive, bearActive, bullInvalid, bearInvalid)
//#endregion
//#region ALERTS
alertcondition(alBullOB and evNewBullOB, "Bullish Order Block", "New Bullish Order Block detected.")
alertcondition(alBearOB and evNewBearOB, "Bearish Order Block", "Bearish Order Block detected.")
alertcondition(alBullRetest and evBullRetest, "Bullish OB Retest", "Bullish Order Block retest.")
alertcondition(alBearRetest and evBearRetest, "Bearish OB Retest", "Bearish Order Block retest.")
if alBullOB and evNewBullOB
alert("Bullish Order Block detected.", alert.freq_once_per_bar)
if alBearOB and evNewBearOB
alert("Bearish Order Block detected.", alert.freq_once_per_bar)
if alBullRetest and evBullRetest
alert("Bullish Order Block retest.", alert.freq_once_per_bar)
if alBearRetest and evBearRetest
alert("Bearish Order Block retest.", alert.freq_once_per_bar)
// ==========================================================================================
// === Dashboard with Telegram Link ===
var table myTable = table.new(position.top_center, 1, 1, border_width=1, frame_color=color.black, bgcolor=color.white)
// Add Telegram Message to Dashboard
table.cell(myTable, 0, 0, "Join Telegram @STRATEGY INDIBOT", bgcolor=color.blue, text_color=color.white, text_size=size.normal)
ChannellerChanneller Pro - Multi-Pivot Regression Channels with Trend Validation
What This Indicator Does
Channeller Pro automatically detects and draws price channels by connecting multiple pivot points using linear regression rather than simply connecting two points. The indicator displays parallel support and resistance lines that define the current trend channel, along with an optional mid-line for mean reversion analysis.
Channels automatically appear when valid trend conditions are met and disappear when the trend structure breaks, keeping your chart clean and showing only actionable information.
---
How It Works (Methodology)
1. Multi-Pivot Linear Regression
Unlike simple channel indicators that connect only 2 pivot points, this indicator collects 3-5 pivot lows (for bullish channels) or pivot highs (for bearish channels) and calculates a least-squares linear regression line through them. This produces a statistically best-fit trendline that is more resistant to noise from a single errant pivot.
The regression calculation outputs:
- Slope: The angle/direction of the trend
- Intercept: The starting price level
- R² (coefficient of determination): A value from 0 to 1 measuring how well the pivot points align. Higher R² means the pivots form a cleaner, more reliable trendline. The default minimum is 0.70.
2. Higher-Low / Lower-High Pattern Validation
For a bullish channel to form, the indicator requires each successive pivot low to be higher than the previous pivot low (the definition of an uptrend). For bearish channels, each pivot high must be lower than the previous (downtrend structure). This filter prevents channels from forming during choppy, non-trending conditions.
3. ADX Trend Strength Filter
The indicator calculates the Average Directional Index (ADX) to measure trend strength. Channels only appear when ADX exceeds a user-defined threshold (default: 20). When ADX drops below this level, indicating the trend has weakened, channels automatically disappear. This prevents false channels during sideways/ranging markets.
4. Channel Width Calculation
Once the regression support line is established, the indicator finds the highest high (for bull channels) or lowest low (for bear channels) between the first and last pivot. A parallel line is drawn at this distance to form the opposite channel boundary.
5. Channel Respect Monitoring
The indicator tracks how price interacts with channel boundaries:
- Bounces: Price touches the boundary and reverses
- Pierces: Price closes beyond the boundary
If price pierces through a channel boundary multiple times, the channel is invalidated and removed, signaling the trend structure has broken.
---
How to Use This Indicator
Identifying Trends
- A green channel (bullish) indicates an uptrend with higher lows
- A red channel (bearish) indicates a downtrend with lower highs
- The R² value in the label shows channel quality (higher = more reliable)
Trading Applications
- Trend Following: Trade in the direction of the channel slope
- Support/Resistance: Use channel boundaries as potential reaction zones
- Mean Reversion: The optional mid-line (dashed) can serve as a target for pullback entries
- Breakout Preparation: When a channel disappears, it signals the prior trend structure has ended
Reading the Labels
- "BULL R²:0.85 (4 pivots)" means a bullish channel with 85% regression fit using 4 pivot points
- Orange-colored labels indicate weaker channels (R² between 0.70-0.85)
- Green/red labels indicate stronger channels (R² above 0.85)
---
Input Settings Explained
| Setting | Description |
|---------|-------------|
| Pivot Lookback Left/Right | Bars required on each side to confirm a pivot high/low |
| Min Pivots for Channel | Minimum pivot points required (more = stricter) |
| Max Pivots to Track | Maximum pivots stored (older pivots are dropped) |
| Min R² Score | Minimum regression quality (0.70 = 70% fit) |
| ADX Threshold | Minimum ADX value to show channels (20 = moderate trend) |
| Require HL/LH Pattern | Enforce higher-lows for bull, lower-highs for bear |
---
What Makes This Different
This indicator combines multiple validation layers that work together:
1. Regression vs. 2-point lines: More statistically robust trendlines
2. R² quality scoring: Quantifies how clean the trend structure is
3. Pattern validation: Ensures proper trend structure (HL/LH)
4. ADX filtering: Confirms trend exists before drawing channels
5. Auto-invalidation: Channels disappear when broken, not manually
These components create a self-cleaning channel system that only displays high-probability trend channels.
---
Alerts Available
- Bull/Bear Channel Formed
- Bull/Bear Channel Broken
- New Pivot High/Low Detected
SWING ATR BasedWhat does this indicator do?
1. It identifies Market Swings The script monitors price action to detect when a trend changes direction.
It uses ATR (Average True Range) to measure volatility, ensuring it doesn't get tricked by small, insignificant price movements.
To validate a change in direction (from bullish to bearish, or vice versa), it waits for the price to cover a specific distance (defined by the kRange parameter) and requires at least two significant candles.
2. It plots Support and Resistance zones As soon as a new high or low point is confirmed:
In Green (Bull): It draws a support line at the level of the last low.
In Red (Bear): It draws a resistance line at the level of the last high.
Auto-Cleaning: If the price breaks through a support line, the line turns gray and stops. The script only keeps active (unbroken) levels on the screen.
3. It calculates an "SGE Score" (Market State) This is the "brain" of the script. It assigns a rating to the current trend:
+2 (Bullish): The price has broken a resistance.
-2 (Bearish): The price has broken a support.
0 (Neutral): The market is indecisive (for example, after a break that contradicts the previous one).
Key Feature: This score has a "one-candle delay." It waits for the next candle to close before confirming a score change, which helps avoid reacting too quickly to false alerts.
4. It simplifies visual reading To keep your chart clean and readable:
It only highlights the 3 levels closest to the current price (those most likely to be hit soon).
It colors the chart candles directly: Green if the score is +2, Red if the score is -2, and Gray if it is neutral.
5. Dashboard In the top-right corner of your screen, it displays a permanent summary:
The current score (-2, 0, or 2).
The number of active supports and resistances.
Summary: This is a "smart" trend detector. Instead of just looking at whether the price is going up or down, it waits for the price to break important structural levels (confirmed by volatility) to tell you: "Caution, the structure has just shifted from bullish to bearish."
Recommended Settings:
kRange: 1.3 / 1.4
ATR Mult: 0.3 to 0.5
Script created with Claude AI.
HTB Reversal Pattern - RSI DivergenceHow this Script Works
Pivot Points: The script looks for "peaks" and "valleys" in the RSI indicator.
Divergence Logic: * Bullish: If the current price low is lower than the previous low, but the RSI low is higher than the previous RSI low, it indicates the selling pressure is fading despite the price drop.
Bearish: If the current price high is higher than the previous high, but the RSI high is lower than the previous RSI high, it suggests buying momentum is weakening.
The "Lookback" Offset: Because pivot points require a few bars to the right to be confirmed (defined by lbR), the labels will appear on the chart with a small delay (default is 5 bars). This is necessary to prevent "repainting" (signals that disappear after they appear).
Liquidity Zones | NRP | ProjectSyndicate🏦 ProjectSyndicate Liquidity Zones 1.0 — Complete Documentation
Specifically built for: XAUUSD (Gold) 🥇, NQ 💻, ES 📈 and FX 💱 traders
✅Default settings: tuned to work well across multiple timeframes
Best sweet spot timeframes : M5 / M15 / M30 / H1 → consistently produces high-quality zones
________________________________________
🌍 Overview
ProjectSyndicate Liquidity Zones is a Pine Script v6 indicator built to identify stop-loss hunting zones and liquidity pockets—areas where price frequently sweeps retail stops and then reverses.
It automatically detects and draws zones where institutional flow often triggers liquidity before moving price in the opposite direction.
________________________________________
💧 What Are Liquidity Zones?
Liquidity zones are price levels where stop-loss orders cluster (often around swing highs/lows). Large players may push price into these levels to trigger stops (liquidity sweep) and then reverse.
Also known as:
• 🪤 Stop-loss hunting
• 🌊 Liquidity sweeps
• 🎯 Stop runs
________________________________________
🥇 Why Gold, NQ, ES & FX?
These markets often show repeatable liquidity behavior because of:
• 👥 Heavy participation and predictable stop placement
• 🏛️ Strong institutional activity and order flow
• ⚡ Volatility that enables fast “sweep & reverse” moves
• 📍 Clear technical levels where stops tend to cluster
________________________________________
⚙️ How It Works (3 Detection Engines)
1) 🔺 Pivot-Based Detection
Finds swing highs/lows using fractal pivots—natural stop placement zones.
2) 🕯️ Wick Trap Detection
Flags candles with dominant wicks (long rejection shadows), suggesting stops were hit then price snapped back.
3) 📊 Volume Spike Detection
Marks extremes where volume is elevated (local highs/lows). High volume at extremes often signals liquidity being triggered.
________________________________________
🧩 Zone Types
🟦 Bull Liquidity Zones (Teal/Cyan)
• 📍 Below current price (support area)
• 🧠 Indicates buy-side stops were swept (longs got hunted)
• 📈 Often becomes a potential reversal zone upward
• ✅ Idea: Look for bullish confirmation after a sweep
🟥 Bear Liquidity Zones (Maroon/Red)
• 📍 Above current price (resistance area)
• 🧠 Indicates sell-side stops were swept (shorts got hunted)
• 📉 Often becomes a potential reversal zone downward
• ✅ Idea: Look for bearish confirmation after a sweep
⚪ Historic Zones (Gray)
• 🕰️ Zones that were breached
• 📚 Useful for studying past behavior and sweep patterns
• ❗ Not considered “active”, but great for context
________________________________________
🛠️ Settings Guide
🔎 Detection Settings
🔺 Pivot Detection Length (Default: 10)
• Range: 3 → 50
• Controls swing sensitivity
• Lower (5–8): more zones, faster, noisier ⚡
• Higher (15–20): fewer zones, stronger, cleaner ✅
Recommended (XAUUSD / NQ / ES / FX):
• ⏱️ M5 / M15: 8–10
• ⏱️ M30: 10–12
• ⏱️ H1: 12–15
🕯️ Wick Dominance Ratio (Default: 0.5)
• Range: 0.3 → 0.85
• 0.5 = wick must be ≥ 50% of candle range
• Lower: more traps detected
• Higher: only extreme rejections
✅ Recommended: 0.5–0.6 (balanced)
📊 Volume Spike Multiplier (Default: 1.3)
• Range: 1.0 → 4.0
• 1.3 = volume must be ≥ 130% of 20-period avg
• Lower: more signals
• Higher: only major spikes
✅ Recommended: 1.3–1.5
________________________________________
📦 Zone Settings
📏 Zone ATR Period (Default: 14)
• Range: 10 → 50
• Controls volatility measurement used for zone sizing
• Shorter = more responsive ⚡
• Longer = smoother ✅
✅ Recommended: 14–20
📐 Zone Width (ATR Multiple) (Default: 0.5)
• Range: 0.2 → 1.5
• 0.5 = zone extends 0.5 × ATR around the level
• Smaller (0.3–0.4) = tight & precise 🎯
• Larger (0.6–0.8) = wider coverage 🌊
✅ Recommended: 0.4–0.6
🧱 Max Zones (Default: 8)
• Range: 2 → 20
• Lower = cleaner chart 🧼
• Higher = more context 📚
✅ Recommended: 6–10
↔️ Min Zone Separation (ATR) (Default: 2.0)
• Range: 0.5 → 5.0
• Prevents zone clustering
• Lower = more zones (tighter stacking)
• Higher = fewer zones (cleaner layout)
✅ Recommended: 1.5–2.5
________________________________________
👁️ Display Options
• ✅ Show Current Zones (ON) → active bull/bear zones
• ⛔ Show Historic Zones (OFF) → breached zones in gray
• ✅ Show Zone Labels (ON) → quick identification
• ⛔ Show Pivot Markers (OFF) → optional triangles
• 🌫️ Zone Opacity (80) → suggested 75–85
• 🎨 Bull Color: Teal
• 🎨 Bear Color: Maroon
________________________________________
📈 Trading Strategies
🪤 Strategy 1: Liquidity Sweep Reversal
Steps:
1️⃣ Identify zone
2️⃣ Wait for price to sweep into zone (wick into it)
3️⃣ Confirm with rejection candle
4️⃣ Enter with stop beyond zone
✅ Example (concept): sweep → reclaim → continuation
________________________________________
🔁 Strategy 2: Zone-to-Zone Trading
• Sweep bull zone → target bear zone 🎯
• Sweep bear zone → target bull zone 🎯
Risk plan:
• 🛑 Stop: 1–2 ATR beyond zone
• 🎯 TP: next opposite zone or 2:1 RR
• 📦 Risk: 1–2% per trade
________________________________________
🧲 Strategy 3: Confluence Trading
Look for zones that align with:
• 🧮 Fibonacci (50 / 61.8)
• 🔢 Round numbers (e.g., 2600 / 2650 / 2700)
• 📅 Previous day high/low
• 📉 Trendlines / MAs
More confluence = stronger zone 💪
________________________________________
🕰️ Strategy 4: Historic Zone Analysis
Turn on historic zones and study:
• Did it reverse after breach?
• How far did it extend beyond?
• What did volume do?
Use these patterns to improve expectations on current zones 📚
________________________________________
⏱️ Timeframe Recommendations
M5
• 🏎️ Scalping, fast signals
• More zones, more noise
• Tight risk, quick exits
M15
• ⚖️ Best balance for intraday
• Strong zone quality + quantity
M30
• 🧘 Cleaner zones, stronger signals
• Wider stops, more patience
H1
• 🏗️ Highest-quality zones
• Fewer false signals, bigger targets
________________________________________
✅ Best Practices
Do’s ✅
• Wait for confirmation candles 🕯️
• Use multi-timeframe context (H1 zones + M15 entries) 🧭
• Combine with price action (engulfing / pin bars) 🎯
• Always use stops 🛑
• Study breached zones 📚
• Adapt settings to volatility 🌊
Don’ts ❌
• Don’t trade every zone blindly
• Don’t ignore context (trend/news/sentiment)
• Don’t overtrade
• Don’t treat settings as “one-size forever”
• Don’t fight strong trends without confirmation
________________________________________
🧠 Advanced Tips
🕒 Session-Based Behavior
• 🌙 Asia: zones often hold better (lower volatility)
• 🇬🇧 London: aggressive sweeps
• 🇺🇸 NY: continuations or major reversals
• 🔥 Overlaps: most volatile → strongest reactions
📰 News Awareness
High-impact events (CPI, NFP, FOMC) can:
• create zones rapidly ⚡
• invalidate zones ❗
• extend beyond zones 🎢
Tip: avoid trading zones during major releases
🧩 Multi-Timeframe Confirmation
• Find zone on H1
• Refine entry on M15
• Confirm structure shift / reaction before entry ✅
💪 Zone Strength Clues
Stronger zones often have:
• multiple detection methods (pivot + wick + volume)
• confluence with key levels
• recent formation
• clean first reaction
________________________________________
🧰 Troubleshooting
Too Many Zones
Try:
• Increase separation (2.5–3.0)
• Reduce max zones (5–6)
• Increase pivot length (12–15)
• Increase wick ratio (0.6–0.7)
Too Few Zones
Try:
• Decrease separation (1.0–1.5)
• Increase max zones (10–12)
• Reduce pivot length (7–8)
• Reduce wick ratio (0.4–0.5)
• Reduce volume multiplier (1.2)
🚫 Zones Not Showing
Check:
• “Show Current Zones” is ON ✅
• enough bars loaded
• try defaults first, then adjust
Historic Zones Not Appearing
• Price must breach zones first
• scroll back for older breaches
• increase max zones to store more
________________________________________
🔔 Indicator Alerts
🟥 Bear Liquidity Zone Detected
• Trigger: new resistance zone
• Message: “Bear liquidity hunting zone identified”
• Use: selling opportunities 🧲
🟦 Bull Liquidity Zone Detected
• Trigger: new support zone
• Message: “Bull liquidity hunting zone identified”
• Use: buying opportunities 🧲
Setup:
1️⃣ Right-click chart → Add Alert
2️⃣ Select indicator condition
3️⃣ Choose Bull/Bear alert
4️⃣ Select delivery method (popup/email/webhook)
________________________________________
⚡ Performance Notes
• 🧱 Max boxes: 500
• 🏷️ Max labels: 500
• 🪶 Lightweight / minimal lag
• ✅ No repaint (confirmed on bar close)
• 🔒 Zones stay fixed once created
________________________________________
🧾 Version History v1.0
• Pine Script v6
• 3 detection methods (pivot / wick / volume)
• Current + historic zones
• Custom colors & settings
• Built-in alerts
• Optimized defaults across M5/M15/M30/H1 for XAUUSD, NQ, ES, FX ✅
Can be also combined with Order Block Finder and FVG Finder
for complete / more advanced SMC strategy chart overlay.
✅ Order Block Finder | Gold | ProjectSyndicate
✅ FVG Finder | NRP | ProjectSyndicate
A Humbled Trader Strategy + ChecklistHumbled Trader Swing Strategy + Checklist
This indicator is a complete swing trading system based on the high-probability strategies popularized by Humbled Trader. It is designed to help traders identify trend breakouts and low-risk momentum pullbacks on the Daily Timeframe.
The script combines trend filtering, automated resistance lines, and specific entry triggers into a single chart overlay, complete with a real-time Strategy Checklist Dashboard to confirm your setups instantly.
🎯 Core Components
Trend Filter (Purple Line): The 200 Simple Moving Average (SMA). This acts as your long-term trend filter. We only look for long trades when the price is above this line.
Momentum Guide (Orange Line): The 8 Exponential Moving Average (EMA). This tracks short-term momentum. In a strong trend, price will "ride" this line. We look to enter when price pulls back to touch this area.
Multi-Month Resistance (Orange Horizontal Line): Automatically plots the highest price over the last X Months (adjustable). This helps you instantly visualize the key level the stock needs to break out from.
Checklist Dashboard: A real-time table that evaluates Trend, Resistance, and Momentum conditions to give you a clear "✅ ENTER", "🚀 GAP UP", or "⏳ WAIT" signal.
🛠 How It Works
This indicator scans for two specific setups:
1. The Daily Gap Up ("GAP" Label) This signal appears when a stock shows strong momentum by gapping up overnight.
Condition: The stock opens at least 3% higher (adjustable) than the previous day's Close AND opens above the previous day's High.
Trend: Must be above the 200 SMA.
Visual: Marked with a green "GAP" label on the chart.
2. The Trend Pullback ("ENTER" Signal) This is a trend-following entry that lets you join an existing move with lower risk.
Condition: The stock is in an uptrend but dips down to touch or test the 8 EMA.
Validation: The candle must show a "dip" (red candle or lower close) to ensure we are buying a pullback, not chasing a top.
Visual: The Dashboard "Action Signal" will turn orange and display "✅ ENTER".
📋 The Checklist Dashboard
Located in the corner of your chart, this table provides a live status report for the current bar:
Trend (> 200 SMA):
🟢 Bullish: Price is in an uptrend. Safe to look for entries.
🔴 Bearish: Price is below the 200 SMA. Stay away.
Above Resistance?:
🟢 Breakout: Price has cleared the multi-month resistance line.
⚪ ---: Price is currently below the key breakout level.
Near 8 EMA?:
🟢 Yes: Price is near the "value zone" (8 EMA) for a potential pullback entry.
Action Signal:
🚀 GAP UP: Strong momentum gap detected.
✅ ENTER: Valid pullback entry detected.
⏳ WAIT: No clear setup found.
⚙️ Settings
Momentum EMA Length: Default is 8. Controls the sensitivity of the pullback line.
Trend SMA Length: Default is 200. The standard for long-term trend filtering.
Gap Up % Threshold: Default is 3.0%. Minimum overnight gap size required to trigger a signal.
Resistance Lookback (Months): Default is 3. The script will look back this many months to find and draw the key resistance line.
Table Position: Move the checklist to any corner of your screen.
⚠️ Disclaimer
This tool is for educational purposes only and does not constitute financial advice. Always manage your risk and use a stop loss.
Wyckoff Schematic by Kingshuk GhoshThe "Wyckoff Schematic" is a Pine Script indicator that automatically detects and visualizes Wyckoff Method accumulation and distribution patterns in real-time. This professional tool helps traders identify smart money movements, phase transitions, and critical market structure points.
Key Features-
1. Wyckoff Pattern Detection
Auto-detection of all Wyckoff phases (A through E)
Accumulation patterns: SC, AR, Spring, SOS, LPS
Distribution patterns: BC, UTAD, LPSY
Real-time phase identification with color-coded visualization
2. Multi-Timeframe Analysis-
Main chart analysis with customizable lookback period
1M Wave View showing monthly perspective in a compact overlay
Daily data integration for current month analysis
Swing point detection with trend lines
3. Advanced Visualization-
Phase boxes with semi-transparent overlays
Critical event labels with anti-clutter spacing
Horizontal support/resistance lines (dynamic)
Zigzag trend lines for price structure
Comprehensive table showing current status and key events
4. Customizable Parameters-
Adjustable lookback period (20-300 bars)
Configurable volume spike multiplier
Customizable display options (labels, boxes, lines)
Adjustable zigzag sensitivity
Configurable wave view height and swing legs
Display Settings: Event labels, phase boxes, support/resistance lines
Visual Settings: Label size, transparency, offset percentage
Zigzag Settings: High/low length
Wave View Settings: Toggle, height percentage, swing legs
Color Scheme:
Phase A: Red
Phase B: Teal
Phase C: Blue
Phase D: Green
Phase E: Yellow
Bullish: Green
Bearish: Red
Alert System:
Critical event alerts: SC, AR, Spring, SOS, LPS, BC, UTAD, LPSY
Phase transition alerts: Markup phase entry ,Customizable alert conditions
How to Use-
For Beginners:
Apply the indicator to any chart
Enable "Auto-Detect Wyckoff Patterns"
Look for colored phase boxes (A-E)
Watch for critical event labels (SC, AR, Spring, etc.)
Check the table in top-right corner for current status
For Advanced Users:
Adjust lookback period based on trading timeframe
Modify volume multiplier for sensitivity
Customize display to reduce clutter
Use wave view for higher timeframe context
Set alerts for specific Wyckoff events
Unique Selling Points:
Comprehensive Detection: Covers all Wyckoff phases and critical events
Clean Visualization: Anti-overlap labeling, organized display
Multi-Timeframe: Combines current chart with monthly perspective
Educational: Helps learn Wyckoff methodology through visualization
Professional: Suitable for both retail and institutional analysis
Performance Notes:
Uses dynamic requests for multi-timeframe data
Includes max object limits to prevent performance issues
Efficient calculation methods for real-time analysis
Intended Users:
Price action traders
Wyckoff method practitioners
Market structure analysts
Swing traders and position traders
Educational purposes for learning market manipulation patterns
Works best on 4H,Daily,Weekly & Monthly Time frame
Suitable for all markets (stocks, forex, crypto, futures)
Support:
The indicator includes comprehensive tooltips and visual cues to help users understand each Wyckoff event and phase. The table provides quick reference to current market conditions and detected patterns.
This indicator transforms complex Wyckoff methodology into actionable visual signals, making institutional accumulation/distribution patterns accessible to all traders.
Disclaimer: This indicator is for educational purposes only. Always practice proper risk management and combine with your own analysis before making trading decisions. Happy trading.


