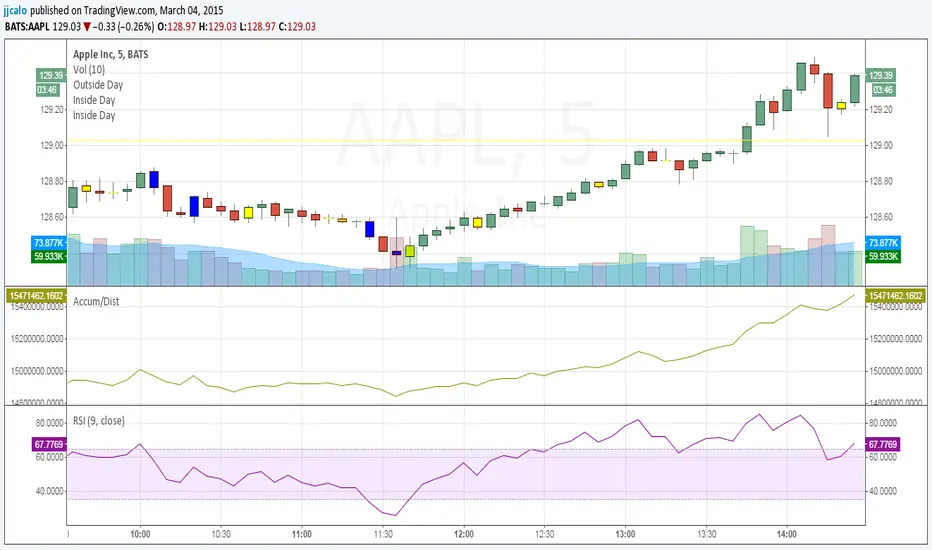
jc-Inside_BarCopyright by jack calo -- v1.0 -- 03/04/2015 -- Paint the bar yellow when it's an inside day. When the full range of a candle is equal or within the full range of the previous bar. Credit to Rob Smith and his In The Black Strategy.
Cari skrip untuk "bar"
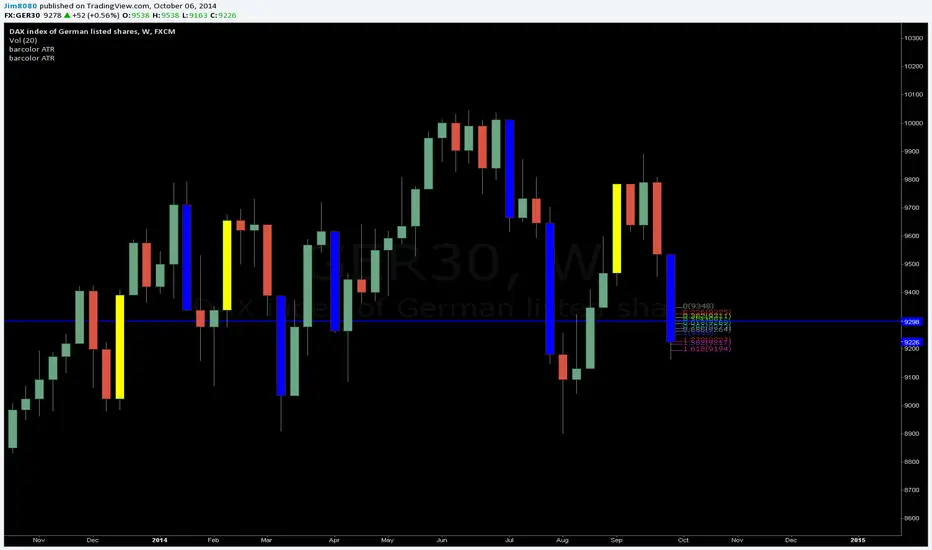
Over ATR Bar highlightScript highlights bars over ATR (20), i use this to look for mazabuzo candles.
FVE Volatility color-coded Volume bar The FVE is a pure volume indicator. Unlike most of the other indicators
(except OBV), price change doesn?t come into the equation for the FVE
(price is not multiplied by volume), but is only used to determine whether
money is flowing in or out of the stock. This is contrary to the current trend
in the design of modern money flow indicators. The author decided against a
price-volume indicator for the following reasons:
- A pure volume indicator has more power to contradict.
- The number of buyers or sellers (which is assessed by volume) will be the same,
regardless of the price fluctuation.
- Price-volume indicators tend to spike excessively at breakouts or breakdowns.
This study is an addition to FVE indicator. Indicator plots different-coloured volume
bars depending on volatility.

Custom Indicator Clearly Shows If Bulls or Bears are in Control!The Two Versions of this Indicator I learned from Two Famous and Highly Successful Traders. This Indicator shows With No Lag Clear Up and Down Trends in Market by Documenting Clearly If Bulls or Bears are in Control. The Version In SubChart 1 Shows Consecutive Closes if the Current Close is Greater than of Less than the Midpoint of the Previous Bar (Why Midpoint Explained in Detail in 1st Post). The Version in SubChart 2 Shows Consecutive Closes that are Greater than or Less Than the Previous Close (Will Discuss Specific Uses in 1st Post). Works on Stocks, Forex, Futures, on All Timeframes.


VWAP filtered MACD Bars with positive MACD histogram value and closing above VWAP are colored, long positions should be taken in areas made of those bars.
Similarly, bars with negative MACD histogram value and closing below VWAP are also colored, short positions should be taken there.
This indicator by default should be a part of your trend following trading system.
In the setting you can change colors
Above grow: positive and rising MACD histogram value
Above fall: positive and falling MACD histogram value
Below fall: negative and falling MACD histogram value
Below grow: negative and rising MACD histogram value
bar color changeThis Pine v5 code allows you to distinguish between candles on the chart. The body/wick/frame of the "live" candle that hasn't yet closed is colored white. When a live candle is present, the body of the immediately preceding candle is colored green with offset = -1. All other candles remain gray (#2e2e2e). plotcandle fixes the wick/frame so that the live and previous candles are selected when following the trend. If there are other conflicting scripts, the most recently added one quickly takes precedence.

Bar RangeI use this to complement the daily ATR bars. It is interesting to see how much the stock has actually moved vs the ATR movement.

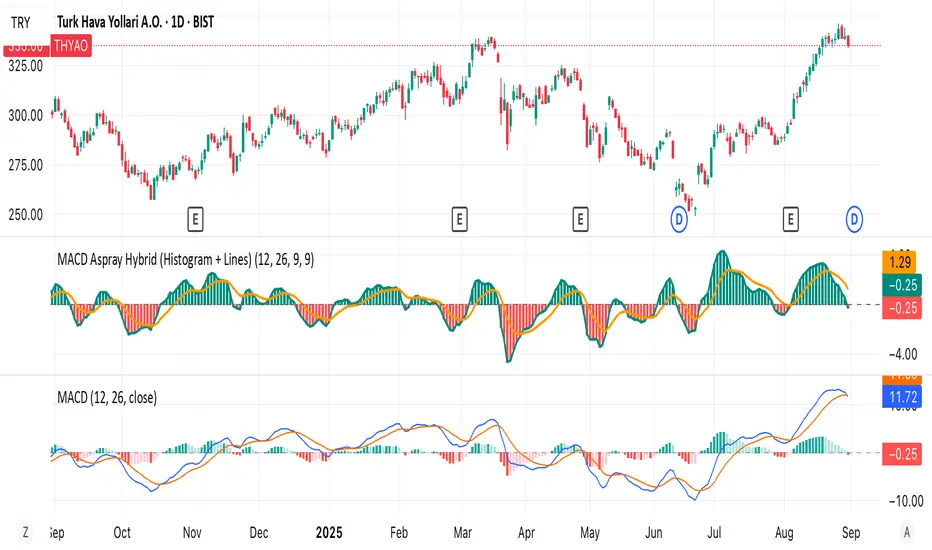
MACD Aspray Hybrid Bars (teal/red) = raw momentum (Aspray Histogram).
Teal line = smooth curve of the histogram (Aspray Line).
Orange line = 9-EMA of that line (new signal).
Zero line for reference.
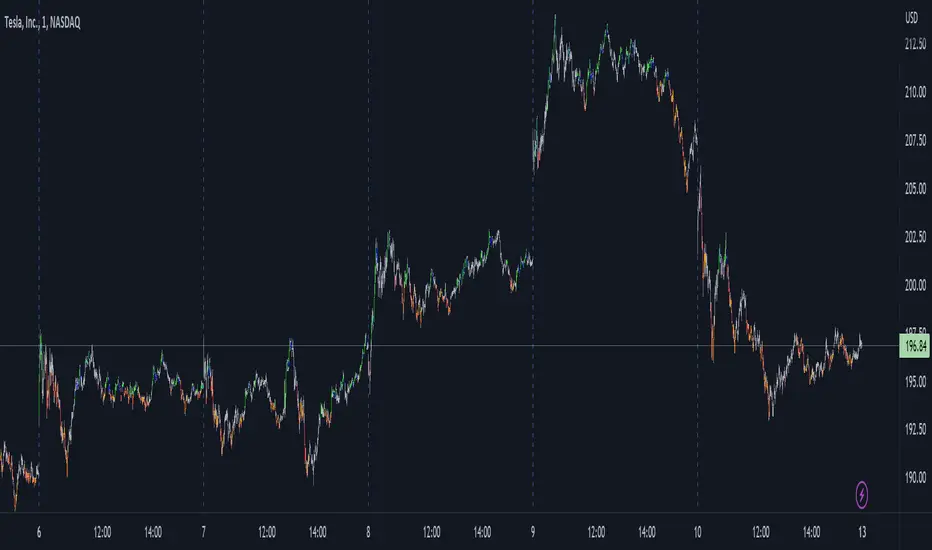
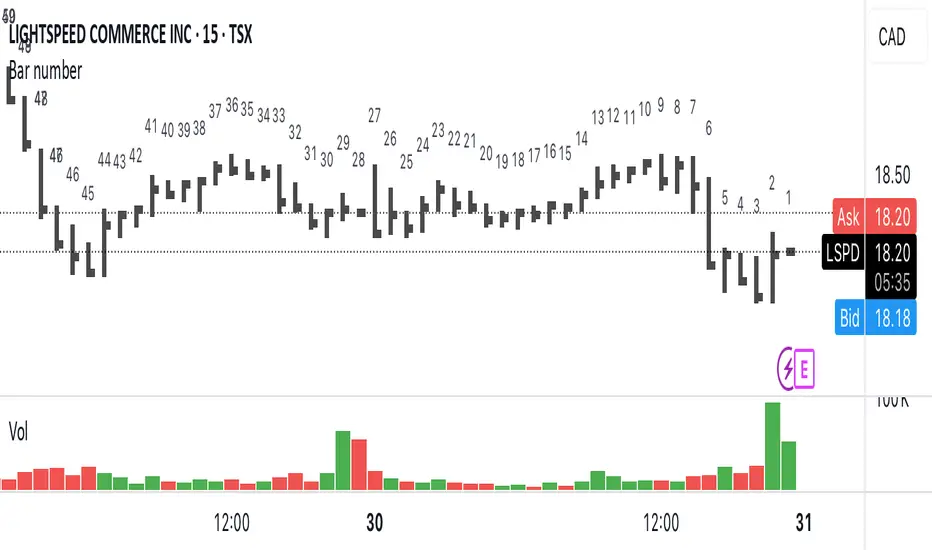
Bar numberAdds a number above the last 50 candles. Candle 1 is always the most recent.
Can be useful when teaching people onlinet. Now they can just ask « what’s candle number 20 » instead of « what’s with that narrow range candle next to the big one to the left… no not that one, the other one »
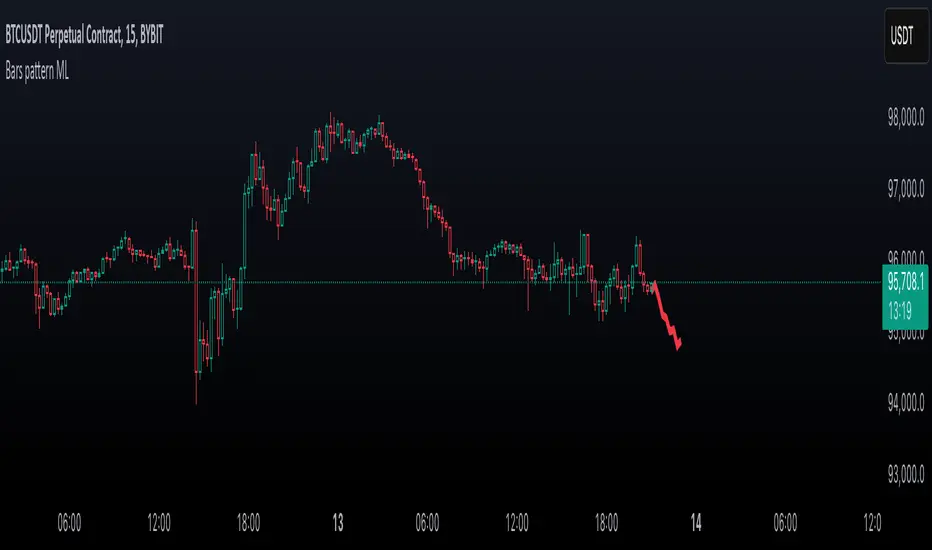
Bars pattern MLThis script implements a K-Nearest Neighbors (KNN)-based machine learning model to predict future price movements in financial markets. It analyzes past price action using Euclidean distance and selects the most similar historical patterns to estimate future price changes. Unlike traditional KNN implementations, this approach optimizes distance calculations by maintaining a dynamically updated list of the closest neighbors, ensuring efficient selection without the need for sorting. The model generates a forecasted price trajectory based on incremental predictions, which are visualized on the chart using polylines for better interpretability.
Volume HighlightBar colouring: this indicator is simple but effective, it repaints higher than normal candles a certain colour (by default gold/yellow) it helps to know what are valuable areas to trade around for longs and shorts.
Changing the volume multiplier manually helps you to screen volume relevant to the timeframe you are trading on.
For example, some charts 1min the best filter/setting would be 12-35 multiplier where others like btc 1-4 hourly, the filter/setting might be 8-12.
The key is having only the highest/most relevant 3-4 volume candles showing as they often represent supports and resistances.


Pivot Points And Breakout Price Action With LuckyNickVaBar Color Candle Aligned with pivot points swing high and swing lows For Those Who Are Familiar with Trading The Breakouts Of Highs & Lows Of Structure. Pivots are said to be key areas in the market where price shows heavy reaction to where reversals make occur. At these points there are swing Highs & swing lows that traders may be able to find opportunity in the market. This Script is a combination of pivot points and Barcolor signals for the breakout.

Koalafied Volume Extension Bar colours based on extensions from volume Z-Score. Large volume candles can often signal exhaustion or show market strength in reversals or breakouts. Candles not supported by rising volume are coloured black while those that are retain their colouring.

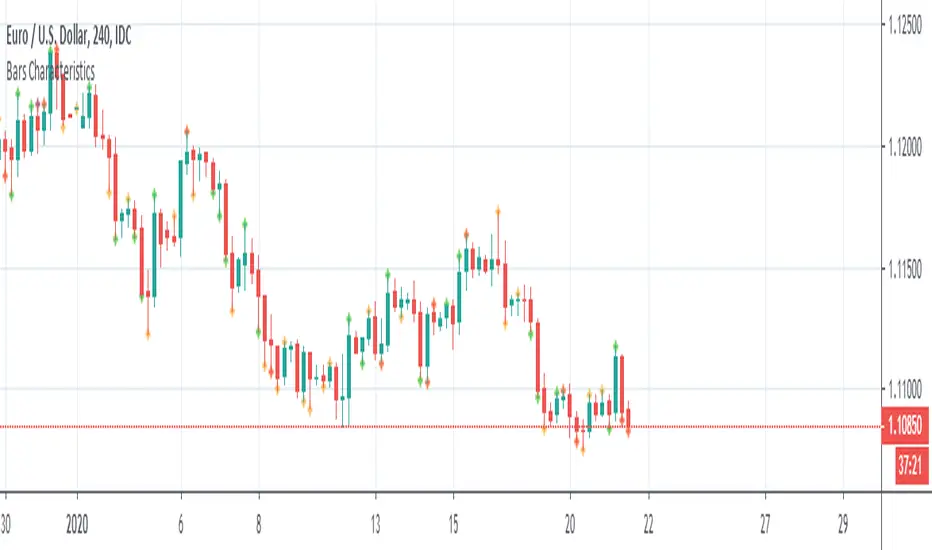
Bars CharacteristicsThis code is for defining or explaining market conditions via micro trend and the characterized bars.
lines 5,6: show the conditions for a normal trend, means market can go in the direction that it has in the past.
lines 11,12: show the conditions for kind of the trend having cumulative energy itself, mean market can go in the same direction.
lines 18,19: show the conditions for kind of the trend having overbought/sold concept, means it's better exit from the market or to look for the other clues.
lines 24,25: show some kind of noise not a stable trend, it's better not to enter the market.

WhenWasThePriceAction
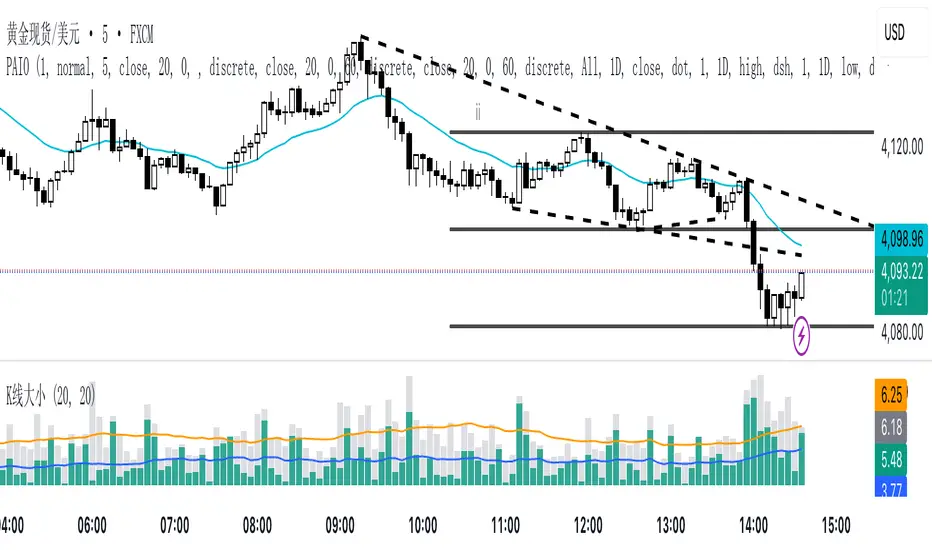
Bars of largest range (volatility)
* see moments of strongest price action immediately
* colored & upDown by candle color
* amplifier: you see only the bull runs, and subsequent dumps
Very nice on the 5 years scale of BITSTAMP:BTCUSD - nothing comparable to 2013 has happened yet.
Internals:
squared_range = pow(high-low, 2)
That is essentially it already. The rest are details:
* gauge with (in case of Bitcoin exponentially rising) price
* show in red for negative candles
* take even higher polynomial (than 2) to show only the very largest values
* allow some user input (but there is not much more that can be chosen here.)
Sorry for such a simple formula - but sometimes the easiest things are powerful.
Please give feedback. www.tradingview.com and/or in the cryptocurrency chat. Thanks.


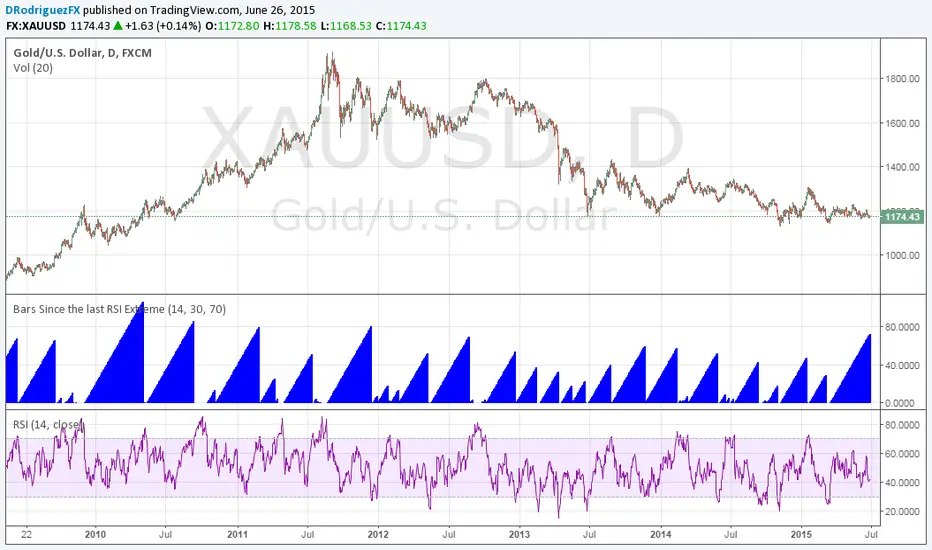
Bars Since the last RSI ExtremeThis is something Jamie Saettele pointed out. Gold has been in 'neutral' RSI territory for its longest stretch in four years. It's coiling up for its next major move.
[TehThomas] - Aligned Timeframe Liquidity Sweeps█ OVERVIEW
The Liquidity Sweeps ICT MTF indicator automatically detects and visualizes buyside and sellside liquidity levels based on higher timeframe (HTF) swing points. Designed specifically for traders using Smart Money Concepts and ICT (Inner Circle Trader) methodology, this tool helps identify where institutional players are likely hunting liquidity before making directional moves.
█ KEY FEATURES
✓ Automatic ICT-Aligned Timeframe Selection
• Intelligently selects the higher timeframe based on your current chart
• Follows ICT's recommended correlations (5min→1h, 15min→4h, 1h→Daily, etc.)
• No manual timeframe selection needed - adapts automatically
✓ Precise Liquidity Level Placement
• Lines start exactly at the LTF candle that created the HTF swing point
• Searches backwards through historical data to find exact placement
• Eliminates guesswork about where institutional orders cluster
✓ Real-Time Sweep Detection
• Solid lines indicate untouched liquidity (active levels)
• Lines automatically turn dotted when price sweeps through them
• Swept lines stop at the exact bar of the sweep (clean visualization)
• Both wicks and candle bodies trigger sweep detection
✓ Fully Customizable Per Timeframe
• Individual swing detection settings for each HTF (1m, 15m, 1h, 4h, D, W, M)
• Adjust sensitivity to show major levels only or capture granular liquidity pools
• Customizable colors and line width
• Organized settings groups for easy navigation
█ HOW IT WORKS
The indicator identifies swing highs and swing lows on a higher timeframe using pivot point detection. These swing points represent areas where stop-loss orders from retail traders concentrate, creating "liquidity pools" that smart money targets.
Timeframe Alignment (Automatic):
• 15s chart → 1min HTF
• 1min chart → 15min HTF
• 5min chart → 1hour HTF
• 15min chart → 4hour HTF
• 1hour chart → Daily HTF
• 4hour chart → Weekly HTF
• Daily chart → Monthly HTF
Swing Detection:
The indicator uses customizable left/right bar counts to identify valid swing points on the HTF. Default values are optimized per timeframe (e.g., 10 bars for 1h, 5 bars for Daily), but can be adjusted to your preference.
Visualization:
• Green lines = Buyside liquidity (swing highs where long stops sit)
• Red lines = Sellside liquidity (swing lows where short stops sit)
• Solid style = Untouched liquidity
• Dotted style = Swept liquidity
█ SETTINGS
Swing Detection Group:
• Swing Bars - 1 Minute: Default 5 bars
• Swing Bars - 15 Minutes: Default 8 bars
• Swing Bars - 1 Hour: Default 10 bars
• Swing Bars - 4 Hours: Default 6 bars
• Swing Bars - Daily: Default 5 bars
• Swing Bars - Weekly: Default 3 bars
• Swing Bars - Monthly: Default 2 bars
Tip: Increase values for cleaner charts with major levels only. Decrease for more sensitive detection.
Display Group:
• Buyside Liquidity Color: Default green
• Sellside Liquidity Color: Default red
• Line Width: Adjustable 1-5
█ HOW TO USE
Reading the liquidity levels:
🟢 Green solid line = Untouched buyside liquidity (potential magnet for price)
🔴 Red solid line = Untouched sellside liquidity (potential magnet for price)
🟢 Green dotted line = Swept buyside liquidity (bulls trapped)
🔴 Red dotted line = Swept sellside liquidity (bears trapped)
Trading Applications:
1. Liquidity Grab Reversals: Watch for sweeps followed by immediate reversals
2. Stop Hunt Detection: Multiple sweeps often precede strong counter-moves
3. Target Identification: Use untouched levels as potential price magnets
4. Market Structure Analysis: Understand institutional order flow
5. Confluence Zones: Combine with order blocks, FVGs, or other ICT concepts
Best Practices:
• Focus on liquid markets (major FX pairs, indices, large-cap stocks)
• Consider higher timeframe trend - sweeps against trend are higher probability
• Look for liquidity clusters (multiple levels close together)
• Wait for confirmation after sweeps before entering
• Not all sweeps result in reversals - context matters
█ TRADING STRATEGY EXAMPLES
Liquidity Sweep Reversal:
1. Identify untouched liquidity level
2. Wait for price to sweep through (line turns dotted)
3. Look for reversal price action (engulfing, rejection)
4. Enter in reversal direction with stop beyond the sweep
5. Target next liquidity level or structure
Liquidity-to-Liquidity:
1. Price sweeps sellside liquidity (red dotted)
2. Enter long positions
3. Target buyside liquidity above (green solid)
4. Exit when buyside liquidity is swept
█ IDEAL FOR
• ICT Methodology Traders
• Smart Money Concept Practitioners
• Liquidity-Based Strategies
• Multi-Timeframe Analysis
• Price Action Traders
• Stop Hunt Avoidance
█ TECHNICAL SPECIFICATIONS
• Maximum Lines: 500
• Lookback Range: Up to 1000 bars for precise placement
• Compatible: All markets and timeframes
• Data: Works on both real-time and historical bars
█ NOTES & DISCLAIMERS
• This indicator is a tool for analysis, not a standalone trading system
• Always use proper risk management and combine with other analysis
• Performance may vary across different markets and conditions
• Based on ICT concepts - familiarity with Smart Money trading is recommended
█ LIQUIDITY FOR SINGLETIMEFRAMES
If you prefer normal liquidity lines you can use my other free liquidity indicator

Reversal Detector [Scalping-Algo]Reversal Detector - Volume-Based Price Structure Analysis
───────────────────────────────────────────
WHAT IT DOES
This indicator identifies potential reversal zones by analyzing price structure combined with volume. Instead of using traditional overbought/oversold readings or single candlestick patterns, it looks for a specific two-phase setup:
Phase 1 - Anchor Detection:
The script scans for bars where price closes beyond ALL previous bars in the lookback period. For a bullish setup, the close must be lower than every low of the past N candles (default 20). This represents an extreme extension, not just a "lower low." Volume on this bar should exceed 2x the average to confirm real participation.
Phase 2 - Confirmation:
After an anchor forms, the indicator waits for price to reverse back through the anchor bar's range. This must occur within a set number of bars (default 3). If price continues making new extremes instead, the setup is cancelled.
────────────────────────────────────────────────────────────────
HOW TO READ THE SIGNALS
B Labels (Green, below price) = Bullish reversal confirmed
S Labels (Red, above price) = Bearish reversal confirmed
Each signal shows a score from 3/5 to 5/5:
- 3/5 = Basic confirmation met
- 4/5 = Good volume on anchor or confirmation
- 5/5 = Strong volume + aligned with 200 EMA trend
Dashed Boxes = Pending setup waiting for confirmation
- Green box = Bullish setup in progress
- Red box = Bearish setup in progress
Status Panel (bottom right):
- Shows current state (Scanning / Bull Setup / Bear Setup)
- Countdown for confirmation window
- Current volume condition
────────────────────────────────────────────────────────────────
HOW TO USE
Entry Approach:
1. Wait for a confirmed signal (B or S label appears)
2. Higher scores (4/5 or 5/5) indicate better quality setups
3. Consider the overall trend context - signals aligned with the 200 EMA direction tend to work better
Stop Placement:
- For long entries: below the anchor bar's low
- For short entries: above the anchor bar's high
The boxes show you the anchor zone while waiting for confirmation, which can help visualize the invalidation level.
────────────────────────────────────────────────────────────────
SETTINGS
Structure Settings:
- Lookback Period (default 20): How many bars back to check for the breakout. Lower = more setups but less extreme. Higher = fewer but more significant extensions.
- Confirmation Bars (default 3): Maximum bars allowed for price to reverse. Tighter window = stricter filter.
Volume Settings:
- Use Volume Filter: Toggle volume requirement on/off
- Volume MA Length (default 20): Period for average volume calculation
- Anchor Volume Multiple (default 2.0): Required volume spike on anchor bar
- Confirm Volume Multiple (default 1.2): Volume threshold on confirmation bar
Visual Settings:
- Trend EMA Length (default 200): Used for trend alignment scoring
- Show Pending Setups: Display the dashed boxes for active setups
- Show Status Panel: Display the info table
- Colors and label size customization
────────────────────────────────────────────────────────────────
WHAT MAKES THIS DIFFERENT
The core idea is requiring price to break beyond EVERY bar in the lookback range, not just make a swing high/low. This filters out minor pullbacks and focuses on genuine extensions where price has moved significantly.
The two-phase approach (anchor then confirmation) helps avoid catching falling knives - you're not entering just because price is extended, but waiting for actual reversal evidence.
Volume integration adds another layer. The anchor bar needs elevated volume to confirm real selling/buying pressure, not just a gap or illiquid move.
────────────────────────────────────────────────────────────────
SUGGESTED USE
Works on any timeframe, but I find it most useful on 5-15 minute charts for intraday setups.
Combine with:
- Key support/resistance levels
- Higher timeframe trend direction
- Market context (avoid during major news)
The indicator identifies the pattern mechanically - it doesn't predict outcomes. Use proper position sizing and always have a stop loss plan.
────────────────────────────────────────────────────────────────
ALERTS INCLUDED
- Bullish Reversal
- Bearish Reversal
- Any Reversal
- Strong Bullish (4/5 or higher)
- Strong Bearish (4/5 or higher)
────────────────────────────────────────────────────────────────
