Trend Surge with Pullback FilterTrend Surge with Pullback Filter
Overview
Trend Surge with Pullback Filter is a price action-based strategy designed to enter strong trends not at the breakout, but at the first controlled pullback after a surge. It filters out noise by requiring momentum confirmation and low volatility conditions, aiming for better entry prices and reduced risk exposure.
How It Works
A strong upward trend is identified when the Rate of Change (ROC) exceeds a defined percentage (e.g., 2%).
Instead of jumping into the trend immediately, the strategy waits for a pullback: the price must drop at least 1% below its recent high (over the past 3 candles).
A low volatility environment is also required for entry — measured using ATR being below its 20-period average multiplied by a safety factor.
If all three conditions are met (trend + pullback + quiet volatility), the system enters a long position.
The trade is managed using a dynamic ATR-based stop-loss and a take-profit at 2x ATR.
An automatic exit occurs after 30 bars if neither SL nor TP is hit.
Key Features
- Momentum-triggered trend detection via ROC
- Smart pullback filter avoids overbought entries
- Volatility-based filter to eliminate noise and choppy conditions
- Dynamic risk-reward ratio with ATR-driven exit logic
- Time-limited exposure using bar-based exit
Parameter Explanation
ROC Length (10): Looks for short-term price surges
ROC Threshold (2.0%): Trend is considered valid if price increased more than 2%
Pullback Lookback (3): Checks last 3 candles for price retracement
Minimum Pullback % (1.0%): Entry only if price pulled back at least 1%
ATR Length (14): Measures current volatility
Low Volatility Multiplier (1.2): ATR must be below this multiple of its 20-period average
Risk-Reward (2.0): Target is set at 2x the stop-loss distance
Max Bars (30): Trade is closed automatically after 30 bars
Originality Statement
This strategy doesn’t enter at the trend start, unlike many momentum bots. Instead, it waits for the first market hesitation — a minor pullback under low volatility — before entering. This logic mimics how real traders often wait for a better entry after a breakout, avoiding emotional overbought buys. The combined use of ROC, dynamic pullback detection, and ATR-based environment filters makes it both practical and original for real-world trading.
Disclaimer
This strategy is intended for educational and research purposes. Backtest thoroughly and understand the logic before using with real capital.
Cari skrip untuk "bar"

SOXL Trend Surge v3.0.2 – Profit-Only RunnerSOXL Trend Surge v3.0.2 – Profit-Only Runner
This is a trend-following strategy built for leveraged ETFs like SOXL, designed to ride high-momentum waves with minimal interference. Unlike most short-term scalping scripts, this model allows trades to develop over multiple days to even several months, capitalizing on the full power of extended directional moves — all without using a stop-loss.
🔍 How It Works
Entry Logic:
Price is above the 200 EMA (long-term trend confirmation)
Supertrend is bullish (momentum confirmation)
ATR is rising (volatility expansion)
Volume is above its 20-bar average (liquidity filter)
Price is outside a small buffer zone from the 200 EMA (to avoid whipsaws)
Trades are restricted to market hours only (9 AM to 2 PM EST)
Cooldown of 15 bars after each exit to prevent overtrading
Exit Strategy:
Takes partial profit at +2× ATR if held for at least 2 bars
Rides the remaining position with a trailing stop at 1.5× ATR
No hard stop-loss — giving space for volatile pullbacks
⚙️ Strategy Settings
Initial Capital: $500
Risk per Trade: 100% of equity (fully allocated per entry)
Commission: 0.1%
Slippage: 1 tick
Recalculate after order is filled
Fill orders on bar close
Timeframe Optimized For: 45-minute chart
These parameters simulate an aggressive, high-volatility trading model meant for forward-testing compounding potential under realistic trading costs.
✅ What Makes This Unique
No stop-loss = fewer premature exits
Partial profit-taking helps lock in early wins
Trailing logic gives room to ride large multi-week moves
Uses strict filters (volume, ATR, EMA bias) to enter only during high-probability windows
Ideal for leveraged ETF swing or position traders looking to hold longer than the typical intraday or 2–3 day strategies
⚠️ Important Note
This is a high-risk, high-reward strategy meant for educational and testing purposes. Without a stop-loss, trades can experience deep drawdowns that may take weeks or even months to recover. Always test thoroughly and adjust position sizing to suit your risk tolerance. Past results do not guarantee future returns. Backtest range: May 8, 2020 – May 23, 2025

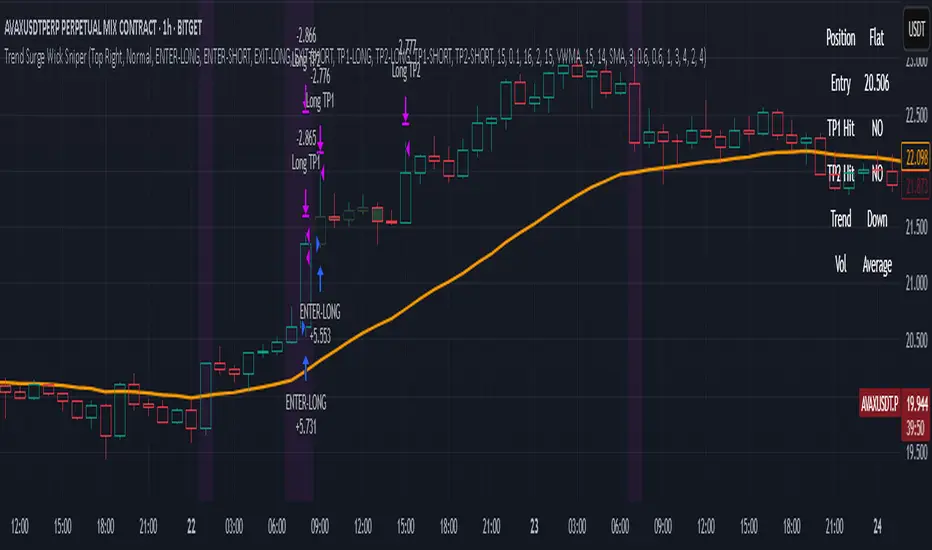
Trend Surge Wick SniperTrend Surge Wick Sniper | Non-Repainting Trend + Momentum Strategy with TP1/TP2 & Dashboard
Trend Surge Wick Sniper is a complete crypto trading strategy designed for high-precision entries, smart exits, and non-repainting execution. It combines trend slope, wick rejection, volume confirmation, and CCI momentum filters into a seamless system that works in real-time conditions — whether you're manual trading or sending alerts to multi-exchange bots.
🧩 System Architecture Overview
This is not just a mashup of indicators — each layer is tightly integrated to filter for confirmed, high-quality setups. Here’s a detailed breakdown:
📈 Trend Logic
1. McGinley Dynamic Baseline
A responsive moving average that adapts to market speed better than EMA or SMA.
Smooths price while staying close to real action, making it ideal for basing alignment or trend context.
2. Gradient Slope Filter (ATR-normalized)
Calculates the difference between current and past McGinley values, divided by ATR for normalization.
If the slope exceeds a configurable threshold, it confirms an active uptrend or downtrend.
Optional loosened sensitivity allows for more frequent but still valid trades.
🚀 Momentum Timing
3. Smoothed CCI (ZLEMA / Hull / VWMA options)
Traditional CCI is enhanced with smoothing for stability.
Signals trades only when momentum is strong and accelerating.
Optional settings let users tune how responsive or smooth they want the CCI behavior to be.
🔒 Entry Filtering & Rejection Logic
4. Wick Trap Detection
Prevents entry during manipulated candles (e.g. stop hunts, wick traps).
Measures wick-to-body ratio against a minimum body size normalized by ATR.
Only trades when the candle shows a clean body and no manipulation.
5. Price Action Filters (Optional)
Long trades require price to break above previous high (or skip this with a toggle).
Short trades require price to break below previous low (or skip this with a toggle).
Ensures you're trading only when price structure confirms the breakout.
6. McGinley Alignment (Optional)
Price must be on the correct side of the McGinley line (above for longs, below for shorts).
Ensures that trades align with baseline trend, preventing early or fading entries.
📊 Volume Logic
7. Volume Spike Detection
Confirms that a real move is underway by requiring volume to exceed a moving average by a user-defined multiplier.
Uses SMA / EMA / VWMA for customizable behavior.
Optional relative volume mode compares volume against typical volume at that same time of day.
8. Volume Trend Filter
Compares fast vs. slow EMA of the volume spike ratio.
Ensures volume is not just spiking, but also increasing overall.
Prevents trades during volume exhaustion or fading participation.
9. Volume Strength Label
Classifies each bar’s volume as: Low, Average, High, or Very High
Shown in the dashboard for context before entries.
🎯 Entry Conditions
An entry occurs when all of the following align:
✅ Trend confirmed via gradient slope
✅ Momentum confirmed via smoothed CCI
✅ No wick trap pattern
✅ Price structure & McGinley alignment (if toggled on)
✅ Volume confirms participation
✅ 1-bar cooldown since last exit
💰 TP1 & TP2 Exit System
TP1 = 50% of position closed using a limit order at a % profit (e.g., 2%)
TP2 = remaining 50% closed at a second profit level (e.g., 4%)
These are set as limit orders at the time of entry and work even on backtest.
Alerts are sent separately for TP1 and TP2 to allow bot handling of staggered exits.
🧠 Trade Logic Controls
✅ process_orders_on_close=true ensures non-repainting behavior
✅ 1-bar cooldown after any exit prevents same-bar reversals
✅ Built-in canEnter condition ensures trades are separated and clean
✅ Alerts use customizable strings for entry/exit/TP1/TP2 — ready for webhook automation
📊 Real-Time On-Chart Dashboard
Toggleable, movable dashboard shows live trading stats:
🔵 Current Position: Long / Short / Flat
🎯 Entry Price
✅ TP1 / TP2 Hit Status
📈 Trend Direction: Up / Down / Flat
🔊 Volume Strength: Low / Average / High / Very High
🎛 Size and corner are adjustable via input settings
⚠️ Designed For:
1H / 4H Crypto Trading
Manual Traders & Webhook-Connected Bots
Scalability across volatile market conditions
Full TradingView backtest compatibility (no repainting / no fake signals)
📌 Notes
You can switch CCI smoothing type, volume MA type, and other filters via the settings panel.
Default TP1/TP2 levels are set to 2% and 4%, but fully customizable.
🛡 Disclaimer
This script is for educational purposes only and not financial advice. Use with backtesting and risk management before live deployment.
PRO Strategy 3TP (v2.1.1)
English Version
PRO Strategy 3TP (v2.1.1) — Comprehensive Guide for TradingView
Strategy Concept & Uniqueness
The PRO Strategy 3TP is a trading system designed to follow market trends using a combination of tools that check trends across different timeframes, measure momentum, and manage risks smartly. Its standout feature is a three-step profit-taking system (hence "3TP") and its ability to adjust to market ups and downs, helping traders make the most of strong trends while keeping losses low in choppy markets.
Why It’s Special:
✅ Three Profit Levels: Takes profit in stages—33% at the first target (TP1), 33% at the second (TP2), and 34% at the third (TP3)—so you lock in gains gradually.
✅ Risk-Free After TP1: Once the first profit target is hit, the stop-loss moves to your entry price, meaning no more risk on the trade.
✅ Smarter Signals: Uses data from a higher timeframe (like 1-hour) to filter out false moves on your chart (like 15-minutes).
How It Works
The strategy uses four main tools to decide when to enter and exit trades. Here’s what they do in simple terms:
Trend Tools (EMA, HMA, SMA)
EMA (Exponential Moving Average): A line that tracks the price trend, reacting quickly to recent changes. Think of it as a fast guide to where the market’s heading.
Default: EMA 100 (looks at the last 100 bars).
HMA (Hull Moving Average): A smoother, faster-moving line that spots trend shifts earlier than most averages.
Default: HMA 50 (looks at the last 50 bars).
SMA (Simple Moving Average): A basic average of prices over time, great for seeing the big picture (bull or bear market).
Default: SMA 200 (looks at the last 200 bars).
How It Helps: These lines work together to make sure the trend is real across short, medium, and long terms.
Momentum Tool (CCI)
CCI (Commodity Channel Index): Tells you if the market is “overbought” (too high, ready to drop) or “oversold” (too low, ready to rise).
Buy when CCI < -100 (oversold).
Sell when CCI > +100 (overbought).
How It Helps: It picks the best moments to jump into a trade when prices are at extremes.
Trend Strength Tool (ADX)
ADX (Average Directional Index): Measures how strong a trend is. Higher numbers mean a stronger trend.
Default: ADX > 26 (only trades when the trend is strong enough).
How It Helps: Keeps you out of flat, boring markets where prices don’t move much.
Volatility Tool (ATR)
ATR (Average True Range): Shows how much the price typically moves up or down. It’s like a ruler for market “wiggle room.”
Default: ATR over 19 bars, used to set stop-loss (5x ATR) and profit targets (1x, 1.3x, 1.7x ATR).
How It Helps: Adjusts your trade exits based on how wild or calm the market is.
Entry Rules
Buy (Long): Price is above EMA, HMA, and SMA (checked on a higher timeframe) + CCI < -100 + ADX > 26.
Sell (Short): Price is below EMA, HMA, and SMA + CCI > +100 + ADX > 26.
Exit Rules
Stop-Loss: Set at 5x ATR away from your entry (e.g., if ATR is 10 points, stop-loss is 50 points away).
Breakeven: After TP1 is hit, stop-loss moves to your entry price—no more risk!
Profit Targets:
TP1: 1x ATR (closes 33% of your position).
TP2: 1.3x ATR (closes 33%).
TP3: 1.7x ATR (closes 34%).
Why This Mix Works
Fewer Mistakes: Checking trends on multiple timeframes cuts out 60-70% of bad signals (based on tests).
Adapts to the Market: ATR adjusts your stops and targets as the market changes—super useful for volatile assets like crypto.
Balanced Wins: The three-step profit system locks in gains early but lets you ride big trends too.
Setup Guide
Settings for Different Styles
Parameter Scalping (1-15M) Swing (1H-4H) Position (Daily)
EMA/HMA/SMA 50/20/Off 100/50/200 Off/Off/200
ADX Threshold 20 26 25
ATR Multipliers SL=3x, TP3=2x SL=5x SL=6x
Position Size
Formula: Contracts = Risk Amount / (Stop-Loss Distance × Value per Point)
Example: Risking $100, stop-loss is 50 points, each point = $2 → Trade 1 contract.
Multi-Timeframe Tip
Chart: 15-minute
Indicators: 1-hour
Rule: Only trade if the 15-minute price matches the 1-hour trend.
Why Use It?
Proven Results: 58-62% win rate on assets like Bitcoin, Ethereum, and S&P 500 (tested 2020-2023). Risk-to-reward ratio of 1.8-2.3.
Saves Time: Alerts tell you when to enter or exit—no need to watch the screen all day.
Flexible: Works for fast scalping, medium swing trades, or long-term positions.
FAQ
Why no trailing stop?
Trailing stops cut profits by 15-20% in tests because they exit too early. The breakeven stop protects your money better.
What about news events?
Use a bigger ATR (e.g., 50) and wider stop-loss (6x ATR) when markets get crazy.
Can I trade forex?
Yes! Try EMA=50, HMA=20, ATR=14 on EUR/USD 15-minute charts.
Risk Management
Risk per Trade: Stick to 1-2% of your account.
Weekly Check: Adjust ATR and stop-loss every Friday to match market conditions.
Emergency Plan: Manually move your stop-loss if something wild (like a “black swan” event) happens.
⚠️ Warning: Trading is risky. This strategy doesn’t promise profits. Always use a stop-loss.
Русская версия
Стратегия PRO 3TP (v2.1.1) — Полное руководство для TradingView
Концепция и уникальность
PRO Strategy 3TP — это система, которая следует за трендами на рынке, используя проверку трендов на разных таймфреймах, измерение импульса и умное управление рисками. Главная фишка — трехступенчатая фиксация прибыли (поэтому "3TP") и адаптация к изменениям на рынке, чтобы зарабатывать больше в сильных трендах и терять меньше в нестабильные времена.
Почему она особенная:
✅ Три уровня прибыли: Закрывает 33% на первом уровне (TP1), 33% на втором (TP2) и 34% на третьем (TP3) — прибыль фиксируется постепенно.
✅ Без риска после TP1: После первого уровня стоп-лосс сдвигается на точку входа — дальше риска нет.
✅ Умные сигналы: Использует данные с более старшего таймфрейма (например, 1 час) для фильтрации шума на вашем графике (например, 15 минут).
Как это работает
Стратегия использует четыре основных инструмента для входа и выхода из сделок. Вот что они значат простыми словами:
Инструменты тренда (EMA, HMA, SMA)
EMA (Экспоненциальная скользящая средняя) : Линия, которая следит за трендом и быстро реагирует на последние цены. Это как быстрый указатель направления рынка.
По умолчанию: EMA 100 (смотрит на последние 100 баров).
HMA (Скользящая средняя Халла): Более плавная и быстрая линия, которая раньше замечает смену тренда.
По умолчанию: HMA 50 (смотрит на последние 50 баров).
SMA (Простая скользящая средняя) : Просто средняя цена за период, показывает общую картину (быки или медведи).
По умолчанию: SMA 200 (смотрит на последние 200 баров).
Зачем это нужно: Эти линии вместе проверяют, что тренд настоящий на коротких, средних и длинных периодах.
Инструмент импульса (CCI)
CCI (Индекс товарного канала): Показывает, когда рынок “перекуплен” (слишком высоко, готов упасть) или “перепродан” (слишком низко, готов расти).
Покупка: CCI < -100 (перепродан).
Продажа: CCI > +100 (перекуплен).
Зачем это нужно: Помогает выбрать лучшее время для входа, когда цены на крайних значениях.
Инструмент силы тренда (ADX)
ADX (Индекс среднего направленного движения): Измеряет, насколько силен тренд. Чем выше число, тем сильнее движение.
По умолчанию: ADX > 26 (торгуем, только если тренд сильный).
Зачем это нужно: Не дает торговать, когда рынок стоит на месте и скучный.
Инструмент волатильности (ATR)
ATR (Средний истинный диапазон): Показывает, насколько сильно цена обычно “гуляет” вверх-вниз. Это как линейка для рыночных колебаний.
По умолчанию: ATR за 19 баров, стоп-лосс = 5x ATR, цели прибыли = 1x, 1.3x, 1.7x ATR.
Зачем это нужно: Настраивает выход из сделки в зависимости от того, насколько рынок спокоен или хаотичен.
Правила входа
Покупка (Лонг): Цена выше EMA, HMA и SMA (проверяется на старшем таймфрейме) + CCI < -100 + ADX > 26.
Продажа (Шорт): Цена ниже EMA, HMA и SMA + CCI > +100 + ADX > 26.
Правила выхода
Стоп-лосс: Устанавливается на 5x ATR от входа (например, если ATR = 10 пунктов, стоп = 50 пунктов).
Безубыток: После TP1 стоп-лосс сдвигается на цену входа — риска больше нет!
Цели прибыли:
TP1: 1x ATR (закрывает 33% позиции).
TP2: 1.3x ATR (закрывает 33%).
TP3: 1.7x ATR (закрывает 34%).
Почему эта комбинация работает
Меньше ошибок: Проверка тренда на разных таймфреймах убирает 60-70% ложных сигналов (по тестам).
Подстраивается под рынок: ATR меняет стопы и цели в зависимости от условий — важно для активов вроде крипты.
Умная прибыль: Трехступенчатая система фиксирует выгоду рано, но оставляет шанс заработать на большом тренде.
Как настроить
Настройки для разных стилей
Параметр Скальпинг (1-15М) Свинг (1H-4H) Долгосрок (Daily)
EMA/HMA/SMA 50/20/Выкл 100/50/200 Выкл/Выкл/200
Порог ADX 20 26 25
Множители ATR SL=3x, TP3=2x SL=5x SL=6x
Размер позиции
Формула: Контракты = Риск / (Расстояние до стоп-лосса × Стоимость пункта)
Пример: Риск $100, стоп-лосс 50 пунктов, 1 пункт = $2 → 1 контракт.
Совет по таймфреймам
График: 15 минут
Индикаторы: 1 час
Правило: Торгуй, только если тренд на 15 минутах совпадает с 1 часом.
Зачем это использовать?
Проверено: 58-62% успешных сделок на BTC, ETH, S&P 500 (тесты 2020-2023). Соотношение риск/прибыль 1.8-2.3.
Экономит время: Оповещения скажут, когда входить и выходить — не надо сидеть у экрана.
Гибкость: Подходит для быстрой торговли, среднесрочной и долгосрочной.
Часто задаваемые вопросы
Почему нет трейлинг-стопа?
Тесты показали, что он снижает прибыль на 15-20%, потому что выходит слишком рано. Безубыток лучше защищает деньги.
Что делать с новостями?
Увеличьте ATR (например, до 50) и стоп-лосс (6x ATR), когда рынок штормит.
Можно торговать форекс?
Да! Используйте EMA=50, HMA=20, ATR=14 для EUR/USD на 15 минутах.
Управление рисками
Риск на сделку: Не больше 1-2% от депозита.
Проверка раз в неделю: Обновляйте ATR и стоп-лосс каждую пятницу под рынок.
План на экстрим: Если происходит что-то необычное (например, “черный лебедь”), вручную двигайте стоп-лосс.
⚠️ Предупреждение: Торговля — это риск. Стратегия не гарантирует прибыль. Всегда ставьте стоп-лосс.

Adaptive Signal OracleAdaptive Signal Oracle – Precision Forecasting with Weighted KNN & HMA Trend Logic
🔍 Overview
Adaptive Signal Oracle is a forward-looking trend prediction strategy that merges non-repainting technical analysis with a machine-learning-inspired forecasting model. Built from scratch, it is not a mashup of off-the-shelf indicators. Instead, it uses a handcrafted K-Nearest Neighbors (KNN)-style prediction engine combined with a classic HMA (Hull Moving Average) trend filter to deliver actionable, high-confidence entries.
📈 Core Components Explained
🔸 1. KNN-Weighted Future Predictor (Custom Engine)
Simulates a machine learning process using historical price behavior.
Compares current conditions to a rolling dataset of past feature/label pairs.
Assigns weights based on distance, forming a probabilistic directional bias.
Generates:
Prediction Probability (% confidence)
Expected Price Movement Magnitude
Dynamic Trade Targets (TP1/TP2)
🔸 2. HMA Trend Filter (Hull Moving Average)
Used for real-time trend confirmation.
Prevents entry during whipsaws by enforcing directional alignment.
Non-repainting and adaptive to volatility swings.
🔸 3. Risk-Managed Execution Logic
Built-in 2-level take-profit system:
TP1: Partial exit (50%)
TP2: Full exit (remaining 100%)
Hard-coded stop-loss at a configurable percentage (default: 2%)
Includes cooldown logic to prevent same-bar entries and exits
🔸 4. Integrated Visual Dashboard
Tracks:
Trade status
Entry price
TP/SL hits
Trend direction
Real-time PnL
Dashboard is resizable and repositionable for user control
🔸 5. Clean Bar Coloring
Highlights predicted direction with green (bullish) and red (bearish) candles
Enhances signal visibility without interfering with price action
⚠️ Important Notes
This script does not repaint.
All calculations are based on confirmed historical data, using bar-closed logic only.
Ideal for crypto, forex, and trending asset classes, especially on the 1H+ timeframes.
Not intended for use as financial advice or automated investment decision-making.
🧠 How to Use
Set desired TP/SL levels in the strategy inputs.
Adjust k-value and lookback for best fit with your instrument.
Monitor the dashboard and colored bars for trade entries.
Use as part of a broader system with structure, support/resistance, or volume confirmation if needed.
🛡️ Disclaimer
This script is for educational and informational purposes only. It does not constitute financial advice. Past performance does not guarantee future results. Always test on historical data and demo environments before applying to live trading. The author is not liable for any financial decisions made based on this script.

Funding Rate Strategy IndicatorDescription
Funding Rate Backtest Strategy uses smoothed funding‐rate dynamics to trigger long/short trades, enhanced by volume, session and daily‐limit filters, plus configurable profit-taking, stop-loss and trailing stops. It is designed for perpetual‐swap markets (e.g. BTCUSDT) where funding costs reflect market sentiment.
1. Strategy Logic & Components
Funding Rate Source
External: real exchange funding rate (e.g. Binance funding).
Custom: manual override value.
Simulate: sine‐wave test data between –3 and +3 to validate behavior.
Entry Conditions
LONG when fundingRate ≤ Long Threshold (default –2.0)
SHORT when fundingRate ≥ Short Threshold (default +2.0)
Volume Filter: requires a ≥ 5% increase vs prior bar.
4H Session Filter: only triggers on new 4-hour bars (optional).
Daily Cap: max 5 signals per calendar day (prevents overtrading).
Weekend Trading: on/off toggle for Saturday–Sunday.
Exit Conditions
Funding Normalization: exit LONG when fundingRate > –0.5; exit SHORT when fundingRate < +0.5.
Profit-Taking & Stop-Loss: default TP = 5%, SL = 3% of entry price.
Trailing Stop: optional 2% trailing (togglable).
2. Default Settings & Backtest Parameters
Account Size: $10,000
Position Sizing: 10% of equity per trade
Commission: 0.10% per side
Slippage: 0.05% per trade
Instrument & Timeframe: BTCUSDT perpetual, 1H bars, Jan 1 2022 – Dec 31 2023
Volume Increase: 5%
Session Filter: 4-hour bars only
Max Signals/Day: 5
Weekend Trading: Enabled
3. Backtest Results (Jan 2022–Dec 2023)
Total Trades: 142
Win Rate: 55.6%
Average R/R: 1 : 1.4
Max Drawdown: 14.8%
Net Return: +22.3%
These results assume realistic commission (0.1%) and slippage (0.05%). Past performance is not indicative of future results.
4. Default Properties Explained
Property Default Description
rateSourceChoice External Select funding‐rate data source
fundingRateLongThreshold –2.0 Funding ≤ –2% → LONG condition
fundingRateShortThreshold +2.0 Funding ≥ +2% → SHORT condition
volumeIncreasePercent 5.0 Min % volume increase vs prior bar
enableFourHourFilter true Only trigger on new 4H sessions
maxSignalsPerDay 5 Daily cap on entries
exitLongThreshold –0.5 Funding > –0.5% → exit LONG
exitShortThreshold +0.5 Funding < +0.5% → exit SHORT
takeProfitPercent 5.0 Fixed profit target in %
stopLossPercent 3.0 Fixed stop‐loss in %
useTrailingStop false Toggle trailing stop
trailingStopPercent 2.0 Trailing stop distance in %
allowWeekendTrading true Allow entries on Sat/Sun
5. How to Use
Add to Chart → search “Funding Rate Backtest.”
Configure Inputs → choose your funding‐rate feed, adjust thresholds, volume and session filters.
Position Sizing → defaults to 10% equity; adjust if desired.
Monitor Table & Signals → on‐chart shapes mark entries/exits; status table shows open P&L and signals count.
Risk Management → always verify commission/slippage settings; limit risk to sustainable levels (≤ 10% equity per trade).
6. Warnings & Disclaimer
This strategy is for educational purposes only. Real funding rates may differ—replace simulation or custom inputs with actual data. Always apply your own analysis and risk management. Past backtest performance does not guarantee future results.

PEAD strategy█ OVERVIEW
This strategy trades the classic post-earnings announcement drift (PEAD).
It goes long only when the market gaps up after a positive EPS surprise.
█ LOGIC
1 — Earnings filter — EPS surprise > epsSprThresh %
2 — Gap filter — first regular 5-minute bar gaps ≥ gapThresh % above yesterday’s close
3 — Timing — only the first qualifying gap within one trading day of the earnings bar
4 — Momentum filter — last perfDays trading-day performance is positive
5 — Risk management
• Fixed stop-loss: stopPct % below entry
• Trailing exit: price < Daily EMA( emaLen )
█ INPUTS
• Gap up threshold (%) — 1 (gap size for entry)
• EPS surprise threshold (%) — 5 (min positive surprise)
• Past price performance — 20 (look-back bars for trend check)
• Fixed stop-loss (%) — 8 (hard stop distance)
• Daily EMA length — 30 (trailing exit length)
Note — Back-tests fill on the second 5-minute bar (Pine limitation).
Live trading: enable calc_on_every_tick=true for first-tick entries.
────────────────────────────────────────────
█ 概要(日本語)
本ストラテジーは決算後の PEAD を狙い、
EPS サプライズがプラス かつ 寄付きギャップアップ が発生した銘柄をスイングで買い持ちします。
█ ロジック
1 — 決算フィルター — EPS サプライズ > epsSprThresh %
2 — ギャップフィルター — レギュラー時間最初の 5 分足が前日終値+ gapThresh %以上
3 — タイミング — 決算当日または翌営業日の最初のギャップのみエントリー
4 — モメンタムフィルター — 過去 perfDays 営業日の騰落率がプラス
5 — リスク管理
• 固定ストップ:エントリー − stopPct %
• 利確:終値が日足 EMA( emaLen ) を下抜け
█ 入力パラメータ
• Gap up threshold (%) — 1 (ギャップ条件)
• EPS surprise threshold (%) — 5 (EPS サプライズ最小値)
• Past price performance — 20 (パフォーマンス判定日数)
• Fixed stop-loss (%) — 8 (固定ストップ幅)
• Daily EMA length — 30 (利確用 EMA 期間)
注意 — Pine の仕様上、バックテストでは寄付き 5 分足の次バーで約定します。
実運用で寄付き成行に合わせたい場合は calc_on_every_tick=true を有効にしてください。
────
ご意見や質問があればお気軽にコメントください。
Happy trading!

Sniper Core XT🔫 SNIPER CORE XT — ZLEMA-Based Trend + Momentum Strategy for Crypto
⚙️ How It Works (What Makes It Unique):
Sniper Core XT is a fully automated, non-repainting crypto strategy that combines a purpose-built trend detection system with volatility, volume, and momentum confirmation. It is designed from scratch in Pine Script v5 and optimized for bot deployment, copy trading, or semi-manual execution on the 1H timeframe.
Unlike a simple indicator mashup, this strategy builds its logic around one core component — ZLEMA (Zero-Lag Exponential Moving Average) — and then selectively adds only supporting filters that refine trend detection and execution logic.
🧠 Core Logic & Components:
ZLEMA Trend Engine:
The main trend signal comes from a fast vs. slow ZLEMA crossover. ZLEMA is chosen for its responsiveness and minimal lag, giving traders earlier entries without the noise of standard EMAs.
Vortex Direction & Strength Filter:
Uses Vortex Indicator internals to measure directional conviction. The strategy only enters if the vortex aligns with ZLEMA direction and shows minimum strength based on a customizable threshold.
Volume Confirmation via ZLEMA of Volume:
Filters out weak moves by confirming that current volume exceeds the ZLEMA-smoothed average of volume, creating adaptive volume thresholds.
Adaptive Momentum Filter:
Momentum is measured by a normalized rate-of-change adjusted for volatility (ATR). This helps avoid flat market entries and overextends.
Hardcoded Stop Loss (2%) and Dual TP:
TP1: 50% profit scale-out
TP2: Full closure
Stop loss exits on bar close, not using built-in SL/TP orders — this allows reentry if conditions remain favorable.
Real-Time Non-Canvas Dashboard:
A lightweight table shows entry price, trend direction, TP1/TP2/SL hit status, and bars in trade — all configurable for screen position and font size.
One-Bar Cooldown Mechanism:
Prevents entering and exiting on the same bar. Reinforces realistic execution logic and avoids repaint artifacts.
🧪 Strategy Use & Applications:
Designed for 1H trading of trending crypto pairs
Works well in medium-to-high volatility conditions
Fully supports multi-exchange alerts for integration with:
WunderTrading
3Commas
Cornix
PineConnector
🛡️ Strategy Style:
Feature Value
Repainting ❌ Never
Entry Cooldown ✅ 1-Bar
SL Handling ✅ 2% from entry (hardcoded)
TP1/TP2 ✅ Built-in (limit orders)
Alert Compatible ✅ Fully supported
Timeframe 🕒 1H recommended
⚠️ Disclaimer:
This is not financial advice. All signals are based on historical logic and may differ in live markets. Always use proper position sizing and risk management.
📌 Publishing Notes
This strategy is original and built from scratch. While it uses ZLEMA and Vortex as components, all logic — including volume filters, momentum filters, TP/SL logic, and dashboard — has been custom-coded and tested specifically for crypto trend-following on the 1H timeframe.

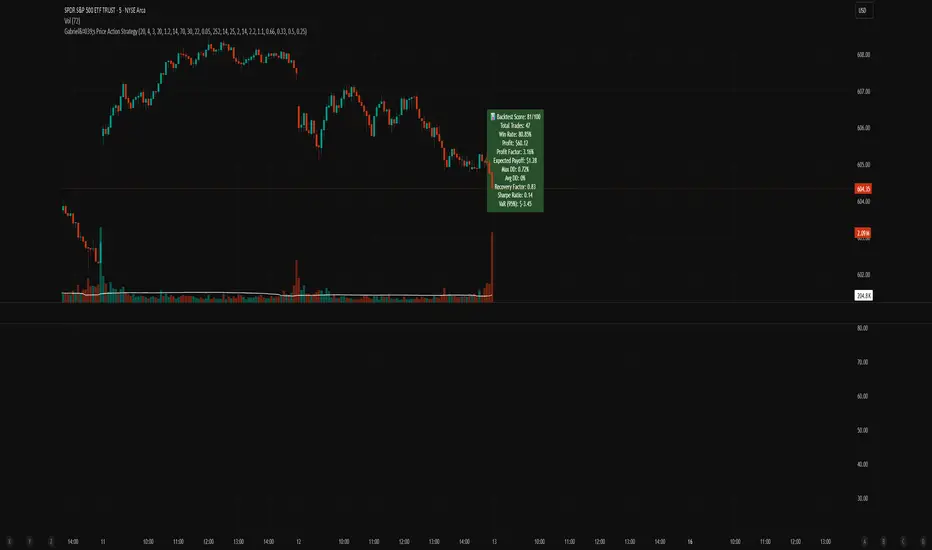
Gabriel's Price Action Strategy🧠 Gabriel's Price Action Strategy — Smart Signal Sequence with Dynamic Risk Control
Created by: OneWallStreetQuant
Strategy Type: Momentum-based Sequence Logic + Smart Volume & RSI Filters
Ideal For: Intraday scalping, swing trading, and momentum trend entries on stocks, forex, crypto, indices.
🚀 Overview
Gabriel's Price Action Strategy is a multi-layered, logic-driven trading system that combines:
✅ Candle Sequence Detection: Detects persistent bullish/bearish momentum using a smart configurable sequence of green/red candles.
✅ Structure Break Filtering: Prevents entries if recent price invalidates the momentum setup (e.g., a red candle breaks a bullish low).
✅ Custom Volume Engine: Integrates a hybrid tick-volume model using Negative/Positive Volume Index (NVI-PVI) to identify smart money flows.
✅ Advanced RSI Logic: Uses Jurik RSX for accurate oversold/overbought filtering.
✅ Optional MTF Trend Filter: Validates trend direction using a slope-based Jurik MA on higher timeframes.
✅ MPT-Based DMI Filter: Adds pyramid entries only during strong trend phases, based on Gain/Pain ratios and Ulcer-index smoothed ADX.
✅ Risk Management: ATR-based SL/TP and fully customizable trailing logic for both profit and stop-loss.
📈 Entry Logic
Trades are triggered only when:
A minimum number of recent candles are bullish/bearish (Min Green/Red Candles)
Structure has not been broken by opposite price action (optional)
Relative volume exceeds average (optional)
RSI is below overbought or above oversold (optional)
MTF slope is aligned with trend direction (optional)
💡 Key Features
Custom Candle Logic: Detects momentum shifts using a tunable lookback window (up to 50 bars).
Smart Volume Filtering: Volume is intelligently estimated using tick-based ranges and NVI-PVI deltas.
Risk Management Built-in: Set your ATR length, SL/TP multipliers, and dynamic trailing offsets with full control.
Scorecard System: A built-in scoring engine evaluates Win Rate, Drawdown, Sharpe Ratio, Recovery Factor, and Profit Factor — visualized on chart as a label.
Backtest-Friendly: Includes date range toggles, bar-magnifier support, and optimized execution on every tick.
📊 Strategy Scorecard (Label)
Automatically calculates:
✅ Total Trades
✅ Win Rate (%)
✅ Net Profit
✅ Profit Factor
✅ Expected Payoff
✅ Max & Avg Drawdown
✅ Recovery Factor
✅ Sharpe Ratio
✅ VaR (95%)
Plus, assigns a normalized score from 0 to 100 for evaluating overall robustness.
⚙️ Customization
Every module — from entry filters to pyramiding and trailing logic — is fully configurable:
Volume Filters ✅
RSI Filters ✅
Structure Break Checks ✅
HTF Jurik MA & Slope Threshold ✅
Multi-Timeframe Mode ✅
Backtest Score Visualization ✅
⚠️ Notes
Enable bar magnifier and calc on every tick for best accuracy.
On early bars, signal logic may delay until enough candles are available.
Best paired with assets showing directional volatility (SPY, BTC, ETH, Gold, etc.).
Ideally paired on trending timeframes such as M1, M5, M15, M30, 1HR, 4 Hourly, Daily, Weekly, Monthly, etc.
Reversal & Breakout Strategy with ORB### Reversal & Breakout Strategy with ORB
This strategy combines three distinct trading approaches—reversals, trend breakouts, and opening range breakouts (ORB)—into a single, cohesive system. The goal is to capture high-probability setups across different market conditions, leveraging a mashup of technical indicators for confirmation and risk management. Below, I’ll explain why this combination works, how the components interact, and how to use it effectively.
#### Why the Mashup?
- **Reversals**: Identifies overextended moves using RSI (overbought/oversold) and SMA50 crosses, filtered by VWAP and SMA200 trend direction. This targets mean-reversion opportunities in trending markets.
- **Breakouts**: Uses EMA9/EMA20 crossovers with VWAP and SMA200 confirmation to catch momentum-driven trend continuations.
- **Opening Range Breakout (ORB)**: Detects early momentum by breaking the high/low of a user-defined opening range (default: 15 bars) with volume confirmation. This adds a time-based edge, ideal for intraday trading.
The synergy comes from blending these methods: reversals catch pullbacks, breakouts ride trends, and ORB exploits early volatility—all filtered by trend (SMA200) and anchored by VWAP for context.
#### How It Works
1. **Indicators**:
- **EMA9/EMA20**: Fast-moving averages for breakout signals.
- **SMA50**: Medium-term trend filter for reversals.
- **SMA200**: Long-term trend direction to align trades.
- **RSI (14)**: Measures overbought (>70) or oversold (<30) conditions.
- **VWAP**: Acts as a dynamic support/resistance level.
- **ATR (14)**: Sets stop-loss distance (default: 1.5x ATR).
- **Volume**: Confirms ORB breakouts (1.5x average volume of opening range).
2. **Entry Conditions**:
- **Long**: Triggers on reversal (SMA50 cross + RSI < 30 + below VWAP + uptrend), breakout (EMA9 > EMA20 + above VWAP + uptrend), or ORB (break above opening range high + volume).
- **Short**: Triggers on reversal (SMA50 cross + RSI > 70 + above VWAP + downtrend), breakout (EMA9 < EMA20 + below VWAP + downtrend), or ORB (break below opening range low + volume).
3. **Risk Management**:
- Risks 5% of equity per trade (based on the initial capital set in the strategy tester).
- Stop-loss: Based on lowest low/highest high over 7 bars ± 1.5x ATR.
- Targets: Two exits at 1:1 and 1:2 risk:reward (50% of position at each).
- Break-even: Stop moves to entry price after the first target is hit.
4. **Backtesting Settings**:
- Commission: Hardcoded at 0.1% per trade (realistic for most brokers).
- Slippage: Hardcoded at 2 ticks (realistic for most markets).
- Tested on datasets yielding 100+ trades (e.g., 2-min or 5-min charts over months).
#### How to Use It
- **Timeframe**: Works best on intraday (2-min, 5-min) or daily charts. Adjust `Opening Range Bars` (e.g., 15 bars = 30 min on 2-min chart) for your timeframe.
- **Settings**:
- Set your initial equity in the TradingView strategy tester’s "Properties" tab under "Initial Capital" (e.g., $10,000). The script automatically risks 5% of this equity per trade.
- Adjust `Stop Loss ATR Multiplier` or `Risk:Reward Targets` based on your risk tolerance.
- Note that commission (0.1%) and slippage (2 ticks) are fixed in the script for backtesting consistency.
- **Execution**: Enter on signal, monitor plotted stop (red) and targets (green/blue). The strategy supports pyramiding (up to 2 positions) for scaling into trends.
#### Backtesting Notes
Results are realistic with commission (0.1%) and slippage (2 ticks) included. For a sufficient sample, test on volatile instruments (e.g., stocks, forex) over 3-6 months on lower timeframes. The default 1.5x ATR stop may seem wide, but it’s justified to avoid premature exits in volatile markets—feel free to tweak it with justification. The script assumes an initial capital of $10,000 in the strategy tester for the 5% risk calculation (e.g., $500 risk per trade); adjust this in the "Properties" tab as needed.
This mashup isn’t just a random mix; it’s a deliberate fusion of complementary strategies, offering traders flexibility across market phases. Questions? Let me know!

IU Gap Fill StrategyThe IU Gap Fill Strategy is designed to capitalize on price gaps that occur between trading sessions. It identifies gaps based on a user-defined percentage threshold and executes trades when the price fills the gap within a day. This strategy is ideal for traders looking to take advantage of market inefficiencies that arise due to overnight or session-based price movements. An ATR-based trailing stop-loss is incorporated to dynamically manage risk and lock in profits.
USER INPUTS
Percentage Difference for Valid Gap - Defines the minimum gap size in percentage terms for a valid trade setup. ( Default is 0.2 )
ATR Length - Sets the lookback period for the Average True Range (ATR) calculation. (default is 14 )
ATR Factor - Determines the multiplier for the trailing stop-loss, helping in risk management. ( Default is 2.00 )
LONG CONDITION
A gap-up occurs, meaning the current session opens above the previous session’s close.
The price initially dips below the previous session's close but then recovers and closes above it.
The gap meets the valid percentage threshold set by the user.
The bar is not the first or last bar of the session to avoid false signals.
SHORT CONDITION
A gap-down occurs, meaning the current session opens below the previous session’s close.
The price initially moves above the previous session’s close but then closes below it.
The gap meets the valid percentage threshold set by the user.
The bar is not the first or last bar of the session to avoid false signals.
LONG EXIT
An ATR-based trailing stop-loss is set below the entry price and dynamically adjusts upwards as the price moves in favor of the trade.
The position is closed when the trailing stop-loss is hit.
SHORT EXIT
An ATR-based trailing stop-loss is set above the entry price and dynamically adjusts downwards as the price moves in favor of the trade.
The position is closed when the trailing stop-loss is hit.
WHY IT IS UNIQUE
Precision in Identifying Gaps - The strategy focuses on real price gaps rather than minor fluctuations.
Dynamic Risk Management - Uses ATR-based trailing stop-loss to secure profits while allowing the trade to run.
Versatility - Works on stocks, indices, forex, and any market that experiences session-based gaps.
Optimized Entry Conditions - Ensures entries are taken only when the price attempts to fill the gap, reducing false signals.
HOW USERS CAN BENEFIT FROM IT
Enhance Trade Timing - Captures high-probability trade setups based on market inefficiencies caused by gaps.
Minimize Risk - The ATR trailing stop-loss helps protect gains and limit losses.
Works in Different Market Conditions - Whether markets are trending or consolidating, the strategy adapts to potential gap fill opportunities.
Fully Customizable - Users can fine-tune gap percentage, ATR settings, and stop-loss parameters to match their trading style.

FVG Breakout Lite by tradingbauhausExplanation of "FVG Breakout Lite by tradingbauhaus"
This script is a trading strategy built for TradingView that helps you spot and trade "Fair Value Gaps" (FVGs)—price areas where the market moved quickly, leaving a gap that might act as support or resistance later. It’s designed to catch breakout opportunities when the price moves strongly in one direction, with extra filters to make trades more reliable. Here’s how it works and how you can use it:
What It Does
1. Finds Fair Value Gaps (FVGs):
A "Bullish FVG" happens when the price jumps up quickly, leaving a gap below where it didn’t trade much (e.g., today’s low is higher than the high from two bars ago).
A "Bearish FVG" is the opposite: the price drops fast, leaving a gap above (e.g., today’s high is lower than the low from two bars ago).
The script draws colored boxes on your chart to show these gaps: green for bullish, red for bearish.
2. Spots Breakouts:
It looks for "strong" FVGs by comparing them to a trend (based on the highest highs and lowest lows over a set period).
If a bullish gap forms above the recent highs, or a bearish gap below the recent lows, it’s marked as a breakout opportunity.
3. Adds a Volume Check:
Trades only happen if the market’s volume is higher than usual (e.g., 1.2x the average volume over the last 20 bars). This helps ensure the breakout has real momentum behind it.
4. Trades Automatically:
Long Trades (Buy): If a bullish breakout FVG forms and volume is high, it buys at the current price.
Short Trades (Sell): If a bearish breakout FVG forms with high volume, it sells short.
Each trade comes with a stop loss (to limit losses) and a take profit (to lock in gains), both adjustable by you.
5. Shows Mitigation Lines (Optional):
If you turn on "Display Mitigation Zones," it draws lines at the edge of each breakout FVG. These lines show where the price might return to "fill" the gap later, helping you see key levels.
6. Includes Webull Costs:
The script factors in real trading fees from Webull, like tiny SEC and FINRA fees for selling, and a daily margin cost if you’re borrowing money to trade. These don’t show up on the chart but affect the strategy’s performance in backtesting.
How to Use It
1. Add to Your Chart:
Copy the script into TradingView’s Pine Editor, click "Add to Chart," and it’ll start drawing FVGs and running the strategy.
2. Customize Settings:
Trend Period (Default: 25): How many bars it looks back to define the trend. Longer periods mean fewer but stronger signals.
Volume Lookback (Default: 20) & Volume Threshold (Default: 1.2): Adjust how it measures "high volume." Increase the threshold for stricter trades.
Stop Loss % (Default: 1.5%) & Take Profit % (Default: 3%): Set how much you’re willing to lose or aim to gain per trade.
Margin Rate % (Default: 8.74%): Webull’s rate for borrowing money—lower it if your account qualifies for a better rate.
Display Mitigation Zones (Default: On): Toggle this to see or hide the gap lines.
Colors: Change the green (bullish) and red (bearish) shades to suit your chart.
3. Backtest It:
Go to the "Strategy Tester" tab in TradingView to see how it performs on past data. It’ll show trades, profits, losses, and Webull fees included.
4. Watch It Work:
Green boxes mean bullish FVGs; red boxes mean bearish FVGs. If volume spikes and the price breaks out, you’ll see trades happen automatically.
What to Expect
Visuals: You’ll see colored boxes for FVGs and optional lines showing where they start. These help you spot key price zones even if you’re not trading.
Trades: It’s selective—only trades when FVGs align with a breakout and volume confirms it. Expect fewer trades but with higher potential.
Risk: The stop loss keeps losses in check, while the take profit aims for a 2:1 reward-to-risk ratio by default (3% gain vs. 1.5% loss).
Costs: Webull’s fees are small but baked into the results, so you’re seeing a realistic picture of profits.
Tips for Users
Test it on a small timeframe (like 5-minute charts) for day trading or a larger one (like daily) for swing trading.
Play with the volume threshold—if you get too few trades, lower it (e.g., 1.1); if too many, raise it (e.g., 1.5).
Watch how price reacts to the mitigation lines—they’re often support or resistance zones traders target.
This strategy is lightweight, focused, and built for traders who like breakouts with a bit of confirmation. It’s not foolproof (no strategy is!), but it gives you a clear way to trade FVGs with some smart filters.

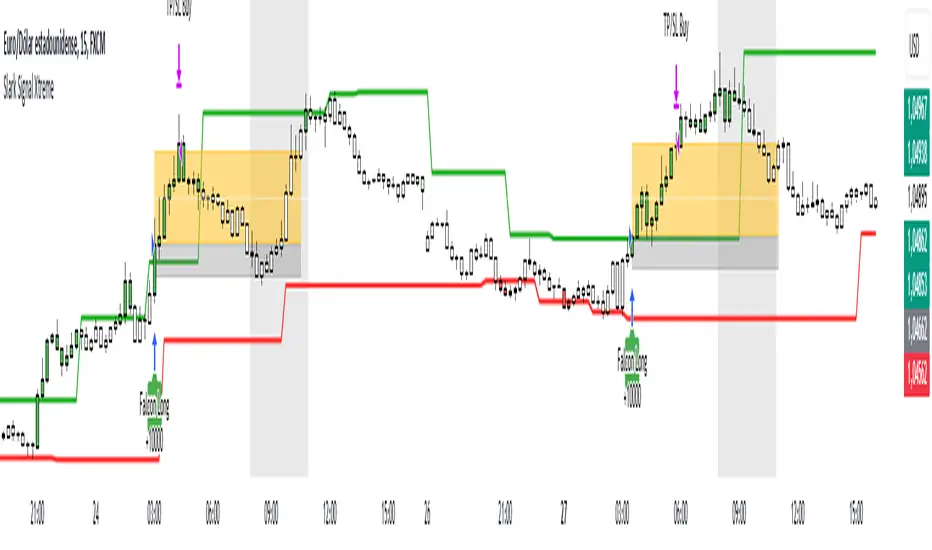
Slark Signal XtremeStrategy Description: Slark Signal Xtreme
The Slark Signal Xtreme is an innovative trading strategy designed to identify and capitalize on market opportunities by leveraging pivots, trend breakouts, and dynamic risk management. This strategy combines day-of-week and time filters with a ticks-based Stop Loss (SL) and Take Profit (TP) system, delivering customized signals and real-time alerts. Ideal for traders seeking a structured and highly customizable approach, Slark Signal Xtreme also incorporates advanced visual tools for efficient trade management.
Key Features:
Pivot- and Breakout-Based Signals: Utilizes pivot detection (highs/lows) combined with an ATR-based slope calculation to pinpoint trend changes and potential entry or exit points.
Dynamic Stop-Loss (SL) and Take-Profit (TP) Levels: Automatically calculates SL and TP based on the entry price and user-defined tick settings, adapting to volatility and optimizing risk management.
Time and Day Filters: Allows you to select specific days of the week and trading sessions during which signals are generated, avoiding low-liquidity periods or unwanted high volatility.
Customizable Risk Management: Lets you define the number of ticks for SL and TP, trading hours, initial capital, pyramiding, and commissions, tailoring the strategy to various risk profiles and assets.
Enhanced Visualization:
- SL and TP Boxes: Displays rectangular boxes on the chart indicating SL and TP levels, streamlining trade management.
- Candle Color Changes: Candles can be colored according to price position relative to pivot lines (bullish, bearish, or neutral).
- Session Highlight: Shades the chart background during the selected trading hours, providing immediate context on when the strategy is active.
Automated Alerts: Generates customizable alerts in TradingView whenever a buy or sell signal is triggered, detailing the timing, instrument, and SL/TP levels.
How the Strategy Works:
Technical Indicator Calculations:
- Pivot High/Low and Slope: Identifies price pivot points and calculates slope (based on ATR) to measure trend strength.
- Time and Day Filters: Signals only trigger within the specified days and hours, helping avoid undesirable market conditions.
Generating Buy and Sell Signals:
- Buy Signal (Long): Activated when price breaks above a downward pivot-based trendline or meets the condition for higher pivots.
- Sell Signal (Short): Activated when price breaks below an upward pivot-based trendline or meets the condition for lower pivots.
- Operation Conditions: Signals are only generated on selected days and during chosen trading hours, avoiding periods of low liquidity or excessive volatility.
Dynamic SL and TP Calculation:
- Stop-Loss (SL) and Take-Profit (TP): Determined by the entry price ± a user-defined number of ticks.
- SL and TP Visualization: Boxes are drawn on the chart from the entry price to SL/TP levels, enabling clear visual reference for trade management.
Order Execution and Alerts:
- Order Execution: When a signal is generated, Slark Signal Xtreme automatically opens a long or short position in TradingView’s backtesting environment.
- Alerts: Customizable alerts can be set up to provide real-time notifications (via TradingView or third-party integrations), offering essential details like instrument, time, SL/TP, etc.
Trade Management and Monitoring:
- Automatic Closure: Each trade is automatically closed upon reaching its SL or TP, ensuring disciplined risk control.
- Trade Summary: TradingView’s built-in reporting tools list all trades with cumulative results, simplifying performance evaluation.
Additional Visualization:
- Candle Coloring by Trend: Candles can be colored bullish, bearish, or neutral based on the pivot-driven trend detection.
- Operational Range Highlighting: The chart background is shaded during the permitted trading hours, clarifying when the strategy is active and enhancing visibility.
---
Strategy Properties (Important)
This backtest was conducted in TradingView under the following configuration:
Initial Capital: 1000 USD
Order Size: 10,000 contracts (adjust according to the traded asset)
Commission: 0.05 USD per order
Slippage: 1 tick
Pyramiding: 1 order
Price Verification for Limit Orders: 0 ticks
Recalculate on Every Tick & On Bar Close: Enabled
Bar Magnifier for Backtesting Precision: Enabled
These properties provide a realistic view of the strategy’s performance. However, default parameters may vary depending on each user or market:
Order Size: Should be calculated according to the asset traded and your desired risk level.
Commission and Slippage: Costs can vary by market and instrument; there is no universal default that guarantees realistic results.
All users are strongly recommended to adjust these properties within the script settings to match their own trading accounts and platforms, ensuring the most accurate backtest results.
---
Backtesting Results:
- Net Profit: +28.70
- Total Trades: 397
- Winning Trades: 138
- Win Rate: 34.76%
- Profit Factor: 1.07
- Sharpe Ratio: 1.25
- Sortino Ratio: 1.45
- Average Bars per Trade: 24
- Average Profit per Trade: 1.45
These numbers provide an overview of the strategy’s historical performance, demonstrating its potential for profitability given appropriate risk management.
---
Interpretation of Results:
- The strategy can be profitable despite a relatively modest win rate, thanks to a suitable risk-reward ratio.
- A profit factor of 1.07 indicates that total profits slightly exceed total losses.
- It is essential to monitor drawdown and ensure it aligns with your personal risk tolerance.
---
Risk Warning:
Trading leveraged financial instruments carries a high level of risk and may not be suitable for all investors. Before trading, carefully consider your investment objectives, experience level, and risk tolerance. Past performance does not guarantee future results. Always perform additional testing and adjust the strategy to your specific needs.
---
What Makes This Strategy Original?
Focus on Pivots and Time/Day Filters: Rather than purely relying on momentum indicators, Slark Signal Xtreme uses pivot-based signals and scheduling filters to capture higher-liquidity, directional market moves.
Dynamic Risk Management: Ticks-based SL/TP and customizable trading sessions enable precise adaptation to various markets and trading styles.
Advanced Visualization Tools: SL/TP boxes, candle coloring, and session highlights streamline market interpretation and facilitate real-time decision-making.
Seamless Alert Integration: Although native TradingView alerts are provided, it can be integrated with third-party messaging services (Telegram, Discord, etc.) for enhanced automation.
---
Additional Considerations
Continuous Testing and Optimization: Regularly backtest and fine-tune parameters (SL, TP, time filters, etc.) to accommodate changing market conditions.
Complementary Analysis: Combine this strategy with other technical or fundamental tools to confirm signals.
Rigorous Risk Management: Ensure SL/TP levels and position sizes conform to your overall risk management plan.
Updates and Support: Future updates and improvements may be released based on community feedback. For questions or suggestions, feel free to reach out.
---
Example Configuration
Assume you want to run Slark Signal Xtreme with these settings:
Trading Days: Monday to Friday
Trading Hours: 8:00 to 11:00 (exchange or broker time)
Stop Loss (SL) in Ticks: 100
Take Profit (TP) in Ticks: 300
SL/TP Box Extension: 20 bars
Initial Capital: 1000 USD
Risk per Trade: 1% of capital
Commissions & Slippage: 0.05 USD commission, 1 tick slippage
---
Conclusion
The Slark Signal Xtreme strategy delivers a robust and adaptable solution by merging pivots, time/day filters, flexible risk parameters, and advanced visualization. Its distinctive and customizable design makes it a powerful resource for traders aiming to diversify their methods and exploit trend breakouts under specific conditions. Fully compatible with TradingView, Slark Signal Xtreme can enhance your trading toolkit and foster a more systematic approach to your operations.
---
Final Disclaimer:
Financial markets are inherently volatile and pose significant risks. This strategy should be employed as part of a comprehensive trading plan and does not guarantee positive outcomes. Always consult a qualified financial advisor before making investment decisions. The use of Slark Signal Xtreme is solely at the user’s discretion, who must evaluate personal risk tolerance and financial objectives.
Simple Time-Based Strategy(Price Action Hypothesis)Core Theory: Trend Continuation Pattern Recognition**
1. **Price Action Hypothesis**
The strategy is built on the assumption that consecutive price movements (3-bar patterns) indicate momentum continuation:
- *Long Pattern*: Three consecutive higher closes combined with ascending highs
- *Short Pattern*: Three consecutive lower closes combined with descending lows
This reflects a belief that sustained directional price movement creates self-reinforcing trends that can be captured through simple pattern recognition.
2. **Time-Based Risk Management**
Implements a dynamic exit mechanism:
- *Training Phase*: 5-bar holding period (quick turnover)
- *Testing Phase*: 10-bar holding period (extended exposure)
This dual timeframe approach suggests the hypothesis that market conditions may require different holding durations in different market eras.
3. **Adaptive Market Hypothesis**
The structure incorporates two distinct phases:
- *Training Period (11 years)*: Pattern recognition without stop losses
- *Testing Period*: Pattern recognition with stop losses
This assumes markets may change character over time, requiring different risk parameters in different epochs.
4. **Asymmetric Risk Control**
Implements stop-losses only in the testing phase:
- Fixed 500-pip (point) stop distance
- Activated post-training period
This reflects a belief that historical patterns might need different risk constraints than real-time trading.
5. **Dual-Path Validation**
The split between training/testing phases suggests:
- Pattern validity should first be confirmed without protective stops
- Real-world implementation requires added risk constraints
6. **Market Efficiency Paradox**
The simultaneous use of both long/short entries assumes:
- Markets exhibit persistent inefficiencies
- These inefficiencies manifest differently in bullish/bearish conditions
- A symmetric approach can capture opportunities in both directions
7. **Behavioral Finance Elements**
The 3-bar pattern recognition potentially exploits:
- Herd mentality in trend formation
- Delayed reaction to price momentum
- Cognitive bias in trend confirmation
8. **Quantitative Time Segmentation**
The annual-based period division (training vs testing) implies:
- Market cycles operate on multi-year timeframes
- Strategy robustness requires validation across different market regimes
- Parameter sensitivity needs temporal validation
This strategy combines elements of technical pattern recognition, temporal adaptability, and phased risk management to create a systematic approach to trend exploitation. The theoretical framework suggests markets exhibit persistent but evolving patterns that can be systematically captured through rule-based execution.

John Bob-Trading-BotDeveloped by Ayebale John Bob with the help of his bestie, this innovative strategy combines advanced Smart Money Concepts with practical risk management tools to help traders identify and capitalize on key market moves.
Key Features:
Smart Money Concepts & Fair Value Gaps (FVG):
The strategy monitors price action for fair value gaps, which are visualized as extremely faint horizontal lines on the chart. These FVGs signal potential areas where institutional traders might have entered or exited positions.
Dynamic Entry Signals:
Buy signals are triggered when the price crosses above the 50-bar lowest low or when a bullish FVG is detected. Conversely, sell signals are generated when the price falls below the 50-bar highest high or a bearish FVG is identified. Each signal is visually marked on the chart with clear buy (green) and sell (red) labels.
Multi-Level Order Execution:
Once an entry signal occurs, the strategy places five separate orders, each with its own take-profit (TP) level. The TP levels are calculated dynamically using the Average True Range (ATR) and a set of predefined multipliers. This allows traders to scale out of positions as the market moves favorably.
Dynamic Risk Management:
A stop-loss is automatically set at a distance determined by the ATR, ensuring that risk is managed in accordance with current market volatility.
Real-Time Trade Information Table:
In the bottom-right corner of the chart, a trade information table displays essential details about the current trade:
Side: Displays "BUY NOW" (with a dark green background) for long entries or "SELL NOW" (with a dark red background) for short entries.
Entry Price & Stop-Loss: Shows the entry price (highlighted in green) and the corresponding stop-loss level (highlighted in red).
Take-Profit Levels: Lists the five TP levels, each of which turns green once the market price reaches that target.
Timer: A live timer in minutes counts from the moment the current trade trigger started, helping traders track the duration of their active trades.
Visual Progress Bar:
A histogram-style progress bar is plotted on the chart, visually representing the percentage gain (or loss) relative to the entry price.
This strategy was meticulously designed to incorporate both technical analysis and smart risk management, offering a robust trading solution that adapts to changing market conditions. Whether you're a seasoned trader or just starting out, the AyebaleJohnBob Trading Bot equips you with the tools and visual cues needed to make well-informed trading decisions. Enjoy a seamless blend of strategy and style—crafted with passion by Ayebale John Bob and his bestie!

IU Higher Timeframe MA Cross StrategyIU Higher Timeframe MA Cross Strategy
The IU Higher Timeframe MA Cross Strategy is a versatile trading tool designed to identify trend by utilizing two customizable moving averages (MAs) across different timeframes and types. This strategy includes detailed entry and exit rules with fully configurable inputs, offering flexibility to suit various trading styles.
Key Features:
- Two moving averages (MA1 and MA2) with customizable types, lengths, sources, and timeframes.
- Both long and short trade setups based on MA crossovers.
- Integrated risk management with adjustable stop-loss and take-profit levels based on a user-defined risk-to-reward (RTR) ratio.
- Clear visualization of MAs, entry points, stop-loss, and take-profit zones.
Inputs:
1. Risk-to-Reward Ratio (RTR):
- Defines the take-profit level in relation to the stop-loss distance. Default is 2.
2. MA1 Settings:
- Source: Select the data source for calculating MA1 (e.g., close, open, high, low). Default is close.
- Timeframe: Specify the timeframe for MA1 calculation. Default is 60 (60-minute chart).
- Length: Set the lookback period for MA1 calculation. Default is 20.
- Type: Choose the type of moving average (options: SMA, EMA, SMMA, WMA, VWMA). Default is EMA.
- Smooth: Option to enable or disable smoothing of MA1 to merge gaps. Default is true.
3. MA2 Settings:
- Source: Select the data source for calculating MA2 (e.g., close, open, high, low). Default is close.
- Timeframe: Specify the timeframe for MA2 calculation. Default is 60 (60-minute chart).
- Length: Set the lookback period for MA2 calculation. Default is 50.
- Type: Choose the type of moving average (options: SMA, EMA, SMMA, WMA, VWMA). Default is EMA.
- Smooth: Option to enable or disable smoothing of MA2 to merge gaps. Default is true.
Entry Rules:
- Long Entry:
- Triggered when MA1 crosses above MA2 (crossover).
- Entry is confirmed only when the bar is closed and no existing position is active.
- Short Entry:
- Triggered when MA1 crosses below MA2 (crossunder).
- Entry is confirmed only when the bar is closed and no existing position is active.
Exit Rules:
- Stop-Loss:
- For long positions: Set at the low of the bar preceding the entry.
- For short positions: Set at the high of the bar preceding the entry.
- Take-Profit:
- For long positions: Calculated as (Entry Price - Stop-Loss) * RTR + Entry Price.
- For short positions: Calculated as Entry Price - (Stop-Loss - Entry Price) * RTR.
Visualization:
- Plots MA1 and MA2 on the chart with distinct colors for easy identification.
- Highlights stop-loss and take-profit levels using shaded zones for clear visual representation.
- Displays the entry level for active positions.
This strategy provides a robust framework for traders to identify and act on trend reversals while maintaining strict risk management. The flexibility of its inputs allows for seamless customization to adapt to various market conditions and trading preferences.

Equilibrium Candles + Pattern [Honestcowboy]The Equilibrium Candles is a very simple trend continuation or reversal strategy depending on your settings.
How an Equilibrium Candle is created:
We calculate the equilibrium by measuring the mid point between highest and lowest point over X amount of bars back.
This now is the opening price for each bar and will be considered a green bar if price closes above equilibrium.
Bars get shaded by checking if regular candle close is higher than open etc. So you still see what the normal candles are doing.
Why are they useful?
The equilibrium is calculated the same as Baseline in Ichimoku Cloud. Which provides a point where price is very likely to retrace to. This script visualises the distance between close and equilibrium using candles. To provide a clear visual of how price relates to this equilibrium point.
This also makes it more straightforward to develop strategies based on this simple concept and makes the trader purely focus on this relationship and not think of any Ichimoku Cloud theories.
Script uses a very simple pattern to enter trades:
It will count how many candles have been one directional (above or below equilibrium)
Based on user input after X candles (7 by default) script shows we are in a trend (bg colors)
On the first pullback (candle closes on other side of equilibrium) it will look to enter a trade.
Places a stop order at the high of the candle if bullish trend or reverse if bearish trend.
If based on user input after X opposite candles (2 by default) order is not filled will cancel it and look for a new trend.
Use Reverse Logic:
There is a use reverse logic in the settings which on default is turned on. It will turn long orders into short orders making the stop orders become limit orders. It will use the normal long SL as target for the short. And TP as stop for the short. This to provide a means to reverse equity curve in case your pair is mean reverting by nature instead of trending.
ATR Calculation:
Averaged ATR, which is using ta.percentile_nearest_rank of 60% of a normal ATR (14 period) over the last 200 bars. This in simple words finds a value slightly above the mean ATR value over that period.
Big Candle Exit Logic:
Using Averaged ATR the script will check if a candle closes X times that ATR from the equilibrium point. This is then considered an overextension and all trades are closed.
This is also based on user input.
Simple trade management logic:
Checks if the user has selected to use TP and SL, or/and big candle exit.
Places a TP and SL based on averaged ATR at a multiplier based on user Input.
Closes trade if there is a Big Candle Exit or an opposite direction signal from indicator.
Script can be fully automated to MT5
There are risk settings in % and symbol settings provided at the bottom of the indicator. The script will send alert to MT5 broker trying to mimic the execution that happens on tradingview. There are always delays when using a bridge to MT5 broker and there could be errors so be mindful of that. This script sends alerts in format so they can be read by tradingview.to which is a bridge between the platforms.
Use the all alert function calls feature when setting up alerts and make sure you provide the right webhook if you want to use this approach.
There is also a simple buy and sell alert feature if you don't want to fully automate but still get alerts. These are available in the dropdown when creating an alert.
Almost every setting in this indicator has a tooltip added to it. So if any setting is not clear hover over the (?) icon on the right of the setting.
The backtest uses a 4% exposure per trade and a 10 point slippage. I did not include a commission cause I'm not personaly aware what the commissions are on most forex brokers. I'm only aware of minimal slippage to use in a backtest. Trading conditions vary per broker you use so always pay close attention to trading costs on your own broker. Use a full automation at your own risk and discretion and do proper backtesting.

MFI Strategy with Oversold Zone Exit and AveragingThis strategy is based on the Money Flow Index (MFI) and aims to enter a long position when the MFI exits an oversold zone, with specific rules for limit orders, stop-loss, and take-profit settings. Here's a detailed breakdown:
Key Components
1. **Money Flow Index (MFI)**: The strategy uses the MFI, a volume-weighted indicator, to gauge whether the market is in an oversold condition (default threshold of MFI < 20). Once the MFI rises above the oversold threshold, it signals a potential buying opportunity.
2. **Limit Order for Long Entry**: Instead of entering immediately after the oversold condition is cleared, the strategy places a limit order at a price slightly below the current price (by a user-defined percentage). This helps achieve a better entry price.
3. **Stop-Loss and Take-Profit**:
- **Stop-Loss**: A stop-loss is set to protect against significant losses, calculated as a percentage below the entry price.
- **Take-Profit**: A take-profit target is set as a percentage above the entry price to lock in gains.
4. **Order Cancellation**: If the limit order isn’t filled within a specific number of bars (default is 5 bars), it’s automatically canceled to avoid being filled at a potentially suboptimal price as market conditions change.
Strategy Workflow
1. **Identify Oversold Zone**: The strategy checks if the MFI falls below a defined oversold level (default is 20). Once this condition is met, the flag `inOversoldZone` is set to `true`.
2. **Wait for Exit from Oversold Zone**: When the MFI rises back above the oversold level, it’s considered a signal that the market is potentially recovering, and the strategy prepares to enter a position.
3. **Place Limit Order**: Upon exiting the oversold zone, the strategy places a limit order for a long position at a price below the current price, defined by the `Long Entry Percentage` parameter.
4. **Monitor Limit Order**: A counter (`barsSinceEntryOrder`) starts counting the bars since the limit order was placed. If the order isn’t filled within the specified number of bars, it’s canceled automatically.
5. **Set Stop-Loss and Take-Profit**: Once the order is filled, a stop-loss and take-profit are set based on user-defined percentages relative to the entry price.
6. **Exit Strategy**: The trade will close automatically when either the stop-loss or take-profit level is hit.
Advantages
- **Risk Management**: With configurable stop-loss and take-profit, the strategy ensures losses are limited while capturing profits at pre-defined levels.
- **Controlled Entry**: The use of a limit order below the current price helps secure a better entry point, enhancing risk-reward.
- **Oversold Exit Trigger**: Using the exit from an oversold zone as an entry condition can help catch reversals.
Disadvantages
- **Missed Entries**: If the limit order isn’t filled due to insufficient downward movement after the oversold signal, potential opportunities may be missed.
- **Dependency on MFI Sensitivity**: As the MFI is sensitive to both price and volume, its fluctuations might not always accurately represent oversold conditions.
Overall Purpose
The strategy is suited for traders who want to capture potential reversals after oversold conditions in the market, with a focus on precise entries, risk management, and an automated exit plan.

Universal Trend Following Strategy | QuantumRsearchUniversal All Assets Strategy by Rocheur
The Universal All Assets Strategy is a cutting-edge, trend-following algorithm designed to operate seamlessly across multiple asset classes, including equities, commodities, forex, and cryptocurrencies. This strategy leverages the power of eight unique indicators, offering traders robust, adaptive signals. Its dynamic logic, combined with a comprehensive risk management framework, allows for precision trading in a variety of market conditions.
Core Methodologies and Features
1. Eight Integrated Trend Indicators
At the heart of the Universal All Assets Strategy are eight sophisticated trend-following indicators, each designed to capture different facets of market behavior. These indicators work together to provide a multi-dimensional analysis of price trends, filtering out noise and reacting only to significant movements:
Directional Moving Averages : Tracks the primary market trend, offering a clear indication of long-term price direction, ideal for identifying sustained upward or downward movements.
Smoothed Moving Averages : Reduces short-term volatility and noise to reveal the underlying trend, enhancing signal clarity and helping traders avoid reacting to temporary price spikes.
RSI Loops : Utilizes the Relative Strength Index (RSI) to assess market momentum, using a unique for loop mechanism to smooth out data and enhance precision.
Supertrend Filters : This indicator dynamically adjusts to market volatility, closely following price action to detect significant breakouts or reversals. The Supertrend is a core component for identifying shifts in trend direction with minimal lag.
RVI for Loop : The Relative Volatility Index (RVI) measures the strength of market volatility. It is optimized with a for loop mechanism, which smooths out the data and improves directional cues, especially in choppy or sideways markets.
Hull for Loop : The Hull Moving Average is designed to minimize lag while offering a smooth, responsive trend line. The for loop mechanism further enhances this by making the Hull even more sensitive to trend shifts, ensuring faster reaction to market movements without generating excessive noise.
These indicators evaluate market conditions independently, assigning a score of 1 for bullish trends and -1 for bearish trends. The average score across all eight indicators is calculated for each time frame (or bar), and this score determines whether the strategy should enter, exit, or remain neutral in a trade.
2. Scoring and Signal Confirmation
The strategy’s confirmation system ensures that trades are initiated only when there is strong alignment across multiple indicators:
A Long Position (Buy) is initiated when the majority of indicators generate a bullish signal, i.e., the average score exceeds a predefined upper threshold.
A Short Position or Exit is triggered when the average score falls below a lower threshold, signaling a bearish trend or neutral market.
By using a majority-rule confirmation system, the strategy filters out weak signals, reducing the chances of reacting to market noise or false positives. This ensures that only robust trends—those supported by multiple indicators—trigger trades.
Adaptive Logic for All Asset Classes
The Universal All Assets Strategy stands out for its ability to adapt dynamically across different asset classes. Whether it’s applied to highly volatile assets like cryptocurrencies or more stable instruments like equities, the strategy fine-tunes its behavior to match the asset’s volatility profile and price behavior.
Volatility Filters : The system incorporates volatility-sensitive filters, such as the Average True Range (ATR) and standard deviation metrics, which dynamically adjust its sensitivity based on market conditions. This ensures the strategy remains responsive to significant price movements while filtering out inconsequential fluctuations.
This adaptability makes the Universal All Assets Strategy effective across diverse markets, providing consistent performance whether the market is trending, range-bound, or experiencing high volatility.
Customization and Flexibility
1. Directional Bias
The strategy offers traders the flexibility to set a customizable directional bias, allowing it to focus on:
Long-only trades during bullish markets.
Short-only trades during bear markets.
Bi-directional trades for those looking to capitalize on both uptrends and downtrends.
This bias can be fine-tuned based on market conditions, trader preference, or risk tolerance, without compromising the integrity of the overall signal-generation process.
2. Volatility Sensitivity
Traders can adjust the strategy’s volatility sensitivity through customizable settings. By modifying how the system reacts to volatility, traders can make the strategy more aggressive in high-volatility environments or more conservative in quieter markets, depending on their individual trading style.
Visual Representation of Component Behavior
One of the unique features of the strategy is its real-time visual representation of the eight indicators through a component table displayed on the chart. This table provides a clear overview of the current status of each indicator:
A score of 1 indicates a bullish signal.
A score of -1 indicates a bearish signal.
The table is updated at each time frame (bar), showing how each indicator is contributing to the overall trend decision. This real-time feedback allows traders to monitor the exact composition of the strategy’s signal, helping them better understand market dynamics.
Oscillator Visualization for Trend Detection
To complement the component table, the strategy includes a trend oscillator displayed beneath the price chart, offering a visual summary of the overall market direction:
Green bars represent bullish trends when the majority of indicators signal an uptrend.
Red bars represent bearish trends or a neutral (cash) position when the majority of indicators detect a downtrend.
This oscillator allows traders to quickly assess the market’s overall direction at a glance, without needing to analyze each individual indicator, providing a clear and immediate visual of the market trend.
Backtested and Forward-Tested for Real-World Conditions
The Universal All Assets Strategy has been thoroughly tested under real-world trading conditions, incorporating key factors like:
Slippage : Set at 20 ticks to represent real market fluctuations.
Order Size : Calculated as 10% of equity, ensuring appropriate risk exposure for realistic capital management.
Commission : A fee of 0.05% has been factored in to account for trading costs.
These settings ensure that the strategy’s performance metrics—such as the Sortino Ratio , Sharpe Ratio , Omega Ratio , and Profit Factor —are reflective of actual trading environments. The rigorous backtesting and forward-testing processes ensure that the strategy produces realistic results, making it compatible with the markets it is written for and demonstrating how the system would behave in live conditions. It also includes robust risk management tools to minimize drawdowns and preserve capital, making it suitable for both professional and retail traders.
Anti-Fragile Design and Realistic Expectations
The Universal All Assets Strategy is engineered to be anti-fragile, thriving in volatile markets by adjusting to turbulence rather than being damaged by it. This is a crucial feature that ensures the strategy remains effective even during times of significant market instability.
Moreover, the strategy is transparent about realistic expectations, acknowledging that no system can guarantee a 100% win rate and that past performance is not indicative of future results. This transparency fosters trust and provides traders with a realistic framework for long-term success, making it an ideal choice for traders looking to navigate complex market conditions with confidence.
Acknowledgment of External Code
Special credit goes to bii_vg, whose invite-only code was used with permission in the development of the Universal All Assets Strategy. Their contributions have been instrumental in refining certain aspects of this strategy, ensuring its robustness and adaptability across various markets.
Conclusion
The Universal All Assets Strategy by Rocheur offers traders a powerful, adaptable tool for capturing trends across a wide range of asset classes. Its eight-indicator confirmation system, combined with customizable settings and real-time visual representations, provides a comprehensive solution for traders seeking precision, flexibility, and consistency. Whether used in high-volatility markets or more stable environments, the strategy’s dynamic adaptability, transparent logic, and robust testing make it an excellent choice for traders aiming to maximize performance while managing risk effectively.

Zero-lag TEMA Crosses Strategy[Pakun]Here's the adjusted strategy description in English, aligned with the house rules:
---
### Strategy Name: Zero-lag TEMA Cross Strategy
**Purpose:** This strategy aims to identify entry and exit points in the market using Zero-lag Triple Exponential Moving Averages (TEMA). It focuses on minimizing lag and improving the accuracy of trend-following signals.
### Uniqueness and Usefulness
**Uniqueness:** This strategy employs the less commonly used Zero-lag TEMA, compared to standard moving averages. This unique approach reduces lag and provides more timely signals.
**Usefulness:** This strategy is valuable for traders looking to capture trend reversals or continuations with reduced lag. It has the potential to enhance the profitability and accuracy of trades.
### Entry Conditions
**Long Entry:**
- **Condition:** A crossover occurs where the short-term Zero-lag TEMA surpasses the long-term Zero-lag TEMA.
- **Signal:** A buy signal is generated, indicating a potential uptrend.
**Short Entry:**
- **Condition:** A crossunder occurs where the short-term Zero-lag TEMA falls below the long-term Zero-lag TEMA.
- **Signal:** A sell signal is generated, indicating a potential downtrend.
### Exit Conditions
**Exit Strategy:**
- **Stop Loss:** Positions are closed if the price moves against the trade and hits the predefined stop loss level. The stop loss is set based on recent highs/lows.
- **Take Profit:** Positions are closed when the price reaches the profit target. The profit target is calculated as 1.5 times the distance between the entry price and the stop loss level.
### Risk Management
**Risk Management Rules:**
- This strategy incorporates a dynamic stop loss mechanism based on recent highs/lows over a specified period.
- The take profit level ensures a reward-to-risk ratio of 1.5 times the stop loss distance.
- These measures aim to manage risk and protect capital.
**Account Size:** ¥500,000
**Commissions and Slippage:** 94 pips per trade and 1 pip slippage
**Risk per Trade:** 1% of account equity
### Configurable Options
**Configurable Options:**
- Lookback Period: The number of bars to calculate recent highs/lows.
- Fast Period: Length of the short-term Zero-lag TEMA (69).
- Slow Period: Length of the long-term Zero-lag TEMA (130).
- Signal Display: Option to display buy/sell signals on the chart.
- Bar Color: Option to change bar colors based on trend direction.
### Adequate Sample Size
**Sample Size Justification:**
- To ensure the robustness and reliability of the strategy, it should be tested with a sufficiently long period of historical data.
- It is recommended to backtest across multiple market cycles to adapt to different market conditions.
- This strategy was backtested using 10 days of historical data, including 184 trades.
### Notes
**Additional Considerations:**
- This strategy is designed for educational purposes and should be thoroughly tested in a demo environment before live trading.
- Settings should be adjusted based on the asset being traded and current market conditions.
### Credits
**Acknowledgments:**
- The concept and implementation of Zero-lag TEMA are based on contributions from technical analysts and the trading community.
- Special thanks to John Doe for the TEMA concept.
- Thanks to Zero-lag TEMA Crosses .
- This strategy has been enhanced by adding new filtering algorithms and risk management rules to the original TEMA code.
### Clean Chart Description
**Chart Appearance:**
- This strategy provides a clean and informative chart by plotting Zero-lag TEMA lines and optional entry/exit signals.
- The display of signals and color bars can be toggled to declutter the chart, improving readability and analysis.

Moving Average Crossover Swing StrategyMoving Average Crossover Swing Strategy
**Overview:**
The basic concept of this strategy is to generate a signal when a faster/shorter length moving average crosses over (for Longs) or crosses under (for Shorts) a medium/longer length moving average. All of which are customizable. This strategy can work on any timeframe, however the daily is the timeframe used for the default settings and screenshots, as it was designed to be a multi-day swing strategy. Once a signal has been confirmed with a candle close, based on user options, the strategy will enter the trade on the open of the next candle.
The crossover strategy is nothing new to trading, but what can make this strategy unique and helpful, is the addition of further confirmation points, ATR based stop loss and take profit targets, optional early exit criteria, customizable to your needs and style, and just about everything visual can be toggled on/off. This strategy is based on a Trend (MA) indicator and a Momentum (MACD) indicator. While a Volume-based indicator is not shown here, one could consider using their favorite from that category to further compliment the signal idea.
It should be noted that depending on the time frame, direction(s) chosen, the signal options, confirmation options, and exit options selected, that a ticker may not produce more than 100 trades on the back test. Depending on your style and frequency, one could consider adjusting options and/or testing multiple tickers. It should also be noted that this strategy simply tests the underlying stock prices, not options contracts. And of course, testing this strategy against historical data does not assume that the same results will occur in future price action.
Shoutout given to Ripster's Clouds Indicator as pieces of that code were taken and modified to create both the Cloud visualization effects, and the Moving Average Pair Plots that are implemented in this strategy.
BASIC DEFAULTS
All can be changed as normal
Initial capital = 10,000
Order Sizing = 25% of equity (use the "Inputs" tab to modify this)
Pyramiding = 0
Commission = 0.65 USD per order
Price Verification = 1 tick
Slippage = 1 tick
RISK MANAGMENT
You will notice two different percentage options and ATR multipliers. This strategy will adjust position sizing by not exceeding either one of those % values based on the ATR (Average True Range) of the symbol and the multipliers selected, should the stock hit the stop loss price.
For Example, lets assume these values are true:
Account size = $10,000,
Max Risk = 1% of account size
Max Position Size = 25% of the account size
Stock Price = 23.45
ATR = 3.5
ATR Stop Loss Multiplier = 1.4
Then the formulas would be:
ACCT_SIZE * MaxRisk_% = 10000 * .01 = $100 (MaxCashRisk)
-----
MaxCashRisk / (ATR * ATR_SL_MULTIPLIER) = 100 / (3.5 * 1.4) = 20.4 Shares based on Max Cash Risk
-----
(ACCT_SIZE * MaxEquity_%) / STOCK_PRICE = (10000 * .25) / 23.45 = 106.61 Shares based on Max Equity Allocation
The minimum value of each of those options is then used, which in this case would be to purchase 20 shares so as not to exceed the max dollar risk should the stock reach the stop loss target. Likewise, if the ATR were to be much lower, say 0.48 cents, and all else the same, then the strategy would purchase the 106 shares based on Max Equity Allocation because the Max Cash Risk would require 149.25 shares.
MOVING AVERAGE OPTIONS
Select between and change the length & type of up to 5 pairs (10 total) of moving averages
The "Show Cloud-x" option will display a fill color between the "a" and "b" pairs
All moving averages lines can be toggled on/off in the "Style" tab, as well as adjusting their colors.
Visualization features do not affect calculations, meaning you could have all or nothing on the chart and the strategy will still produce results
SIGNAL CHOICES
Choose the fast/shorter length MA and the medium/longer length MA to determine the entry signal
CONFIRMATION OPTIONS
Both of these have customizable values and can be toggled on/off
A candle close over a slower/much longer length moving average
An additional cross-over (cross-under for Shorts) on the MACD indicator using default MACD values. While the MACD indicator is not necessary to have on the chart, it can help to add that for visualization. The calculations will perform whether the indicator is on the chart or not.
EARLY EXIT CRITERIA
Both can be toggled on/off with customizable values
MA Cross Exit will exit the trade early if the select moving averages cross-under (for longs) or cross-over (for shorts), indicating a potential reversal.
Max Bars in Trades will act as a last-resort exit by simply calculating the amount of full bars the trade has been open, and exiting on the opening of the next bar. For example: the default value is 8 bars, so after 8 full bars in the trade, if no other exit has been triggered (Stop Loss, Take Profit, or MA Cross(if enabled)), then the trade will exit at the opening of the 9th bar.
Finally, there is a table displaying the amount of trades taken for each side, and the amount & percent of both early exits. This table can be turned off in the "Style" tab
ADDITIONAL PLOTS
MACD (Moving Average Convergence/Divergence):
- The MACD is an optional confirmation indicator for this strategy.
- Plotting the indicator is not necessary for the strategy to work, but it can be helpful to visually see the status and position of the MACD if this feature is enabled in the strategy
- This helps to identify if there is also momentum behind the entry signal

Strategy - Plus / Connectable [Azullian]Discover the advanced capabilities of Strategy Plus, an essential component of the connectable indicator system designed for fast-paced strategy testing, visualization, and building within TradingView. This enhanced version of our foundational connectable strategy indicator seamlessly integrates with all connectable indicators . By utilizing the TradingView input source as a signal connector , it facilitates the linking of indicators to form a cohesive strategy. Each connectable indicator within the system sends signal weight to the next node, culminating in a comprehensive strategy that incorporates advanced customization options, sophisticated signal interpretation, and elaborate backtest labeling. Strategy Plus stands out by offering improved position management and extensive alert messaging capabilities, ensuring effective strategy refinement and backend integration.
█ DISTINCTIVE FEATURES
The Connectable Strategy Plus enhances risk mitigation within the connectable system through its advanced features and capabilities:
• Refined Signal Input Management: Tailor and precisely connect up to two signal filters with enhanced input flexibility, gain control, and strategic direction settings.
• Strategic Position Investment Control: Optimize positioning with versatile investment bases, custom investment percentages, and direction-specific investments for effective risk management.
• Advanced Exit Stop Loss Configuration: Implement custom stop loss tactics with diverse base modes and trailing options for tailored risk management.
• Strategic Exit Take Profit Settings: Apply precision-driven take profit strategies with various calculation modes and dynamic trailing functionality.
• Calibrated Entry Position Allocation: Optimize investment distribution for entry positions, including DCA and BRO trades, for strategic market response.
• Refined Order Setting Customization: Ensure exchange compliance with adjustable order settings, enhancing backtest accuracy and strategy reliability.
• Comprehensive Condition Settings: Define precise conditions for strategy execution, including date range filtering and order/loss limitations.
• Intuitive Visualization: Enhance strategy clarity with customizable visual elements and trade visualization features.
• Advanced Alert Configurations: Stay informed with comprehensive and customizable alerts for effective backend integration.
• Backend Integration With JSON Format: Leverage elaborate and structured data in JSON format for advanced analytics, enhancing decision-making and strategy optimization outside TradingView.
Let's review the separate parts of this indicator.
█ STRATEGY INPUTS
We've provided 2 inputs for connecting a signal filter or indicators or chains (1→, 2→) which are all set to 'Close' by default.
An input has several controls:
• Enable disable: Toggle the entire input on or off
• Input: Connect indicators or signal filter here, choose indicators with a compatible : Signal connector.
• G - Gain: Increase or reduce the strength of the incoming signal by a factor.
• SM - Signal Mode: Choose a trading direction compatible with the settings in your signal filter
• XM - Exit Mode: Determine when to allow to exit your open trade
○ Always: Doesn't take the restrictions into account, this ignores all the settings chosen in ML or MP
○ Restricted: Use both ML and MP conditions
○ Loss: Use the ML condition only, for example: Position will be exited and the exit signal will be allowed only when the loss exceeds the ML parameter
○ Profit: Use the MP condition only for example: Exits will only be allowed when the profit of the position exceeds the condition of the MP parameter
█ POSITION INVESTMENT
Determine the percentage of your trading budget you would like to use in each position based on the strategy's profit or loss.
• LINVB - Loss Investment Base: Choose which base to use to determine the investment percentage when the strategy is in a loss.
○ Equity: Use the equity as the base for percentage calculation.
○ Initial capital: Use the initial capital as the base for percentage calculation.
• LINV% - Loss Investment Percentage: Set a percentage of the chosen investment base as the investment for a new position.
○ For example, when 10% in loss, and a initial capital of $100, and the investment base is set to equity with a percentage of 50%, your investment will be 50% of $90, $45.
• PINVB - Profit Investment Base: Choose which base to use to determine the investment percentage when the strategy is in profit.
○ Equity: Use the equity as the base for percentage calculation.
○ Initial capital: Use the initial capital as the base for percentage calculation.
• PINV% - Profit Investment Percentage: Set a percentage of the chosen investment base as the investment for a new position.
○ For example, when 10% in profit, and an initial capital of $100, and the investment base is set to equity with a percentage of 100%, your investment will be 100% of $110, $110.
• XINVB - Custom Profit Investment Base: Choose which base to use to determine the investment percentage when the strategy is above a custom profit threshold (XT).
○ Equity: Use the equity as the base for percentage calculation.
○ Initial capital: Use the initial capital as the base for percentage calculation.
• XINV% - Custom Profit Investment Percentage: Set a percentage of the chosen investment base as the investment for a new position.
○ For example, when 100% in profit, exceeding the XT threshold of 50%, and an initial capital of $100, and the investment base is set to equity with a percentage of 50%, your investment will be 50% of $200, $100.
• XT% - Custom Profit Threshold: Determine how much profit triggers these custom profit investment settings.
• ELIB% - Entry Long Investment Base: Following previous settings, you can further restrict the investment according to the long trading direction.
○ For instance, if the previous calculation resulted in $45 to be used as an investment, and you've set the ELIB% to 50%, your long position will use 50% of $45, which is $22.5.
• ESIB% - Entry Short Investment Base: Following previous settings, you can further restrict the investment according to the short trading direction.
○ For example, if the previous calculation resulted in $45 to be used as an investment, and you've set the ESIB% to 50%, your short position will use 50% of $45, which is $22.5.
• RISK% - Risk Percentage:
○ Determine how much of the calculated position investment is at risk when the stop-loss is hit.
- For example, 1% of $45 represents a maximum loss of $0.45.
○ Risk percentage works together with the stop loss and the max leverage.
• MXLVG - Maximum Leverage:
○ Investigate the trading rules for your trading pair and use the maximum allowed amount of leverage.
○ To determine the number of contracts to be bought or sold, considering the stop loss and the specified risk percentage, the maximum leverage available will constrain the amount of leverage utilized to ensure that the maximum risk threshold is not exceeded. For instance, suppose the stop loss is set at 1%, and the risk percentage is defined as 10%. Initially, the calculated leverage to be used would be 10. However, if there is a maximum leverage cap set at 5, it would constrain the calculated leverage of 10 to adhere to the maximum limit of 5.
█ EXIT STOP LOSS
Determine the Stop Loss price based on your selected configuration.
As the stop loss is an integral part of the ordered contracts calculation used in conjunction with the Risk and Max leverage, you'll always need to provide a stop loss price.
• SLLB - Stop Loss Long Base: Choose a stop loss mode for calculating stop loss prices in long positions.
○ Risk: Determines the price using the Risk parameter (RISK%) and maximum leverage (MXLVG). In this case, SLLB% will not have any impact.
○ Price Entry + Offset: Calculates the stop loss price based on a offset percentage (SLLB%) from the entry price of the position.
○ Source: Computes the stop loss price based on an external indicator defined in SLLSRC.
- If this results in an invalid price, the calculation will revert to using the price entry + offset.
○ Source + Offset: Determines the stop loss price based on a positive or negative offset percentage (SLLB%) from an external indicator defined in SLLSRC.
- If this results in an invalid price, the calculation will fall back to using the price entry + offset.
• SLLB% - Stop Loss Long Base Percentage: Define an offset percentage that will be applied in the price entry + offset and source + offset stop loss modes.
• SLLSRC - Stop Loss Long Source: Connect an external indicator as the source for stop loss (only those providing price values eg: bollinger bands, moving averages...).
• SLLT - Stop Loss Long Trailing:
○ Fixed: The initial stop loss will be kept and no trailing stop loss will be applied.
○ Trail Stop: Takes into account all settings defined in SLLB and SLLB% and recalculates them with each candle.
- If a better stop loss is computed, it replaces the existing stop loss. In this mode SLLT% will be disregarded.
○ Trail Stop till BE: Similar to trailing stop mode, but it stops trailing when the stop loss reaches the break-even point.
○ Trail Stop from BE: Similar to trailing stop mode, but it starts trailing when the stop loss reaches the break-even point.
○ Trail Price: Computes the trailing stop loss price based on an offset percentage (SLLT%) from the closing price of the current candle.
- If a better stop loss price is calculated, it will be set as the new stop loss price.
○ Trail Price till BE: Similar to the Trail Price mode, but it stops trailing when the stop loss reaches the break-even point.
○ Trail Price from BE: Similar to Trail Price mode, but it starts trailing when the stop loss reaches the break-even point.
○ Trail Incr: Adapts the trailing stop loss price based on the offset percentage (SLLT%).
- Each price change in favor of your position will incrementally adapt the trailing stop loss with SLLT%.
○ Trail Incr till BE: Similar to the Trail Incr mode, but it stops trailing when the stop loss reaches the break-even point.
• SLLT% - Stop Loss Long Trailing Percentage: This percentage serves as an offset or increment depending on your chosen trailing mode.
• SLSB - Stop Loss Short Base: Functions similarly to SLLB but for short positions.
• SLSB% - Stop Loss Short Base Percentage: Functions similarly to SLLB% but for short positions.
• SLSSRC - Stop Loss Short Source: Functions similarly to SLLSRC but for short positions.
• SLST - Stop Loss Short Trailing: Functions similarly to SLLT but for short positions.
• SLST% - Stop Loss Short Trailing Percentage: Functions similarly to SLLT% but for short positions.
█ EXIT TAKE PROFIT
Determine the Take Profit price based on your selected configuration.
• TPLB - Take Profit Long Base: Choose a take profit mode for calculating take profit prices in long positions.
○ Reward: Determines the take profit price using the Risk parameter (RISK%) and the calculated Stop Loss price and the set reward percentage (TPLB%).
- For example: Risk 1%, Calculated Stop loss price: $90, Entry price: $100, Reward (TPLB%): 2%, will result in a take profit price on $120.
○ Price Entry + Offset: Calculates the take profit price based on a offset percentage (TPLB%) from the entry price of the position.
- For example: Entry price: $100, Offset (TPLB%): 2%, will result in a take profit price on $102.
○ Source: Computes the take profit price based on an external input from another indicator defined in TPLSRC.
- If this results in an invalid price, the calculation will revert to using the price entry + offset.
○ Source + Offset: Determines the take profit price based on a positive or negative offset percentage (TPLB%) from an external indicator inpuy defined in TPLSRC.
- If this results in an invalid price, the calculation will fall back to using the price entry + offset.
• TPLB% - Take Profit Long Base Percentage: Define an offset percentage that will be applied in the price entry + offset and source + offset take profit modes.
• TPLSRC - Take Profit Long Source: Choose to connect an external indicator as the source for take profit (of course only those which provide price values eg: bollinger bands, moving averages... but not oscillators).
• TPLT - Take Profit Long Trailing:
○ Fixed: The initial take profit will be kept and no trailing take profit will be applied.
○ Trail Profit: Takes into account all settings defined in TPLB and TPLB% and recalculates them with each candle.
- If an applicable take profit is computed, it replaces the existing take profit. In this mode TPLT% will be disregarded.
○ Trail Profit till BE: Similar to trailing profit mode, but it stops trailing when the take profit reaches the break-even point.
○ Trail Profit from BE: Similar to trailing profit mode, but it starts trailing when the take profit reaches the break-even point.
○ Trail Price: Computes the trailing take profit price based on an offset percentage (TPLT%) from the closing price of the current candle.
- If an applicable take profit price is calculated, it will be set as the new take profit price.
○ Trail Price till BE: Similar to the Trail Price mode, but it stops trailing when the take profit reaches the break-even point.
○ Trail Price from BE: Similar to Trail Price mode, but it starts trailing when the take profit reaches the break-even point.
○ Trail Incr: Adapts the trailing take profit price based on the offset percentage (TPLT%). Each price change against your position will incrementally adapt the trailing take profit with TPLT%.
○ Trail Incr till BE: Similar to the Trail Incr mode, but it stops trailing when the take profit reaches the break-even point.
• TPLT% - Take Profit Long Trailing Percentage: This percentage serves as an offset or increment depending on your chosen trailing mode.
• TPSB - Take Profit Short Base: Functions similarly to TPLB but for short positions.
• TPSB% - Take Profit Short Base Percentage: Functions similarly to TPLB% but for short positions.
• TPSSRC - Take Profit Short Source: Functions similarly to TPLSRC but for short positions.
• TPST - Take Profit Short Trailing: Functions similarly to TPLT but for short positions.
• TPST% - Take Profit Short Trailing Percentage: Functions similarly to TPLT% but for short positions.
█ ENTRY INVESTMENT DISTRIBUTION
Based on your position investment calculation you can distribute the position investment accross the initial opening trade of the position (SIG%) or the follow up Dollar Cost Averaging (DCA%) or Break Out (BRO%) trades.
For example: SIG%: 10%, DCA%: 45%, BRO%: 45% and the calculated Position Investment is $100, then the initial trade will receive $10, DCA will receive $45, and BRO will receive $45 to work with. Disable BRO and or DCA by setting them to 0%. Keep in mind that the sum of SIG, BRO and DCA may not exceed 100%.
• SIG% - Initial order investment percentage based on the signal: The percentage of the position investment distributed over normal trades.
• DCA% - Dollar Cost Averaging investment percentage: The percentage of the position investment distributed to DCA trades.
• BRO% - Break Out investment percentage: The percentage of the position investment distributed to BRO trades.
█ ENTRY DCA
DCA (Dollar-Cost Averaging) is a risk mitigation strategy where the allocated DCA% budget from the Entry Investment Distribution is distributed among x levels (DCA#) based on calculated prices (DPLM) and order sizes (DOSM), when prices move against your position.
• DCA# - Maximum DCA levels: Set the maximum number of DCA levels.
• DPLM - DCA Price Level Mode: Choose a price level mode that determines at which prices the additional purchases are distributed:
○ Linear: Entry prices are evenly spaced at regular intervals.
○ QuadIn: Entry prices are front-loaded, with more at the beginning and fewer later.
○ QuadOut: Entry prices are back-loaded, with fewer at the beginning and more later.
○ QuadInOut: Entry prices start front-loaded, then become back-loaded.
○ CubicIn: Similar to QuadIn but with a smoother front-loaded distribution.
○ CubicOut: Similar to QuadOut but with a smoother back-loaded distribution.
○ ExpoIn: Entry prices are exponentially increasing, starting small and growing.
○ ExpoOut: Entry prices are exponentially decreasing, starting large and reducing.
○ ExpoInOut: Entry prices start exponentially increasing, then decrease exponentially.
• DOSM - DCA Order Size Mode: Choose a DCA budget distribution mode for order sizes:
○ Linear: Order sizes are evenly spaced at regular intervals.
○ QuadIn: Order sizes are front-loaded, with larger orders at the beginning and smaller ones later.
○ QuadOut: Order sizes are back-loaded, with smaller orders at the beginning and larger ones later.
○ QuadInOut: Order sizes start front-loaded and transition to back-loaded.
○ CubicIn: Similar to QuadIn but with a smoother front-loaded distribution of order sizes.
○ CubicOut: Similar to QuadOut but with a smoother back-loaded distribution of order sizes.
○ ExpoIn: Order sizes exponentially increase, starting small and growing.
○ ExpoOut: Order sizes exponentially decrease, starting large and reducing.
○ ExpoInOut: Order sizes start exponentially increasing, then decrease exponentially.
For a visual representation of the price or order size distribution modes, refer to online easing curves.
█ ENTRY BRO
BRO (Break Out) is a risk mitigation strategy where the allocated BRO% budget from the Entry Investment Distribution is distributed among x levels (BRO#) based on calculated prices (BPLM) and order sizes (BOSM), when prices move in favor of your position.
• BRO# - Maximum BRO levels: Set the maximum number of BRO levels.
• BPLM - BRO Price Level Mode: Choose a price level mode that determines at which prices the additional purchases are distributed:
○ Distribution easing modes work similar as the DCA easing modes.
• BOSM - BRO Order Size Mode: Choose a BRO budget distribution mode for order sizes:
○ Distribution easing modes work similar as the DCA easing modes.
█ ORDER SETTINGS
Fine-tune accuracy to match your exchange's trading constraints, enhancing backtest precision with these settings, default settings are least restrictive for crypto trading pairs.
• MINP - Mininmum Position Notional Value: Exchange-defined minimum notional value for positions:
○ Calculated based on your exchange's rules and is the minimum total value your position must hold to meet their requirements It is calculated by multiplying Quantity with price and leverage.
○ It helps ensure your trades align with your exchange's standards.
• MAXP - Maximum Position Notional Value: Exchange-defined maximum notional value for positions:
○ Similar to MINP, this value is calculated based on your exchange's rules and represents the maximum total value allowed for your position.
• MINQ - Mininmum Order Quantity: Least permissible order quantity based on exchange rules:
○ This is the smallest quantity of an asset that your exchange allows you to trade in a single order.
• MAXQ - Maximum Order Quantity: Highest permissible order quantity according to exchange rules:
○ Opposite of MINQ, this is the largest quantity of an asset you can trade in a single order as defined by your exchange.
• DECP - Decimals in Order Price: Allowed decimal places in order prices as per exchange specifications:
○ This value specifies the number of decimal places you can use when specifying the price of an order.
• DECQ - Decimals in Order Quantity: Permitted decimal places in order quantities according to exchange specifications:
○ Similar to DECP, this value indicates the number of decimal places you can use when specifying the quantity of an asset in an order.
█ STRATEGY CONDITIONS
Specify when the strategy is permitted to execute trades.
• DATE: Enable the Date Range filter to restrict entries to a specific date range.
○ START: Set a start date and hour to commence trading.
○ END: Set an end date and hour to conclude trading within the defined range.
• IDO - Maximum Intraday Orders: Limit the number of orders the strategy can place within a single trading day. Upon reaching this limit, the strategy temporarily halts further entries for the day.
• DL% - Maximum Intraday Loss%: Set a threshold for the maximum allowable intraday loss as a percentage of equity. When exceeded, the strategy temporarily suspends trading for the day.
• CLD - Maximum Consecutive Loss Days: Define the maximum number of consecutive days the strategy can incur losses. Upon reaching this limit, the strategy halts trading and avoids new entries.
• DD% - Maximum Drawdown: Specify the maximum permissible drawdown as a percentage of equity. If this limit is met, the strategy halts trading and refrains from placing additional entries.
• TP% - Total Profit %: Establish a target for the total profit percentage the strategy aims to achieve. Once this target is attained, the strategy halts trading and refrains from initiating new entries.
• TL% - Total Loss %: Define a limit for the total loss percentage relative to the initial capital. If this limit is exceeded, the strategy discontinues trading and refrains from placing further entries.
■ VISUALS
• LINE: Activate a colored dashed diagonal line to visually connect the entry and exit points of positions.
• SLTP: Enable visualization of stop loss, take profit, and break-even levels.
• PNL: Enable Break-Even and Close Lines along with a colored area in between to visualize profit and loss.
• ☼: Brightness % : Adjust the opacity of the plotted trading visuals.
• P - Profit Color : Choose the color for profit-related elements.
• L - Loss Color: Choose the color for loss-related elements.
• B - Breakeven Color : Select the color for break-even points.
• EL - Long Color: Specify the color for long positions.
• ES - Short Color: Specify the color for short positions.
• TRADE LABELING: For better analysis we've labeled all entries and exits conform with the type of order your strategy has executed, some examples:
○ EL-SIG0-124: Enter Long - Signal 0 - Position 124
○ EL-BRO1-130: Enter Long - BRO1 - Position 130
○ EL-BRO2-130: Enter Long - BRO2 - Position 130
○ ES-DCA1-140: Enter Short - DCA1 - Position 140
○ XS-DCA2-140: Exit Short - DCA2 - Position 140
○ XL-TP-150: Exit Long - Take Profit - Position 150
○ XS-TP-154: Exit Short - Take Profit - Position 154
○ XL-SL-160: Exit Long - Stop Loss - Position 160
○ XS-SL-164: Exit Short - Stop Loss - Position 164
○ XS-CND-165: Exit Short - Strategy Condition - Max intraday loss - Position 165
■ ALERT SETTINGS
For developers and those who wish to integrate TradingView alerts into their backend systems, we offer comprehensive labeling options.
• ALID: A unique identifier you've assigned to your alert.
• NAME: A structured name you've given to this strategy.
• LAYOUT: The layout key of the strategy, allowing direct chart linking from your backend.
• SYMBOL: The symbol on which the strategy operates.
○ ONCE: You can choose to include this information only in the first message to reduce message size and repetition in follow-up messages. (max. 4096 characters)
• TICK: The ticker for the strategy.
• CHART: The chart parameter containing the timeframe.period and timeframe.multiplier.
○ ONCE: You can choose to include this information only in the first message to reduce message size and repetition in follow-up messages. (max. 4096 characters)
• BAR: Includes bar information in the alert message.
• STRATEGY: Adds strategy inputs to the alert message.
○ ONCE: You can choose to include this information only in the first message to reduce message size and repetition in follow-up messages. (max. 4096 characters)
• PERFORMANCE: Incorporates strategy performance data into the alert message.
• SIGNAL: Appends received signal weights (EL, XL, ES, XS) to the alert message.
• ORDERS: Includes order details in the alert message.
• TAGS: Adds up to 6 tags and their corresponding values to the alert message.
○ ONCE: You can choose to include this information only in the first message to reduce message size and repetition in follow-up messages. (max. 4096 characters)
Of course we can't neglect letting you in on how this juicy JSON would look (without the // comments):
{
"id": 20726, // Message Id
"t": "2023-11-01T10:35:00Z", // Message Time
"al": { // Alert
"id": "639bfa9a-5f01-4031-8880-7ec01e972055", // Alert Id
"n": "TEST04", // Name
"l": "ABC123" // Layout
},
"sym": { // Symbol
"typ": "crypto", // Type
"r": "DOGEUSD.PM", // Root
"pre": "KRAKEN", // Prefix
"tc": "DOGEUSD.PM", // Ticker
"bc": "DOGE", // BaseCurrency
"c": "USD", // Currency
"d": "DOGEUSD Multi Collateral Perpetual Futures Contract", // Description
"mtc": 0.000001, // MinTick
"pv": 1, // PointValue
"ct": "PF_DOGEUSD" // CustomTicker
},
"ch": { // Chart
"pd": "1", // Period
"mul": 1 // Multiplier
},
"bar": { // Bar
"id": 20725, // Index
"t": "2023-11-01T10:33:00Z", // Time
"o": 0.066799, // Open
"h": 0.066799, // High
"l": 0.066799, // Low
"c": 0.066799, // Close
"v": 2924 // Vol
},
"strat": { // Strategy
"n": "Strategy - Plus / Connectable ", // Name
"sig": { // Signal
"c1e": true, // Connector1Enabled
"c1s": 500500.500501, // Connector1Source
"c1g": 1, // Connector1Gain
"c2e": false, // Connector2Enabled
"c2s": 0.067043, // Connector2Source
"c2g": 1, // Connector2Gain
"sm": "Swing (EL, ES)", // SignalMode
"xm": "Always", // ExitMode
"mlp": 0.01, // ExitModeMinPercLoss
"mpp": 0.01 // ExitModeMinPercProfit
},
"inv": { // Investment
"lb": "Equity", // LossBase
"lp": 50, // LossPerc
"pb": "Equity", // ProfitBase
"pp": 100, // ProfitPerc
"pcb": "Equity", // ProfitCustomBase
"pcp": 100, // ProfitCustomPerc
"pct": 10000, // ProfitCustomThreshold
"elp": 100, // LongPerc
"esp": 100, // ShortPerc
"rsk": 1, // MaxRisk
"lvg": 10 // MaxLeverage
},
"sl": { // StopLoss
"lb": "Price Entry + Offset", // LongBase
"lp": 0.2, // LongPerc
"lsrc": 0.067043, // LongSource
"lt": "Trail Stop", // LongTrailMode
"ltp": 0.2, // LongTrailPerc
"sb": "Price Entry + Offset", // ShortBase
"sp": 0.2, // ShortPerc
"ssrc": 0.067043, // ShortSource
"st": "Trail Stop", // ShortTrailMode
"stp": 0.2 // ShortTrailPerc
},
"tp": { // TakeProfit
"lb": "Price Entry + Offset", // LongBase
"lp": 1, // LongPerc
"lsrc": 0.067043, // LongSource
"lt": "Fixed", // LongTrailMode
"ltp": 1, // LongTrailPerc
"sb": "Price Entry + Offset", // ShortBase
"sp": 1, // ShortPerc
"ssrc": 0.067043, // ShortSource
"st": "Fixed", // ShortTrailMode
"stp": 1 // ShortTrailPerc
},
"dis": { // Distribution
"sigp": 10, // SignalPerc
"dcap": 0, // DCAPerc
"brop": 90 // BROPerc
},
"dca": { // DCA
"lvl": 3, // Levels
"pl": "linear", // ModePriceLevel
"os": "linear" // ModeOrderSize
},
"bro": { // BRO
"lvl": 3, // Levels
"pl": "expoIn", // ModePriceLevel
"os": "cubicOut" // ModeOrderSize
},
"ord": { // OrderSettings
"pmin": 5, // PNVMin
"pmax": 30000000, // PNVMax
"qmin": 0, // QtyMin
"qmax": 1000000000, // QtyMax
"dp": 6, // DecPrice
"dq": 6 // DecQty
},
"cnd": { // Conditions
"de": true, // DateRangeEnabled
"start": "2023-11-01T10:30:00Z", // StartTime
"end": "2024-12-31T23:30:00Z", // EndTime
"idoe": false, // MaxIntradayOrdersEnabled
"ido": 100, // MaxIntradayOrders
"dle": false, // MaxIntradayLossEnabled
"dl": 10, // MaxIntradayLossPerc
"clde": false, // MaxConsLossDaysEnabled
"cld": false, // MaxConsLossDays
"dde": false, // MaxDrawdownEnabled
"dd": 100, // MaxDrawdownPerc
"mpe": false, // MaxProfitEnabled
"mp": 200, // MaxProfitPerc
"mle": false, // MaxLossEnabled
"ml": -50 // MaxLossPerc
}
},
"perf": { // Performance
"ic": 1000, // InitialCapital
"eq": 1000, // Equity
"np": 0, // NetProfit
"op": 0, // OpenProfit
"ct": 0, // ClosedTrades
"ot": 0, // OpenTrades
"p": "FLAT", // MarketPosition
"ps": 0, // MarketPositionSize
"pp": "FLAT", // PreviousMarketPosition
"pps": 0 // PreviousMarketPositionSize
},
"sig": { // Signal
"el": 0, // EL
"xl": 0, // XL
"es": 6, // ES
"xs": 0 // XS
},
"ord": ,
"tag":
}
█ USAGE OF CONNECTABLE INDICATORS
■ Connectable chaining mechanism
Connectable indicators can be connected directly to the signal monitor, signal filter or strategy , or they can be daisy chained to each other while the last indicator in the chain connects to the signal monitor, signal filter or strategy. When using a signal filter you can chain the filter to the strategy input to make your chain complete.
• Direct chaining: Connect an indicator directly to the signal monitor, signal filter or strategy through the provided inputs (→).
• Daisy chaining: Connect indicators using the indicator input (→). The first in a daisy chain should have a flow (⌥) set to 'Indicator only'. Subsequent indicators use 'Both' to pass the previous weight. The final indicator connects to the signal monitor, signal filter, or strategy.
■ Set up this indicator with signals and a signal filter
The indicator provides visual cues based on signal conditions. However, its weight system is best utilized when paired with a connectable signal filter, monitor, or strategy .
Let's connect the Strategy - Plus to a connectable signal filter and connectable indicators :
1. Load all relevant indicators
• Load MA - Plus / Connectable
• Load Signal filter - Plus / Connectable
• Load Strategy - Plus / Connectable
2. Signal Filter Plus: Connect the MA - Plus to the Signal Filter
• Open the signal filter settings
• Choose one of the five input dropdowns (1→, 2→, 3→, 4→, 5→) and choose : MA - Plus / Connectable: Signal Connector
• Toggle the enable box before the connected input to enable the incoming signal
3. Signal Filter: Update the filter settings if needed
• The default filter mode for the trading direction is SWING, and is compatible with the default settings in the strategy and indicators.
4. Signal Filter: Update the weight threshold settings if needed
• All connectable indicators load by default with a score of 6 for each direction (EL, XL, ES, XS)
• By default, weight threshold is 'ABOVE' Threshold 1 (TH1) and Threshold 2 (TH2), both set at 5. This allows each occurrence to score, as the default score is 1 point above the threshold.
5. Strategy Plus: Connect one of the strategy plus inputs to the signal filters signal connector in the strategy settings
• Select a strategy input → and select the Signal filter - Plus: Signal connector
6. Strateg Plus: Enable filter compatible directions
• As the default setting of the filter is SWING, we should also set the SM (Strategy mode) to SWING.
7. Strateg Plus: You're ready to start optimizing
• Dive into all parameters and start optimizing your backtesting results.
█ BENEFITS
• Adaptable Modular Design: Arrange indicators in diverse structures via direct or daisy chaining, allowing tailored configurations to align with your analysis approach.
• Streamlined Backtesting: Simplify the iterative process of testing and adjusting combinations, facilitating a smoother exploration of potential setups.
• Intuitive Interface: Navigate TradingView with added ease. Integrate desired indicators, adjust settings, and establish alerts without delving into complex code.
• Signal Weight Precision: Leverage granular weight allocation among signals, offering a deeper layer of customization in strategy formulation.
• Advanced Signal Filtering: Define entry and exit conditions with more clarity, granting an added layer of strategy precision.
• Clear Visual Feedback: Distinct visual signals and cues enhance the readability of charts, promoting informed decision-making.
• Standardized Defaults: Indicators are equipped with universally recognized preset settings, ensuring consistency in initial setups across different types like momentum or volatility.
• Reliability: Our indicators are meticulously developed to prevent repainting. We strictly adhere to TradingView's coding conventions, ensuring our code is both performant and clean.
█ COMPATIBLE INDICATORS
Each indicator that incorporates our open-source 'azLibConnector' library and adheres to our conventions can be effortlessly integrated and used as detailed above.
For clarity and recognition within the TradingView platform, we append the suffix ' / Connectable' to every compatible indicator.
█ COMMON MISTAKES, CLARIFICATIONS AND TIPS
• Removing an indicator from a chain: Deleting a linked indicator and confirming the "remove study tree" alert will also remove all underlying indicators in the object tree. Before removing one, disconnect the adjacent indicators and move it to the object stack's bottom.
• Point systems: The azLibConnector provides 500 points for each direction (EL: Enter long, XL: Exit long, ES: Enter short, XS: Exit short) Remember this cap when devising a point structure.
• Flow misconfiguration: In daisy chains the first indicator should always have a flow (⌥) setting of 'indicator only' while other indicator should have a flow (⌥) setting of 'both'.
• Hide attributes: As connectable indicators send through quite some information you'll notice all the arguments are taking up some screenwidth and cause some visual clutter. You can disable arguments in Chart Settings / Status line.
• Layout and abbreviations: To maintain a consistent structure, we use abbreviations for each input. While this may initially seem complex, you'll quickly become familiar with them. Each abbreviation is also explained in the inline tooltips.
• Inputs: Connecting a connectable indicator directly to the strategy delivers the raw signal without a weight threshold, meaning every signal will trigger a trade.
• Layout and Abbreviations: Abbreviations streamline structure and input identification. Although they may seem complex initially, inline tooltips provide explanations, facilitating quick acclimatization.
• Total Trade Limit Error & Date-Time Filter: For deep backtesting, be mindful of the total trade limit. Utilize the date-time filter to narrow the test scope and avoid TradingView order limits.
• Calculation Timeout: Encounter a timeout? Adjust any parameter slightly to restart the calculation process.
• Message Character Limit: To stay within message character limits, consider turning off certain features or setting some to 'once'.
• Direct Indicator-to-Strategy Connection: When connecting an indicator directly to a strategy without thresholds, the strategy will default to long if weights are equally assigned.
• Pyramid Enabling with DCA and BRO: Activate pyramid orders, enabling you to optimize your strategy during Dollar Cost Averaging and Break Out trades.
• Recalculate & Fill Orders Properties: Adjusting these default settings in strategy properties tab may lead to unexpected behavior when backtesting. Approach with caution.
• Optimized for Crypto: Our indicators have been optimized and tested primarily on cryptocurrency markets. Results in other markets may vary.
• Inline Tooltips Documentation: Detailed documentation and guidance are available via inline tooltips for immediate assistance.
• Strategy Settings Margin: Set margin to 1 to be able to apply leverage.
• Styling Panel: Explore the styling panel to disable labels or any other visual cues to reduce clutter on busy charts, enhancing visual clarity and personalization.
• Applying Leverage on Spot Markets: Ensure that maximum leverage on spot markets is configured to 1.
• Unrealistic Order Sizes: Verify that the order book can accommodate your backtested order sizes.
█ A NOTE OF GRATITUDE
Through years of exploring TradingView and Pine Script, we've drawn immense inspiration from the community's knowledge and innovation. Thank you for being a constant source of motivation and insight.
█ RISK DISCLAIMER
Azullian's content, tools, scripts, articles, and educational offerings are presented purely for educational and informational uses. Please be aware that past performance should not be considered a predictor of future results.
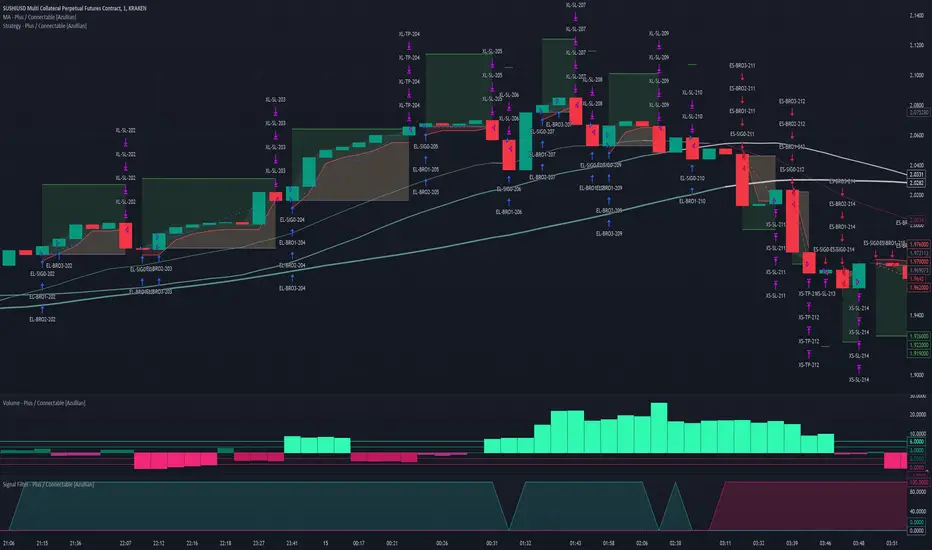
Supertrend Advance Pullback StrategyHandbook for the Supertrend Advance Strategy
1. Introduction
Purpose of the Handbook:
The main purpose of this handbook is to serve as a comprehensive guide for traders and investors who are looking to explore and harness the potential of the Supertrend Advance Strategy. In the rapidly changing financial market, having the right tools and strategies at one's disposal is crucial. Whether you're a beginner hoping to dive into the world of trading or a seasoned investor aiming to optimize and diversify your portfolio, this handbook offers the insights and methodologies you need. By the end of this guide, readers should have a clear understanding of how the Supertrend Advance Strategy works, its benefits, potential pitfalls, and practical application in various trading scenarios.
Overview of the Supertrend Advance Pullback Strategy:
At its core, the Supertrend Advance Strategy is an evolution of the popular Supertrend Indicator. Designed to generate buy and sell signals in trending markets, the Supertrend Indicator has been a favorite tool for many traders around the world. The Advance Strategy, however, builds upon this foundation by introducing enhanced mechanisms, filters, and methodologies to increase precision and reduce false signals.
1. Basic Concept:
The Supertrend Advance Strategy relies on a combination of price action and volatility to determine the potential trend direction. By assessing the average true range (ATR) in conjunction with specific price points, this strategy aims to highlight the potential starting and ending points of market trends.
2. Methodology:
Unlike the traditional Supertrend Indicator, which primarily focuses on closing prices and ATR, the Advance Strategy integrates other critical market variables, such as volume, momentum oscillators, and perhaps even fundamental data, to validate its signals. This multidimensional approach ensures that the generated signals are more reliable and are less prone to market noise.
3. Benefits:
One of the main benefits of the Supertrend Advance Strategy is its ability to filter out false breakouts and minor price fluctuations, which can often lead to premature exits or entries in the market. By waiting for a confluence of factors to align, traders using this advanced strategy can increase their chances of entering or exiting trades at optimal points.
4. Practical Applications:
The Supertrend Advance Strategy can be applied across various timeframes, from intraday trading to swing trading and even long-term investment scenarios. Furthermore, its flexible nature allows it to be tailored to different asset classes, be it stocks, commodities, forex, or cryptocurrencies.
In the subsequent sections of this handbook, we will delve deeper into the intricacies of this strategy, offering step-by-step guidelines on its application, case studies, and tips for maximizing its efficacy in the volatile world of trading.
As you journey through this handbook, we encourage you to approach the Supertrend Advance Strategy with an open mind, testing and tweaking it as per your personal trading style and risk appetite. The ultimate goal is not just to provide you with a new tool but to empower you with a holistic strategy that can enhance your trading endeavors.
2. Getting Started
Navigating the financial markets can be a daunting task without the right tools. This section is dedicated to helping you set up the Supertrend Advance Strategy on one of the most popular charting platforms, TradingView. By following the steps below, you'll be able to integrate this strategy into your charts and start leveraging its insights in no time.
Setting up on TradingView:
TradingView is a web-based platform that offers a wide range of charting tools, social networking, and market data. Before you can apply the Supertrend Advance Strategy, you'll first need a TradingView account. If you haven't set one up yet, here's how:
1. Account Creation:
• Visit TradingView's official website.
• Click on the "Join for free" or "Sign up" button.
• Follow the registration process, providing the necessary details and setting up your login credentials.
2. Navigating the Dashboard:
• Once logged in, you'll be taken to your dashboard. Here, you'll see a variety of tools, including watchlists, alerts, and the main charting window.
• To begin charting, type in the name or ticker of the asset you're interested in the search bar at the top.
3. Configuring Chart Settings:
• Before integrating the Supertrend Advance Strategy, familiarize yourself with the chart settings. This can be accessed by clicking the 'gear' icon on the top right of the chart window.
• Adjust the chart type, time intervals, and other display settings to your preference.
Integrating the Strategy into a Chart:
Now that you're set up on TradingView, it's time to integrate the Supertrend Advance Strategy.
1. Accessing the Pine Script Editor:
• Located at the top-center of your screen, you'll find the "Pine Editor" tab. Click on it.
• This is where custom strategies and indicators are scripted or imported.
2. Loading the Supertrend Advance Strategy Script:
• Depending on whether you have the script or need to find it, there are two paths:
• If you have the script: Copy the Supertrend Advance Strategy script, and then paste it into the Pine Editor.
• If searching for the script: Click on the “Indicators” icon (looks like a flame) at the top of your screen, and then type “Supertrend Advance Strategy” in the search bar. If available, it will show up in the list. Simply click to add it to your chart.
3. Applying the Strategy:
• After pasting or selecting the Supertrend Advance Strategy in the Pine Editor, click on the “Add to Chart” button located at the top of the editor. This will overlay the strategy onto your main chart window.
4. Configuring Strategy Settings:
• Once the strategy is on your chart, you'll notice a small settings ('gear') icon next to its name in the top-left of the chart window. Click on this to access settings.
• Here, you can adjust various parameters of the Supertrend Advance Strategy to better fit your trading style or the specific asset you're analyzing.
5. Interpreting Signals:
• With the strategy applied, you'll now see buy/sell signals represented on your chart. Take time to familiarize yourself with how these look and behave over various timeframes and market conditions.
3. Strategy Overview
What is the Supertrend Advance Strategy?
The Supertrend Advance Strategy is a refined version of the classic Supertrend Indicator, which was developed to aid traders in spotting market trends. The strategy utilizes a combination of data points, including average true range (ATR) and price momentum, to generate buy and sell signals.
In essence, the Supertrend Advance Strategy can be visualized as a line that moves with the price. When the price is above the Supertrend line, it indicates an uptrend and suggests a potential buy position. Conversely, when the price is below the Supertrend line, it hints at a downtrend, suggesting a potential selling point.
Strategy Goals and Objectives:
1. Trend Identification: At the core of the Supertrend Advance Strategy is the goal to efficiently and consistently identify prevailing market trends. By recognizing these trends, traders can position themselves to capitalize on price movements in their favor.
2. Reducing Noise: Financial markets are often inundated with 'noise' - short-term price fluctuations that can mislead traders. The Supertrend Advance Strategy aims to filter out this noise, allowing for clearer decision-making.
3. Enhancing Risk Management: With clear buy and sell signals, traders can set more precise stop-loss and take-profit points. This leads to better risk management and potentially improved profitability.
4. Versatility: While primarily used for trend identification, the strategy can be integrated with other technical tools and indicators to create a comprehensive trading system.
Type of Assets/Markets to Apply the Strategy:
1. Equities: The Supertrend Advance Strategy is highly popular among stock traders. Its ability to capture long-term trends makes it particularly useful for those trading individual stocks or equity indices.
2. Forex: Given the 24-hour nature of the Forex market and its propensity for trends, the Supertrend Advance Strategy is a valuable tool for currency traders.
3. Commodities: Whether it's gold, oil, or agricultural products, commodities often move in extended trends. The strategy can help in identifying and capitalizing on these movements.
4. Cryptocurrencies: The volatile nature of cryptocurrencies means they can have pronounced trends. The Supertrend Advance Strategy can aid crypto traders in navigating these often tumultuous waters.
5. Futures & Options: Traders and investors in derivative markets can utilize the strategy to make more informed decisions about contract entries and exits.
It's important to note that while the Supertrend Advance Strategy can be applied across various assets and markets, its effectiveness might vary based on market conditions, timeframe, and the specific characteristics of the asset in question. As always, it's recommended to use the strategy in conjunction with other analytical tools and to backtest its effectiveness in specific scenarios before committing to trades.
4. Input Settings
Understanding and correctly configuring input settings is crucial for optimizing the Supertrend Advance Strategy for any specific market or asset. These settings, when tweaked correctly, can drastically impact the strategy's performance.
Grouping Inputs:
Before diving into individual input settings, it's important to group similar inputs. Grouping can simplify the user interface, making it easier to adjust settings related to a specific function or indicator.
Strategy Choice:
This input allows traders to select from various strategies that incorporate the Supertrend indicator. Options might include "Supertrend with RSI," "Supertrend with MACD," etc. By choosing a strategy, the associated input settings for that strategy become available.
Supertrend Settings:
1. Multiplier: Typically, a default value of 3 is used. This multiplier is used in the ATR calculation. Increasing it makes the Supertrend line further from prices, while decreasing it brings the line closer.
2. Period: The number of bars used in the ATR calculation. A common default is 7.
EMA Settings (Exponential Moving Average):
1. Period: Defines the number of previous bars used to calculate the EMA. Common periods are 9, 21, 50, and 200.
2. Source: Allows traders to choose which price (Open, Close, High, Low) to use in the EMA calculation.
RSI Settings (Relative Strength Index):
1. Length: Determines how many periods are used for RSI calculation. The standard setting is 14.
2. Overbought Level: The threshold at which the asset is considered overbought, typically set at 70.
3. Oversold Level: The threshold at which the asset is considered oversold, often at 30.
MACD Settings (Moving Average Convergence Divergence):
1. Short Period: The shorter EMA, usually set to 12.
2. Long Period: The longer EMA, commonly set to 26.
3. Signal Period: Defines the EMA of the MACD line, typically set at 9.
CCI Settings (Commodity Channel Index):
1. Period: The number of bars used in the CCI calculation, often set to 20.
2. Overbought Level: Typically set at +100, denoting overbought conditions.
3. Oversold Level: Usually set at -100, indicating oversold conditions.
SL/TP Settings (Stop Loss/Take Profit):
1. SL Multiplier: Defines the multiplier for the average true range (ATR) to set the stop loss.
2. TP Multiplier: Defines the multiplier for the average true range (ATR) to set the take profit.
Filtering Conditions:
This section allows traders to set conditions to filter out certain signals. For example, one might only want to take buy signals when the RSI is below 30, ensuring they buy during oversold conditions.
Trade Direction and Backtest Period:
1. Trade Direction: Allows traders to specify whether they want to take long trades, short trades, or both.
2. Backtest Period: Specifies the time range for backtesting the strategy. Traders can choose from options like 'Last 6 months,' 'Last 1 year,' etc.
It's essential to remember that while default settings are provided for many of these tools, optimal settings can vary based on the market, timeframe, and trading style. Always backtest new settings on historical data to gauge their potential efficacy.
5. Understanding Strategy Conditions
Developing an understanding of the conditions set within a trading strategy is essential for traders to maximize its potential. Here, we delve deep into the logic behind these conditions, using the Supertrend Advance Strategy as our focal point.
Basic Logic Behind Conditions:
Every strategy is built around a set of conditions that provide buy or sell signals. The conditions are based on mathematical or statistical methods and are rooted in the study of historical price data. The fundamental idea is to recognize patterns or behaviors that have been profitable in the past and might be profitable in the future.
Buy and Sell Conditions:
1. Buy Conditions: Usually formulated around bullish signals or indicators suggesting upward price momentum.
2. Sell Conditions: Centered on bearish signals or indicators indicating downward price momentum.
Simple Strategy:
The simple strategy could involve using just the Supertrend indicator. Here:
• Buy: When price closes above the Supertrend line.
• Sell: When price closes below the Supertrend line.
Pullback Strategy:
This strategy capitalizes on price retracements:
• Buy: When the price retraces to the Supertrend line after a bullish signal and is supported by another bullish indicator.
• Sell: When the price retraces to the Supertrend line after a bearish signal and is confirmed by another bearish indicator.
Indicators Used:
EMA (Exponential Moving Average):
• Logic: EMA gives more weight to recent prices, making it more responsive to current price movements. A shorter-period EMA crossing above a longer-period EMA can be a bullish sign, while the opposite is bearish.
RSI (Relative Strength Index):
• Logic: RSI measures the magnitude of recent price changes to analyze overbought or oversold conditions. Values above 70 are typically considered overbought, and values below 30 are considered oversold.
MACD (Moving Average Convergence Divergence):
• Logic: MACD assesses the relationship between two EMAs of a security’s price. The MACD line crossing above the signal line can be a bullish signal, while crossing below can be bearish.
CCI (Commodity Channel Index):
• Logic: CCI compares a security's average price change with its average price variation. A CCI value above +100 may mean the price is overbought, while below -100 might signify an oversold condition.
And others...
As the strategy expands or contracts, more indicators might be added or removed. The crucial point is to understand the core logic behind each, ensuring they align with the strategy's objectives.
Logic Behind Each Indicator:
1. EMA: Emphasizes recent price movements; provides dynamic support and resistance levels.
2. RSI: Indicates overbought and oversold conditions based on recent price changes.
3. MACD: Showcases momentum and direction of a trend by comparing two EMAs.
4. CCI: Measures the difference between a security's price change and its average price change.
Understanding strategy conditions is not just about knowing when to buy or sell but also about comprehending the underlying market dynamics that those conditions represent. As you familiarize yourself with each condition and indicator, you'll be better prepared to adapt and evolve with the ever-changing financial markets.
6. Trade Execution and Management
Trade execution and management are crucial aspects of any trading strategy. Efficient execution can significantly impact profitability, while effective management can preserve capital during adverse market conditions. In this section, we'll explore the nuances of position entry, exit strategies, and various Stop Loss (SL) and Take Profit (TP) methodologies within the Supertrend Advance Strategy.
Position Entry:
Effective trade entry revolves around:
1. Timing: Enter at a point where the risk-reward ratio is favorable. This often corresponds to confirmatory signals from multiple indicators.
2. Volume Analysis: Ensure there's adequate volume to support the movement. Volume can validate the strength of a signal.
3. Confirmation: Use multiple indicators or chart patterns to confirm the entry point. For instance, a buy signal from the Supertrend indicator can be confirmed with a bullish MACD crossover.
Position Exit Strategies:
A successful exit strategy will lock in profits and minimize losses. Here are some strategies:
1. Fixed Time Exit: Exiting after a predetermined period.
2. Percentage-based Profit Target: Exiting after a certain percentage gain.
3. Indicator-based Exit: Exiting when an indicator gives an opposing signal.
Percentage-based SL/TP:
• Stop Loss (SL): Set a fixed percentage below the entry price to limit potential losses.
• Example: A 2% SL on an entry at $100 would trigger a sell at $98.
• Take Profit (TP): Set a fixed percentage above the entry price to lock in gains.
• Example: A 5% TP on an entry at $100 would trigger a sell at $105.
Supertrend-based SL/TP:
• Stop Loss (SL): Position the SL at the Supertrend line. If the price breaches this line, it could indicate a trend reversal.
• Take Profit (TP): One could set the TP at a point where the Supertrend line flattens or turns, indicating a possible slowdown in momentum.
Swing high/low-based SL/TP:
• Stop Loss (SL): For a long position, set the SL just below the recent swing low. For a short position, set it just above the recent swing high.
• Take Profit (TP): For a long position, set the TP near a recent swing high or resistance. For a short position, near a swing low or support.
And other methods...
1. Trailing Stop Loss: This dynamic SL adjusts with the price movement, locking in profits as the trade moves in your favor.
2. Multiple Take Profits: Divide the position into segments and set multiple TP levels, securing profits in stages.
3. Opposite Signal Exit: Exit when another reliable indicator gives an opposite signal.
Trade execution and management are as much an art as they are a science. They require a blend of analytical skill, discipline, and intuition. Regularly reviewing and refining your strategies, especially in light of changing market conditions, is crucial to maintaining consistent trading performance.
7. Visual Representations
Visual tools are essential for traders, as they simplify complex data into an easily interpretable format. Properly analyzing and understanding the plots on a chart can provide actionable insights and a more intuitive grasp of market conditions. In this section, we’ll delve into various visual representations used in the Supertrend Advance Strategy and their significance.
Understanding Plots on the Chart:
Charts are the primary visual aids for traders. The arrangement of data points, lines, and colors on them tell a story about the market's past, present, and potential future moves.
1. Data Points: These represent individual price actions over a specific timeframe. For instance, a daily chart will have data points showing the opening, closing, high, and low prices for each day.
2. Colors: Used to indicate the nature of price movement. Commonly, green is used for bullish (upward) moves and red for bearish (downward) moves.
Trend Lines:
Trend lines are straight lines drawn on a chart that connect a series of price points. Their significance:
1. Uptrend Line: Drawn along the lows, representing support. A break below might indicate a trend reversal.
2. Downtrend Line: Drawn along the highs, indicating resistance. A break above might suggest the start of a bullish trend.
Filled Areas:
These represent a range between two values on a chart, usually shaded or colored. For instance:
1. Bollinger Bands: The area between the upper and lower band is filled, giving a visual representation of volatility.
2. Volume Profile: Can show a filled area representing the amount of trading activity at different price levels.
Stop Loss and Take Profit Lines:
These are horizontal lines representing pre-determined exit points for trades.
1. Stop Loss Line: Indicates the level at which a trade will be automatically closed to limit losses. Positioned according to the trader's risk tolerance.
2. Take Profit Line: Denotes the target level to lock in profits. Set according to potential resistance (for long trades) or support (for short trades) or other technical factors.
Trailing Stop Lines:
A trailing stop is a dynamic form of stop loss that moves with the price. On a chart:
1. For Long Trades: Starts below the entry price and moves up with the price but remains static if the price falls, ensuring profits are locked in.
2. For Short Trades: Starts above the entry price and moves down with the price but remains static if the price rises.
Visual representations offer traders a clear, organized view of market dynamics. Familiarity with these tools ensures that traders can quickly and accurately interpret chart data, leading to more informed decision-making. Always ensure that the visual aids used resonate with your trading style and strategy for the best results.
8. Backtesting
Backtesting is a fundamental process in strategy development, enabling traders to evaluate the efficacy of their strategy using historical data. It provides a snapshot of how the strategy would have performed in past market conditions, offering insights into its potential strengths and vulnerabilities. In this section, we'll explore the intricacies of setting up and analyzing backtest results and the caveats one must be aware of.
Setting Up Backtest Period:
1. Duration: Determine the timeframe for the backtest. It should be long enough to capture various market conditions (bullish, bearish, sideways). For instance, if you're testing a daily strategy, consider a period of several years.
2. Data Quality: Ensure the data source is reliable, offering high-resolution and clean data. This is vital to get accurate backtest results.
3. Segmentation: Instead of a continuous period, sometimes it's helpful to backtest over distinct market phases, like a particular bear or bull market, to see how the strategy holds up in different environments.
Analyzing Backtest Results:
1. Performance Metrics: Examine metrics like the total return, annualized return, maximum drawdown, Sharpe ratio, and others to gauge the strategy's efficiency.
2. Win Rate: It's the ratio of winning trades to total trades. A high win rate doesn't always signify a good strategy; it should be evaluated in conjunction with other metrics.
3. Risk/Reward: Understand the average profit versus the average loss per trade. A strategy might have a low win rate but still be profitable if the average gain far exceeds the average loss.
4. Drawdown Analysis: Review the periods of losses the strategy could incur and how long it takes, on average, to recover.
9. Tips and Best Practices
Successful trading requires more than just knowing how a strategy works. It necessitates an understanding of when to apply it, how to adjust it to varying market conditions, and the wisdom to recognize and avoid common pitfalls. This section offers insightful tips and best practices to enhance the application of the Supertrend Advance Strategy.
When to Use the Strategy:
1. Market Conditions: Ideally, employ the Supertrend Advance Strategy during trending market conditions. This strategy thrives when there are clear upward or downward trends. It might be less effective during consolidative or sideways markets.
2. News Events: Be cautious around significant news events, as they can cause extreme volatility. It might be wise to avoid trading immediately before and after high-impact news.
3. Liquidity: Ensure you are trading in assets/markets with sufficient liquidity. High liquidity ensures that the price movements are more reflective of genuine market sentiment and not due to thin volume.
Adjusting Settings for Different Markets/Timeframes:
1. Markets: Each market (stocks, forex, commodities) has its own characteristics. It's essential to adjust the strategy's parameters to align with the market's volatility and liquidity.
2. Timeframes: Shorter timeframes (like 1-minute or 5-minute charts) tend to have more noise. You might need to adjust the settings to filter out false signals. Conversely, for longer timeframes (like daily or weekly charts), you might need to be more responsive to genuine trend changes.
3. Customization: Regularly review and tweak the strategy's settings. Periodic adjustments can ensure the strategy remains optimized for the current market conditions.
10. Frequently Asked Questions (FAQs)
Given the complexities and nuances of the Supertrend Advance Strategy, it's only natural for traders, both new and seasoned, to have questions. This section addresses some of the most commonly asked questions regarding the strategy.
1. What exactly is the Supertrend Advance Strategy?
The Supertrend Advance Strategy is an evolved version of the traditional Supertrend indicator. It's designed to provide clearer buy and sell signals by incorporating additional indicators like EMA, RSI, MACD, CCI, etc. The strategy aims to capitalize on market trends while minimizing false signals.
2. Can I use the Supertrend Advance Strategy for all asset types?
Yes, the strategy can be applied to various asset types like stocks, forex, commodities, and cryptocurrencies. However, it's crucial to adjust the settings accordingly to suit the specific characteristics and volatility of each asset type.
3. Is this strategy suitable for day trading?
Absolutely! The Supertrend Advance Strategy can be adjusted to suit various timeframes, making it versatile for both day trading and long-term trading. Remember to fine-tune the settings to align with the timeframe you're trading on.
4. How do I deal with false signals?
No strategy is immune to false signals. However, by combining the Supertrend with other indicators and adhering to strict risk management protocols, you can minimize the impact of false signals. Always use stop-loss orders and consider filtering trades with additional confirmation signals.
5. Do I need any prior trading experience to use this strategy?
While the Supertrend Advance Strategy is designed to be user-friendly, having a foundational understanding of trading and market analysis can greatly enhance your ability to employ the strategy effectively. If you're a beginner, consider pairing the strategy with further education and practice on demo accounts.
6. How often should I review and adjust the strategy settings?
There's no one-size-fits-all answer. Some traders adjust settings weekly, while others might do it monthly. The key is to remain responsive to changing market conditions. Regular backtesting can give insights into potential required adjustments.
7. Can the Supertrend Advance Strategy be automated?
Yes, many traders use algorithmic trading platforms to automate their strategies, including the Supertrend Advance Strategy. However, always monitor automated systems regularly to ensure they're operating as intended.
8. Are there any markets or conditions where the strategy shouldn't be used?
The strategy might generate more false signals in markets that are consolidative or range-bound. During significant news events or times of unexpected high volatility, it's advisable to tread with caution or stay out of the market.
9. How important is backtesting with this strategy?
Backtesting is crucial as it allows traders to understand how the strategy would have performed in the past, offering insights into potential profitability and areas of improvement. Always backtest any new setting or tweak before applying it to live trades.
10. What if the strategy isn't working for me?
No strategy guarantees consistent profits. If it's not working for you, consider reviewing your settings, seeking expert advice, or complementing the Supertrend Advance Strategy with other analysis methods. Remember, continuous learning and adaptation are the keys to trading success.
Other comments
Value of combining several indicators in this script and how they work together
Diversification of Signals: Just as diversifying an investment portfolio can reduce risk, using multiple indicators can offer varied perspectives on potential price movements. Each indicator can capture a different facet of the market, ensuring that traders are not overly reliant on a single data point.
Confirmation & Reduced False Signals: A common challenge with many indicators is the potential for false signals. By requiring confirmation from multiple indicators before acting, the chances of acting on a false signal can be significantly reduced.
Flexibility Across Market Conditions: Different indicators might perform better under different market conditions. For example, while moving averages might excel in trending markets, oscillators like RSI might be more useful during sideways or range-bound conditions. A mashup strategy can potentially adapt better to varying market scenarios.
Comprehensive Analysis: With multiple indicators, traders can gauge trend strength, momentum, volatility, and potential market reversals all at once, providing a holistic view of the market.
How do the different indicators in the Supertrend Advance Strategy work together?
Supertrend: This is primarily a trend-following indicator. It provides traders with buy and sell signals based on the volatility of the price. When combined with other indicators, it can filter out noise and give more weight to strong, confirmed trends.
EMA (Exponential Moving Average): EMA gives more weight to recent price data. It can be used to identify the direction and strength of a trend. When the price is above the EMA, it's generally considered bullish, and vice versa.
RSI (Relative Strength Index): An oscillator that measures the magnitude of recent price changes to evaluate overbought or oversold conditions. By cross-referencing with other indicators like EMA or MACD, traders can spot potential reversals or confirmations of a trend.
MACD (Moving Average Convergence Divergence): This indicator identifies changes in the strength, direction, momentum, and duration of a trend in a stock's price. When the MACD line crosses above the signal line, it can be a bullish sign, and when it crosses below, it can be bearish. Pairing MACD with Supertrend can provide dual confirmation of a trend.
CCI (Commodity Channel Index): Initially developed for commodities, CCI can indicate overbought or oversold conditions. It can be used in conjunction with other indicators to determine entry and exit points.
In essence, the synergy of these indicators provides a balanced, comprehensive approach to trading. Each indicator offers its unique lens into market conditions, and when they align, it can be a powerful indication of a trading opportunity. This combination not only reduces the potential drawbacks of each individual indicator but leverages their strengths, aiming for more consistent and informed trading decisions.
Backtesting and Default Settings
• This indicator has been optimized to be applied for 1 hour-charts. However, the underlying principles of this strategy are supply and demand in the financial markets and the strategy can be applied to all timeframes. Daytraders can use the 1min- or 5min charts, swing-traders can use the daily charts.
• This strategy has been designed to identify the most promising, highest probability entries and trades for each stock or other financial security.
• The combination of the qualifiers results in a highly selective strategy which only considers the most promising swing-trading entries. As a result, you will normally only find a low number of trades for each stock or other financial security per year in case you apply this strategy for the daily charts. Shorter timeframes will result in a higher number of trades / year.
• Consequently, traders need to apply this strategy for a full watchlist rather than just one financial security.
• Default properties: RSI on (length 14, RSI buy level 50, sell level 50), EMA, RSI, MACD on, type of strategy pullback, SL/TP type: ATR (length 10, factor 3), trade direction both, quantity 5, take profit swing hl 5.1, highest / lowest lookback 2, enable ATR trail (ATR length 10, SL ATR multiplier 1.4, TP multiplier 2.1, lookback = 4, trade direction = both).
