Bollinger Bands MTF [LonesomeTheBlue]With this script you can follow Bollinger Bands for current and higher time frame together. Higher time frame is calculated by script.
if current period
1m => higher period=5m
3m => higher period=5m
5m => higher period=15m
15m => higher period=1h
30m => higher period=1h
45m => higher period=1h
1h => higher period=4h
2h => higher period=4h
3h => higher period=4h
4h => higher period=1day
1day => higher period=1week
Cari skrip untuk "band"

Trend Trader Bands Strategy This is plots the indicator developed by Andrew Abraham
in the Trading the Trend article of TASC September 1998
It was modified, result values wass averages.
And draw two bands above and below TT line.

Percentage BandsA different version of bollinger bands, I use percentage difference instead of standard deviation.

Trend Trader Bands This is plots the indicator developed by Andrew Abraham
in the Trading the Trend article of TASC September 1998
It was modified, result values wass averages.
And draw two bands above and below TT line.

Standard Error Bandswith the best settings - this indicator is a better version of the bollinger bands, because it uses a linear regression .
Use this carefully and with other indicators.
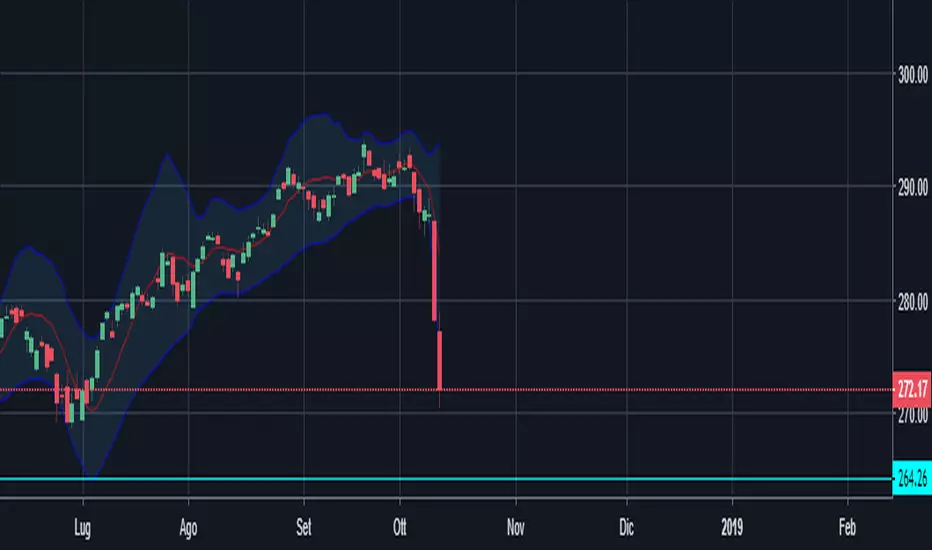
Interquartile Range BandsInterquartile Range Bands script.
This indicator was originally developed by Alex Orekhov at his home.
The idea based on the interquartile range en.wikipedia.org
If price breaks out from the bands then it is `outlier` price.
After breakouts price always returns to its median.
Watch squeeze/expansion periods.
Anyway use it as a supplement to the other indicators.
I will glad to get your feedback.

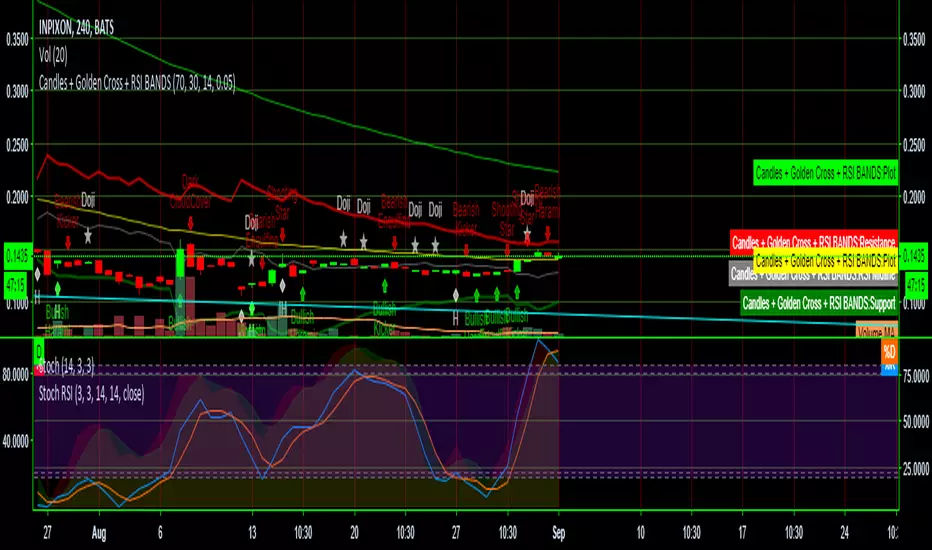
Candles + Golden Cross + RSI BANDSThis script combines three scripts for ease of use
RSI Bands LazyBear
Golden Cross MichMexTrading
Candlestick patterns identified repo32
I combined them because they work exceptionally well together in identifying reversals and other potential changes
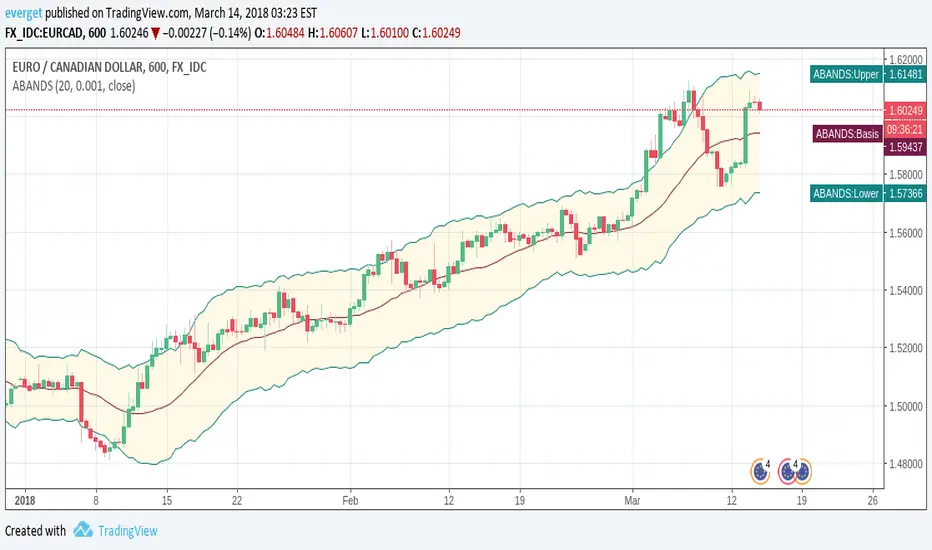
Acceleration BandsAcceleration Bands indicator script. This indicator was originally developed by Price Headley.
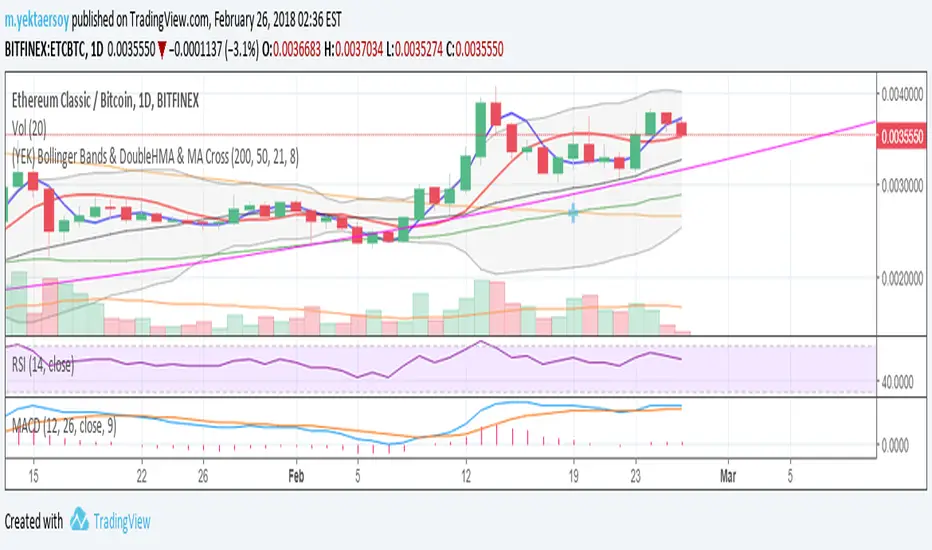
(YEK) Bollinger Bands & DoubleHMA & MA CrossMy favorite indicators ALL-IN-1: Bollinger Bands, Double Hull Moving Average (21,8), Double Moving Average (200,50)
Volume Weighted Average Range Bands [DW]This is an experimental study designed to identify the underlying trend bias and volatility of an instrument over any custom interval TradingView supports.
First, reset points are established at points where the opening price of the interval changes.
Next, Volume Weighted Average Price (VWAP) is calculated. It is the cumulative sum of typical price times volume divided by the cumulative volume. The cumulation starts over upon each reset point.
After that, Volume Weighted Average Range (VWAR) is calculated. The formula structure is the same as VWAP, except using range rather than typical price.
Lastly, the bands are calculated by multiplying the VWAR by the specified multiplier (approximate Golden Ratio by default) and by 1 through 5, then adding to and subtracting from the VWAP.
Custom Bar Colors are included.

Fractal Chaos Bands Backtest The FCB indicator looks back in time depending on the number of time periods trader selected
to plot the indicator. The upper fractal line is made by plotting stock price highs and the
lower fractal line is made by plotting stock price lows. Essentially, the Fractal Chaos Bands
show an overall panorama of the price movement, as they filter out the insignificant fluctuations
of the stock price.
You can change long to short in the Input Settings
WARNING:
- For purpose educate only
- This script to change bars colors.

FIBONACCI BANDS by KIVANCfr3762Calculated with a default value of 14 periods of EMA and 14 periods of Average True Range ( SMA )
There are 4 levels of upper bands and 4 levels of lower bands in the indicator
its calculated adding and subtracting ATR( SMA ) values with coefficients 1, 1.618, 2.618 and 4.236 (Fibonacci ratios) to EMA of close prices.
Top and Bottom Fibo lines are aceepted as significant Resistance and Support levels.

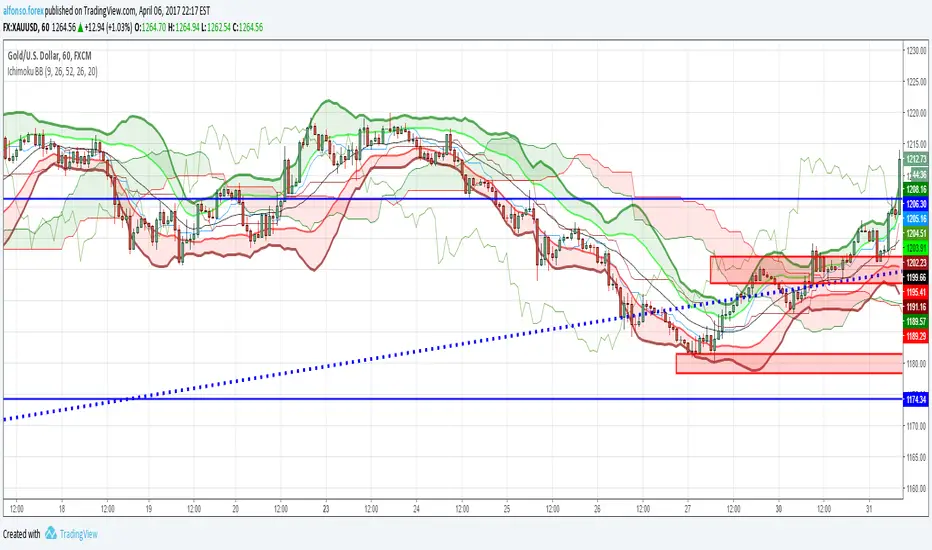
Ichimoku And DD Bollinger BandsIchimoku System Plus Double Bolliner Bands
Made in Mexico City with Love.
Kaufman's Adaptive Moving Average BandsKaufman's Adaptive Moving Average with 6 Bands at a time and trend direction.

Yacine MA Bands ModMashed together the ema-bands from IvanLabrie with some moving average script stuff from ChrisMoody and LazyBear and this is the result. Credit goes to them, 'cause I don't know to how to code tbh. Just copy/pasted stuff untill I got the result I wanted.
Bands work as support/resistance among other things. You can use them to trade breakouts or reversals or whatever.
Combining them with a momentum indicator would probably be useful for timing divergence or OB/OS and stuff like that.
Included moving average types;
SMA
EMA
RMA
WMA
VWMA
HullMA
TilsonMA
TEMA
Not sure if all of them works as they should... y'know since I cant code/script. Looks good to me though.¨
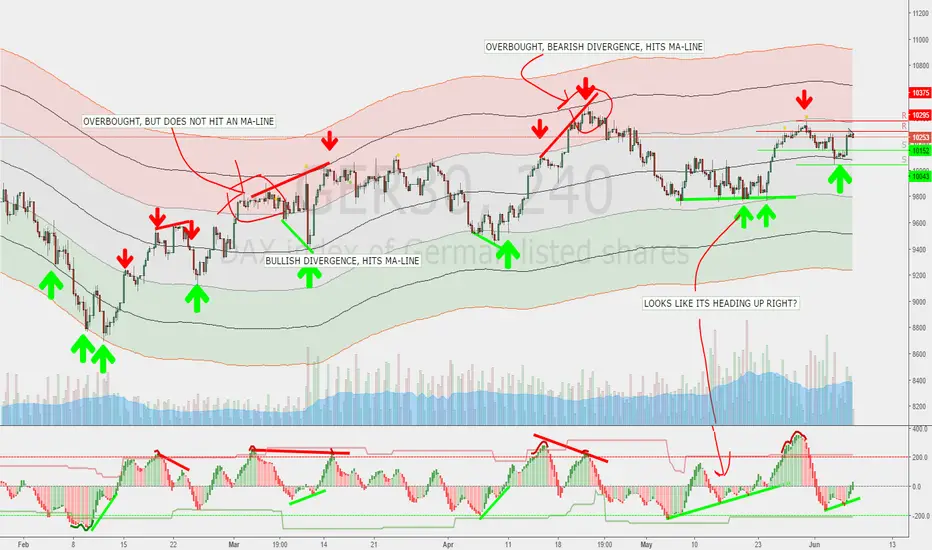
Default should work pretty good for the DAX, But you'll probably want to fiddle a bit with the settings.
Here's a pic of how they can be used. Ofc everything looks simple in hindsight, but you get the point.
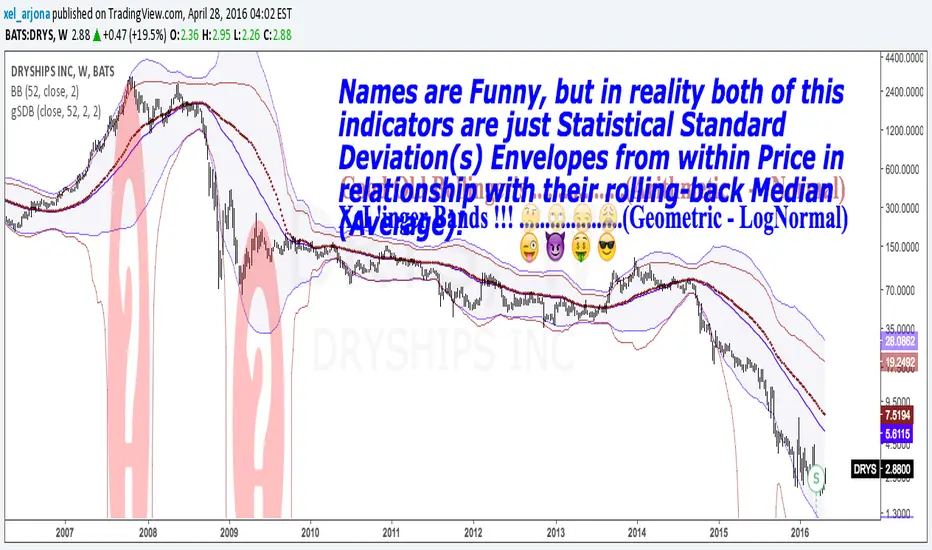
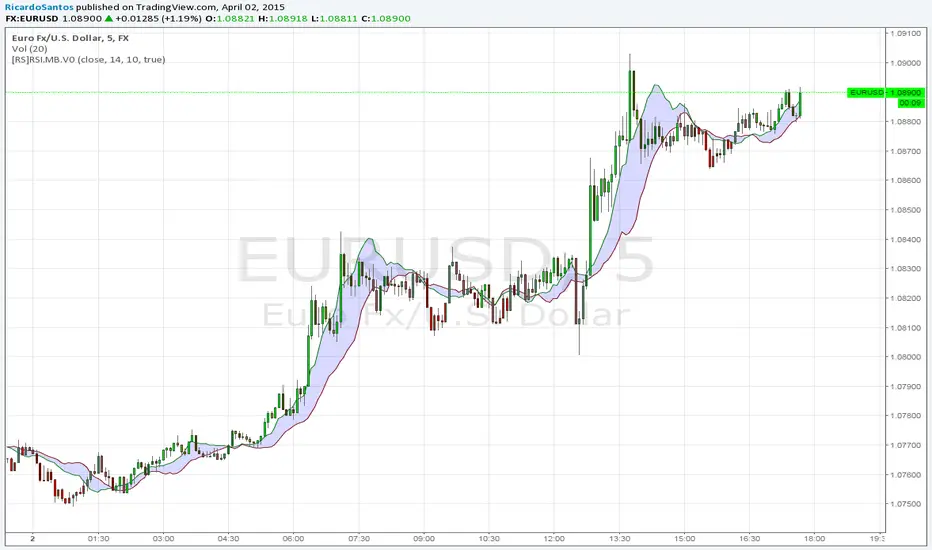
GEOMETRIC STANDARD DEVIATION BANDS v1 by @XeL_ArjonaGEOMETRIC STANDARD DEVIATION BANDS
Ver.1 By Ricardo M Arjona @XeL_Arjona
DISCLAIMER:
The Following indicator/code IS NOT intended to be a formal investment advice or recommendation by the author, nor should be construed as such. Users will be fully responsible by their use regarding their own trading vehicles/assets.
The embedded code and ideas within this work are FREELY AND PUBLICLY available on the Web for NON LUCRATIVE ACTIVITIES and must remain as is.
WHAT'S THIS?
This IS NOT the wheel "Re-Invention"... This is exactly what the name says: A pair of Envelope Bands to measure "volatility", constructed at statistical relation from within price series and their Rolling back MEAN (Simple Moving Average). YES, What Mr. Bollinger did and put it's name to this simple, cleaver and popular formula.
This time, I took the time to make another simple mod, but seems to me to be quite functional in REAL VOLATILE assets like in the example chart: TO USE THEIR GEOMETRIC MODE!!
Cheers!
Any feedback or public modification(s) are quite welcome to the community....!
@XeL_Arjona
Apr 28 2016
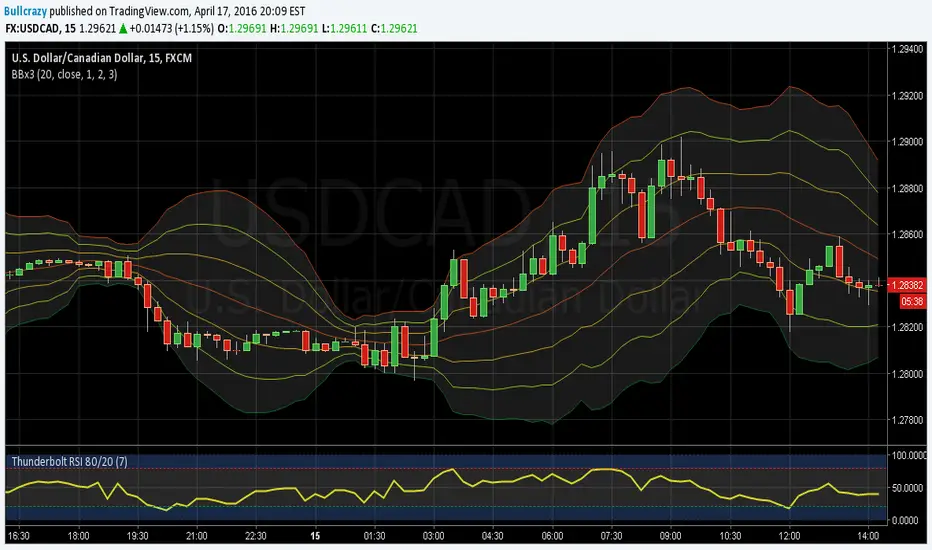
Triple Bollinger BandsI found myself using multiple bollinger bands a lot so I decided to add them all to one script and add the ability to adjust them by 0.2. It has helped me by not taking up as much space in the upper left corner as well as improving my in's and outs of trend continuation trades. If you manage to find a double top at +2 or greater deviation, and with a bearish divergence on the RSI as shown in this picture, GO SHORT SON! This was a fast and easy 35 - 40 pips and if you used your fibonacci for an exit you had little doubt of the final result and could have even been prepared for an immediate reversal knowing you were then at an oversold -2.8 deviation. I could go on and on........
Stochastic In BandsWhat about to display Stochastic Oscilator in EMA-ATR Bands? If you like the idea I would code advanced version

Variable Moving Average Bands [LazyBear]VMA Bands are ATR bands with VMA as its centre. For a description of options, refer to my VMA post:
I have moved VMA calculation in to a separate function. Feel free to use calc_vma() in your scripts. For more MA calculation function (KAMA, VIDYA and others), refer to my complete list of indicators below.
Wish you all a very prosperous New year. Hope these indicators make you all more money this year too :)
List of my other indicators:
- GDoc: docs.google.com
- Chart:

TRK19121. Add the Script to TradingView
• Copy the Pine Script code I gave you.
• In TradingView, open the Pine Editor (bottom of the screen).
• Paste the code and click Add to Chart.
2. What You’ll See
• On your chart, Fibonacci retracement levels will be drawn automatically between the highest and lowest points in the last lookback bars (default = 100).
• Bollinger Bands (20-period SMA with ±2 standard deviations) will also appear.
• On the top-right corner, a table will show all Fibonacci levels (0%, 23.6%, 38.2%, 50%, 61.8%, 78.6%, 100%) with their exact price values.
• All text in the table is black for clarity.
3. How It Updates
• Every new candle, the script recalculates the highest and lowest points in the lookback window.
• The Fibonacci levels and the table update automatically.
• You don’t need to manually redraw fibo lines — the script does it for you.
4. How to Interpret
• Fibonacci levels act as potential support/resistance zones.
• Bollinger Bands show volatility and overbought/oversold conditions.
• If price is near a Fibonacci level and touches the Bollinger upper/lower band, that’s a strong signal area.
• Example:
• Price near 61.8% fibo + lower band → possible bounce (long).
• Price near 38.2% fibo + upper band → possible rejection (short).
5. Customization
• You can change the value (default 100 bars) to adjust how far back the script finds the high/low.
• You can change Bollinger settings (, ) to fit your trading style.
• The table always shows the current fibo levels clearly, so you don’t need to measure them manually.

Fibo + Bollinger + Fibo Tablosu1. Add the Script to TradingView
• Copy the Pine Script code I gave you.
• In TradingView, open the Pine Editor (bottom of the screen).
• Paste the code and click Add to Chart.
2. What You’ll See
• On your chart, Fibonacci retracement levels will be drawn automatically between the highest and lowest points in the last lookback bars (default = 100).
• Bollinger Bands (20-period SMA with ±2 standard deviations) will also appear.
• On the top-right corner, a table will show all Fibonacci levels (0%, 23.6%, 38.2%, 50%, 61.8%, 78.6%, 100%) with their exact price values.
• All text in the table is black for clarity.
3. How It Updates
• Every new candle, the script recalculates the highest and lowest points in the lookback window.
• The Fibonacci levels and the table update automatically.
• You don’t need to manually redraw fibo lines — the script does it for you.
4. How to Interpret
• Fibonacci levels act as potential support/resistance zones.
• Bollinger Bands show volatility and overbought/oversold conditions.
• If price is near a Fibonacci level and touches the Bollinger upper/lower band, that’s a strong signal area.
• Example:
• Price near 61.8% fibo + lower band → possible bounce (long).
• Price near 38.2% fibo + upper band → possible rejection (short).
5. Customization
• You can change the value (default 100 bars) to adjust how far back the script finds the high/low.
• You can change Bollinger settings (, ) to fit your trading style.
• The table always shows the current fibo levels clearly, so you don’t need to measure them manually.
