Liquidation Levels V3Uh similar to liq lvls v2 , but this is useful for backtesting as the lvls dont erase. so you can see how price reacted in the past backtest in specific market conditions and be ready for whats ahead.
Cari skrip untuk "backtest"

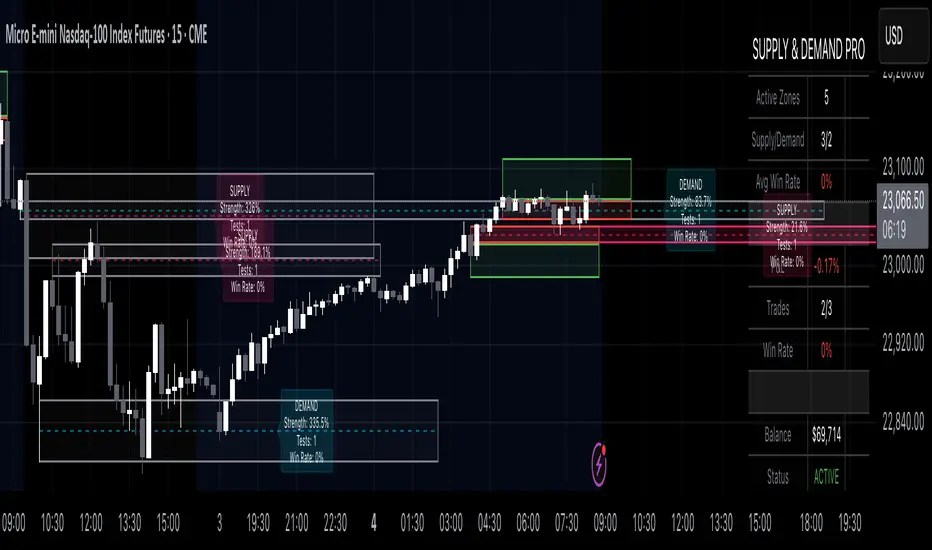
Supply & Demand Pro [Institutional]🎯 Overview
The most comprehensive Supply & Demand indicator on TradingView, designed for serious traders and prop firm professionals. Unlike traditional S&D indicators that just draw pretty zones, this system tracks actual performance metrics, provides entry/exit signals, and includes professional risk management tools.
❓ Why This Indicator?
After extensive research into what traders actually need (not just want), this indicator addresses the TOP complaints about Supply & Demand trading:
- ❌ "I don't know which zones to trust" → ✅ Each zone shows historical win rate
- ❌ "No clear entry/exit rules" → ✅ Multiple entry methods with visual R:R
- ❌ "Can't backtest effectiveness" → ✅ Full performance tracking
- ❌ "Too many false signals" → ✅ Quality filters and volume validation
🚀 Key Features
🎯 Professional Zone Detection
- Volume Profile Analysis (finds institutional accumulation/distribution)
- Swing Point Detection (classic pivot-based zones)
- Order Flow Analysis (coming in v2)
- Hybrid Mode (combines multiple methods)
📊 Performance Analytics
- Individual zone win rates
- Daily P&L tracking
- Account balance simulation
- Success/failure ratio for each zone
- Historical performance data
💼 Prop Firm Tools
- Daily loss limits (auto-stops trading)
- Position sizing controls
- Maximum concurrent positions
- Daily profit targets
- Clean reporting for evaluations
🎨 Entry & Risk Management
- Zone Edge entry (immediate)
- 50% Retracement entry (patient)
- Momentum Confirmation entry
- Visual Risk:Reward boxes
- Multiple stop loss methods (ATR, Fixed %, Zone-based)
📈 Advanced Features
- Auto-removes failed zones
- Volume confirmation requirements
- Strength-based zone ranking
- Smart alerts for high-probability setups
- Multi-timeframe compatibility
📋 How It Works
1. Zone Creation: Continuously scans for high-quality supply/demand zones using your selected method
2. Quality Filtering: Each zone must pass strength, volume, and historical performance filters
3. Visual Feedback: Zones display strength %, test count, and win rate directly on chart
4. Trade Signals: When price touches a zone, the system calculates entry, stop, and target
5. Performance Tracking: Every zone touch is tracked to build historical win rates
⚙️ Quick Settings Guide
For Beginners:
- Detection Method: "Swing Points"
- Min Zone Strength: 15%
- Risk:Reward: 2:1
- Entry Method: "Zone Edge"
For Advanced Traders:
- Detection Method: "Volume Profile"
- Min Zone Strength: 20%
- Min Win Rate: 50%
- Entry Method: "Momentum Confirm"
For Prop Firm Traders:
- Enable all Prop Firm Tools
- Set Daily Loss Limit to your drawdown rules
- Max Positions: 2-3
- Use "Professional" theme for screenshots
📊 What Makes This Different?
Traditional S&D Indicators:
- Draw zones based on one method
- No performance tracking
- No entry/exit rules
- Can't verify effectiveness
Supply & Demand Pro:
- Multiple detection methods
- Tracks win rate for EVERY zone
- Clear entry/exit signals
- Full backtesting capability
- Risk management built-in
🎓 Best Practices
1. Start Conservative: Use higher strength requirements (20%+) until familiar
2. Trust the Data: Zones with 3+ tests and 60%+ win rate are golden
3. Respect Risk Limits: The daily loss limit feature will save your account
4. Volume Matters: Zones with volume confirmation are significantly stronger
5. Be Patient: Wait for high-probability setups (check the win rate!)
🔔 Alert Options
- Zone Touch Alerts (with strength & win rate)
- High Probability Setups (60%+ win rate zones)
- Daily Limit Warnings
- Risk Management Alerts
💡 Pro Tips
- Combine with market structure for best results
- Higher timeframe zones are more reliable
- Watch for zones that align with round numbers
- Use partial profits feature to lock in gains
- Review daily performance to improve
🐛 Troubleshooting
- No zones appearing? → Lower Min Zone Strength to 10%
- Too many zones? → Increase strength requirement or enable filters
- Win rates not updating? → Zones need multiple tests to calculate
⚡ Performance Note
This indicator uses advanced calculations and may take a moment to load on lower-end devices. The comprehensive analytics are worth the wait!
🎁 Bonus Features
- 4 Professional themes
- Customizable dashboard
- R:R visualization
- Zone strength ranking
- Session-based filtering (coming soon)
📧 Support & Updates
This is an actively maintained indicator. Updates include:
- New detection methods
- Enhanced analytics
- Community-requested features
- Performance optimizations
⭐ If you find this indicator helpful, please leave a rating and comment with your results!
📌 Remember: No indicator is perfect. Always use proper risk management and never risk more than you can afford to lose.
Leola Lens SignalPro📌 Leola Lens SignalPro — Structure-Aware Momentum Overlay (Invite-Only)
This script is designed for traders who prioritize clear structure, liquidity trap zones, and momentum transitions. It provides adaptive visual overlays that align with key decision points — emphasizing structure over lagging indicators.
________________________________________
⚙️ Core Operating Modes
✅ Momentum Shift Mode (Always Active)
Tracks microstructure shifts using volatility compression, imbalance reactions, and adaptive logic for directional bias.
⚡ Scalper Mode (Optional)
Activates fast-response overlays for 1m–15m charts — tuned for crypto, indices, and intraday setups.
🛡 Safeguard Mode (Optional)
Applies volume and exhaustion filters for higher timeframe or conservative entries, ideal for swing traders.
________________________________________
📦 Liquidity Control Box (LCB) Logic
🔵 Blue Box = Bullish Control
• Break above → continuation likely
• Break below → caution for reversal
🟧 Orange Box = Bearish Control
• Break below → continuation likely
• Break above → caution for squeeze
Use the last visible box for bias.
Box edges = confluence zones.
Box overlaps = consolidation → avoid impulsive trades.
________________________________________
🧠 Signal Logic & Concept
Built using a custom structural engine, not derived from public scripts like RSI, MACD, or WaveTrend.
The overlays aim to capture price behavior often aligned with institutional concepts, such as:
• Order Blocks
• Liquidity Sweeps
• Trap Reversals
• Mitigation Moves
Pairs well with SMC-style analysis and order-flow-based trading.
________________________________________
🟡 Visual Signal Layers
• BUY / SELL Labels → Appear near structure flips and trap zones
• Yellow Label → High-risk trend shift zone
• LCB Boxes → Real-time market control zones
• Green/Red Liquidity Zones → Absorption or rejection
• MA Overlays → Adaptive slope-based guidance (optional)
• Pink Lines → High-reactivity reversal zones
• Yellow Line → Soft S/R (psychological pivot)
________________________________________
🎯 Suggested Entry & Exit Cues (Educational Use Only)
✅ Entry
• BUY near Blue LCB + liquidity reaction
• SELL after extended rallies into Orange LCB + trap behavior
• ⚠ Avoid trades directly at Yellow Labels unless other context supports
✅ Exit
• On opposite label after structure break
• On formation of opposite LCB
• Near major liquidity zones or pink levels
🧪 Always backtest label behavior to fit your strategy before use.
________________________________________
🔍 Originality Justification
This script introduces a non-indicator-based approach to structure detection — combining real-time volatility response, adaptive liquidity logic, and multi-mode filtering. It avoids conventional oscillators in favor of clarity-driven visual overlays, offering a novel experience especially useful to discretionary traders.
________________________________________
⚠️ Disclaimer
This script is for educational and informational purposes only. It does not constitute financial advice or a trading signal. Always validate performance with backtesting and forward testing before live use.
________________________________________

Contrarian Market Structure BreakMarket Structure Break application was inspired and adapted from Market Structure Oscillator indicator developed by Lux Algo. So much credit to their work.
This indicator pairs nicely with the Contrarian 100 MA and can be located here:
Indicator Description: Contrarian Market Structure BreakOverview
The "Contrarian Market Structure Break" indicator is a versatile tool tailored for traders seeking to identify potential reversal opportunities by analyzing market structure across multiple timeframes. Built on Institutional Concepts of Structure (ICT), this indicator detects Break of Structure (BOS) and Change of Character (CHoCH) patterns across short-term, intermediate-term, and long-term swings, plotting them with customizable lines and labels. It generates contrarian buy and sell signals when price breaks key swing levels, with a unique "Blue Dot Tracker" to monitor consecutive buy signals for trend confirmation. Optimized for the daily timeframe, this indicator is adaptable to other timeframes with proper testing, making it ideal for traders of forex, stocks, or cryptocurrencies.
How It Works
The indicator combines three key components to provide a comprehensive view of market dynamics: Multi-Timeframe Market Structure Analysis: It identifies swing highs and lows across short-term, intermediate-term, and long-term periods, plotting BOS (continuation) and CHoCH (reversal) events with customizable line styles and labels.
Contrarian Signal Generation: Buy and sell signals are triggered when the price crosses below swing lows (buy) or above swing highs (sell), indicating potential reversals in overextended markets.
Blue Dot Tracker: A unique feature that counts consecutive buy signals ("blue dots") and highlights a "Hold Investment" state with a yellow background when three or more buy signals occur, suggesting a potential trend continuation.
Signals are visualized as small circles below (buy) or above (sell) price bars, and a table in the bottom-right corner displays the blue dot count and recommended action (Hold or Flip Investment), enhancing decision-making clarity.
Mathematical Concepts Swing Detection: The indicator identifies swing highs and lows by comparing price patterns over three bars, ensuring robust detection of pivot points. A swing high occurs when the middle bar’s high is higher than the surrounding bars, and a swing low occurs when the middle bar’s low is lower.
Market Structure Logic: BOS is detected when the price breaks a prior swing high (bullish) or low (bearish) in the direction of the current trend, while CHoCH signals a potential reversal when the price breaks a swing level against the trend. These are calculated across three timeframes for a multi-dimensional perspective.
Blue Dot Tracker: This feature counts consecutive buy signals and tracks the entry price. If three or more buy signals occur without a sell signal, the indicator enters a "Hold Investment" state, marked by a yellow background, until the price exceeds the entry price or a sell signal occurs.
Entry and Exit Rules Buy Signal (Blue Dot Below Bar): Triggered when the closing price crosses below a swing low on either the intermediate-term or long-term timeframe, suggesting an oversold condition and potential reversal upward. Short-term signals can be enabled but are disabled by default to reduce noise.
Sell Signal (White Dot Above Bar): Triggered when the closing price crosses above a swing high on either the intermediate-term or long-term timeframe, indicating an overbought condition and potential reversal downward.
Blue Dot Tracker Logic: After a buy signal, the indicator increments a blue dot counter and records the entry price. If three or more consecutive buy signals occur (blueDotCount ≥ 3), the indicator enters a "Hold Investment" state, highlighted with a yellow background, suggesting a potential trend continuation. The "Hold Investment" state ends when the price exceeds the entry price or a sell signal occurs, resetting the counter.
Exit Rules: Traders can exit buy positions when a sell signal appears, the price exceeds the entry price during a "Hold Investment" state, or based on additional confirmation from BOS/CHoCH patterns or other technical analysis tools. Always use proper risk management.
Recommended Usage
The indicator is optimized for the daily timeframe, where it effectively captures significant reversal and continuation patterns in trending or ranging markets. It can be adapted to other timeframes (e.g., 1H, 4H, 15M) with careful testing of settings, particularly enabling/disabling short-term structure analysis to suit market conditions. Backtesting is recommended to optimize performance for your chosen asset and timeframe.
Customization Options Market Structure Display: Toggle short-term, intermediate-term, and long-term structures on or off, with customizable line styles (solid, dashed, dotted) and colors for bullish and bearish breaks.
Labels: Enable or disable BOS/CHoCH labels for each timeframe to reduce chart clutter.
Signal Visibility: Hide buy/sell signals if desired for a cleaner chart.
Blue Dot Tracker: Monitor the blue dot count and action (Hold or Flip Investment) via the table display, which is fully customizable in terms of position and appearance.
Why Use This Indicator?
The "Contrarian Market Structure Break" indicator offers a robust framework for identifying high-probability reversal and continuation setups using ICT principles. Its multi-timeframe analysis, clear signal visualization, and innovative Blue Dot Tracker provide traders with actionable insights into market dynamics. Whether you're a swing trader or a day trader, this indicator’s flexibility and intuitive design make it a valuable addition to your trading arsenal.
Note for TradingView Moderators
This script complies with TradingView's House Rules by providing an educational and transparent description without performance claims or guarantees. It is designed to assist traders in technical analysis and should be used alongside proper risk management and personal research. The code is original, well-documented, and includes customizable inputs and clear visual outputs to enhance the user experience.
Tips for Users:
Backtest thoroughly on your chosen asset and timeframe to validate signal reliability. Combine with other indicators or price action analysis for confirmation of entries and exits. Adjust timeframe settings and enable/disable short-term structures to match market volatility and your trading style.
Hope the "Contrarian Market Structure Break" indicator enhances your trading strategy and helps you navigate the markets with confidence! Happy trading!

Aetherium Institutional Market Resonance EngineAetherium Institutional Market Resonance Engine (AIMRE)
A Three-Pillar Framework for Decoding Institutional Activity
🎓 THEORETICAL FOUNDATION
The Aetherium Institutional Market Resonance Engine (AIMRE) is a multi-faceted analysis system designed to move beyond conventional indicators and decode the market's underlying structure as dictated by institutional capital flow. Its philosophy is built on a singular premise: significant market moves are preceded by a convergence of context , location , and timing . Aetherium quantifies these three dimensions through a revolutionary three-pillar architecture.
This system is not a simple combination of indicators; it is an integrated engine where each pillar's analysis feeds into a central logic core. A signal is only generated when all three pillars achieve a state of resonance, indicating a high-probability alignment between market organization, key liquidity levels, and cyclical momentum.
⚡ THE THREE-PILLAR ARCHITECTURE
1. 🌌 PILLAR I: THE COHERENCE ENGINE (THE 'CONTEXT')
Purpose: To measure the degree of organization within the market. This pillar answers the question: " Is the market acting with a unified purpose, or is it chaotic and random? "
Conceptual Framework: Institutional campaigns (accumulation or distribution) create a non-random, organized market environment. Retail-driven or directionless markets are characterized by "noise" and chaos. The Coherence Engine acts as a filter to ensure we only engage when institutional players are actively steering the market.
Formulaic Concept:
Coherence = f(Dominance, Synchronization)
Dominance Factor: Calculates the absolute difference between smoothed buying pressure (volume-weighted bullish candles) and smoothed selling pressure (volume-weighted bearish candles), normalized by total pressure. A high value signifies a clear winner between buyers and sellers.
Synchronization Factor: Measures the correlation between the streams of buying and selling pressure over the analysis window. A high positive correlation indicates synchronized, directional activity, while a negative correlation suggests choppy, conflicting action.
The final Coherence score (0-100) represents the percentage of market organization. A high score is a prerequisite for any signal, filtering out unpredictable market conditions.
2. 💎 PILLAR II: HARMONIC LIQUIDITY MATRIX (THE 'LOCATION')
Purpose: To identify and map high-impact institutional footprints. This pillar answers the question: " Where have institutions previously committed significant capital? "
Conceptual Framework: Large institutional orders leave indelible marks on the market in the form of anomalous volume spikes at specific price levels. These are not random occurrences but are areas of intense historical interest. The Harmonic Liquidity Matrix finds these footprints and consolidates them into actionable support and resistance zones called "Harmonic Nodes."
Algorithmic Process:
Footprint Identification: The engine scans the historical lookback period for candles where volume > average_volume * Institutional_Volume_Filter. This identifies statistically significant volume events.
Node Creation: A raw node is created at the mean price of the identified candle.
Dynamic Clustering: The engine uses an ATR-based proximity algorithm. If a new footprint is identified within Node_Clustering_Distance (ATR) of an existing Harmonic Node, it is merged. The node's price is volume-weighted, and its magnitude is increased. This prevents chart clutter and consolidates nearby institutional orders into a single, more significant level.
Node Decay: Nodes that are older than the Institutional_Liquidity_Scanback period are automatically removed from the chart, ensuring the analysis remains relevant to recent market dynamics.
3. 🌊 PILLAR III: CYCLICAL RESONANCE MATRIX (THE 'TIMING')
Purpose: To identify the market's dominant rhythm and its current phase. This pillar answers the question: " Is the market's immediate energy flowing up or down? "
Conceptual Framework: Markets move in waves and cycles of varying lengths. Trading in harmony with the current cyclical phase dramatically increases the probability of success. Aetherium employs a simplified wavelet analysis concept to decompose price action into short, medium, and long-term cycles.
Algorithmic Process:
Cycle Decomposition: The engine calculates three oscillators based on the difference between pairs of Exponential Moving Averages (e.g., EMA8-EMA13 for short cycle, EMA21-EMA34 for medium cycle).
Energy Measurement: The 'energy' of each cycle is determined by its recent volatility (standard deviation). The cycle with the highest energy is designated as the "Dominant Cycle."
Phase Analysis: The engine determines if the dominant cycles are in a bullish phase (rising from a trough) or a bearish phase (falling from a peak).
Cycle Sync: The highest conviction timing signals occur when multiple cycles (e.g., short and medium) are synchronized in the same direction, indicating broad-based momentum.
🔧 COMPREHENSIVE INPUT SYSTEM
Pillar I: Market Coherence Engine
Coherence Analysis Window (10-50, Default: 21): The lookback period for the Coherence Engine.
Lower Values (10-15): Highly responsive to rapid shifts in market control. Ideal for scalping but can be sensitive to noise.
Balanced (20-30): Excellent for day trading, capturing the ebb and flow of institutional sessions.
Higher Values (35-50): Smoother, more stable reading. Best for swing trading and identifying long-term institutional campaigns.
Coherence Activation Level (50-90%, Default: 70%): The minimum market organization required to enable signal generation.
Strict (80-90%): Only allows signals in extremely clear, powerful trends. Fewer, but potentially higher quality signals.
Standard (65-75%): A robust filter that effectively removes choppy conditions while capturing most valid institutional moves.
Lenient (50-60%): Allows signals in less-organized markets. Can be useful in ranging markets but may increase false signals.
Pillar II: Harmonic Liquidity Matrix
Institutional Liquidity Scanback (100-400, Default: 200): How far back the engine looks for institutional footprints.
Short (100-150): Focuses on recent institutional activity, providing highly relevant, immediate levels.
Long (300-400): Identifies major, long-term structural levels. These nodes are often extremely powerful but may be less frequent.
Institutional Volume Filter (1.3-3.0, Default: 1.8): The multiplier for detecting a volume spike.
High (2.5-3.0): Only registers climactic, undeniable institutional volume. Fewer, but more significant nodes.
Low (1.3-1.7): More sensitive, identifying smaller but still relevant institutional interest.
Node Clustering Distance (0.2-0.8 ATR, Default: 0.4): The ATR-based distance for merging nearby nodes.
High (0.6-0.8): Creates wider, more consolidated zones of liquidity.
Low (0.2-0.3): Creates more numerous, precise, and distinct levels.
Pillar III: Cyclical Resonance Matrix
Cycle Resonance Analysis (30-100, Default: 50): The lookback for determining cycle energy and dominance.
Short (30-40): Tunes the engine to faster, shorter-term market rhythms. Best for scalping.
Long (70-100): Aligns the timing component with the larger primary trend. Best for swing trading.
Institutional Signal Architecture
Signal Quality Mode (Professional, Elite, Supreme): Controls the strictness of the three-pillar confluence.
Professional: Loosest setting. May generate signals if two of the three pillars are in strong alignment. Increases signal frequency.
Elite: Balanced setting. Requires a clear, unambiguous resonance of all three pillars. The recommended default.
Supreme: Most stringent. Requires perfect alignment of all three pillars, with each pillar exhibiting exceptionally strong readings (e.g., coherence > 85%). The highest conviction signals.
Signal Spacing Control (5-25, Default: 10): The minimum bars between signals to prevent clutter and redundant alerts.
🎨 ADVANCED VISUAL SYSTEM
The visual architecture of Aetherium is designed not merely for aesthetics, but to provide an intuitive, at-a-glance understanding of the complex data being processed.
Harmonic Liquidity Nodes: The core visual element. Displayed as multi-layered, semi-transparent horizontal boxes.
Magnitude Visualization: The height and opacity of a node's "glow" are proportional to its volume magnitude. More significant nodes appear brighter and larger, instantly drawing the eye to key levels.
Color Coding: Standard nodes are blue/purple, while exceptionally high-magnitude nodes are highlighted in an accent color to denote critical importance.
🌌 Quantum Resonance Field: A dynamic background gradient that visualizes the overall market environment.
Color: Shifts from cool blues/purples (low coherence) to energetic greens/cyans (high coherence and organization), providing instant context.
Intensity: The brightness and opacity of the field are influenced by total market energy (a composite of coherence, momentum, and volume), making powerful market states visually apparent.
💎 Crystalline Lattice Matrix: A geometric web of lines projected from a central moving average.
Mathematical Basis: Levels are projected using multiples of the Golden Ratio (Phi ≈ 1.618) and the ATR. This visualizes the natural harmonic and fractal structure of the market. It is not arbitrary but is based on mathematical principles of market geometry.
🧠 Synaptic Flow Network: A dynamic particle system visualizing the engine's "thought process."
Node Density & Activation: The number of particles and their brightness/color are tied directly to the Market Coherence score. In high-coherence states, the network becomes a dense, bright, and organized web. In chaotic states, it becomes sparse and dim.
⚡ Institutional Energy Waves: Flowing sine waves that visualize market volatility and rhythm.
Amplitude & Speed: The height and speed of the waves are directly influenced by the ATR and volume, providing a feel for market energy.
📊 INSTITUTIONAL CONTROL MATRIX (DASHBOARD)
The dashboard is the central command console, providing a real-time, quantitative summary of each pillar's status.
Header: Displays the script title and version.
Coherence Engine Section:
State: Displays a qualitative assessment of market organization: ◉ PHASE LOCK (High Coherence), ◎ ORGANIZING (Moderate Coherence), or ○ CHAOTIC (Low Coherence). Color-coded for immediate recognition.
Power: Shows the precise Coherence percentage and a directional arrow (↗ or ↘) indicating if organization is increasing or decreasing.
Liquidity Matrix Section:
Nodes: Displays the total number of active Harmonic Liquidity Nodes currently being tracked.
Target: Shows the price level of the nearest significant Harmonic Node to the current price, representing the most immediate institutional level of interest.
Cycle Matrix Section:
Cycle: Identifies the currently dominant market cycle (e.g., "MID ") based on cycle energy.
Sync: Indicates the alignment of the cyclical forces: ▲ BULLISH , ▼ BEARISH , or ◆ DIVERGENT . This is the core timing confirmation.
Signal Status Section:
A unified status bar that provides the final verdict of the engine. It will display "QUANTUM SCAN" during neutral periods, or announce the tier and direction of an active signal (e.g., "◉ TIER 1 BUY ◉" ), highlighted with the appropriate color.
🎯 SIGNAL GENERATION LOGIC
Aetherium's signal logic is built on the principle of strict, non-negotiable confluence.
Condition 1: Context (Coherence Filter): The Market Coherence must be above the Coherence Activation Level. No signals can be generated in a chaotic market.
Condition 2: Location (Liquidity Node Interaction): Price must be actively interacting with a significant Harmonic Liquidity Node.
For a Buy Signal: Price must be rejecting the Node from below (testing it as support).
For a Sell Signal: Price must be rejecting the Node from above (testing it as resistance).
Condition 3: Timing (Cycle Alignment): The Cyclical Resonance Matrix must confirm that the dominant cycles are synchronized with the intended trade direction.
Signal Tiering: The Signal Quality Mode input determines how strictly these three conditions must be met. 'Supreme' mode, for example, might require not only that the conditions are met, but that the Market Coherence is exceptionally high and the interaction with the Node is accompanied by a significant volume spike.
Signal Spacing: A final filter ensures that signals are spaced by a minimum number of bars, preventing over-alerting in a single move.
🚀 ADVANCED TRADING STRATEGIES
The Primary Confluence Strategy: The intended use of the system. Wait for a Tier 1 (Elite/Supreme) or Tier 2 (Professional/Elite) signal to appear on the chart. This represents the alignment of all three pillars. Enter after the signal bar closes, with a stop-loss placed logically on the other side of the Harmonic Node that triggered the signal.
The Coherence Context Strategy: Use the Coherence Engine as a standalone market filter. When Coherence is high (>70%), favor trend-following strategies. When Coherence is low (<50%), avoid new directional trades or favor range-bound strategies. A sharp drop in Coherence during a trend can be an early warning of a trend's exhaustion.
Node-to-Node Trading: In a high-coherence environment, use the Harmonic Liquidity Nodes as both entry points and profit targets. For example, after a BUY signal is generated at one Node, the next Node above it becomes a logical first profit target.
⚖️ RESPONSIBLE USAGE AND LIMITATIONS
Decision Support, Not a Crystal Ball: Aetherium is an advanced decision-support tool. It is designed to identify high-probability conditions based on a model of institutional behavior. It does not predict the future.
Risk Management is Paramount: No indicator can replace a sound risk management plan. Always use appropriate position sizing and stop-losses. The signals provided are probabilistic, not certainties.
Past Performance Disclaimer: The market models used in this script are based on historical data. While robust, there is no guarantee that these patterns will persist in the future. Market conditions can and do change.
Not a "Set and Forget" System: The indicator performs best when its user understands the concepts behind the three pillars. Use the dashboard and visual cues to build a comprehensive view of the market before acting on a signal.
Backtesting is Essential: Before applying this tool to live trading, it is crucial to backtest and forward-test it on your preferred instruments and timeframes to understand its unique behavior and characteristics.
🔮 CONCLUSION
The Aetherium Institutional Market Resonance Engine represents a paradigm shift from single-variable analysis to a holistic, multi-pillar framework. By quantifying the abstract concepts of market context, location, and timing into a unified, logical system, it provides traders with an unprecedented lens into the mechanics of institutional market operations.
It is not merely an indicator, but a complete analytical engine designed to foster a deeper understanding of market dynamics. By focusing on the core principles of institutional order flow, Aetherium empowers traders to filter out market noise, identify key structural levels, and time their entries in harmony with the market's underlying rhythm.
"In all chaos there is a cosmos, in all disorder a secret order." - Carl Jung
— Dskyz, Trade with insight. Trade with confluence. Trade with Aetherium.

Pineify Signals and OverlaysIndicator Theoretical Basis
Pineify Signals and Overlays is an invite-only trend-following and reversal-detection toolkit that fuses four well-known concepts— Dow-Theory trend phases , a multi-pair EMA cloud, QQE momentum, and ATR-based risk management—into a single, weight-balanced engine. An optional multi-time-frame (MTF) filter aligns lower-time-frame signals with higher-time-frame structure, helping traders avoid counter-trend setups. All components can be toggled from the settings panel, and a beginner “One-Click” preset loads a conservative profile out of the box.
Why it’s a single script: The algorithm scores every bar on three orthogonal axes—trend, momentum, and volatility—then issues context-aware arrows and coloured clouds only when the axes agree within user-defined tolerances. This inter-locking logic cannot be reproduced by simply stacking independent indicators on a chart, hence the need for an integrated implementation.
Trend Confirmation
Trend Confirmation: This indicator presents two types of market trends: the primary trend and the secondary trend. The primary trend is the long - term direction of the market and can last for days or months; the secondary trend is the adjustment phase within the primary trend.
This indicator uses the EMA (Exponential Moving Average) and visualizes the trend phases through color filling. The judgment of the trend is that blue plus green indicates a bullish trend, and yellow plus red indicates a bearish trend.
The primary trend of this indicator is visualized by two sets of moving averages through color filling. These two sets of moving averages are used to describe the short - term and long - term trends in the market.
The short - period moving averages and the long - period moving averages each consist of 4 moving averages, with a total of 8 moving averages, representing the short - term fluctuations and trends of the market.
Trend Persistence: Once the primary trend is formed, it will persist for a period of time. This indicator judges based on the Dow Theory. Short - term market fluctuations do not necessarily reflect changes in the primary trend. Therefore, the judgment direction of the primary trend is visualized through color.
The Signals of Buying, Selling and Closing
In the primary trend, we can see signals of trend reversal. This indicator incorporates the "Consecutive Candles". The indicator mainly identifies the overbought or oversold state of the market through a series of consecutive conditions, so as to predict the reversal point. The core of this indicator is to identify a series of consecutive price movements in the market trend and determine whether the market is about to reverse based on this sequence. We visualize the turning points through buy and sell signals.
The trend confirmation system utilizes four pairs of Exponential Moving Averages (EMAs) creating dynamic cloud formations that visualize market direction. Short-period EMAs (5, 8, 20, 34) interact with longer-period EMAs (9, 13, 21, 50) to generate color-coded trend clouds . Blue and green clouds indicate bullish conditions, while yellow and red clouds signal bearish trends, providing immediate visual trend identification.
The presentation of buying and selling points, namely "Quantitative Qualitative Estimation", is a technical indicator that combines the concepts of the Relative Strength Index (RSI) and moving averages. It is used to evaluate market trends, overbought and oversold conditions, as well as potential trend reversal points. The oscillator has a relatively long smoothing period, making the indicator relatively stable, thus enabling the visualization of buy + and sell + signals for trading.
ATR Stop - Loss Line
ATR (Average True Range) is an indicator for measuring market volatility. By using the ATR value to set the stop - loss distance, the stop - loss level can be automatically adjusted according to market volatility, making the stop - loss more flexible.
Core principle
Trend-Cloud Engine
EMA Pairs (5, 8, 20, 34 vs 9, 13, 21, 50)—Two four-EMA sets form “fast” and “slow” envelopes. When the volume-weighted mean of the fast set sits above the slow set and both slopes are positive, the bar is tagged primary bullish; the inverse tags primary bearish. Cloud colours (blue/green vs yellow/red) mirror Dow Theory’s primary/secondary trend hierarchy.
Momentum & Exhaustion Layer
QQE Oscillator (RSI 14, factor 4.238) detects momentum extremes and smooths noise more than a raw RSI, making it better suited for multi-time-frame use.
Consecutive-Candle Counter (default 8) highlights potential exhaustion after extended unidirectional moves; reversal symbols appear only if QQE divergence also exists.
Volatility-Adjusted Risk Line
ATR Trailing Stop (ATR 21, dynamic multiplier) expands in high volatility and tightens in low volatility, offering an adaptive exit reference rather than a fixed-tick stop.
Multi-Time-Frame Confirmation
The script automatically chooses a higher aggregation (e.g., 4 × the chart timeframe) and requires primary-trend agreement before issuing “Long ▲+” or “Short ▼+” confirmations. This guards against false signals during counter-trend rebounds.
Recommended parameters
RSI Length: 14 (QQE calculation base)
QQE Factor: 4.238 (Fibonacci-based multiplier)
ATR Period: 21 (volatility measurement)
EMA Lengths: Configurable short (5,8,20,34) and long (9,13,21,50) periods
Consecutive Candles: Selectable count (8)
Multi-timeframe Filter: Filter is enabled by default, resulting in more accurate signals.
Filters
The multi-timeframe filter enhances signal reliability by confirming trends across higher timeframes. This prevents counter-trend trades by ensuring alignment between current chart timeframe and broader market direction. The filter automatically calculates appropriate higher timeframes for trend confirmation.
Signals & Alerts
The indicator system exports multiple alert signals, and you can easily alert for any signal.
Up Trend : Primary long signal appears
Long - ▲ : Buy signal appears
Long - ▲+ : Confirmation buy signal appears
Long - ● : Primary reversal signal appears
Long - ☓ : Secondary reversal signal appears
Down Trend : Primary short signal appears
Short - ▼ : Sell signal appears
Short - ▼+ : Confirmation sell signal appears
Short - ● : Primary reversal signal appears
Short - ☓ : Secondary reversal signal appears
Originality & Value for Traders
Integrated scoring logic ensures signals fire only when trend, momentum, and volatility metrics corroborate, reducing “indicator conflict”.
Auto-computed MTF pairs mean no manual timeframe juggling.
Weight-balanced QQE/EMA blend creates smoother trend clouds than standard MA crosses, yet remains more responsive than Keltner or Donchian approaches.
One-click beginner profile plus full parameter access supports both novice and advanced users.
Risk Disclaimer
Use with Caution: This indicator is provided for educational and informational purposes only and should not be considered as financial advice. Users should exercise caution and perform their own analysis before making trading decisions based on the indicator's signals.
Not Financial Advice: The information provided by this indicator does not constitute financial advice, and the creator (Pineify) shall not be held responsible for any trading losses incurred as a result of using this indicator.
Backtesting Recommended: Traders are encouraged to backtest the indicator thoroughly on historical data before using it in live trading to assess its performance and suitability for their trading strategies.
Risk Management: Trading involves inherent risks, and users should implement proper risk management strategies, including but not limited to stop-loss orders and position sizing, to mitigate potential losses.
No Guarantees: The accuracy and reliability of the indicator's signals cannot be guaranteed, as they are based on historical price data and past performance may not be indicative of future results.

Cross-Sectional Altcoin Portfolio [BackQuant]Cross-Sectional Altcoin Portfolio
Introducing BackQuant's Cross-Sectional Altcoin Portfolio, a sophisticated trading system designed to dynamically rotate among a selection of major altcoins. This portfolio strategy compares multiple assets based on real-time performance metrics, such as momentum and trend strength, to select the strongest-performing coins. It uses a combination of adaptive scoring and regime filters to ensure the portfolio is aligned with favorable market conditions, minimizing exposure during unfavorable trends.
This system offers a comprehensive solution for crypto traders who want to optimize portfolio allocation based on cross-asset performance, while also accounting for market regimes. It allows traders to compare multiple altcoins dynamically and allocate capital to the top performers, ensuring the portfolio is always positioned in the most promising assets.
Key Features
1. Dynamic Asset Rotation:
The portfolio constantly evaluates the relative strength of 10 major altcoins: SOLUSD, RUNEUSD, ORDIUSD, DOGEUSDT, ETHUSD, ENAUSDT, RAYUSDT, PENDLEUSD, UNIUSD, and KASUSDT.
Using a ratio matrix, the system selects the strongest asset based on momentum and trend performance, dynamically adjusting the allocation as market conditions change.
2. Long-Only Portfolio with Cash Reserve:
The portfolio only takes long positions or remains in cash. The system does not enter short positions, reducing the risk of exposure during market downturns.
A powerful regime filter ensures the system is inactive during periods of market weakness, defined by the Universal Trend Performance Indicator (TPI) and other market data.
3. Equity Tracking:
The script provides real-time visualizations of portfolio equity compared to buy-and-hold strategies.
Users can compare the performance of the portfolio against holding individual assets (e.g., BTC, ETH) and see the benefits of the dynamic allocation.
4. Performance Metrics:
The system provides key performance metrics such as:
Sharpe Ratio: Measures risk-adjusted returns.
Sortino Ratio: Focuses on downside risk.
Omega Ratio: Evaluates returns relative to risk.
Maximum Drawdown: The maximum observed loss from a peak to a trough.
These metrics allow traders to assess the effectiveness of the strategy versus simply holding the assets.
5. Regime Filter:
The system incorporates a regime filter that evaluates the overall market trend using the TPI and other indicators. If the market is in a downtrend, the system exits positions and moves to cash, avoiding exposure to negative market conditions.
Users can customize the thresholds for the long and short trends to fit their risk tolerance.
6. Customizable Parameters:
Traders can adjust key parameters, such as the backtest start date, starting capital, leverage multiplier, and visualization options, including equity plot colors and line widths.
The system supports different levels of customizations for traders to optimize their strategies.
7. Equity and Buy-and-Hold Comparisons:
This script enables traders to see the side-by-side comparison of the portfolio’s equity curve and the equity curve of a buy-and-hold strategy for each asset.
The comparison allows users to evaluate the performance of the dynamic strategy versus holding the altcoins in isolation.
8. Forward Test (Out-of-Sample Testing):
The system includes a note that the portfolio provides out-of-sample forward tests, ensuring the robustness of the strategy. This is crucial for assessing the portfolio's performance beyond historical backtesting and validating its ability to adapt to future market conditions.
9. Visual Feedback:
The system offers detailed visual feedback on the current asset allocation and performance. Candles are painted according to the trend of the selected assets, and key metrics are displayed in real-time, including the momentum scores for each asset.
10. Alerts and Notifications:
Real-time alerts notify traders when the system changes asset allocations or moves to cash, ensuring they stay informed about portfolio adjustments.
Visual labels on the chart provide instant feedback on which asset is currently leading the portfolio allocation.
How the Rotation Works
The portfolio evaluates 10 different assets and calculates a momentum score for each based on their price action. This score is processed through a ratio matrix, which compares the relative performance of each asset.
Based on the rankings, the portfolio allocates capital to the top performers, ensuring it rotates between the strongest assets while minimizing exposure to underperforming assets.
If no asset shows strong performance, the system defaults to cash to preserve capital.
Final Thoughts
BackQuant’s Cross-Sectional Altcoin Portfolio provides a dynamic and systematic approach to altcoin portfolio management. By employing real-time performance metrics, adaptive scoring, and regime filters, this strategy aims to optimize returns while minimizing exposure to market downturns. The inclusion of out-of-sample forward tests ensures that the system remains robust in live market conditions, making it an ideal tool for crypto traders seeking to enhance their portfolio's performance with a data-driven, momentum-based approach.

(Mustang Algo) Stochastic RSI + Triple EMAStochastic RSI + Triple EMA (StochTEMA)
Overview
The Stochastic RSI + Triple EMA indicator combines the Stochastic RSI oscillator with a Triple Exponential Moving Average (TEMA) overlay to generate clear buy and sell signals on the price chart. By measuring RSI overbought/oversold conditions and confirming trend direction with TEMA, this tool helps traders identify high-probability entries and exits while filtering out noise in choppy markets.
Key Features
Stochastic RSI Calculation
Computes a standard RSI over a user-defined period (default 50).
Applies a Stochastic oscillator to the RSI values over a second user-defined period (default 50).
Smooths the %K line by taking an SMA over a third input (default 3), and %D is an SMA of %K over another input (default 3).
Defines oversold when both %K and %D are below 20, and overbought when both are above 80.
Triple EMA (TEMA)
Calculates three successive EMAs on the closing price with the same length (default 9).
Combines them using TEMA = 3×(EMA1 – EMA2) + EMA3, producing a fast-reacting trend line.
Bullish trend is identified when price > TEMA and TEMA is rising; bearish trend when price < TEMA and TEMA is falling; neutral/flat when TEMA change is minimal.
Signal Logic
Strong Buy: Previous bar’s Stoch RSI was oversold (both %K and %D < 20), %K crosses above %D, and TEMA is in a bullish trend.
Medium Buy: %K crosses above %D (without requiring oversold), TEMA is bullish, and previous %K < 50.
Weak Buy: Previous bar’s %K and %D were oversold, %K crosses above %D, TEMA is flat or bullish (not bearish).
Strong Sell: Previous bar’s Stoch RSI was overbought (both %K and %D > 80), %K crosses below %D, and TEMA is bearish.
Medium Sell: %K crosses below %D (without requiring overbought), TEMA is bearish, and previous %K > 50.
Weak Sell: Previous bar’s %K and %D were overbought, %K crosses below %D, TEMA is flat or bearish (not bullish).
Visual Elements on Chart
TEMA Line: Plotted in cyan (#00BCD4) with a medium-thick line for clear trend visualization.
Buy/Sell Markers:
BUY STRONG: Lime label below the candle
BUY MEDIUM: Green triangle below the candle
BUY WEAK: Semi-transparent green circle below the candle
SELL STRONG: Red label above the candle
SELL MEDIUM: Orange triangle above the candle
SELL WEAK: Semi-transparent orange circle above the candle
Candle & Background Coloring: When a strong buy or sell signal occurs, the candle body is tinted (semi-transparent lime/red) and the chart background briefly flashes light green (buy) or light red (sell).
Dynamic Support/Resistance:
On a strong buy signal, a green dot is plotted under that bar’s low as a temporary support marker.
On a strong sell signal, a red dot is plotted above that bar’s high as a temporary resistance marker.
Alerts
Strong Buy Alert: Triggered when Stoch RSI is oversold, %K crosses above %D, and TEMA is bullish.
Strong Sell Alert: Triggered when Stoch RSI is overbought, %K crosses below %D, and TEMA is bearish.
General Buy Alert: Triggered on any bullish crossover (%K > %D) when TEMA is not bearish.
General Sell Alert: Triggered on any bearish crossover (%K < %D) when TEMA is not bullish.
Inputs
Stochastic RSI Settings (group “Stochastic RSI”):
K (smoothK): Period length for smoothing the %K line (default 3, minimum 1)
D (smoothD): Period length for smoothing the %D line (default 3, minimum 1)
RSI Length (lengthRSI): Number of bars used for the RSI calculation (default 50, minimum 1)
Stochastic Length (lengthStoch): Number of bars for the Stochastic oscillator applied to RSI (default 50, minimum 1)
RSI Source (src): Price source for the RSI (default = close)
TEMA Settings (group “Triple EMA”):
TEMA Length (lengthTEMA): Number of bars used for each of the three EMAs (default 9, minimum 1)
How to Use
Add the Script
Copy and paste the indicator code into TradingView’s Pine Editor (version 6).
Save the script and add it to your chart as “Stochastic RSI + Triple EMA (StochTEMA).”
Adjust Inputs
Choose shorter lengths for lower timeframes (e.g., intraday scalping) and longer lengths for higher timeframes (e.g., swing trading).
Fine-tune the Stochastic RSI parameters (K, D, RSI Length, Stochastic Length) to suit the volatility of the instrument.
Modify TEMA Length if you prefer a faster or slower moving average response.
Interpret Signals
Primary Entries/Exits: Focus on “BUY STRONG” and “SELL STRONG” signals, as they require both oversold/overbought conditions and a confirming TEMA trend.
Confirmation Signals: Use “BUY MEDIUM”/“BUY WEAK” to confirm or add to an existing position when the market is trending. Similarly, “SELL MEDIUM”/“SELL WEAK” can be used to scale out or confirm bearish momentum.
Support/Resistance Dots: These help identify recent swing lows (green dots) and swing highs (red dots) that were tagged by strong signals—useful to place stop-loss or profit-target orders.
Set Alerts
Open the Alerts menu (bell icon) in TradingView, choose this script, and select the desired alert condition (e.g., “BUY Signal Strong”).
Configure notifications (popup, email, webhook) according to your trading workflow.
Notes & Best Practices
Filtering False Signals: By combining Stoch RSI crossovers with TEMA trend confirmation, most false breakouts during choppy price action are filtered out.
Timeframe Selection: This indicator works on all timeframes, but shorter timeframes may generate frequent signals—consider higher-timeframe confirmation when trading lower timeframes.
Risk Management: Always use proper position sizing and stop-loss placement. An “oversold” or “overbought” reading can remain extended for some time in strong trends.
Backtesting/Optimization: Before live trading, backtest different parameter combinations on historical data to find the optimal balance between sensitivity and reliability for your chosen instrument.
No Guarantee of Profits: As with any technical indicator, past performance does not guarantee future results. Use in conjunction with other forms of analysis (volume, price patterns, fundamentals).
Author: Your Name or Username
Version: 1.0 (Pine Script v6)
Published: June 2025
Feel free to customize input values and visual preferences. If you find bugs or have suggestions for improvements, open an issue or leave a comment below. Trade responsibly!

Bollinger Bands Oscillator | QuantMAC📊 Bollinger Bands Oscillator | QuantMAC
🎯 Overview
The Bollinger Bands Oscillator is a sophisticated technical analysis tool that combines the power of traditional Bollinger Bands with an oscillator-based approach for enhanced signal generation. This indicator transforms the classic Bollinger Bands into a percentage-based oscillator, providing clearer entry and exit signals for both trending and ranging markets.
🔧 Key Features
Dual Trading Modes : Choose between Long/Short or Long/Cash strategies
Advanced BB% Calculation : Enhanced Bollinger Band percentage with customizable multipliers
Comprehensive Metrics : Built-in performance analytics including Sharpe Ratio, Sortino Ratio, and Profit Factor
Visual Color Coding : Dynamic bar coloring and 9 different color schemes for optimal chart visibility
Date Range Filtering : Backtest specific time periods with customizable start dates
Real-time Signal Generation : Clear long and short entry signals with threshold customization
Advanced Risk Management : Half Kelly criterion calculation for optimal position sizing
📈 How It Works
The indicator operates by calculating a modified Bollinger Band percentage that oscillates between values, typically ranging from 0 to 100+. When the BB% crosses above the Long Threshold (default: 83), it generates a bullish signal. Conversely, when it crosses below the Short Threshold (default: 55), it produces a bearish signal.
Core Calculation Process:
Calculate the moving average basis using the specified Base Length (default: 40 periods)
Determine standard deviation using a separate SD Length (default: 27 periods)
Create upper and lower bands using the SD Multiplier (default: 2.6)
Convert to percentage oscillator with BB% Multiplier (default: 100)
Generate signals based on threshold crossovers
⚙️ Customizable Parameters
BMD Settings:
Base Length : Controls the moving average period (default: 40)
Standard Deviation Length : Determines volatility calculation period (default: 27)
SD Multiplier : Adjusts band width sensitivity (default: 2.6)
BB% Multiplier : Scales the oscillator values (default: 100)
Source : Choose price source (close, open, high, low, etc.)
Signal Thresholds:
Long Threshold : Entry level for bullish positions (default: 83)
Short Threshold : Entry level for bearish positions (default: 55)
🎨 Visual Elements
Main Chart Overlay:
Bollinger Bands : Upper and lower bands with customizable colors and transparency
Middle Line : Basis line displayed as subtle dots
Band Fill : Colored area between bands for easy visualization
Bar Coloring : Candles change color based on current signal state
Separate Oscillator Pane:
BB% Line : Main oscillator line with dynamic coloring
Threshold Lines : Horizontal lines marking entry/exit levels
Color Coding : Line colors change based on bullish/bearish state
📊 Performance Metrics
The indicator includes a comprehensive metrics table displaying:
Net Profit % : Total return percentage
Max Drawdown % : Maximum peak-to-trough decline
Win Rate % : Percentage of profitable trades
Profit Factor : Ratio of gross profit to gross loss
Sharpe Ratio : Risk-adjusted return measure
Sortino Ratio : Downside risk-adjusted return
Omega Ratio : Probability-weighted ratio of gains vs losses
Half Kelly % : Optimal position sizing recommendation
Total Trades : Number of completed transactions
🎯 Trading Strategies
Long/Short Mode: 🔄
The indicator alternates between long and short positions based on threshold crossovers. This mode is ideal for traders who can profit from both rising and falling markets.
Long/Cash Mode: 💰
This conservative approach only takes long positions, moving to cash during bearish signals. Perfect for traders in accounts that don't allow short selling or those preferring a buy-and-hold approach with strategic exits.
🚀 Getting Started
Add the indicator to your chart
Choose your preferred Trading Mode (Long/Short or Long/Cash)
Adjust the Base Length and SD Length to match your trading timeframe
Fine-tune the Long Threshold and Short Threshold based on your risk tolerance
Select your preferred color scheme from 9 available options
Enable the metrics table to monitor performance in real-time
💡 Pro Tips
Lower thresholds (e.g., Long: 75, Short: 60) generate more frequent but potentially less reliable signals
Higher thresholds (e.g., Long: 90, Short: 45) produce fewer but potentially higher-quality signals
Shorter base lengths make the indicator more responsive to recent price action
Longer base lengths smooth out noise but may lag market turns
Use the Half Kelly % metric to guide position sizing decisions
⚠️ Important Disclaimers
Past performance is not indicative of future results . This indicator is a technical analysis tool designed to assist in trading decisions but should not be used as the sole basis for investment choices.
Key Risk Considerations:
Market Conditions : No indicator works perfectly in all market environments
Backtesting Bias : Historical performance may not reflect future market behavior
Risk Management : Always use proper position sizing and stop-loss orders
Multiple Confirmations : Consider using additional indicators and analysis methods
📚 Educational Value
This indicator serves as an excellent learning tool for understanding:
Bollinger Band mechanics and interpretation
Oscillator-based trading strategies
Performance metrics and risk assessment
Position sizing using Kelly Criterion principles
The relationship between volatility and price movement
🔔 Updates and Support
The Bollinger Bands Oscillator | QuantMAC is regularly updated to ensure compatibility with TradingView's latest features. The code is thoroughly commented for educational purposes and transparency.
Remember: Trading involves substantial risk of loss and is not suitable for all investors. The value of investments may go down as well as up, and you may not get back the amount you invested. Always conduct your own research and consider seeking advice from a qualified financial advisor.

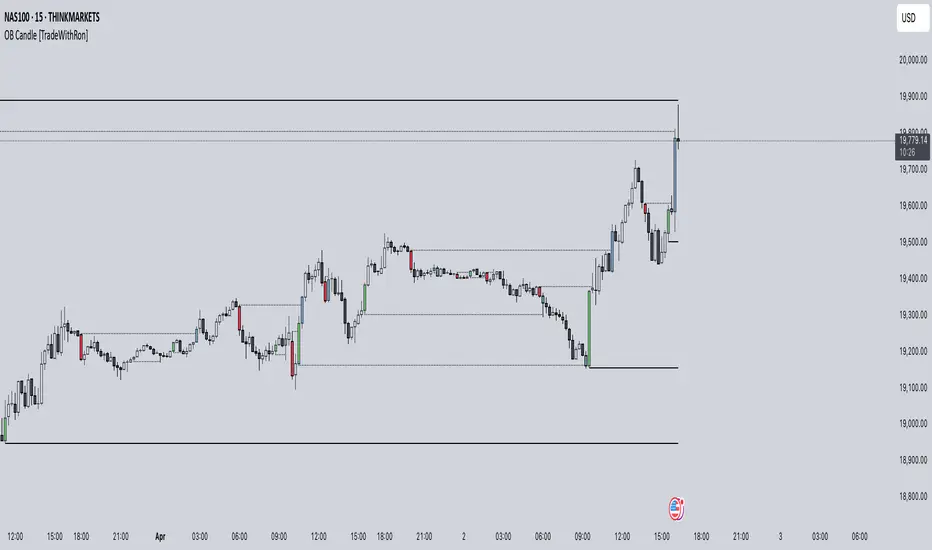
RunRox - Entry Model🎯 RunRox Entry Model is an all-in-one reversal-pattern indicator engineered to help traders accurately identify key price-reversal points on their charts. It will be part of our premium indicator package and improve the effectiveness of your trading strategies.
The primary concept of this indicator is liquidity analysis, making it ideal for Smart Money traders and for trading within market structure. At the same time, the indicator is universal and can be integrated into any strategy. Below, I will outline the full concept of the indicator and its settings so you can better understand how it works.
🧬 CONCEPT
In the screenshot below, I’ll schematically illustrate the core idea of this indicator. It’s one of the patterns that the indicator automatically detects on the chart using a two-timeframe approach. We use the higher timeframe to identify liquidity zones, and the lower timeframe to capture liquidity removal and structure breaks. The schematic is shown in the screenshot below.
Our indicator includes three entry models in total , and I will discuss its functionality and features in more detail later in this post.
💡 FEATURES
Three entry models
PO3 HTF Bar
Entry Area
Optimization for each Entry Area
Filters
HTF FVG
Alert customization
Next, we will examine each entry model in detail.
🟠 ENTRY MODEL 1
The first model is the core one we’ll work with; all other models rely on its structure and construction. In the screenshot below, I’ll schematically show the complete model.
As shown in the screenshot above, we display higher-timeframe candles on the current chart to better visualize the entry model and keep the trader informed of what’s happening on the larger timeframe. The screenshot also highlights both the Long and Short models, as well as the Entry Area, which I will explain in more detail below.
The schematic model on the lower timeframe is shown in the screenshot above. It illustrates that after the Entry Model forms, we draw the Entry Area on the next candle and wait for a price pullback into this zone for the optimal trade entry. Statistically, before moving higher, the price typically revisits the Entry Area, covering the imbalances created by MSS; thus, the Entry Area represents the ideal entry point.
🟩 Entry Area
Once the Entry Model has formed, we focus on identifying the optimal pullback zone for taking a position. To determine which retracement area performs best, we conducted extensive historical backtesting on potential zones and selected those that consistently delivered the strongest results. This process yields Entry Areas with the highest probability of a successful reversal.
On the screenshot above, you can see an example of the Entry Area and which zones carry a higher versus lower probability of reversal. Zones rendered with greater transparency have historically delivered weaker results than the more opaque zones. The deeper-colored areas represent the optimal entry zones and can improve your risk-reward ratio by allowing you to enter at more favorable prices.
It’s important to remember that the entire Entry Area functions as a potential zone for scaling into a position. However, if your risk-to-reward ratio isn’t favorable, you can wait for the price to retrace to lower levels within the Entry Area and enter with a more attractive risk-to-reward.
🟢 Pattern Rating
Each entry model receives a rating in the form of green circles next to its name 🟢. The rating ranges from one to four circles, based on the historical performance of similar patterns. To calculate this rating, we backtest past data by analyzing candle behavior during the model’s formation and assign circles according to how similar patterns performed historically.
Example Ratings:
🟢 – One circle
🟢🟢 – Two circles
🟢🟢🟢 – Three circles
🟢🟢🟢🟢 – Four circles
The more green circles a model has, the more reliable it is—but it’s crucial to rely on your own analysis when identifying strong reversal points on the chart. This rating reflects the model’s historical performance and does not guarantee future results, so keep that in mind!
Below is a screenshot showing four model variations with different ratings on the chart.
⚠️ Unconfirmed Pattern
Entry Model 1 is designed so that, until the higher-timeframe candle closes, the pattern remains unconfirmed and is hidden on the chart. For traders who prefer to see setups as they form, there’s a dedicated feature that displays the unconfirmed pattern at the moment of its appearance - triggered by the Market Structure Shift - before the HTF candle closes. The screenshot below shows what the pattern looks like prior to confirmation.
‼️IMPORTANT: Until the pattern is confirmed and the higher-timeframe candle has closed, the model may disappear from the chart if price reverses and the HTF candle closes below the previous bar. Therefore, this mode is suitable only for experienced traders who want to see market moves in advance. Remember that the pattern can be removed from the chart, so we recommend waiting for the HTF candle to close before deciding to enter a trade.‼️
✂️ Filters
For the primary model, there are four filters designed to enhance entry points or exclude less-confirmed patterns. The filters available in the indicator are:
Bounce Filter
Market Shift Mode
Same Wave Filter
Only with Divergence
I will explain how each of these filters works below.
- Bounce Filter
The Bounce Filter identifies significant deviations of price from its mean and only displays the Entry Model once the asset’s price moves beyond the average level. The screenshot below illustrates how this appears on the chart.
The actual average-price calculation is more sophisticated than what’s shown in the screenshot, that image is just an illustrative example. When the price deviates significantly from the N-bar average, we start looking for the Entry Model. This approach works particularly well in range-bound markets without a clear trend, as it lets you trade strong deviations from the mean.
- Market Shift Mode
This filter works by detecting the initial impulse that triggered the liquidity sweep on the previous higher-timeframe candle, and then holding the Market Structure Shift level at that point after the sweep. If the filter is turned off, price may move higher following the liquidity removal, creating a new MSS level and potentially producing a false structure shift and entry signal on the formed model.
This filter helps you more accurately identify genuine shifts - but keep in mind that the model can still perform well without it, so choose the setting that best suits your trading style.
- Same Wave Filter
The Same Wave Filter removes entry models that form without a clear lower-timeframe structure when liquidity is swept from the previous higher-timeframe candle. In other words, if the prior HTF candle and the current one belong to the same impulse wave - without any retracements on the LTF - the model is filtered out.
Keep in mind that this filter may also exclude patterns that could have produced positive results, so whether to enable it depends on your trading system.
- Only with Divergence
The Only with Divergence filter detects divergence between the lows of successive candles and indicators like RSI. When the low that swept liquidity diverges from the previous candle’s low, the indicator displays a “DIV” label. Although RSI is cited as an example, our divergence calculation is more advanced. This filter highlights patterns where low divergence signals genuine liquidity manipulation and a likely aggressive price reversal.
🌀 Model Settings
Trade Direction: Choose whether to display models for Long or Short trades.
Fractal: Select between automatic fractal detection—which adapts the lower-timeframe (LTF) and higher-timeframe (HTF) candles—or Custom.
Custom Fractal: When Custom is selected, manually specify the LTF and HTF timeframes used to detect the patterns.
History Pattern Limit: Set the maximum number of patterns to display on the chart to keep it clean and uncluttered.
🎨 Model Style
You can flexibly customize the model’s appearance by choosing your preferred line thickness, color, and the other settings we discussed above.
🔵 ENTRY MODEL 2
This model appears under specific conditions when Model 1 cannot form. It’s a price-reversal model constructed according to different rules than the first model. The screenshot below shows how it looks on the chart.
This model forms less frequently than Model 1 but delivers equally strong performance and is displayed as a position-entry zone.
Like the Entry Area in Entry Model 1, this zone is calculated automatically and highlights the best entry levels: areas that showed the strongest historical results are rendered in a brighter shade.
🎨 Model Style
You can flexibly customize the style of Entry Model 2 - its color, opacity, visibility, and the average price of the previous candle.
🟢 ENTRY MODEL 3
Entry Model 3 is a continuation pattern that only forms after Entry Model 1 has completed and delivered the necessary price move to trigger Model 3.
Below is a schematic illustration of how Model 3 is intended to work.
🎨 Model Style
As with the previous models, you can flexibly customize the style of this zone.
⬆️ HTF CANDLES
One of the standout features of this indicator is the ability to plot higher-timeframe (HTF) candles directly on your lower-timeframe (LTF) chart, giving you clear visualization of the entry models and insight into what’s unfolding on the larger timeframe.
You can fully customize the HTF candles - select their style, the number of bars displayed, and tweak various settings to match your personal trading style.
HTF FVG
Fair Value Gaps (FVGs) can also be drawn on the HTF candles themselves, enabling you to spot key liquidity or interest zones at a glance, without switching between timeframes.
Additionally, you can view all significant historical HTF highs and lows, with demarcation lines showing where each HTF candle begins and ends.
All these options let you tailor the HTF candle display on your chart and monitor multiple timeframes’ trends in a single view.
📶 INFO PANEL
Instrument: the market symbol on which the model is detected
Fractal Timeframes: the LTF and HTF fractal periods used to locate the pattern
HTF Candle Countdown: the time remaining until the higher-timeframe candle closes
Trade Direction: the direction (Long or Short) in which the model is searched for entry
🔔 ALERT CUSTOMIZATION
And, of course, you can configure any alerts you need. There are seven alert types available:
Confirmed Entry Model 1
Unconfirmed Entry Model 1
Confirmed Entry Model 2
Confirmed Entry Model 3
Entry Area 1 Trigger
Entry Area 2 Trigger
Entry Area 3 Trigger
You also get a custom macro field where you can enter any placeholders to fully personalize your alerts. Below are example macros you can use in that field.
{{event}} - Event name ('New M1')
{{direction}} - Trade direction ('Long', 'Short')
{{area_beg}} - Entry Area Price
{{area_end}} - Entry Area Price
{{exchange}} - Exchange ('Binance')
{{ticker}} - Ticker ('BTCUSD')
{{interval}} - Timeframe ('1s', '1', 'D')
{{htf}} - High timeframe ('15', '60', 'D')
{{open}}-{{close}}-{{high}}-{{low}} - Candle price values
{{htf_open}}-{{htf_close}}-{{htf_high}}-{{htf_low}} - Last confirmed HTF candle's price
{{volume}} - Candle volume
{{time}} - Candle open time in UTC timezone
{{timenow}} - Signal time in UTC timezone
{{syminfo.currency}} - 'USD' for BTCUSD pair
{{syminfo.basecurrency}} - 'BTC' for BTCUSD pair
✅ USAGE EXAMPLES
Now I’ll demonstrate several ways to apply this indicator across different trading strategies.
Primarily, it’s most effective within the Smart Money framework - where liquidity and manipulation are the core focus - so it integrates seamlessly into your SMC-based approach.
However, it can also be employed in other strategies, such as classic technical analysis or Elliott Wave, to capitalize on reversal points on the chart.
Example 1
The first example illustrates forming a downtrend using a Smart Money strategy. After the market structure shifts and the first BOS is broken, we begin looking for a short entry.
Once Entry Model 1 is established, a Fair Value Gap appears, which we use as our position-entry zone. The nearest target becomes the newly formed BOS level.
In this trade, it was crucial to wait for a strong downtrend to develop before hunting for entries. Therefore, we waited for the first BOS to break and entered the trade to ride the continuation of the downtrend down to the next BOS level.
Example 2
The next example illustrates a downtrend developing with a Fair Value Gap on the 1-hour timeframe. The FVG is also displayed directly on the HTF candles in the chart.
The pattern forms within the HTF Fair Value Gap, indicating that we can balance this inefficiency and ride the continuation of the downtrend.
The target can simply be a 1:2 or 1:3 risk–reward ratio, as in our case.
📌 CONCLUSION
These two examples illustrate how this indicator can be used to identify reversals or trend continuations. In truth, there are countless ways to incorporate this tool, and each trader can adapt the model to fit their own strategy.
Always remember to rely on your own analysis and only enter trades when you feel confident in them.

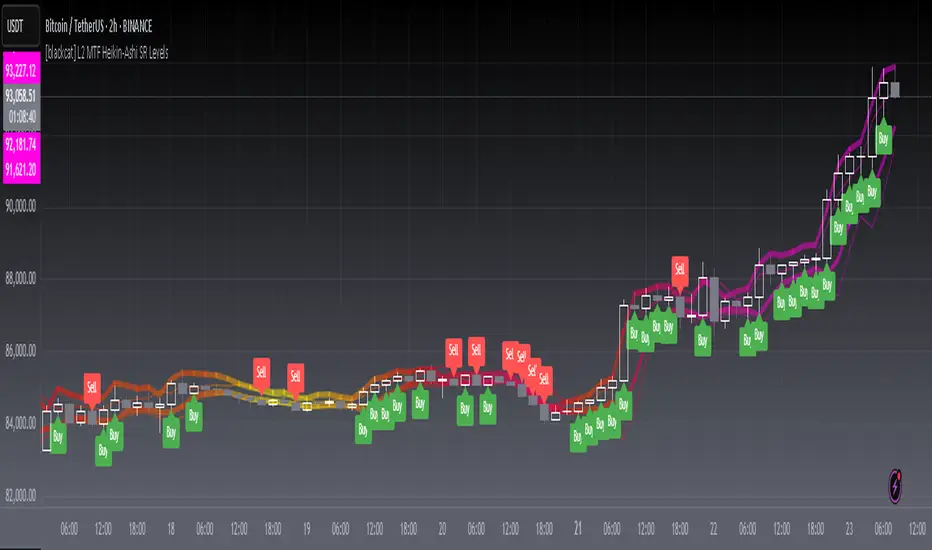
[blackcat] L2 MTF Heikin-Ashi SR LevelsOVERVIEW
The L2 MTF Heikin-Ashi SR Levels indicator is a sophisticated tool designed to help traders identify critical support and resistance levels across multiple timeframes. This script employs Heikin-Ashi candles, which provide a smoothed representation of price action, making it easier to spot trends and reversals. By integrating multi-timeframe analysis, this indicator offers a comprehensive view of market dynamics, enabling traders to make more informed decisions 📊✅.
This indicator not only calculates essential support and resistance levels but also visually represents them on the chart with gradient colors based on Relative Strength Index (RSI) values. Additionally, it features customizable alerts and labels to enhance user experience and ensure timely execution of trades.
FEATURES
Advanced Trend Identification:
Uses Heikin-Ashi candles for smoother price action analysis.
Helps filter out noise and focus on significant trends.
Ideal for both short-term and long-term trading strategies.
Multi-Timeframe Analysis:
Allows users to select different resolutions for deeper insights.
Ensures compatibility with various trading styles and preferences.
Comprehensive Support and Resistance Calculation:
Computes four distinct levels: Support Level 1, Support Level 2, Resistance Level 1, and Resistance Level 2.
Each level serves as a reference point for potential price reversals or continuations.
Gradient Color Visualization:
Employs a spectrum of colors derived from RSI values to represent support and resistance lines.
Enhances readability and helps traders quickly assess market sentiment 🎨.
Dynamic Labels and Alerts:
Automatically generates buy ('Buy') and sell ('Sell') labels when price crosses key levels.
Provides real-time alerts for crossing events, ensuring traders never miss important signals 🔔.
Customizable Parameters:
Offers adjustable Length and Resolution inputs for tailored performance.
Allows traders to fine-tune the indicator according to their unique needs and strategies.
HOW TO USE
Adding the Indicator:
Open your TradingView chart and navigate to the indicators list.
Search for ' L2 MTF Heikin-Ashi SR Levels' and add it to your chart.
Configuring Settings:
Adjust the Length parameter to determine the period over which calculations are made.
A shorter length increases sensitivity, while a longer length smoothens the output.
Choose a specific Resolution to analyze different timeframes simultaneously.
For example, set it to 'D' for daily charts or 'W' for weekly charts.
Interpreting the Chart:
Observe the plotted support and resistance lines on the chart.
Look for price interactions with these levels to identify potential entry and exit points.
Pay attention to the gradient colors, which reflect underlying market momentum.
Setting Up Alerts:
Configure alerts based on the generated signals to receive instant notifications.
Customize alert messages and conditions to suit your trading plan.
Utilizing Labels:
Use the automatically placed buy and sell labels as quick references for decision-making.
Combine these labels with other technical analyses for confirmation.
Backtesting and Optimization:
Thoroughly test the indicator on historical data to evaluate its performance.
Optimize settings and refine your strategy based on backtest results.
Live Trading:
Apply the indicator to live charts and monitor real-time price movements.
Execute trades based on the generated signals and adjust positions accordingly.
Combining with Other Tools:
Integrate this indicator with other technical tools and fundamental analyses for a holistic approach.
Consider using moving averages, oscillators, or volume indicators alongside L2 MTF Heikin-Ashi SR Levels.
LIMITATIONS
Market Volatility:
In highly volatile or ranging markets, the indicator might produce false signals due to erratic price movements 🌪️.
Traders should exercise caution during such periods and consider additional confirmations.
Timeframe Dependency:
The effectiveness of the indicator can vary significantly depending on the chosen timeframe and asset.
Always validate the indicator's performance across different contexts before relying solely on it.
Over-reliance Risk:
While powerful, no single indicator guarantees success in all market conditions.
Combining this tool with other analytical methods enhances reliability and reduces risk.
NOTES
Data Requirements:
Ensure your chart has enough historical data to perform accurate calculations.
Insufficient data may lead to inaccurate or incomplete results.
Demo Testing:
Before deploying the indicator in live trading, conduct extensive testing on demo accounts.
Familiarize yourself with how the indicator behaves under various market scenarios.
Parameter Tuning:
Experiment with different Length and Resolution settings to find what works best for your trading style.
Regularly review and update parameters as market conditions evolve.
Continuous Learning:
Stay updated with the latest developments in technical analysis and trading strategies.
Adapt your use of the indicator based on new insights and experiences.
THANKS
Additionally, gratitude goes to the broader TradingView community for fostering collaboration and knowledge-sharing among traders worldwide. Together, we strive to elevate our understanding and application of financial markets 🌍💡.
[blackcat] L3 Magic-9 MACD SetupOVERVIEW
The L3 Magic-9 MACD Setup indicator is meticulously crafted to assist traders in identifying precise buy and sell signals through an enhanced Moving Average Convergence Divergence (MACD) methodology. This advanced tool integrates the Magic-9 Sequential technique to refine signal accuracy by filtering out market noise. By providing clear visual cues via labeled charts and real-time alerts, it empowers users to make informed trading decisions swiftly and confidently 📈✅.
FEATURES
Customizable MACD Parameters:
Fast Length: Adjustable parameter to control the sensitivity of the fast moving average.
Slow Length: Configurable setting for the slow moving average to balance responsiveness and stability.
Signal Length: Modifiable value to determine the smoothing factor applied to the MACD line.
Dynamic Plot Visuals:
MACD Line: Representing the difference between short-term and long-term EMAs.
Signal Line: A smoothed version of the MACD line used to generate crossover signals.
Histogram: Illustrating the distance between the MACD and Signal lines, highlighting momentum changes.
All elements feature adjustable colors and styles for personalized visualization preferences 🎨.
Advanced Filtering Mechanism:
Utilizes the Magic-9 Sequential method to analyze consecutive price movements, enhancing signal reliability.
Counts sequential occurrences above or below initial values to detect trends more accurately 🔍.
Sequential Labels:
Displays numerical labels (e.g., '5', '6', etc.) at key points where sequential conditions are met, offering insights into trend strength.
Highlights significant reversals with special labels like '9' and '13' for critical decision-making moments 🏷️.
Buy/Sell Signals:
Generates clear 'B' (buy) and 'S' (sell) labels based on predefined conditions derived from sequential analysis.
Provides actionable trade suggestions directly on the chart for easy interpretation.
Alert System:
Supports customizable alerts to notify users instantly when buy/sell conditions are triggered.
Ensures timely responses to market movements without constant monitoring 🔔.
HOW TO USE
Add Indicator to Chart:
Access the TradingView platform and navigate to the indicators section.
Select ' L3 Magic-9 MACD Setup' from the list and add it to your desired chart.
Configure Settings:
Open the settings panel to adjust MACD parameters such as Fast Length, Slow Length, and Signal Length according to your trading strategy.
Modify plot colors and styles to suit your visual preferences for better readability.
Analyze Chart Labels:
Monitor the chart for sequentially numbered labels indicating trend strength and potential reversal points.
Pay close attention to special labels like '9' and '13' for crucial trading signals.
Combine with Other Tools:
Use additional technical indicators or fundamental analysis to confirm signals generated by the L3 Magic-9 MACD Setup.
Enhance decision-making accuracy by cross-verifying multiple data sources.
LIMITATIONS
Market Conditions Sensitivity:
The indicator may produce fewer reliable signals during periods of low volatility or range-bound markets.
Traders should be cautious of false positives in highly choppy environments 🌪️.
Dependency on Historical Data:
Accurate performance requires sufficient historical price data; insufficient data may lead to inaccurate calculations.
Regular updates and backtesting are essential to maintain effectiveness over time.
Single Indicator Risk:
Relying solely on MACD-based signals can miss broader market context; combining with other analytical tools is recommended.
Always validate signals through multiple lenses to mitigate risks associated with single-indicator strategies.
NOTES
Data Sufficiency:
Ensure your chart has enough historical data loaded to support robust MACD computations.
Periodically review and update data inputs to reflect current market dynamics.
Testing and Validation:
Conduct thorough testing on demo accounts before deploying the indicator in live trading scenarios.
Backtest across various market cycles to assess its resilience under different conditions.
Parameter Optimization:
Experiment with different parameter settings tailored to specific asset classes or trading styles.
Fine-tune the lookback period and other configurable options to align with personal trading objectives.
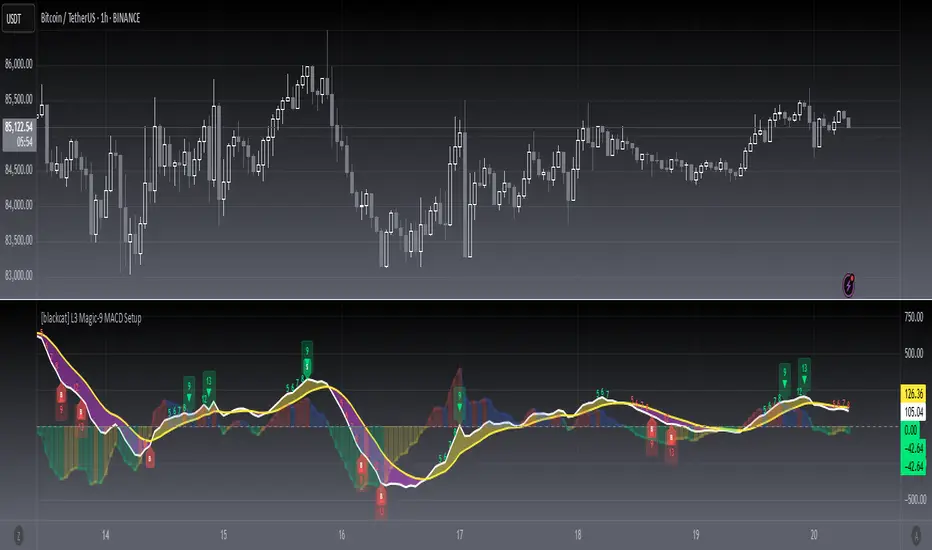
DTT Yearly Volatility Grid [Pro+] (NINE/ANARR)Introduction :
This tool is designed to automate the Digital Time Theory (DTT) framework created by Ivan and Anarr and applies the DTT Yearly Volatility Grid to uncover swing trading opportunities by analyzing Time-based statistical market behavior across the 4H to Daily chart.
Description:
Built upon the proprietary Digital Time Theory (DTT) , this advanced version is tailored for traders seeking multi-day to multi-week moves . It equips swing traders with an edge by analyzing macro Time intervals and volatility behavior across higher Timeframes. Applicable to all major asset classes, including stocks, crypto, forex, and futures , this script breaks down the entire yearly range into Higher-Time Frame Time Models and statistical zones .
This version uses daily intervals to track broader volatility waves, highlight the DTT framework, and pinpoint premium/discount areas across swing cycles. Powered by Time-driven data insights, this tool assists traders in anticipating expansions, understanding long-range Time distortions, and positioning around statistically significant zones in the higher-Time frame narrative.
Key Features:
Time-Based Models and Macro Volatility Awareness:
Automatically populates the chart with DTT Yearly Time Models (4H, Daily), engineered to spotlight macro volatility events across broader market sessions. Helps swing traders identify potential inflection points, reversals, or trend continuation zones.
Average Model Range Probability (AMRP):
Measure the average volatility expected over higher Time-based models. Use AMRP Levels and Projections to assess the range potential of each Yearly Model Time window—vital for monitoring reversals, breakouts, or continuation plays across several sessions or weeks.
Digital Root Candles and HTF Liquidity Draws:
For DTT Yearly Models, the Digital Root Candles are calculated as a specific Daily candle, and can be viewed on the Daily or 4H Timeframe. Analysts can frame premium and discount zones, based on where price is trading in relation to the current or previous model's Digital Roots. These areas also act as anchors for institutional price movement, often serving as bases for accumulation/distribution periods or large impulse moves.
Extended Visualization:
Track and project prior model ranges (high, low, equilibrium) into the current swing window. This helps visualize macro support/resistance , range expansion, failure zones, and price gravitation levels for longer-term trade planning.
Lookback Periods and Model Count
Utilize adjustable lookback periods to control the number of past DTT Yearly Models displayed—ideal for swing traders and quarterly outlooks. Whether you’re reviewing one yearly model to focus on the present range or several months’ worth of data for backtesting and confluence, this feature keeps charts clean, structured, and aligned with your preferred historical perspective.
By tailoring how many previous Time-based models appear on the chart, traders can better visualize and backtest repeated behaviors, major volatility clusters, and how key levels evolve over Time.
Detailed Data Table:
View statistical AMRP data for multiple DTT Yearly Models in real-Time. The data table helps confirm whether current price movement exceeds, respects, or fails to reach historical volatility ranges—key for analyzing market compression or expansion phases.
Customization Options:
Toggle inner Time interval, calculate AMRP utilizing a custom model lookback, and display styles (solid/dotted lines), including color coordination per drawing. Easily customize your charts and settings to fit your swing trading system or macro analysis.
How Swing Traders Can Use DTT Yearly Volatility Grid Effectively
Identify Swing Premium and Discount Zones:
Use Root Candles and Yearly Time Model AMRP Zones to evaluate where price is positioned in the current Time Model. Using this tool, traders can plan trades with a longer term horizon for a minimum of 1 to 2-weeks or manage entries/exits around market structure shifts and liquidity pools
Expect Macro Volatility Shifts:
Use the HTF models to forecast when and which volatility models are historically known to create larger market impulses . These tools help spot periods of potential exhaustion or breakout, especially near key economic releases, quarterly closes , or macro liquidity zones .
Avoid Low Volatility Consolidations:
AMRP helps you detect when the market is compressing or coiling within a DTT Yearly Model. If price is trading between Digital Root Candles or the AMRP zones, analysts are likely to notice periods of consolidation, and the inability to reach their historical volatility averages.
Usage Guidance:
Add DTT Yearly Volatility Grid (NINE/ANARR) to your TradingView chart.
Make sure to be on the 4H, or Daily Timeframes depending on your asset class and analysis.
Use the DTT Model elements and the Data Table to track expansion zones, premium/discount extremes, and model range behavior.
Terms and Conditions
Our charting tools are products provided for informational and educational purposes only and do not constitute financial, investment, or trading advice. Our charting tools are not designed to predict market movements or provide specific recommendations. Users should be aware that past performance is not indicative of future results and should not be relied upon for making financial decisions. By using our charting tools, the purchaser agrees that the seller and the creator are not responsible for any decisions made based on the information provided by these charting tools. The purchaser assumes full responsibility and liability for any actions taken and the consequences thereof, including any loss of money or investments that may occur as a result of using these products. Hence, by purchasing these charting tools, the customer accepts and acknowledges that the seller and the creator are not liable nor responsible for any unwanted outcome that arises from the development, the sale, or the use of these products. Finally, the purchaser indemnifies the seller from any and all liability. If the purchaser was invited through the Friends and Family Program, they acknowledge that the provided discount code only applies to the first initial purchase of the Toodegrees Premium Suite subscription. The purchaser is therefore responsible for cancelling – or requesting to cancel – their subscription in the event that they do not wish to continue using the product at full retail price. If the purchaser no longer wishes to use the products, they must unsubscribe from the membership service, if applicable. We hold no reimbursement, refund, or chargeback policy. Once these Terms and Conditions are accepted by the Customer, before purchase, no reimbursements, refunds or chargebacks will be provided under any circumstances.
By continuing to use these charting tools, the user acknowledges and agrees to the Terms and Conditions outlined in this legal disclaimer.
Skrip berbayar

Open Range Candle [TradeWithRon]This Open Range Break indicator is a tool designed to help traders identify and visualize key price levels using the Opening Range Breakout (ORB) strategy. This indicator dynamically plots critical levels such as the high, low, and middle of a predefined range, along with Fibonacci retracement levels for further analysis. It also features several customization options to fit various trading styles.
Key Features:
Session Setup: Allows the user to set the time offset in GMT - or + to adjust the ORB session to their local time zone.
The default ORB session is set at 9:45 AM but can be adjusted based on user preferences.
Warning: Only supports 5-minute and 15-minute timeframes.
Visual Customization:
Line Styles: Users can choose from Solid, Dotted, or Dashed lines to represent key price levels.
Color Adjustments: Customizable colors for the high, middle, and low levels of the range, as well as Fibonacci levels and vertical lines.
Labeling Options: The labels can be customized in terms of size and color, helping to keep the chart clean and clear.
Fibonacci Retracement Levels: Fibonacci retracement levels are automatically drawn between the high and low of the range. Users can toggle these on or off and customize the offset to suit different trading instruments.
Time-Based Visuals: A vertical line is drawn at the start of the ORB session, providing a clear visual marker of where the breakout starts. This is useful for pinpointing key trade setups.
The indicator supports both 5-minute and 15-minute timeframes.
EMA Integration: The user can enable an Exponential Moving Average (EMA) on any chosen timeframe with adjustable parameters such as the length and color, providing additional trend context.
Dynamic Labeling: The indicator labels the high, middle, and low points of the ORB with custom text. These labels are updated in real-time as new data becomes available.
Limit on Lines and Labels: The indicator allows for a limit on the number of lines and labels drawn to maintain a clean chart, preventing unnecessary clutter as more ORB levels are plotted.
Daily Bias Information: The indicator assesses the daily trend bias (bullish or bearish) based on the relationship between the open and close prices for the last three daily candles, providing context for the current trading session.
Countdown Timer: The remaining time until the end of the current session is displayed in a countdown format, which helps traders to time their entries and exits more precisely.
How To Use:,
- Set the Timeframe to 15 minutes.
- Adjust the Time Zone Offset if needed, based on your local time zone.
- Enable the Show ORB feature for the first 15-minute candle to be drawn as the opening range. - The indicator will automatically mark the high, middle, and low points of the range.
Identify Breakout Points:
Bullish Breakout: If the price breaks above the high of the 15-minute opening range, this indicates a potential bullish breakout. The indicator will plot a vertical line marking the breakout point for further confirmation.
Bearish Breakout: If the price breaks below the low of the 15-minute opening range, this signals a potential bearish breakout. Again, the indicator will plot the breakout point with a vertical line for easy identification.
🔶 Disclaimer
Use with Caution: This indicator is provided for educational and informational purposes only and should not be considered as financial advice. Users should exercise caution and perform their own analysis before making trading decisions based on the indicator's signals.
Not Financial Advice: The information provided by this indicator does not constitute financial advice, and the creator (Tradewithron) shall not be held responsible for any trading losses incurred as a result of using this indicator.
Backtesting Recommended: Traders are encouraged to backtest the indicator thoroughly on historical data before using it in live trading to assess its performance and suitability for their trading strategies.
Risk Management: Trading involves inherent risks, and users should implement proper risk management strategies, including but not limited to stop-loss orders and position sizing, to mitigate potential losses.
No Guarantees: The accuracy and reliability of the indicator's signals cannot be guaranteed, as they are based on historical price data and past performance may not be indicative of future

CISD [TradeWithRon]The CISD (Change in State of Delivery) indicator helps traders identify significant price action events by tracking liquidity sweeps and CISD events. It highlights key market structure shifts by marking liquidity levels and failed breakouts, offering insights into potential reversals and breakout confirmations.
Features:
CISD Detection: Identifies high and low CISD events with customizable display settings.
Customizable Display: Users can control how many CISD lines and liquidity lines are shown.
Customization:
- Adjust the number of CISD and liquidity lines displayed.
- Modify the swing length and back-checking period for greater flexibility.
- Choose different colors and line styles to match your charting preferences.
Use Cases:
- Spot traps and reversals.
- Identify breakout confirmations.
- Enhance market structure analysis.
- Combine with other technical indicators for improved decision-making.
🔶 Disclaimer
Use with Caution: This indicator is provided for educational and informational purposes only and should not be considered as financial advice. Users should exercise caution and perform their own analysis before making trading decisions based on the indicator's signals.
Not Financial Advice: The information provided by this indicator does not constitute financial advice, and the creator (Tradewithron) shall not be held responsible for any trading losses incurred as a result of using this indicator.
Backtesting Recommended: Traders are encouraged to backtest the indicator thoroughly on historical data before using it in live trading to assess its performance and suitability for their trading strategies.
Risk Management: Trading involves inherent risks, and users should implement proper risk management strategies, including but not limited to stop-loss orders and position sizing, to mitigate potential losses.
No Guarantees: The accuracy and reliability of the indicator's signals cannot be guaranteed, as they are based on historical price data and past performance may not be indicative of future
Order Block Candle [TradeWithRon]Order Block Candle
This indicator is designed to help traders identify and visualize key movements within the market. These order blocks are areas where significant buying or selling has occurred, often leading to a strong price reaction. This script detects both bullish and bearish order blocks (with volume spike), marking them directly on your chart, and offers a variety of customization options to enhance your trading experience.
Features:
Bullish and Bearish Candles: Bullish Order Block: Identified when the current price creates a higher high and closes above the previous price, indicating a zone of potential buying activity by institutional traders.
Bearish Order Block: Identified when the current price creates a lower low and closes below the previous price, suggesting strong institutional selling.
Volume-Weighted Analysis: The indicator allows traders to incorporate volume into the order block detection. When a volume pivot (a significant change in volume) is detected, it strengthens the validity of the identified order block.
Customizable Visuals:
- Users can adjust the color and style of order block lines, including solid, dashed, or dotted styles, to suit personal preferences.
- Bullish Order Block Color: Choose from a range of colors to highlight bullish order blocks (default is green).
- Bearish Order Block Color: Choose a color for bearish order blocks (default is red).
- Users can also customize the color and style of the lines representing order blocks, helping traders visually track key levels.
Candle Body or. Wick: The indicator provides flexibility in defining the price range of the order block. Traders can choose whether to calculate the order block using the candle body (open and close) or the full wick (high and low) to suit their trading strategy.
Dynamic Line Extensions: Order block lines are dynamically extended to provide ongoing support and resistance levels. When a price breaks an order block line, the line changes to a dotted style, marking it as "broken." This allows traders to easily spot when the market invalidates an order block.
Alerts:
- Alert for Bullish Order Block: Get notified when a new bullish order block is detected.
- Alert for Bearish Order Block: Receive alerts when a bearish order block is identified.
- Alert for Broken Lines: Set up alerts to be notified when a bullish or bearish order block line is broken, giving traders a signal for potential market shifts.
Zone Management:
- The indicator tracks upper and lower zone information, marking significant price levels where institutional buying or selling might occur. Traders can adjust settings to define how many previous lines should be displayed on the chart for reference.
Optional Mitigated Order Blocks:
- A feature that highlights mitigated (neutralized) order blocks with a specific color and line style, offering additional insight into market behavior.
Input Settings:
- Length: The number of bars to the left and right of a pivot point for it to be considered a high or low.
- Candle Body: Option to use the candle body for calculations (as opposed to the wick).
- Bullish and Bearish Candle Color: Customizable colors for bullish and bearish order blocks.
- Open Line Style: Choose between solid, dashed, or dotted line styles for order block visualization.
- Removed Old Lines: Control the number of broken lines shown on the chart.
- Mitigated Line Style: Select line style for mitigated order blocks.
- Volume Use: Enable volume-based detection for stronger order block validation.
How to Use:
This indicator is ideal for traders looking to trade around institutional support and resistance levels. The bullish and bearish order blocks can serve as key entry or exit points, while broken lines offer dynamic support/resistance that adapt to market changes. Use the alerts to stay informed of critical market developments and adjust your trading strategy accordingly.
🔶 Disclaimer
Use with Caution: This indicator is provided for educational and informational purposes only and should not be considered as financial advice. Users should exercise caution and perform their own analysis before making trading decisions based on the indicator's signals.
Not Financial Advice: The information provided by this indicator does not constitute financial advice, and the creator (Tradewithron) shall not be held responsible for any trading losses incurred as a result of using this indicator.
Backtesting Recommended: Traders are encouraged to backtest the indicator thoroughly on historical data before using it in live trading to assess its performance and suitability for their trading strategies.
Risk Management: Trading involves inherent risks, and users should implement proper risk management strategies, including but not limited to stop-loss orders and position sizing, to mitigate potential losses.
No Guarantees: The accuracy and reliability of the indicator's signals cannot be guaranteed, as they are based on historical price data and past performance may not be indicative of future