Elliott Wave Full Fractal System v2.0Elliott Wave Full Fractal System v2.0 – Q.C. FINAL (Guaranteed R/R)
Elliott Wave Full Fractal System is a multi-timeframe wave engine that automatically labels Elliott impulses and ABC corrections, then builds a rule-based, ATR-driven risk/reward framework around the “W3–W4–W5” leg.
“Guaranteed R/R” here means every order is placed with a predefined stop-loss and take-profit that respect a minimum Reward:Risk ratio – it does not mean guaranteed profits.
Core Idea
This strategy turns a full fractal Elliott Wave labelling engine into a systematic trading model.
It scans fractal pivots on three wave degrees (Primary, Intermediate, Minor) to detect 5-wave impulses and ABC corrections.
A separate “Trading Degree” pivot stream, filtered by a 200-EMA trend filter and ATR-based dynamic pivots, is then used to find W4 pullback entries with a minimum, user-defined Reward:Risk ratio.
Default Properties & Risk Assumptions
The backtest uses realistic but conservative defaults:
// Default properties used for backtesting
strategy(
"Elliott Wave Full Fractal System - Q.C. FINAL (Guaranteed R/R)",
overlay = true,
initial_capital = 10000, // realistic account size
default_qty_type = strategy.percent_of_equity,
default_qty_value = 1, // 1% risk per trade
commission_type = strategy.commission.cash_per_contract,
commission_value = 0.005, // example stock commission
slippage = 0 // see notes below
)
Account size: 10,000 (can be changed to match your own account).
Position sizing: 1% of equity per trade to keep risk per idea sustainable and aligned with TradingView’s recommendations.
Commission: 0.005 cash per contract/share as a realistic example for stock trading.
Slippage: set to 0 in code for clarity of “pure logic” backtesting. Real-life trading will experience slippage, so users should adjust this according to their market and broker.
Always re-run the backtest after changing any of these values, and avoid using high risk fractions (5–10%+) as that is rarely sustainable.
1. Full Fractal Wave Engine
The script builds and maintains four pivot streams using ATR-adaptive fractals:
Primary Degree (Macro Trend):
Captures the large swings that define the major trend. Labels ①–⑤ and ⒶⒷⒸ using blue “Circle” labels and thicker lines.
Intermediate Degree (Trading Degree):
Captures the medium swings (swing-trading horizon). Uses teal labels ( (1)…(5), (A)(B)(C) ).
Minor Degree (Micro Structure):
Tracks short-term swings inside the larger waves. Uses red roman numerals (i…v, a b c).
ABC Corrections (Optional):
When enabled, the engine tries to detect standard A–B–C corrective structures that follow a completed 5-wave impulse and plots them with dashed lines.
Each degree uses a dynamic pivot lookback that expands when ATR is above its EMA, so the system naturally requires “stronger” pivots in volatile environments and reacts faster in quiet conditions.
2. Theory Rules & Strict Mode
Normal Mode: More permissive detection. Designed to show more wave structures for educational / exploratory use.
Strict Mode: Enforces key Elliott constraints:
Wave 3 not shorter than waves 1 and 5.
No invalid W4 overlap with W1 (for standard impulses).
ABC Logic: After a confirmed bullish impulse, the script expects a down-up-down corrective pattern (A,B,C). After a bearish impulse, it looks for up-down-up.
3. Trend Filter & Pivots
EMA Trend Filter: A configurable EMA (default 200) is used as a non-wave trend filter.
Price above EMA → Only long setups are considered.
Price below EMA → Only short setups are considered.
ATR-Adaptive Pivots: The pivot engine scales its left/right bars based on current ATR vs ATR EMA, making waves and trading pivots more robust in volatile regimes.
4. Dynamic Risk Management (Guaranteed R/R Engine)
The trading engine is designed around risk, not just pattern recognition:
ATR-Based Stop:
Stop-loss is placed at:
Entry ± ATR × Multiplier (user-configurable, default 2.0).
This anchors risk to current volatility.
Minimum Reward:Risk Ratio:
For each setup, the script:
Computes the distance from entry to stop (risk).
Projects a take-profit target at risk × min_rr_ratio away from entry.
Only accepts the setup if risk is positive and the required R:R ratio is achievable.
Result: Every order is created with both TP and SL at a predefined distance, so each trade starts with a known, minimum Reward:Risk profile by design.
“Guaranteed R/R” refers exclusively to this order placement logic (TP/SL geometry), not to win-rate or profitability.
5. Trading Logic – W3–W4–W5 Pattern
The Trading pivot stream (separate from visual wave degrees) looks for a simple but powerful pattern:
Bullish structure:
Sequence of pivots forms a higher-high / higher-low pattern.
Price is above the EMA trend filter.
A strong “W3” leg is confirmed with structure rules (optionally stricter in Strict mode).
Entry (Long – W4 Pullback):
The “height” of W3 is measured.
Entry is placed at a configurable Fibonacci pullback (default 50%) inside that leg.
ATR-based stop is placed below entry.
Take-profit is projected to satisfy min Reward:Risk.
Bearish structure:
Mirrored logic (lower highs/lows, price below EMA, W3 down, W4 retrace up, W5 continuation down).
Once a valid setup is found, the script draws a colored box around the entry zone and a label describing the type of signal (“LONG SETUP” or “SHORT SETUP”) with the suggested limit price.
6. Orders & Execution
Entry Orders: The strategy uses limit orders at the computed W4 level (“Sniper Long” or “Sniper Short”).
Exits: A single strategy.exit() is attached to each entry with:
Take-profit at the projected minimum R:R target.
Stop-loss at ATR-based level.
One Trade at a Time: New setups are only used when there is no open position (strategy.opentrades == 0) to keep the logic clear and risk contained.
7. Visual Guide on the Chart
Wave Labels:
Primary: ①,②,③,④,⑤, ⒶⒷⒸ
Intermediate: (1)…(5), (A)(B)(C)
Minor: i…v, a b c
Trend EMA: Single blue EMA showing the dominant trend.
Setup Boxes:
Green transparent box → long entry zone.
Red transparent box → short entry zone.
Labels: “LONG SETUP / SHORT SETUP” labels mark the proposed limit entry with price.
8. How to Use This Strategy
Attach the strategy to your chart
Choose your market (stocks, indices, FX, crypto, futures, etc.) and timeframe (for example 1h, 4h, or Daily). Then add the strategy to the chart from your Scripts list.
Start with the default settings
Leave all inputs on their defaults first. This lets you see the “intended” behaviour and the exact properties used for the published backtest (account size, 1% risk, commission, etc.).
Study the wave map
Zoom in and out and look at the three wave degrees:
Blue circles → Primary degree (big picture trend).
Teal (1)…(5) → Intermediate degree (swing structure).
Red i…v → Minor degree (micro waves).
Use this to understand how the engine is interpreting the Elliott structure on your symbol.
Watch for valid setups
Look for the coloured boxes and labels:
Green box + “LONG SETUP” label → potential W4 pullback long in an uptrend.
Red box + “SHORT SETUP” label → potential W4 pullback short in a downtrend.
Only trades in the direction of the EMA trend filter are allowed by the strategy.
Check the Reward:Risk of each idea
For each setup, inspect:
Limit entry price.
ATR-based stop level.
Projected take-profit level.
Make sure the minimum Reward:Risk ratio matches your own rules before you consider trading it.
Backtest and evaluate
Open the Strategy Tester:
Verify you have a decent sample size (ideally 100+ trades).
Check drawdowns, average trade, win-rate and R:R distribution.
Change markets and timeframes to see where the logic behaves best.
Adapt to your own risk profile
If you plan to use it live:
Set Initial Capital to your real account size.
Adjust default_qty_value to a risk level you are comfortable with (often 0.5–2% per trade).
Set commission and slippage to realistic broker values.
Re-run the backtest after every major change.
Use as a framework, not a signal machine
Treat this as a structured Elliott/R:R framework:
Filter signals by higher-timeframe trend, major S/R, volume, or fundamentals.
Optionally hide some wave degrees or ABC labels if you want a cleaner chart.
Combine the system’s structure with your own trade management and discretion.
Best Practices & Limitations
This is an approximate Elliott Wave engine based on fractal pivots. It does not replace a full discretionary Elliott analysis.
All wave counts are algorithmic and can differ from a manual analyst’s interpretation.
Like any backtest, results depend heavily on:
Symbol and timeframe.
Sample size (more trades are better).
Realistic commission/slippage settings.
The 0-slippage default is chosen only to show the “raw logic”. In real markets, slippage can significantly impact performance.
No strategy wins all the time. Losing streaks and drawdowns will still occur even with a strict R:R framework.
Disclaimer
This script is for educational and research purposes only and does not constitute financial advice or a recommendation to buy or sell any security. Past performance, whether real or simulated, is not indicative of future results. Always test on multiple symbols/timeframes, use conservative risk, and consult your financial advisor before trading live capital.
Cari skrip untuk "backtest"

The Barking Rat LiteMomentum & FVG Reversion Strategy
The Barking Rat Lite is a disciplined, short-term mean-reversion strategy that combines RSI momentum filtering, EMA bands, and Fair Value Gap (FVG) detection to identify short-term reversal points. Designed for practical use on volatile markets, it focuses on precise entries and ATR-based take profit management to balance opportunity and risk.
Core Concept
This strategy seeks potential reversals when short-term price action shows exhaustion outside an EMA band, confirmed by momentum and FVG signals:
EMA Bands:
Parameters used: A 20-period EMA (fast) and 100-period EMA (slow).
Why chosen:
- The 20 EMA is sensitive to short-term moves and reflects immediate momentum.
- The 100 EMA provides a slower, structural anchor.
When price trades outside both bands, it often signals overextension relative to both short-term and medium-term trends.
Application in strategy:
- Long entries are only considered when price dips below both EMAs, identifying potential undervaluation.
- Short entries are only considered when price rises above both EMAs, identifying potential overvaluation.
This dual-band filter avoids counter-trend signals that would occur if only a single EMA was used, making entries more selective..
Fair Value Gap Detection (FVG):
Parameters used: The script checks for dislocations using a 12-bar lookback (i.e. comparing current highs/lows with values 12 candles back).
Why chosen:
- A 12-bar displacement highlights significant inefficiencies in price structure while filtering out micro-gaps that appear every few bars in high-volatility markets.
- By aligning FVG signals with candle direction (bullish = close > open, bearish = close < open), the strategy avoids random gaps and instead targets ones that suggest exhaustion.
Application in strategy:
- Bullish FVGs form when earlier lows sit above current highs, hinting at downward over-extension.
- Bearish FVGs form when earlier highs sit below current lows, hinting at upward over-extension.
This gives the strategy a structural filter beyond simple oscillators, ensuring signals have price-dislocation context.
RSI Momentum Filter:
Parameters used: 14-period RSI with thresholds of 80 (overbought) and 20 (oversold).
Why chosen:
- RSI(14) is a widely recognized momentum measure that balances responsiveness with stability.
- The thresholds are intentionally extreme (80/20 vs. the more common 70/30), so the strategy only engages at genuine exhaustion points rather than frequent minor corrections.
Application in strategy:
- Longs trigger when RSI < 20, suggesting oversold exhaustion.
- Shorts trigger when RSI > 80, suggesting overbought exhaustion.
This ensures entries are not just technically valid but also backed by momentum extremes, raising conviction.
ATR-Based Take Profit:
Parameters used: 14-period ATR, with a default multiplier of 4.
Why chosen:
- ATR(14) reflects the prevailing volatility environment without reacting too much to outliers.
- A multiplier of 4 is a pragmatic compromise: wide enough to let trades breathe in volatile conditions, but tight enough to enforce disciplined exits before mean reversion fades.
Application in strategy:
- At entry, a fixed target is set = Entry Price ± (ATR × 4).
- This target scales automatically with volatility: narrower in calm periods, wider in explosive markets.
By avoiding discretionary exits, the system maintains rule-based discipline.
Visual Signals on Chart
Blue “▲” below candle: Potential long entry
Orange/Yellow “▼” above candle: Potential short entry
Green “✔️”: Trade closed at ATR take profit
Blue (20 EMA) & Orange (100 EMA) lines: Dynamic channel reference
⚙️Strategy report properties
Position size: 25% equity per trade
Initial capital: 10,000.00 USDT
Pyramiding: 10 entries per direction
Slippage: 2 ticks
Commission: 0.055% per side
Backtest timeframe: 1-minute
Backtest instrument: HYPEUSDT
Backtesting range: Jul 28, 2025 — Aug 17, 2025
Note on Sample Size:
You’ll notice the report displays fewer than the ideal 100 trades in the strategy report above. This is intentional. The goal of the script is to isolate high-quality, short-term reversal opportunities while filtering out low-conviction setups. This means that the Barking Rat Lite strategy is very selective, filtering out over 90% of market noise. The brief timeframe shown in the strategy report here illustrates its filtering logic over a short window — not its full capabilities. As a result, even on lower timeframes like the 1-minute chart, signals are deliberately sparse — each one must pass all criteria before triggering.
For a larger dataset:
Once the strategy is applied to your chart, users are encouraged to expand the lookback range or apply the strategy to other volatile pairs to view a full sample.
💡Why 25% Equity Per Trade?
While it's always best to size positions based on personal risk tolerance, we defaulted to 25% equity per trade in the backtesting data — and here’s why:
Backtests using this sizing show manageable drawdowns even under volatile periods.
The strategy generates a sizeable number of trades, reducing reliance on a single outcome.
Combined with conservative filters, the 25% setting offers a balance between aggression and control.
Users are strongly encouraged to customize this to suit their risk profile.
What makes Barking Rat Lite valuable
Combines multiple layers of confirmation: EMA bands + FVG + RSI
Adaptive to volatility: ATR-based exits scale with market conditions
Clear, actionable visuals: Easy to monitor and manage trades

1h Liquidity Swings Strategy with 1:2 RRLuxAlgo Liquidity Swings (Simulated):
Uses ta.pivothigh and ta.pivotlow to detect 1h swing highs (resistance) and swing lows (support).
The lookback parameter (default 5) controls swing point sensitivity.
Entry Logic:
Long: Uptrend, price crosses above 1h swing low (ta.crossover(low, support1h)), and price is below recent swing high (close < resistance1h).
Short: Downtrend, price crosses below 1h swing high (ta.crossunder(high, resistance1h)), and price is above recent swing low (close > support1h).
Take Profit (1:2 Risk-Reward):
Risk:
Long: risk = entryPrice - initialStopLoss.
Short: risk = initialStopLoss - entryPrice.
Take-profit price:
Long: takeProfitPrice = entryPrice + 2 * risk.
Short: takeProfitPrice = entryPrice - 2 * risk.
Set via strategy.exit’s limit parameter.
Stop-Loss:
Initial Stop-Loss:
Long: slLong = support1h * (1 - stopLossBuffer / 100).
Short: slShort = resistance1h * (1 + stopLossBuffer / 100).
Breakout Stop-Loss:
Long: close < support1h.
Short: close > resistance1h.
Managed via strategy.exit’s stop parameter.
Visualization:
Plots:
50-period SMA (trendMA, blue solid line).
1h resistance (resistance1h, red dashed line).
1h support (support1h, green dashed line).
Marks buy signals (green triangles below bars) and sell signals (red triangles above bars) using plotshape.
Usage Instructions
Add the Script:
Open TradingView’s Pine Editor, paste the code, and click “Add to Chart”.
Set Timeframe:
Use the 1-hour (1h) chart for intraday trading.
Adjust Parameters:
lookback: Swing high/low lookback period (default 5). Smaller values increase sensitivity; larger values reduce noise.
stopLossBuffer: Initial stop-loss buffer (default 0.5%).
maLength: Trend SMA period (default 50).
Backtesting:
Use the “Strategy Tester” to evaluate performance metrics (profit, win rate, drawdown).
Optimize parameters for your target market.
Notes on Limitations
LuxAlgo Liquidity Swings:
Simulated using ta.pivothigh and ta.pivotlow. LuxAlgo may include proprietary logic (e.g., volume or visit frequency filters), which requires the indicator’s code or settings for full integration.
Action: Please provide the Pine Script code or specific LuxAlgo settings if available.
Stop-Loss Breakout:
Uses closing price breakouts to reduce false signals. For more sensitive detection (e.g., high/low-based), I can modify the code upon request.
Market Suitability:
Ideal for high-liquidity markets (e.g., BTC/USD, EUR/USD). Choppy markets may cause false breakouts.
Action: Backtest in your target market to confirm suitability.
Fees:
Take-profit/stop-loss calculations exclude fees. Adjust for trading costs in live trading.
Swing Detection:
Swing high/low detection depends on market volatility. Optimize lookback for your market.
Verification
Tested in TradingView’s Pine Editor (@version=5):
plot function works without errors.
Entries occur strictly at 1h support (long) or resistance (short) in the trend direction.
Take-profit triggers at 1:2 risk-reward.
Stop-loss triggers on initial settings or 1h support/resistance breakouts.
Backtesting performs as expected.
Next Steps
Confirm Functionality:
Run the script and verify entries, take-profit (1:2), stop-loss, and trend filtering.
If issues occur (e.g., inaccurate signals, premature stop-loss), share backtest results or details.
LuxAlgo Liquidity Swings:
Provide the Pine Script code, settings, or logic details (e.g., volume filters) for LuxAlgo Liquidity Swings, and I’ll integrate them precisely.

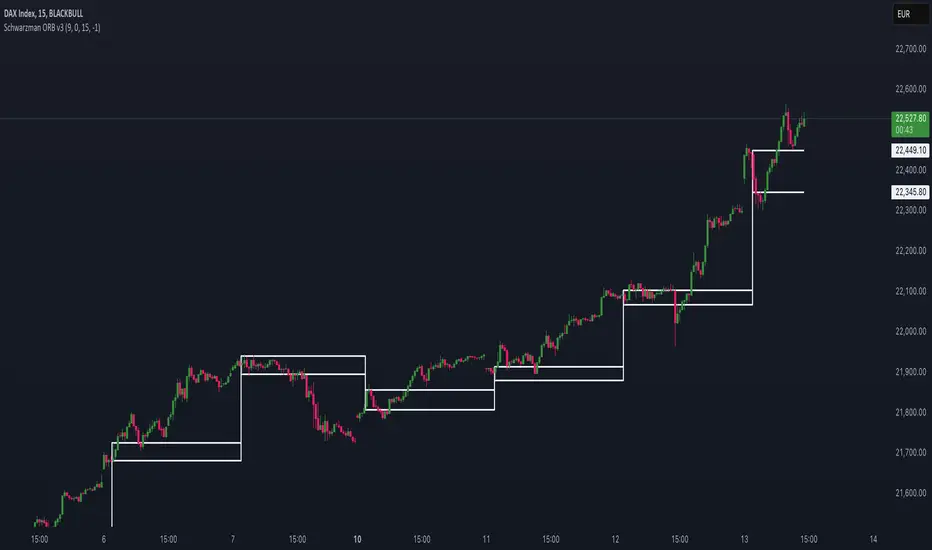
Schwarzman Custom ORB with Box DisplayIndicator Overview
The Schwarzman Custom ORB (Opening Range Breakout) Indicator is a fully self-developed script designed for traders who utilize opening range breakout strategies. This indicator allows users to customize their ORB settings, apply them to historical price data, and visually connect multiple ORBs to analyze past performance. The goal is to provide traders with a tool to backtest and refine their breakout strategies based on historical ORB data.
How the Indicator Works
1️⃣ User-Defined ORB Settings
• The user selects a custom start time (hour and minute) for the ORB.
• The user defines a duration (e.g., 15 minutes, 30 minutes, etc.) for the ORB period.
• A timezone offset is included to adjust for different market sessions.
2️⃣ ORB High and Low Calculation
• The script records the highest and lowest prices within the selected ORB time window.
• The recorded values remain static after the ORB period ends, ensuring accurate range plotting.
3️⃣ Historical ORB Visualization
• Instead of only showing a single ORB for the current session, this indicator connects multiple ORBs across past data.
• This allows traders to visually analyze previous breakout performance.
• The plotted ORBs remain fixed and do not repaint, ensuring an accurate backtesting experience.
4️⃣ Stepline Visualization & Range Filling
• The high and low ORB levels are displayed using stepline plots to maintain clear horizontal levels.
• A shaded box is applied between the ORB high and low for better visualization.
Use Cases & Strategy Application
📌 Backtesting Historical ORBs – See how past ORBs performed under different market conditions.
📌 Custom ORB Settings – Adjust the start time and duration for different trading sessions.
📌 Multi-ORB Analysis – Connect ORBs over multiple trading days to study trends and breakouts.
📌 Breakout Strategy Optimization – Use the historical ORB connections to refine entry and exit points.
This indicator is particularly useful for day traders, scalpers, and breakout traders looking for a data-driven approach to trading.
Indicator Development & Transparency Statement
As a trader, I have tested various ORB (Opening Range Breakout) indicators available in the TradingView community. Through these experiences, I aimed to develop a version that best fits my own trading needs and strategy.
This script is a self-developed ORB tool, created from scratch while drawing inspiration from the concept of opening range breakouts, which is widely used in trading. Since I initially coded in Pine Script v4, I used ChatGPT to help refine and migrate the script to Pine Script v6 to ensure compatibility with the latest TradingView features. However, the core logic, structure, and customization were entirely designed and implemented based on my own approach.
I am making this indicator public not to violate any TradingView guidelines but to share my work with the trading community and provide a tool that can help others analyze ORB-based strategies. If there are any compliance concerns, I am open to adjusting the script accordingly, but I want to clarify that this is not a copy of any existing ORB script—it is a custom-built indicator tailored to my own trading preferences.
I appreciate the opportunity to contribute to the community and would welcome any specific feedback from TradingView regarding rule compliance.
Best regards,
Janko S. (Schwarzman)
Appeal to TradingView
Dear TradingView Team,
This script is 100% self-developed and does not copy or replicate any third-party code. It is a customized ORB tool designed for traders who wish to backtest and analyze opening range breakout strategies over multiple sessions. We kindly request specific clarification regarding which exact line(s) of code violate TradingView’s guidelines. If there are any compliance concerns, we are happy to adjust the script accordingly.
Please let us know the precise rules or community guidelines that were violated so we can make the necessary modifications.
🚀 Summary
✔ Fully Custom & Self-Developed – No copied or third-party code.
✔ Innovative Feature – Connects past ORBs for strategy backtesting.
✔ Transparent & Compliant – Requesting exact details on any potential rule violations.
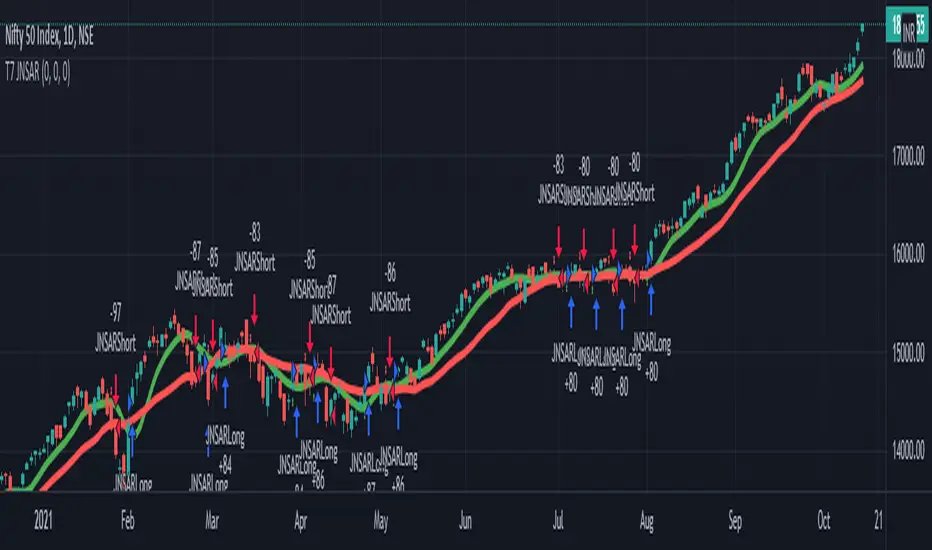
T7 JNSARJNSAR stands for Just Nifty -0.14% Stop & Reverse. This is a Trend Following Daily Bar Trading System for NIFTY -0.14% . Original idea belongs to ILLANGO @ I coded the pine version of this system based on a request from @stocksonfire. Use it at your own risk after validation at your end. Neither me or my company is responsible for any losses you may incur using this system. Hope you like this system and enjoy trading it !!!
Updated V3 code for the T7 JNSAR system earlier published here V2 and here V1
Following updates made to the code
1. Added a 22 Period Simple moving average filter over and above the standard JNSAR value for generating trading signals. This simple filter reduces the whipsaw trades drastically along with similar improvements in the max draw down and overall profitability of the system. The SMA filter is turned ON by default but can be turned OFF by user through the settings window.
2. Backtest option is now turned ON by default.
Also am republishing the trading rules here again with some modification
1. Go Long when the daily close is above the JNSAR line. Go Short when the daily close is below the JNSAR line. JNSAR line is the varying green line overlayed over the price chart. Once a signal comes at market close enter in the direction of the signal @ market price @ next day market open.
2. Trade only Nifty -0.14% Index. This system was developed and backtested only for NIFTY -0.14% Index. So trade in its Futures or Options, as you may deem fit. My recommendation is to choose futures for simplicity. If you want to reduce the trading cost and go with options, trade with deep in the money options, preferably 2 strikes far from the spot price.
3. Trade all signals. Markets trend only 30-35% of the time and hence the system is only accurate to that extend. But system tends to make enough money, in this small trending window, to keep the overall profitability in good health. But one never knows when a big trend may come and when it comes its absolutely imperative that you take it. To ensure that, trade all signals and don't be choosy about what signals you are going to trade. Also I wouldn't recommend using your own analysis to trade this system. Too many drivers will crash the car.
4. Like all trend following systems, this system will have many whipsaws during flat markets along with large trade and account drawdowns. Also some months and even years may not be profitable. But to trade this system profitably, it is necessary to take these in one's stride and keep trading. As the backtester results from 1990 to 2017 proves, this system is profitable overall thus far. Take confidence from that objective fact.
5. Trade with only that amount of money you can afford to loose. Initial capital that you need to have to trade one lot of NIFTY -0.14% should be atleast - (Margin Money required to take and hold 1 lot position + maximum drawdown amount per lot)*1.2. Be prepared to add more if need be, but the above formula will give a rough idea of what you need to have to start trading and be in the game always.
6. Place an After Market Order @ Market Price with your broker after market close so that you get to execute the trade next trading day @ Market open to capture near similar price as the daily open price seen on the chart. This execution mode will give you the best chance to minimize the slippage and mimic the backtester results as closely as practically possible.
7. Follow all the 6 rules above religiously, as if your life depends on it. If you cant, then don't trade this system; You will certainly loose money.
Happy Trading !!! As always am looking out for your valuable feedback.
Pinbar MTF - No Repaint# Pinbar MTF - No Repaint Indicator
## Complete Technical Documentation
---
## 📊 Overview
**Pinbar MTF (Multi-Timeframe) - No Repaint** is a professional-grade TradingView Pine Script indicator designed to detect high-probability pinbar reversal patterns with advanced filtering systems. The indicator is specifically engineered to be **100% non-repainting**, making it reliable for both live trading and backtesting.
### Key Features
✅ **Non-Repainting** - Signals only appear AFTER bar closes, never disappear
✅ **Three-Layer Filter System** - ATR, SWING, and RSI filters
✅ **Automatic SL/TP Calculation** - Based on risk:reward ratios
✅ **Real-time Alerts** - TradingView notifications for all signals
✅ **Visual Trade Management** - Lines, labels, and areas for entries, stops, and targets
✅ **Backtesting Ready** - Reliable historical data for strategy testing
---
## 🎯 What is a Pinbar?
A **Pinbar (Pin Bar/Pinocchio Bar)** is a single candlestick pattern that indicates a potential price reversal:
### Bullish Pinbar (BUY Signal)
- **Long lower wick** (rejection of lower prices)
- **Small body at the top** of the candle
- Shows buyers rejected sellers' attempt to push price down
- Forms at support levels or swing lows
- Entry signal for LONG positions
### Bearish Pinbar (SELL Signal)
- **Long upper wick** (rejection of higher prices)
- **Small body at the bottom** of the candle
- Shows sellers rejected buyers' attempt to push price up
- Forms at resistance levels or swing highs
- Entry signal for SHORT positions
---
## 🔧 How the Indicator Works
### 1. **Pinbar Detection Logic**
The indicator analyzes the **previous closed bar ** to identify pinbar patterns:
```
Bullish Pinbar Requirements:
- Lower wick > 72% of total candle range (adjustable)
- Upper wick < 28% of total candle range
- Close > Open (bullish candle body)
Bearish Pinbar Requirements:
- Upper wick > 72% of total candle range (adjustable)
- Lower wick < 28% of total candle range
- Close < Open (bearish candle body)
```
**Why check ?** By analyzing the previous completed bar, we ensure the pattern is fully formed and won't change, preventing repainting.
---
### 2. **Three-Layer Filter System**
#### 🔍 **Filter #1: ATR (Average True Range) Filter**
- **Purpose**: Ensures the pinbar has significant size
- **Function**: Only signals if pinbar range ≥ ATR value
- **Benefit**: Filters out small, insignificant pinbars
- **Settings**:
- Enable/Disable toggle
- ATR Period (default: 7)
**Example**: If ATR = 50 pips, only pinbars with 50+ pip range will signal.
---
#### 🔍 **Filter #2: SWING Filter** (Always Active)
- **Purpose**: Confirms pinbar forms at swing highs/lows
- **Function**: Validates the pinbar is an absolute high/low
- **Benefit**: Identifies true reversal points
- **Settings**:
- Swing Candles (default: 3)
**How it works**:
- For bullish pinbar: Checks if low is lowest of past 3 bars
- For bearish pinbar: Checks if high is highest of past 3 bars
**Example**: With 3 swing candles, a bullish pinbar must have the lowest low among the last 3 bars.
---
#### 🔍 **Filter #3: RSI (Relative Strength Index) Filter**
- **Purpose**: Confirms momentum conditions
- **Function**: Prevents signals in extreme momentum zones
- **Benefit**: Avoids counter-trend trades
- **Settings**:
- Enable/Disable toggle
- RSI Period (default: 7)
- RSI Source (Close, Open, High, Low, HL2, HLC3, OHLC4)
- Overbought Level (default: 70)
- Oversold Level (default: 30)
**Logic**:
- Bullish Pinbar: Only signals if RSI < 70 (not overbought)
- Bearish Pinbar: Only signals if RSI > 30 (not oversold)
---
### 3. **Stop Loss Calculation**
Two methods available:
#### Method A: ATR-Based Stop Loss (Recommended)
```
Bullish Pinbar:
SL = Pinbar Low - (1 × ATR)
Bearish Pinbar:
SL = Pinbar High + (1 × ATR)
```
**Benefit**: Dynamic stops that adapt to market volatility
#### Method B: Fixed Pips Stop Loss
```
Bullish Pinbar:
SL = Pinbar Low - (Fixed Pips)
Bearish Pinbar:
SL = Pinbar High + (Fixed Pips)
```
**Settings**:
- Calculate Stop with ATR (toggle)
- Stop Pips without ATR (default: 5)
---
### 4. **Take Profit Calculation**
Take Profit is calculated based on Risk:Reward ratio:
```
Bullish Trade:
TP = Entry + (Entry - SL) × Risk:Reward Ratio
Bearish Trade:
TP = Entry - (SL - Entry) × Risk:Reward Ratio
```
**Example**:
- Entry: 1.2000
- SL: 1.1950 (50 pip risk)
- RR: 2:1
- TP: 1.2100 (100 pip reward = 50 × 2)
**Settings**:
- Risk:Reward Ratio (default: 1.0, range: 0.1 to 10.0)
---
## 📈 Visual Elements
### On-Chart Displays
1. **Signal Markers**
- 🟢 **Green Triangle Up** = Bullish Pinbar (BUY)
- 🔴 **Red Triangle Down** = Bearish Pinbar (SELL)
- Placed directly on the pinbar candle
2. **Entry Labels**
- Green "BUY" label with entry price
- Red "SELL" label with entry price
- Shows exact entry level
3. **Stop Loss Lines**
- 🔴 Red horizontal line
- "SL" label
- Extends 20 bars forward
4. **Take Profit Lines**
- 🟢 Green horizontal line
- "TP" label
- Extends 20 bars forward
5. **Risk/Reward Areas** (Optional)
- Red shaded box = Risk zone (Entry to SL)
- Green shaded box = Reward zone (Entry to TP)
- Visual risk:reward visualization
6. **Info Table** (Top Right)
- Displays current settings
- Shows filter status (ON/OFF)
- Real-time RSI value
- Quick reference panel
---
## 🔔 Alert System
Three alert types available:
### 1. Combined Alert: "Pinbar Signal (Any Direction)"
- Fires for BOTH bullish and bearish pinbars
- **Best for**: General monitoring
- **Message**: "Pinbar Signal Detected on {TICKER} at {PRICE}"
### 2. Bullish Alert: "Bullish Pinbar Alert"
- Fires ONLY for BUY signals
- **Best for**: Long-only strategies
- **Message**: "BUY Signal on {TICKER} at {PRICE}"
### 3. Bearish Alert: "Bearish Pinbar Alert"
- Fires ONLY for SELL signals
- **Best for**: Short-only strategies
- **Message**: "SELL Signal on {TICKER} at {PRICE}"
---
## ⚙️ Input Parameters Reference
### **Filters Group**
| Parameter | Default | Range | Description |
|-----------|---------|-------|-------------|
| ATR Filter on Pinbar Range? | ✅ ON | Boolean | Enable/disable ATR filter |
| ATR Period | 7 | 1+ | Lookback period for ATR calculation |
| Swing Candles | 3 | 1+ | Bars to check for swing high/low |
| RSI Filter on Pinbar? | ❌ OFF | Boolean | Enable/disable RSI filter |
| RSI Period | 7 | 2+ | Lookback period for RSI calculation |
| RSI Source | Close | Multiple | Price data for RSI (Close/Open/High/Low/etc) |
| RSI Overbought Level | 70 | 50-100 | Upper threshold for RSI filter |
| RSI Oversold Level | 30 | 0-50 | Lower threshold for RSI filter |
### **Pinbar Detection Group**
| Parameter | Default | Range | Description |
|-----------|---------|-------|-------------|
| Shadow % vs Body | 72 | 50-95 | Minimum wick size as % of total range |
### **Visualization Group**
| Parameter | Default | Range | Description |
|-----------|---------|-------|-------------|
| Show SL and TP Lines? | ✅ ON | Boolean | Display stop loss and take profit lines |
| Show SL and TP Area? | ❌ OFF | Boolean | Show shaded risk/reward boxes |
### **Risk Management Group**
| Parameter | Default | Range | Description |
|-----------|---------|-------|-------------|
| Risk:Reward Ratio | 1.0 | 0.1-10.0 | Target profit vs risk (1.0 = 1:1, 2.0 = 1:2) |
| Calculate Stop with ATR? | ✅ ON | Boolean | Use ATR for stop calculation |
| Stop Pips without ATR | 5 | 1+ | Fixed pip stop when ATR disabled |
---
## 🚫 Non-Repainting Architecture
### What is Repainting?
**Repainting** occurs when an indicator's historical signals differ from what appeared in real-time. This makes backtesting unreliable and can lead to false confidence in a strategy.
### How This Indicator Prevents Repainting
1. **Closed Bar Analysis**
- All calculations use ` ` offset (previous bar)
- Only analyzes COMPLETED candles
- Signals appear on the bar AFTER the pinbar closes
2. **Confirmed Swing Points**
- Waits for sufficient bar history before signaling
- Only checks historical bars that cannot change
- Prevents premature swing detection
3. **Static Alert Timing**
- Alerts fire only after bar completion
- No conditional logic that changes historically
- Same results in replay mode and live trading
### Verification Method
To verify non-repainting behavior:
1. Apply indicator to chart
2. Note signal locations and prices
3. Refresh browser / reload chart
4. **Signals remain in exact same locations**
---
## 💼 Trading Strategy Guidelines
### Entry Rules
**For Bullish Pinbar (LONG):**
1. Wait for green triangle to appear
2. Enter at close of pinbar (shown in label)
3. Alternative: Enter on break of pinbar high
4. Place stop loss at red SL line
5. Set target at green TP line
**For Bearish Pinbar (SHORT):**
1. Wait for red triangle to appear
2. Enter at close of pinbar (shown in label)
3. Alternative: Enter on break of pinbar low
4. Place stop loss at red SL line
5. Set target at green TP line
### Risk Management
- **Position Sizing**: Risk only 1-2% of account per trade
- **Stop Loss**: Always use the calculated SL (never move it wider)
- **Take Profit**: Use calculated TP or trail stop after 1:1 RR
- **Multiple Timeframes**: Confirm signals on higher timeframe
### Best Practices
✅ **DO:**
- Wait for bar to close before entering
- Trade in direction of higher timeframe trend
- Use on liquid markets with clear support/resistance
- Combine with price action analysis
- Keep a trading journal
❌ **DON'T:**
- Enter before bar closes (prevents seeing full pattern)
- Trade against strong trends
- Ignore the filters (they improve win rate)
- Risk more than 2% per trade
- Trade every signal (be selective)
---
## 📊 Backtesting & Data Export
### Available Data Points
The indicator exports these values for strategy development:
| Output | Description |
|--------|-------------|
| Bullish Signal | 1 = BUY signal, 0 = No signal |
| Bearish Signal | 1 = SELL signal, 0 = No signal |
| Bull SL | Stop loss level for long trades |
| Bull TP | Take profit level for long trades |
| Bull Entry | Entry price for long trades |
| Bear SL | Stop loss level for short trades |
| Bear TP | Take profit level for short trades |
| Bear Entry | Entry price for short trades |
### How to Use in Strategy
These values can be accessed by Pine Script strategies using:
```pine
indicator_values = request.security(syminfo.tickerid, timeframe.period,
)
```
---
## 🎓 Understanding the Filters
### Why Use Multiple Filters?
Single-indicator systems often generate too many false signals. This indicator uses a **confluence approach**:
1. **Pinbar Pattern** = Price rejection detected
2. **+ SWING Filter** = Rejection at key level
3. **+ ATR Filter** = Significant move
4. **+ RSI Filter** = Favorable momentum
**Result**: Higher probability setups with better risk:reward
### Filter Optimization
**Conservative Settings** (Fewer, Higher Quality Signals):
- ATR Filter: ON
- Swing Candles: 5
- RSI Filter: ON
- Shadow %: 75%
**Aggressive Settings** (More Signals, More Noise):
- ATR Filter: OFF
- Swing Candles: 2
- RSI Filter: OFF
- Shadow %: 65%
**Balanced Settings** (Recommended):
- ATR Filter: ON
- Swing Candles: 3
- RSI Filter: OFF (or ON for trending markets)
- Shadow %: 72%
---
## 🔍 Troubleshooting
### "No Signals Appearing"
**Possible Causes:**
1. Filters are too strict
2. No pinbars forming on chart
3. Insufficient bar history
**Solutions:**
- Reduce Shadow % to 65%
- Reduce Swing Candles to 2
- Disable ATR or RSI filters temporarily
- Check that chart has enough data loaded
### "Too Many Signals"
**Solutions:**
- Enable ATR filter
- Increase Swing Candles to 4-5
- Enable RSI filter
- Increase Shadow % to 75-80%
### "Signals Appearing Late"
**This is normal behavior!** The indicator:
- Analyzes previous closed bar
- Signals appear on the bar AFTER the pinbar
- This is what prevents repainting
- Signal latency is 1 bar (by design)
---
## 📝 Technical Specifications
**Indicator Type:** Overlay (displays on price chart)
**Pine Script Version:** 5
**Max Labels:** 500
**Max Lines:** 500
**Repainting:** None (100% non-repainting)
**Data Window Values:** 8 exported values
**Alert Types:** 3 (Combined, Bullish, Bearish)
**Performance:**
- Lightweight script (fast execution)
- Works on all timeframes
- Compatible with all markets (Forex, Crypto, Stocks, Futures)
- No data snooping bias
---
## 🎯 Use Cases
### 1. **Swing Trading**
- Timeframe: Daily, 4H
- Filter Settings: All enabled
- Best for: Catching major reversals
### 2. **Day Trading**
- Timeframe: 15m, 1H
- Filter Settings: ATR + SWING only
- Best for: Intraday reversals
### 3. **Scalping**
- Timeframe: 5m, 15m
- Filter Settings: SWING only (aggressive)
- Best for: Quick reversals (requires experience)
### 4. **Position Trading**
- Timeframe: Weekly, Daily
- Filter Settings: All enabled + high RR (2:1 or 3:1)
- Best for: Long-term trend reversal catches
---
## 🏆 Advantages Over Other Pinbar Indicators
✅ **Guaranteed Non-Repainting** - Many pinbar indicators repaint; this one never does
✅ **Automatic SL/TP** - No manual calculation needed
✅ **Multi-Layer Filtering** - Reduces false signals significantly
✅ **Visual Trade Management** - Clear entry, stop, and target levels
✅ **Flexible Configuration** - Adaptable to any trading style
✅ **Alert System** - Never miss a setup
✅ **Backtesting Ready** - Reliable historical data
✅ **Professional Grade** - Suitable for live trading
---
## 📚 Educational Resources
### Recommended Reading on Pinbars
- "The Pin Bar Trading Strategy" by Nial Fuller
- "Price Action Trading" by Al Brooks
- TradingView Education: Price Action Patterns
### Practice Recommendations
1. Paper trade signals for 20+ trades before live trading
2. Backtest on different timeframes and markets
3. Keep detailed records of all trades
4. Analyze winning vs losing setups
5. Refine filter settings based on results
---
## ⚖️ Disclaimer
This indicator is a tool for technical analysis and does not guarantee profits. Trading involves substantial risk of loss. Past performance is not indicative of future results.
- Always use proper risk management
- Never risk more than you can afford to lose
- Consider your trading experience and objectives
- Seek independent financial advice if needed
---
## 📧 Version Information
**Current Version:** 1.0
**Last Updated:** 2024
**Compatibility:** TradingView Pine Script v5
**Status:** Production Ready
---
## 🔄 Future Enhancements (Potential)
Possible future additions:
- Multi-timeframe confirmation option
- Volume filter integration
- Customizable color schemes
- Win rate statistics display
- Partial profit taking levels
- Trailing stop functionality
---
## 📖 Quick Start Guide
### 5-Minute Setup
1. **Add to Chart**
- Open TradingView
- Go to Pine Editor
- Paste the code
- Click "Add to Chart"
2. **Configure Settings**
- Open indicator settings (gear icon)
- Start with default settings
- Enable "Show SL and TP Lines"
3. **Set Alert**
- Right-click indicator name
- Click "Add Alert"
- Select "Pinbar Signal (Any Direction)"
- Configure notification method
4. **Test**
- Scroll back on chart
- Verify signals make sense
- Check that signals don't repaint
5. **Trade** (After Practice!)
- Wait for alert
- Verify signal quality
- Enter, place SL/TP
- Manage trade
---
## 🎯 Final Thoughts
The **Pinbar MTF - No Repaint** indicator is designed for serious traders who value:
- **Reliability** over flashy signals
- **Quality** over quantity
- **Honesty** over false promises
This indicator will NOT:
- Make you rich overnight
- Win every trade
- Replace proper trading education
This indicator WILL:
- Identify high-probability reversal setups
- Save you analysis time
- Provide consistent, non-repainting signals
- Help you develop a systematic trading approach
**Success in trading comes from:**
1. Proper education (60%)
2. Risk management (30%)
3. Technical tools like this indicator (10%)
Use this tool as part of a complete trading plan, not as a standalone solution.

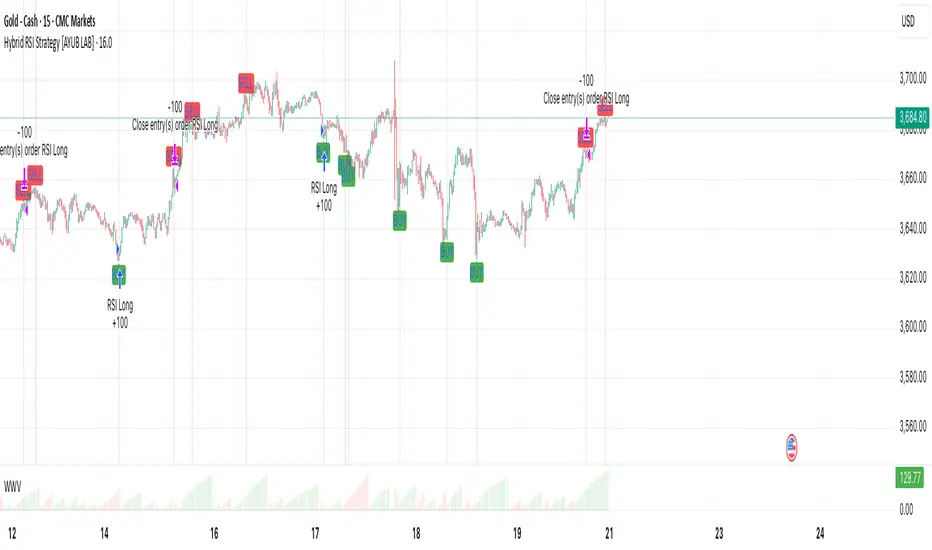
Hybrid RSI Strategy [Heifereum ]This is a hybrid script that combines visual RSI indicator signals with an optional backtestable trading strategy.
BUY Entry: When RSI crosses above the oversold level (default 30)
SELL Exit: When RSI crosses below the overbought level (default 70)
Timeframe: Works best on trending assets (crypto, forex, indices) in 5min to 1H
Backtest Toggle: Turn ON/OFF live testing using the Enable Backtest Mode? setting
Visual Cues: Buy/Sell labels, background coloring, and alerts ready for webhook automation
Use this strategy to visually explore RSI dynamics, run performance backtests, or hook up to external bots via alerts.
Versatile Moving Average StrategyVersatile Moving Average Strategy (VMAS)
Overview:
The Versatile Moving Average Strategy (VMAS) is designed to provide traders with a flexible approach to trend-following, utilizing multiple types of moving averages. This strategy allows for customization in choosing the moving average type and length, catering to various market conditions and trading styles.
Key Features:
- Multiple Moving Average Types: Choose from SMA, EMA, SMMA (RMA), WMA, VWMA, HULL, LSMA, and ALMA to best suit your trading needs.
- Customizable Inputs: Adjust the moving average length, source of price data, and stop-loss source to fine-tune the strategy.
- Target Percent: Set the percentage difference between successive profit targets to manage your risk and rewards effectively.
- Position Management: Enable or disable long and short positions, allowing for versatility in different market conditions.
- Commission and Slippage: The strategy includes realistic commission settings to ensure accurate backtesting results.
Strategy Logic:
1. Moving Average Calculation: The selected moving average is calculated based on user-defined parameters.
2. Entry Conditions:
- A long position is entered when the entry source crosses over the moving average, if long positions are enabled.
- A short position is entered when the entry source crosses under the moving average, if short positions are enabled.
3. Stop-Loss: Positions are closed if the stop-loss source crosses the moving average in the opposite direction.
4. Profit Targets: Multiple profit targets are defined, with each target set at an incremental percentage above (for long positions) or below (for short positions) the entry price.
Default Properties:
- Account Size: $10000
- Commission: 0.01% per trade
- Risk Management: Positions are sized to risk 80% of the equity per trade, because we get very tight stoploss when position is open.
- Sample Size: Backtesting has been conducted to ensure a sufficient sample size of trades, ideally more than 100 trades.
How to Use:
1. Configure Inputs: Set your preferred moving average type, length, and other input parameters.
2. Enable Positions: Choose whether to enable long, short, or both types of positions.
3. Backtest and Analyze: Run backtests with realistic settings and analyze the results to ensure the strategy aligns with your trading goals.
4. Deploy and Monitor: Once satisfied with the backtesting results, deploy the strategy in a live environment and monitor its performance.
This strategy is suitable for traders looking to leverage moving averages in a versatile and customizable manner. Adjust the parameters to match your trading style and market conditions for optimal results.
Note: Ensure the strategy settings used for publication are the same as those described here. Always conduct thorough backtesting before deploying any strategy in a live trading environment.

Pineconnector Strategy Template (Connect Any Indicator)Hello traders,
If you're tired of manual trading and looking for a solid strategy template to pair with your indicators, look no further.
This Pine Script v5 strategy template is engineered for maximum customization and risk management.
Best part?
It’s optimized for Pineconnector, allowing seamless integration with MetaTrader 4 and 5.
This powerful tool gives a lot of power to those who don't know how to code in Pinescript and are looking to automate their indicators' signals on Metatrader 4/5.
IMPORTANT NOTES
Pineconnector is a trading bot software that forwards TradingView alerts to your Metatrader 4/5 for automating trading.
Many traders don't know how to dynamically create Pineconnector-compatible alerts using the data from their TradingView scripts.
Traders using trading bots want their alerts to reflect the stop-loss/take-profit/trailing-stop/stop-loss to break options from your script and then create the orders accordingly.
This script showcases how to create Pineconnector alerts dynamically.
Pineconnector doesn't support alerts with multiple Take Profits.
As a workaround, for 2 TPs, I had to open two trades.
It's not optimal, as we end up paying more spreads for that extra trade - however, depending on your trading strategy, it may not be a big deal.
TRADINGVIEW ALERTS
1) You'll have to create one alert per asset X timeframe = 1 chart.
Example: 1 alert for EUR/USD on the 5 minutes chart, 1 alert for EUR/USD on the 15-minute chart (assuming you want your bot to trade the EUR/USD on the 5 and 15-minute timeframes)
2) Select the Order fills and alert() function calls condition
3) For each alert, the alert message is pre-configured with the text below
{{strategy.order.alert_message}}
Please leave it as it is.
It's a TradingView native variable that will fetch the alert text messages built by the script.
4) Don't forget to set the Pineconnector webhook URL in the Notifications tab of the TradingView alerts UI.
You’ll find the URL on the Pineconnector documentation website.
EA CONFIGURATION
1) The Pyramiding in the EA on Metatrader must be set to 2 if you want to trade with 2 TPs => as it's opening 2 trades.
If you only want 1 TP, set the EA Pyramiding to 1.
Regarding the other EA settings, please refer to the Pineconnector documentation on their website.
2) In the EA, you can set a risk (= position size type) in %/lots/USD, as in the TradingView backtest settings.
KEY FEATURES
I) Modular Indicator Connection
* plug in your existing indicator into the template.
* Only two lines of code are needed for full compatibility.
Step 1: Create your connector
Adapt your indicator with only 2 lines of code and then connect it to this strategy template.
To do so:
1) Find in your indicator where the conditions print the long/buy and short/sell signals.
2) Create an additional plot as below
I'm giving an example with a Two moving averages cross.
Please replicate the same methodology for your indicator, whether it's a MACD , ZigZag , Pivots , higher-highs, lower-lows, or whatever indicator with clear buy and sell conditions.
//@version=5
indicator("Supertrend", overlay = true, timeframe = "", timeframe_gaps = true)
atrPeriod = input.int(10, "ATR Length", minval = 1)
factor = input.float(3.0, "Factor", minval = 0.01, step = 0.01)
= ta.supertrend(factor, atrPeriod)
supertrend := barstate.isfirst ? na : supertrend
bodyMiddle = plot(barstate.isfirst ? na : (open + close) / 2, display = display.none)
upTrend = plot(direction < 0 ? supertrend : na, "Up Trend", color = color.green, style = plot.style_linebr)
downTrend = plot(direction < 0 ? na : supertrend, "Down Trend", color = color.red, style = plot.style_linebr)
fill(bodyMiddle, upTrend, color.new(color.green, 90), fillgaps = false)
fill(bodyMiddle, downTrend, color.new(color.red, 90), fillgaps = false)
buy = ta.crossunder(direction, 0)
sell = ta.crossunder(direction, 0)
//////// CONNECTOR SECTION ////////
Signal = buy ? 1 : sell ? -1 : 0
plot(Signal, title = "Signal", display = display.data_window)
//////// CONNECTOR SECTION ////////
Important Notes
🔥 The Strategy Template expects the value to be exactly 1 for the bullish signal and -1 for the bearish signal
Now, you can connect your indicator to the Strategy Template using the method below or that one.
Step 2: Connect the connector
1) Add your updated indicator to a TradingView chart
2) Add the Strategy Template as well to the SAME chart
3) Open the Strategy Template settings, and in the Data Source field, select your 🔌Connector🔌 (which comes from your indicator)
Note it doesn’t have to be named 🔌Connector🔌 - you can name it as you want - however, I recommend an explicit name you can easily remember.
From then, you should start seeing the signals and plenty of other stuff on your chart.
🔥 Note that whenever you update your indicator values, the strategy statistics and visuals on your chart will update in real-time
II) Customizable Risk Management
- Choose between percentage or USD modes for maximum drawdown.
- Set max consecutive losing days and max losing streak length.
- I used the code from my friend @JosKodify for the maximum losing streak. :)
Will halt the EA and backtest orders fill whenever either of the safeguards above are “broken”
III) Intraday Risk Management
- Limit the maximum intraday losses both in percentage or USD.
- Option to set a maximum number of intraday trades.
- If your EA gets halted on an intraday chart, auto-restart it the next day.
IV) Spread and Account Filters
- Trade only if the spread is below a certain pip value.
- Set requirements based on account balance or equity.
V) Order Types and Position Sizing
- Choose between market, limit, or stop orders.
- Set your position size directly in the template.
Please use the position size from the “Inputs” and not the “Properties” tab.
Reason : The template sends the order on the same candle as the entry signals - at those entry signals candles, the position size isn’t computed yet, and the template can’t then send it to Pineconnector.
However, you can use the position size type (USD, contracts, %) from the “Properties” tab for backtesting.
In the EA, you can define the position size type for your orders in USD or lots or %.
VI) Advanced Take-Profit and Stop-Loss Options
- Choose to set your SL/TP in either pips or percentages.
- Option for multiple take-profit levels and trailing stop losses.
- Move your stop loss to break even +/- offset in pips for “risk-free” trades.
VII) Logger
The Pineconnector commands are logged in the TradingView logger.
You'll find more information about it in this TradingView blog post .
WHY YOU MIGHT NEED THIS TEMPLATE
1) Transform your indicator into a Pineconnector trading bot more easily than before
Connect your indicator to the template
Create your alerts
Set your EA settings
2) Save Time
Auto-generated alert messages for Pineconnector.
I tested them all, and I checked with the support team what could/can’t be done
3) Be in Control
Manage your trading risks with advanced features.
4) Customizable
Fits various trading styles and asset classes.
REQUIREMENTS
* Make sure you have your Pineconnector license ID.
* Create your alerts with the Pineconnector webhook URL
* If there is any issue with the template, ask me in the comments section - I’ll answer quickly.
BACKTEST RESULTS FROM THIS POST
1) I connected this strategy template to a dummy Supertrend script.
I could have selected any other indicator or concept for this script post.
I wanted to share an example of how you can quickly upgrade your strategy, making it compatible with Pineconnector.
2) The backtest results aren't relevant for this educational script publication.
I used realistic backtesting data but didn't look too much into optimizing the results, as this isn't the point of why I'm publishing this script.
This strategy is a template to be connected to any indicator - the sky is the limit. :)
3) This template is made to take 1 trade per direction at any given time.
Pyramiding is set to 1 on TradingView.
The strategy default settings are:
* Initial Capital: 100000 USD
* Position Size: 1 contract
* Commission Percent: 0.075%
* Slippage: 1 tick
* No margin/leverage used
WHAT’S COMING NEXT FOR YOU GUYS?
I’ll make the same template for ProfitView, then for AutoView, and then for Alertatron.
All of those are free and open-source.
I have no affiliations with any of those companies - I'm publishing those templates as they will be useful to many of you.
Dave

Risk Management and Positionsize - MACD exampleMastering Risk Management
Risk management is the cornerstone of successful trading, and it's often the difference between turning a profit and suffering a loss. In light of its importance, I share a risk management tool which you can use for your trading strategies. The script not only assists in position sizing but also comes with built-in technical features that help in market timing. Let's delve into the nitty-gritty details.
Input Parameter: MarginFactor
One of the key features of the script is the MarginFactor input parameter. This element lets you control the portion of your equity used for placing each trade. A MarginFactor of -0.5 means 50% of your total equity will be deployed in placing the position size. Although Tradingview has a built-in option to adjust position sizing in a same way, I personally prefer to have the logic in my pinecode script. The main reason is userexperience in managing and testing different settings for different charts, timeframes and instruments (with the same strategy).
Stoploss and MarginFactor
If your strategy has a 4% stop-loss, you can choose to use only 50% of your equity by setting the MarginFactor to -0.5. In this case, you are effectively risking only 2% of your total capital per trade, which aligns well with the widely-accepted rule of thumb suggesting a 1-2% risk per trade. Similar if your stoploss is only 1% you can choose to change the MarginFactor to 1, resulting in a positionsize of 200% of your equity. The total risk would be again 2% per trade if your stoploss is set to 1%.
Max Drawdown and MarginFactor
Your MarginFactor setting can also be aligned with the maximum drawdown of your strategy, seen during a backtested period of 2-3 years. For example, if the max drawdown is 15%, you could calibrate your MarginFactor accordingly to limit your risk exposure.
Option to Toggle Number of Contracts
The script offers the option to toggle between using a percentage of equity for position sizing or specifying a fixed number of contracts. Utilizing a percentage of equity might yield unrealistic backtest results, especially over longer periods. This occurs because as the capital grows, the absolute position size also increases, potentially inflating the accumulated returns generated by the backtester. On the other hand, setting a fixed number of contracts as your position size offers a more stable and realistic ROI over the backtested period, as it removes the compounding effect on position sizes.
Key Features Strategy
MACD High Time Frame Entry and Exit Logic
The strategy employs a high time frame MACD (Moving Average Convergence Divergence) to make entry and exit decisions. You can easily adjust the timeframe settings and MACD settings in the inputsection to trade on lower timeframes. For more information on the HTF MACD with dynamic smoothing see:
Moving Average High Time Frame Filter
To reduce market 'noise', the strategy incorporates a high time frame moving average filter. This ensures that the trades are aligned with the dominant market trend (trading the trend). In the inputsection traders can easily switch between different type of moving averages. For more information about this HTF filter see:
Dynamic Smoothing
The script includes a feature for dynamic smoothing. The script contains The timeframeToMinutes(tf) function to convert any given time frame into its equivalent in minutes. For example, a daily (D) time frame is converted into 1440 minutes, a weekly (W) into 10,080 minutes, and so forth. Next the smoothing factor is calculated by dividing the minutes of the higher time frame by those of the current time frame. Finally, the script applies a Simple Moving Average (SMA) over the MACD, SIGNAL, and HIST values, MA filter using the dynamically calculated smoothing factor.
User Convenience: One of the major benefits is that traders don't need to manually adjust the smoothing factor when switching between different time frames. The script does this dynamically.
Visual Consistency: Dynamic smoothing helps traders to more accurately visualize and interpret HTF indicators when trading on lower time frames.
Time Frame Restriction: It's crucial to note that the operational time frame should always be lower than the time frame selected in the input sections for dynamic smoothing to function as intended.
By incorporating this dynamic smoothing logic, the script offers traders a nuanced yet straightforward way to adapt High Time Frame indicators for lower time frame trading, enhancing both adaptability and user experience.
Limitations: Exit Strategy
It's crucial to note that the script comes with a simplified exit strategy, devoid of features like a stop-loss, trailing stop-loss or multiple take profits. This means that while the script focuses on entries and risk management, it might result in higher losses if market conditions unexpectedly turn unfavorable.
Conclusion
Effective risk management is pivotal for trading success, and this TradingView script is designed to give you a better idea how to implement positions sizing with your preferred strategy. However, it's essential to note that this tool should not be considered financial advice. Always perform your due diligence and consult with financial advisors before making any trading decisions.
Feel free to use this risk management tool as building block in your trading scripts, Happy Trading!

JMA Quantum Edge: Adaptive Precision Trading System JMA Quantum Edge: Adaptive Precision Trading System - Enhanced Visuals & Risk Management
Get ready to experience a groundbreaking trading strategy that adapts in real-time to market conditions! This powerful, open-source script combines advanced technical analysis with state-of-the-art risk management tools, designed to give you the edge you need in today's dynamic markets.
What It Does:
Adaptive JMA Indicator:
Utilizes a custom Jurik Moving Average (JMA) that adjusts its sensitivity based on market volatility, ensuring you get precise signals even in the most fluctuating environments.
Dynamic Risk Management:
Features built-in support for partial exits (scaling out) to secure profits, along with an optional Kelly Criterion-based position sizing that tailors your exposure based on historical performance metrics.
Robust Error Handling:
Incorporates market condition filters—like minimum volume and maximum allowed gap percentage—to ensure trades are only executed under favorable conditions.
Vivid Visual Enhancements:
Enjoy an animated background that reflects market momentum, dynamic pivot markers, and clearly drawn trend channels. Plus, interactive tables provide real-time performance analytics and detailed error metrics.
Fully Customizable:
With a comprehensive set of inputs, you can easily tailor the strategy to your personal trading style and market preferences. Adjust everything from JMA parameters to refresh intervals for tables and labels!
How to Use It:
Add the Script:
Copy and paste the script into the Pine Script Editor on TradingView and click “Add to Chart.”
Configure Your Settings:
Customize your risk management (capital, commission, position sizing, partial exits, etc.) and tweak the JMA settings to match your preferred trading style. Use the extensive input panel to adjust visuals, alerts, and more.
Backtest & Optimize:
Run the strategy in the Strategy Tester to analyze its historical performance. Monitor real-time analytics and error metrics via the interactive tables, and fine-tune your parameters for optimal performance.
Go Live with Confidence:
Once you're satisfied with the backtest results, use the generated signals for live trading, and let the system help you stay ahead in fast-paced markets!
How to use the imputs:
This cutting-edge strategy is designed to adapt to changing market conditions and offers you complete control over your trading parameters. Here’s a breakdown of what each group of inputs does and how you should use them:
Risk Management & Trade Settings
Recalculate on Every Tick:
What it does: When enabled, the strategy recalculates on every price update.
Recommendation: Leave it true for fast charts.
Initial Capital:
What it does: Sets your starting capital for backtesting, which influences position sizing and performance metrics.
Recommendation: Start with $10,000 (or adjust according to your trading capital).
Commission (%):
What it does: Simulates the cost per trade.
Recommendation: Use a realistic rate (e.g., 0.04%).
Position Size & Quantity Type:
What they do: Define how large each trade will be. Choose between a fixed unit amount or a percentage of equity.
Recommendation: For beginners, the default fixed value is a good start. Experiment later with percentage-based sizing if needed.
Order Comment:
What it does: Adds a label to your orders for easier tracking.
Allow Reverse Orders:
What it does: If disabled, the strategy will close opposing positions before entering a new trade, reducing conflicts.
Enable Dynamic Position Sizing:
What it does: Adjusts trade size based on current volatility.
Recommendation: Beginners may start with this disabled until they understand basic sizing.
Partial Exit Inputs:
What they do:
Enable Partial Exits: When turned on, you can scale out of your position to lock in profits.
Partial Exit Profit (%): The profit percentage that triggers a partial exit.
Partial Exit Percentage: The percentage of your current position to exit. Recommendation: Use defaults (e.g., 5% profit, 50% exit) to secure profits gradually.
Kelly Criterion Option:
What it does: When enabled, adjusts your position sizing using historical performance (win rate and profit factor).
Recommendation: Beginners might leave this disabled until comfortable with backtest performance metrics.
Market Condition Filters:
What they do:
Minimum Volume: Ensures trades occur only when there’s sufficient market activity.
Maximum Gap (%): Prevents trading if there’s an unusually large gap between the previous close and current open. Recommendation: Defaults work well for most markets. If trades seem erratic, consider tightening these limits.
JMA Settings
Price Source:
What it does: The input series for the JMA calculation, typically set to the closing price.
JMA Length:
What it does: Controls the smoothing period of the JMA. Lower values are more sensitive; higher values smooth out the noise. Recommendation: Start with 21.
JMA Phase & Power:
What they do: Adjust how responsive the JMA is. Phase controls timing; power adjusts the intensity. Recommendation: Default settings (63 phase and 3 power) are a balanced starting point.
Visual Settings & Style
Show JMA Line, Pivot Lines, and Pivot Labels:
What they do: Toggle visual elements on your chart for easier signal identification.
Pivot History Count:
What it does: Limits how many historical pivot markers are displayed.
Color Settings (Up/Down Neon Colors):
What they do: Set the visual cues for buy and sell signals.
Pivot Marker & Line Style:
What they do: Choose the style and thickness of your pivot markers and lines.
Show Stats Panel:
What it does: Displays real-time performance and error metrics.
Dynamic Background & Visual Enhancements
Animate Background:
What it does: Changes the background color based on market momentum.
Show Trend Channels & Volume Zones:
What they do: Draw trend channels and highlight areas of high volatility/volume.
Show Data-Rich Labels:
What it does: Displays key metrics like volume, error percentage, and momentum on the chart.
High Volatility Threshold:
What it does: Determines the multiplier for when the chart background should change due to high volatility.
Multi-Timeframe Settings
Higher Timeframe:
What it does: Uses a higher timeframe’s JMA for trend confirmation. Recommendation: Use Daily ('D') or Weekly ('W') for broader trend analysis.
Show HTF Trend Zone & Opacity:
What they do: Display a visual zone from the higher timeframe to help confirm trends.
6. Trailing Stop Settings
Trailing Stop ATR Factor & Offset Multiplier:
What they do: Calculate trailing stops based on the Average True Range (ATR), adjusting stop distances dynamically. Recommendation: Default settings are a good balance but can be fine-tuned based on asset volatility.
Alerts & Notifications
Alerts on Pivot Formation & JMA Crossover:
What they do: Notify you when key events occur.
Dynamic Power Threshold:
What it does: Sets the sensitivity for dynamic alerts.
8. Static Stop Loss / Take Profit
Static Stop Loss (%) & Take Profit (%):
What they do: Allow you to set fixed stop loss or take profit levels. Recommendation: Leave them at 0 to disable if you prefer dynamic risk management, or set them if you have strict risk/reward preferences.
Advanced Settings
ATR Length:
What it does: Determines the period for ATR calculation, impacting trailing stop sensitivity. Recommendation: Start with 14.
Optimization Feedback & Enhanced Error Analysis
Error Metric Length & Error Threshold (%):
What they do: Calculate error metrics (like average error, skewness, and kurtosis) to help you fine-tune the JMA. Recommendation: Use the defaults and adjust if the error metrics seem off during backtesting.
UI - User-Driven Tweaking & Table Customization
Parameter Tweaker Panel, Debug/Performance Table Settings:
What they do: Provide interactive tables that display real-time performance, error metrics, and allow you to monitor strategy parameters.
Refresh Frequency Options (Table & Label Refresh Intervals):
What they do: Set how often the tables and labels update.
Recommendation: Start with an interval of 1 bar; increase it if your chart is too busy.
Important for Beginners:
Default Settings:
All default values have been chosen for balanced performance across different markets. If you ever experience unexpected behavior, start by resetting the inputs to their defaults.
Step-by-Step Adjustments:
Experiment by changing one setting at a time while observing how the strategy’s signals and performance metrics change. This will help you understand the impact of each parameter.
Resetting to Defaults:
If things seem off or you’re not getting the expected results, you can always reset the indicator. Either reload the script or use the “Reset Inputs” option (if available) to revert to the default settings.
Jump in, experiment, and enjoy the power of adaptive precision trading. This strategy is built to grow with your skills—have fun exploring and refining your trading edge!
Happy trading!

KillZones + ACD Fisher [TradingFinder] Sessions + Reversal Level🔵 Introduction
🟣 ACD Method
"The Logical Trader" opens with a thorough exploration of the ACD Methodology, which focuses on pinpointing particular price levels associated with the opening range.
This approach enables traders to establish reference points for their trades, using "A" and "C" points as entry markers. Additionally, the book covers the concept of the "Pivot Range" and how integrating it with the ACD method can help maximize position size while minimizing risk.
🟣 Session
The forex market is operational 24 hours a day, five days a week, closing only on Saturdays and Sundays. Typically, traders prefer to concentrate on one specific forex trading session rather than attempting to trade around the clock.
Trading sessions are defined time periods when a particular financial market is active, allowing for the execution of trades.
The most crucial trading sessions within the 24-hour cycle are the Asia, London, and New York sessions, as these are when substantial money flows and liquidity enter the market.
🟣 Kill Zone
Traders in financial markets earn profits by capitalizing on the difference between their buy/sell prices and the prevailing market prices.
Traders vary in their trading timelines.Some traders engage in daily or even hourly trading, necessitating activity during periods with optimal trading volumes and notable price movements.
Kill zones refer to parts of a session characterized by higher trading volumes and increased price volatility compared to the rest of the session.
🔵 How to Use
🟣 Session Times
The "Asia Session" comprises two parts: "Sydney" and "Tokyo." This session begins at 23:00 and ends at 06:00 UTC. The "Asia KillZone" starts at 23:00 and ends at 03:55 UTC.
The "London Session" includes "Frankfurt" and "London," starting at 07:00 and ending at 14:25 UTC. The "London KillZone" runs from 07:00 to 09:55 UTC.
The "New York" session starts at 14:30 and ends at 19:25 UTC, with the "New York am KillZone" beginning at 14:30 and ending at 22:55 UTC.
🟣 ACD Methodology
The ACD strategy is versatile, applicable to various markets such as stocks, commodities, and forex, providing clear buy and sell signals to set price targets and stop losses.
This strategy operates on the premise that the opening range of trades holds statistical significance daily, suggesting that initial market movements impact the market's behavior throughout the day.
Known as a breakout strategy, the ACD method thrives in volatile or strongly trending markets like crude oil and stocks.
Some key rules for employing the ACD strategy include :
Utilize points A and C as critical reference points, continually monitoring these during trades as they act as entry and exit markers.
Analyze daily and multi-day pivot ranges to understand market trends. Prices above the pivots indicate an upward trend, while prices below signal a downward trend.
In forex trading, the ACD strategy can be implemented using the ACD indicator, a technical tool that gauges the market's supply and demand balance. By evaluating trading volume and price, this indicator assists traders in identifying trend strength and optimal entry and exit points.
To effectively use the ACD indicator, consider the following :
Identifying robust trends: The ACD indicator can help pinpoint strong, consistent market trends.
Determining entry and exit points: ACD generates buy and sell signals to optimize trade timing.
Bullish Setup :
When the "A up" line is breached, it’s wise to wait briefly to confirm it’s not a "Fake Breakout" and that the price stabilizes above this line.
Upon entering the trade, the most effective stop loss is positioned below the "A down" line. It's advisable to backtest this to ensure the best outcomes. The recommended reward-to-risk ratio for this strategy is 1, which should also be verified through backtesting.
Bearish Setup :
When the "A down" line is breached, it’s prudent to wait briefly to ensure it’s not a "Fake Breakout" and that the price stabilizes below this line.
Upon entering the trade, the most effective stop loss is positioned above the "A up" line. Backtesting is recommended to confirm the best results. The recommended reward-to-risk ratio for this strategy is 1, which should also be validated through backtesting.
Advantages of Combining Kill Zone and ACD Method in Market Analysis :
Precise Trade Timing : Integrating the Kill Zone strategy with the ACD Method enhances precision in trade entries and exits. The ACD Method identifies key points for trading, while the Kill Zone focuses on high-activity periods, together ensuring optimal timing for trades.
Better Trend Identification : The ACD Method’s pivot ranges help spot market trends, and when combined with the Kill Zone’s emphasis on periods of significant price movement, traders can more effectively identify and follow strong market trends.
Maximized Profits and Minimized Risks : The ACD Method's structured approach to setting price targets and stop losses, coupled with the Kill Zone's high-volume trading periods, helps maximize profit potential while reducing risk.
Robust Risk Management : Combining these methods provides a comprehensive risk management strategy, strategically placing stop losses and protecting capital during volatile periods.
Versatility Across Markets : Both methods are applicable to various markets, including stocks, commodities, and forex, offering flexibility and adaptability in different trading environments.
Enhanced Confidence : Using the combined insights of the Kill Zone and ACD Method, traders gain confidence in their decision-making process, reducing emotional trading and improving consistency.
By merging the Kill Zone’s focus on trading volumes and the ACD Method’s structured breakout strategy, traders benefit from a synergistic approach that enhances precision, trend identification, and risk management across multiple markets.

KK_Average Directional Index (ADX) Higher TFHey guys,
sometimes you just want to plot an Indicator value from a higher Timeframe on your Chart. For most Indicators this is pretty straightforward however there is one Indicator that has been giving me quite a headache while trying to do this: The Average Directional Index . Anyway after going through almost 200 versions of this script I finally found a solution that works and thought I would share this with you, since I'm sure some of you have encountered the same problem.
How it works
Go to your desired Instrument/Timeframe and add the Script
Under Settings in the field for "Higher ADX TF" put the Timeframe-code you want to pull the ADX Values from.
- Codes: Monthly - M, Weekly W, Daily - D
- Codes Intraday: The amount of hours in minutes, e.g. if you want to pull values from the 4h-Chart the code is 240 (60 for 1h, 15 for 15m ...)
In some cases (see below) the calculation might not be correct. So make sure the values are correct:
a) Write down the latest ADX of the higher TF while you are on the lower TF
b) Switch the Resolution to the higher TF
c) Compare the value you have just written down to the next to last value. They should be the same.
d) Switch back the Resolution to the lower TF and you're good to go.
Limitations
You can only pull values from higher Timeframes, e.g. you're on a 4h Chart, so you can only pull values from the Daily, Weekly and Monthly Chart. You can't pull values from the 1h Chart.
You can only pull values from Timeframes, where the higher Timeframe Close always has a corresponding Close on the lower Timeframe, e.g. you can't pull values from the 3h Chart when you are on a 2h Chart. This should be pretty rare.
The Script needs a certain amount of Data from the Higher TF before the calculated values are correct. I have tested this on several Instruments and the Script usually needs approximately 100 Bars on the higher Timeframe (often less) for the values to be correct (error < 1%).
So when the difference between your lower Timeframe and you higher Timeframe is large, e.g. you want to pull the Daily ADX value on a 15m-Chart, the calculation can be wrong. This can lead to errors in 2 Cases:
a) Backtesting: When you go over old data and get close to the last available Bar the Data will be wrong. This will limit the amount of data you can backtest.
b) Live values: When the difference between the two Timeframes is too large, it is possible that even live values are wrong, e.g. this will be the case when you are trying to pull the Daily ADX value on a 5 minute Chart. Always check if the calculation works with your desired combination of Timeframes before using it (see above).
I hope this is useful for you and whish all of you successful trading!
Best regards
Kurbelklaus
CAP - cRSI cyclic smoothed [MTF]Introduction This indicator is a Multi-Timeframe (MTF) adaptation of the Cyclic Smoothed RSI (cRSI), based on the foundational work of Lars von Thienen and his book "Decoding The Hidden Market Rhythm". It allows traders to visualize cyclic momentum and identify potential turning points by adapting standard RSI calculations to a dominant market cycle.
How It Works Unlike a standard RSI which uses fixed periods, the cRSI uses "cyclic memory" to adjust its sensitivity:
Cyclic Smoothing: It smooths the RSI based on a user-defined Dominant Cycle Length (default: 20 bars).
Dynamic Bands: Instead of static overbought/oversold levels (like 70/30), this script calculates dynamic upper and lower bands that adapt to recent volatility and cyclic distribution.
MTF Capability: You can view the cRSI of a higher timeframe (e.g., Daily) while looking at a lower timeframe chart (e.g., H1) to align your entries with the broader trend.
My Trading Strategy & Context I am sharing this to start a conversation on how to optimize cyclic tools for Equity markets. My current workflow is:
- Timeframe: I analyze Daily candles for the main trend but look for entries on Intraday (H1).
- Confluence: I combine this cRSI with the CSP - CSI (Cyclic Swing Indicator).
- Momentum & Trend: I use Williams %R to read immediate momentum, and check trend direction using EMA9 and SMA30.
- Entries: On the H1 chart, I look for VWAP interactions to trigger the entry once the Daily cRSI confirms the cycle low/high.
Let's Collaborate I am looking for constructive feedback to refine this strategy. Please leave a comment below regarding:
- Settings: Have you found a Dominant Cycle Length other than 20 that works better for Crypto or FX volatility?
- Filtering: What filters do you use to avoid "catching a falling knife" when the bands widen significantly?
- Backtesting: If you have visual backtest results using this with VWAP, please share your findings.
Note: This script is for educational purposes and collaborative research. Please backtest all strategies before live trading.
#Cycles, #RSI, #Momentum, #Lars von Thienen, #MTF

Pivot Edge ProOverview
Smart Pivot Analytics is a highly accurate technical analysis tool designed to identify and validate significant price levels. Unlike standard pivot indicators that only mark recent highs, this tool backtests each identified pivot against thousands of historical candlesticks to calculate its real-world “success rate.”
Key Features
Historical Backtesting: The indicator scans up to 4,900 historical columns to find every instance where price interacted with a specific pivot level.
Strength Score (%): Each level is assigned a percentage score based on its reversal rate. It calculates how many times the price has successfully reached and rejected the level, providing a statistical “hit rate.”
Dynamic Hit Counter: Displays the exact number of times a level has been tested (hit), helping traders distinguish between new levels and established “old” levels.
Smart Filtering: To keep the chart clean, the indicator automatically filters out weak levels and prevents “clutter” by merging levels that are too close together.
Infinite Left Projection: Lines extend left to infinity, allowing traders to see the historical significance of a level across the entire price history at a glance.
How to Trade with It
Red Levels (High Power > 75%): These are “Top Reaction Zones”. Expect a strong price rejection or significant breakout when these levels are tested.
Orange Levels (Medium Power): Suitable for profit targets or as secondary confirmation for entering a trade.
Encounter: Use these levels in conjunction with your existing strategy. When a high power pivot aligns with your entry signal, the probability of a successful trade increases significantly.
Technical Parameters
Lookback Period: Defines how far back in history the script calculates power.
Touch Radius: The "sensitivity" of the level (how close the price has to get to be considered a "hit").
Minimum Strength: A filter to show only the most reliable levels.

Recovery StrategyDescription:
The Recovery Strategy is a long-only trading system designed to capitalize on significant price drops from recent highs. It enters a position when the price falls 10% or more from the highest high over a 6-month lookback period and adds positions on further 2% drops, up to a maximum of 5 positions. Each trade is held for 6 months before exiting, regardless of profit or loss. The strategy uses margin to amplify position sizes, with a default leverage of 5:1 (20% margin requirement). All key parameters are customizable via inputs, allowing flexibility for different assets and timeframes. Visual markers indicate recent highs for reference.
How It Works:
Entry: Buys when the closing price drops 10% or more from the recent high (highest high in the lookback period, default 126 bars ~6 months). If already in a position, additional buys occur on further 2% drops (e.g., 12%, 14%, 16%, 18%), up to 5 positions (pyramiding).
Exit: Each trade exits after its own holding period (default 126 bars ~6 months), regardless of profit or loss. No stop loss or take-profit is used.
Margin: Uses leverage to control larger positions (default 20% margin, 5:1 leverage). The order size is a percentage of equity (default 100%), adjustable via inputs.
Visualization: Displays blue markers (without text) at new recent highs to highlight reference levels.
Inputs:
Lookback Period for High Peak (bars): Number of bars to look back for the recent high (default: 126, ~6 months on daily charts).
Initial Drop Percentage to Buy (%): Percentage drop from recent high to trigger the first buy (default: 10.0%).
Additional Drop Percentage to Buy (%): Further drop percentage to add positions (default: 2.0%).
Holding Period (bars): Number of bars to hold each position before selling (default: 126, ~6 months).
Order Size (% of Equity): Percentage of equity used per trade (default: 100%).
Margin for Long Positions (%): Percentage of position value covered by equity (default: 20%, equivalent to 5:1 leverage).
Usage:
Timeframe: Designed for daily charts (126 bars ~6 months). Adjust Lookback Period and Holding Period for other timeframes (e.g., 1008 hours for hourly charts, assuming 8 trading hours/day).
Assets: Suitable for stocks, ETFs, or other assets with significant price volatility. Test thoroughly on your chosen asset.
Settings: Customize inputs in the strategy settings to match your risk tolerance and market conditions. For example, lower Margin for Long Positions (e.g., to 10% for 10:1 leverage) to increase position sizes, but beware of higher risk.
Backtesting: Use TradingView’s Strategy Tester to evaluate performance. Check the “List of Trades” for skipped trades due to insufficient equity or margin requirements.
Risks and Considerations:
No Stop Loss: The strategy holds trades for the full 6 months without a stop loss, exposing it to significant drawdowns in prolonged downtrends.
Margin Risk: Leverage (default 5:1) amplifies both profits and losses. Ensure sufficient equity to cover margin requirements to avoid skipped trades or simulated margin calls.
Pyramiding: Up to 5 positions can be open simultaneously, increasing exposure. Adjust pyramiding in the code if fewer positions are desired (e.g., change to pyramiding=3).
Market Conditions: Performance depends on price drops and recoveries. Test on historical data to assess effectiveness in your market.
Broker Emulator: TradingView’s paper trading simulates margin but does not execute real margin trading. Results may differ in live trading due to broker-specific margin rules.
How to Use:
Add the strategy to your chart in TradingView.
Adjust input parameters in the settings panel to suit your asset, timeframe, and risk preferences.
Run a backtest in the Strategy Tester to evaluate performance.
Monitor open positions and margin levels in the Trading Panel to manage risk.
For live trading, consult your broker’s margin requirements and leverage policies, as TradingView’s simulation may not match real-world conditions.
Disclaimer:
This strategy is for educational purposes only and does not constitute financial advice. Trading involves significant risk, especially with leverage and no stop loss. Always backtest thoroughly and consult a financial advisor before using any strategy in live trading.

Smart Structure Breaks & Order BlocksOverview (What it does)
The indicator “Smart Structure Breaks & Order Blocks” detects market structure using swing highs and lows, identifies Break of Structure (BOS) events, and automatically draws order blocks (OBs) from the origin candle. These zones extend to the right and change color/outline when mitigated or invalidated. By formalizing and automating part of discretionary analysis, it provides consistent zone recognition.
Main Components
Swing Detection: ta.pivothigh/ta.pivotlow identify confirmed swing points.
BOS Detection: Determines if the recent swing high/low is broken by close (strict mode) or crossover.
OB Creation: After a BOS, the opposite candle (bearish for bullish BOS, bullish for bearish BOS) is used to generate an order block zone.
Zone Management: Limits the number of zones, extends them to the right, and tracks tagged (mitigated) or invalidated states.
Input Parameters
Left/Right Pivot (default 6/6): Number of bars required on each side to confirm a swing. Higher values = smoother swings.
Max Zones (default 4): Maximum zones stored per direction (bull/bear). Oldest zones are overwritten.
Zone Confirmation Lookback (default 3): Ensures OB origin candle validity by checking recent highs/lows.
Show Swing Points (default ON): Displays triangles on swing highs/lows.
Require close for BOS? (default ON): Strict BOS (close required) vs loose BOS (line crossover).
Use candle body for zones (default OFF): Zones drawn from candle body (ON) or wick (OFF).
Signal Definition & Logic
Swing Updates: Latest confirmed pivots update lastHighLevel / lastLowLevel.
BOS (Break of Structure):
Bullish – close breaks last swing high.
Bearish – close breaks last swing low.
Only one valid BOS per swing (avoids duplicates).
OB Detection:
Bullish BOS → previous bearish candle with lowest low forms the OB.
Bearish BOS → previous bullish candle with highest high forms the OB.
Zones: Bull = green, Bear = red, semi-transparent, extended to the right.
Zone States:
Mitigated: Price touches the zone → border highlighted.
Invalidated:
Bull zone → close below → turns red.
Bear zone → close above → turns green.
Chart Appearance
Swing High: red triangle above bar
Swing Low: green triangle below bar
Bull OB: green zone (border highlighted on touch)
Bear OB: red zone (border highlighted on touch)
Invalid Zones: Bull zones turn reddish, Bear zones turn greenish
Practical Use (Trading Assistance)
Trend Following Entries: Buy pullbacks into green OBs in uptrends, sell rallies into red OBs in downtrends.
Focus on First Touch: First mitigation after BOS often has higher reaction probability.
Confluence: Combine with higher timeframe trend, volume, session levels, key price levels (previous highs/lows, VWAP, etc.).
Stops/Targets:
Bull – stop below zone, partial take profit at swing high or resistance.
Bear – stop above zone, partial take profit at swing low or support.
Parameter Tuning (per market/timeframe)
Pivot (6/6 → 4/4/8/8): Lower for scalping (3–5), medium for day trading (5–8), higher for swing trading (8–14). Increase to reduce noise.
Strict Break: ON to reduce false breaks in ranging markets; OFF for earlier signals.
Body Zones: ON for assets with long wicks, OFF for cleaner OBs in liquid instruments.
Zone Confirmation (default 3): Increase for stricter OB origin, fewer zones.
Max Zones (default 4 → 6–10): Increase for higher volatility, decrease to avoid clutter.
Strengths
Standardizes BOS and OB detection that is usually subjective.
Tracks mitigation and invalidation automatically.
Adaptable: allows body/wick zone switching for different instruments.
Limitations
Pivot-based: Signals appear only after pivots confirm (slight lag).
Zones reflect past balance: Can fail after new events (news, earnings, macro data).
Range-heavy markets: More false BOS; consider stricter settings.
Backtesting: This script is for drawing/visual aid; trading rules must be defined separately.
Workflow Example
Identify higher timeframe trend (4H/Daily).
On lower TF (15–60m), wait for BOS and new OB.
Enter on first mitigation with confirmation candle.
Stop beyond zone; targets based on R multiples and swing points.
FAQ
Q: Why are zones invalidated quickly?
A: Flow reversal after BOS. Adjust pivots higher, enable Strict mode, or switch to Body zones to reduce noise.
Q: What does “tagged” mean?
A: Price touched the zone once = mitigated. Implies some orders in that zone may have been filled.
Q: Body or Wick zones?
A: Wick zones are fine in clean markets. For volatile pairs with long wicks, body zones provide more realistic areas.
Customization Tips (Code perspective)
Zone storage: Currently ring buffer ((idx+1) % zoneLimit). Could prioritize keeping unmitigated zones.
Automated testing: Add strategy.entry/exit for rule-based backtests.
Multi-timeframe: Use request.security() for higher timeframe swings/BOS.
Visualization: Add labels for BOS bars, tag zones with IDs, count touches.
Summary
This indicator formalizes the cycle Swing → BOS → OB creation → Mitigation/Invalidation, providing consistent structure analysis and zone tracking. By tuning sensitivity and strictness, and combining with higher timeframe context, it enhances pullback/continuation trading setups. Always combine with proper risk management.

Timeshifter Triple Timeframe Strategy w/ SessionsOverview
The "Enhanced Timeshifter Triple Timeframe Strategy with Session Filtering" is a sophisticated trading strategy designed for the TradingView platform. It integrates multiple technical indicators across three different timeframes and allows traders to customize their trading Sessions. This strategy is ideal for traders who wish to leverage multi-timeframe analysis and session-based trading to enhance their trading decisions.
Features
Multi-Timeframe Analysis and direction:
Higher Timeframe: Set to a daily timeframe by default, providing a broader view of market trends.
Trading Timeframe: Automatically set to the current chart timeframe, ensuring alignment with the trader's primary analysis period.
Lower Timeframe: Set to a 15-minute timeframe by default, offering a granular view for precise entry and exit points.
Indicator Selection:
RMI (Relative Momentum Index): Combines RSI and MFI to gauge market momentum.
TWAP (Time Weighted Average Price): Provides an average price over a specified period, useful for identifying trends.
TEMA (Triple Exponential Moving Average): Reduces lag and smooths price data for trend identification.
DEMA (Double Exponential Moving Average): Similar to TEMA, it reduces lag and provides a smoother trend line.
MA (Moving Average): A simple moving average for basic trend analysis.
MFI (Money Flow Index): Measures the flow of money into and out of a security, useful for identifying overbought or oversold conditions.
VWMA (Volume Weighted Moving Average): Incorporates volume data into the moving average calculation.
PSAR (Parabolic SAR): Identifies potential reversals in price movement.
Session Filtering:
London Session: Trade during the London market hours (0800-1700 GMT+1).
New York Session: Trade during the New York market hours (0800-1700 GMT-5).
Tokyo Session: Trade during the Tokyo market hours (0900-1800 GMT+9).
Users can select one or multiple sessions to align trading with specific market hours.
Trade Direction:
Long: Only long trades are permitted.
Short: Only short trades are permitted.
Both: Both long and short trades are permitted, providing flexibility based on market conditions.
ADX Confirmation:
ADX (Average Directional Index): An optional filter to confirm the strength of a trend before entering a trade.
How to Use the Script
Setup:
Add the script to your TradingView chart.
Customize the input parameters according to your trading preferences and strategy requirements.
Indicator Selection:
Choose the primary indicator you wish to use for generating trading signals from the dropdown menu.
Enable or disable the ADX confirmation based on your preference for trend strength analysis.
Session Filtering:
Select the trading sessions you wish to trade in. You can choose one or multiple Sessions based on your trading strategy and market focus.
Trade Direction:
Set your preferred trade direction (Long, Short, or Both) to align with your market outlook and risk tolerance. You can use this feature to gauge the market and understand the possible directions.
Tips for Profitable and Safe Trading:
Recommended Timeframes Combination:
LT: 1m , CT: 5m, HT: 1H
LT: 1-5m , CT: 15m, HT: 4H
LT: 5-15m , CT: 4H, HT: 1W
Backtesting:
Always backtest the strategy on historical data to understand its performance under various market conditions.
Adjust the parameters based on backtesting results to optimize the strategy for your specific trading style.
Risk Management:
Use appropriate risk management techniques, such as setting stop-loss and take-profit levels, to protect your capital.
Avoid over-leveraging and ensure that you are trading within your risk tolerance.
Market Analysis:
Combine the script with other forms of market analysis, such as fundamental analysis or market sentiment, to make well-rounded trading decisions.
Stay informed about major economic events and news that could impact market volatility and trading sessions.
Continuous Monitoring:
Regularly monitor the strategy's performance and make adjustments as necessary.
Keep an eye on the results and settings for real-time statistics and ensure that the strategy aligns with current market conditions.
Education and Practice:
Continuously educate yourself on trading strategies and market dynamics.
Practice using the strategy in a demo account before applying it to live trading to gain confidence and understanding.

Anomaly Counter-Trend StrategyA mean-reversion style strategy that automatically spots unusually large price moves over a configurable lookback period and takes the opposite side, with full risk-management, commission and slippage modeling—built in Pine Script® v6.
🔎 Overview
ACTS monitors the percent-change over the past N minutes and, when that move exceeds your chosen threshold, enters a counter-trend position (short on a strong rise; long on a sharp fall). It’s ideal for markets that often “overshoot” and snap back, and can be applied on any symbol or timeframe.
⚙️ Key Features
Anomaly Detection: Detect abnormal price swings based on a user-defined % change over a lookback period.
Counter-Trend Entries: Auto-enter short on rise anomalies, long on fall anomalies (with seamless flat↔reverse transitions).
Risk Management: Configurable stop-loss and take-profit in ticks per trade.
Realistic Modeling: Simulates commissions (0.05 % default), slippage (2 ticks), and percent-of-equity sizing.
Immediate Bar-Close Execution: Orders processed on bar close for faster fills.
Visual Aids: Optional on-chart BUY/SELL triangles and background highlights during anomaly periods.
⚙️ Inputs
Input Default Description
Percentage Threshold (%) 2.00 Min % move over lookback to trigger an anomaly.
Lookback Period (Minutes) 15 Number of minutes over which to measure change.
Stop Loss (Ticks) 100 Distance from entry for stop-loss exit.
Take Profit (Ticks) 200 Distance from entry for take-profit exit.
Plot Trade Signal Shapes (on/off) true Show BUY/SELL triangles on chart.
Highlight Anomaly Background true Shade background during anomaly bars.
📊 How to Use
Add to Chart: Apply the script to any ticker & timeframe.
Tune: Adjust your percentage threshold and lookback to match each instrument’s volatility.
Review Backtest: Check built-in strategy performance (drawdown, Sharpe, etc.) under the Strategy Tester tab.
Go Live: Once optimized, link to alerts or your trade execution system.
⚠️ Disclaimer
This script is provided “as-is” for educational purposes and backtesting only. Past performance does not guarantee future results. Always backtest thoroughly, manage your own risk, and consider market conditions before live trading.
Enjoy experimenting—and may your counter-trend entries catch the next big snapback!
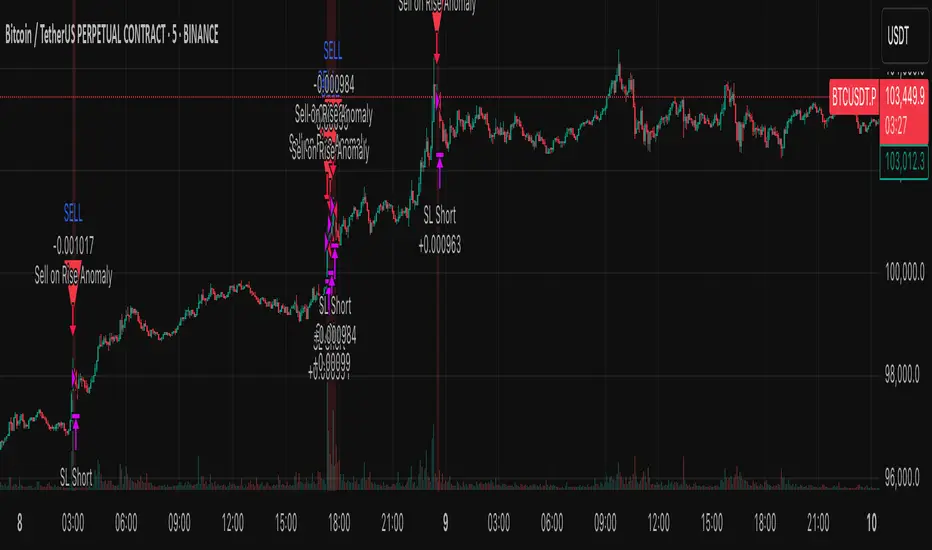
Supertrend + MACD CrossoverKey Elements of the Template:
Supertrend Settings:
supertrendFactor: Adjustable to control the sensitivity of the Supertrend.
supertrendATRLength: ATR length used for Supertrend calculation.
MACD Settings:
macdFastLength, macdSlowLength, macdSignalSmoothing: These settings allow you to fine-tune the MACD for better results.
Risk Management:
Stop-Loss: The stop-loss is based on the ATR (Average True Range), a volatility-based indicator.
Take-Profit: The take-profit is based on the risk-reward ratio (set to 3x by default).
Both stop-loss and take-profit are dynamic, based on ATR, which adjusts according to market volatility.
Buy and Sell Signals:
Buy Signal: Supertrend is bullish, and MACD line crosses above the Signal line.
Sell Signal: Supertrend is bearish, and MACD line crosses below the Signal line.
Visual Elements:
The Supertrend line is plotted in green (bullish) and red (bearish).
Buy and Sell signals are shown with green and red triangles on the chart.
Next Steps for Optimization:
Backtesting:
Run backtests on BTC in the 5-minute timeframe and adjust parameters (Supertrend factor, MACD settings, risk-reward ratio) to find the optimal configuration for the 60% win ratio.
Fine-Tuning Parameters:
Adjust supertrendFactor and macdFastLength to find more optimal values based on BTC's market behavior.
Tweak the risk-reward ratio to maximize profitability while maintaining a good win ratio.
Evaluate Market Conditions:
The performance of the strategy can vary based on market volatility. It may be helpful to evaluate performance in different market conditions or pair it with a filter like RSI or volume.
Let me know if you'd like further tweaks or explanations!

[TehThomas] - Displacement CandlesOverview:
This PineScript is designed to detect and visualize significant price movements, called displacements, on a trading chart. It's particularly useful for traders who want to identify potential trend changes or strong market sentiment quickly.
How the Script Works
User Input:
The script allows users to set a custom threshold for displacement detection and choose colors for bullish and bearish movements.
Displacement Detection Function:
isDisplacement(series, threshold) =>
percentage_change = math.abs(series - series ) / series * 100
percentage_change > threshold
This function calculates the percentage change between the current and previous price.
If the change exceeds the set threshold, it's considered a displacement.
Bullish and Bearish Detection:
bullish_displacement = isDisplacement(close, threshold) and close > close
bearish_displacement = isDisplacement(close, threshold) and close < close
Identifies whether the displacement is bullish (price increase) or bearish (price decrease).
Candle Coloring:
barcolor(bullish_displacement ? bullish_color : bearish_displacement ? bearish_color : na)
Changes the color of candles based on the detected displacement type.
Usefulness and Applications:
Trend Identification: Helps in quickly spotting potential trend changes or continuations.
Volatility Analysis: Provides a visual representation of market volatility.
Entry and Exit Signals: Can be used to identify potential entry or exit points for trades.
Market Sentiment: Offers insights into the strength of bullish or bearish sentiment.
Customizable Sensitivity: The adjustable threshold allows traders to fine-tune the indicator based on the asset's typical volatility.
Visual Clarity: By changing candle colors, it provides a clear, at-a-glance view of significant price movements.
Complementary Tool: Can be used alongside other technical indicators for confirmation of signals.
Multiple Timeframe Analysis: Applicable across different timeframes to suit various trading styles (day trading, swing trading, etc.).
Educational Purpose: Helps new traders understand and visualize significant price movements in the market.
Backtesting: Can be incorporated into strategy backtests to assess its effectiveness in different market conditions.
This script is particularly handy for traders who want to cut through market noise and focus on significant price movements. It's versatile enough to be used across different trading strategies and can be a valuable addition to a trader's technical analysis toolkit.
It's a very easy script and not alot to mention. If you see any improvements please let me know.

[blackcat] L1 Main life line oscillator█ OVERVIEW
The Pine Script provided is an indicator named " L1 Main life line oscillator." Its primary function is to calculate and plot two oscillators: the Main Force and the Life Line. These oscillators are derived from smoothed price data, and the script also detects and labels crossovers and crossunders between the two lines, which can be used to generate buy and sell signals.
█ FEATURES
Key Features:
• Input Parameters: Users can define the period (n) and the weight for the oscillators.
• Custom Function: A function calculate_life_line_oscillator is defined to compute the Main Force and Life Line oscillators.
• Advanced Calculations: The script uses an adaptive moving average (ALMA) and exponential moving average (EMA) to smooth the price data and calculate the oscillators.
• Crossover and Crossunder Detection: Built-in functions ta.crossover and ta.crossunder are used to identify signal points.
• Label Drawing: Custom labels are drawn on the chart to indicate buy ("B") and sell ("S") signals.
█ HOW TO USE
1 — Configure Input Parameters: Adjust the period (n) and weight to suit your trading strategy.
2 — Interpret the Oscillators: Observe the Main Force and Life Line on the chart.
3 — Act on Signals: Look for crossovers and crossunders to generate buy and sell signals. Buy signals are indicated by the label "B" and sell signals by "S".
█ LIMITATIONS
• Lag in Signals: While the use of ALMA and EMA reduces lag, some delay may still occur, especially in volatile markets.
• False Signals: Crossovers and crossunders can sometimes produce false signals, so it is advisable to use this indicator in conjunction with other tools for confirmation.
█ NOTES
Advanced Pine Script Features:
• Adaptive Moving Average (ALMA): Provides a more responsive and adaptive oscillator.
• Exponential Moving Average (EMA): Smooths the price range and Main Force values.
• Crossover and Crossunder Detection: Utilizes built-in functions for signal identification.
• Label Drawing: Enhances visual signaling with custom labels.
Optimization Techniques:
• The use of ALMA and EMA helps in reducing lag and improving the responsiveness of the oscillators.
• The custom function encapsulates complex calculations, making the main script cleaner and more maintainable.
Unique Approaches:
• The combination of ALMA and EMA to create the Main Force oscillator provides a unique smoothing method.
• The Life Line is calculated using a weighted average of the previous and current Main Force values, adding an additional layer of smoothing and responsiveness.
█ THANKS
Thank you for using the " L1 Main life line oscillator." If you have any questions or suggestions, please feel free to reach out in the comments or on the TradingView or my Discord channel.
█ EXTENDED KNOWLEDGE AND APPLICATIONS
Potential Modifications:
• Additional Indicators: Extend the script to include other technical indicators (e.g., RSI, MACD) for a more comprehensive trading signal system.
• Customizable Colors and Styles: Allow users to customize the colors and styles of the plotted lines and labels.
• Alerts: Implement alerts for crossovers and crossunders to notify users in real-time.
Application Scenarios:
• Intraday Trading: The responsiveness of the oscillators makes this script suitable for intraday trading, where quick buy and sell signals are crucial.
• Long-Term Analysis: By adjusting the period n, the script can be used for long-term trend analysis and strategic trades.
• Backtesting: The script can be modified into a strategy to backtest the performance of the oscillator-based signals against historical data.
Related Pine Script Concepts:
• Strategy Development: Understanding how to convert indicators into strategies for backtesting and live trading.
• Advanced Plotting: Exploring more advanced plotting techniques, such as using different styles and customizing plot appearances.
• Signal Validation: Techniques for validating and filtering signals to reduce false positives and improve trade accuracy.
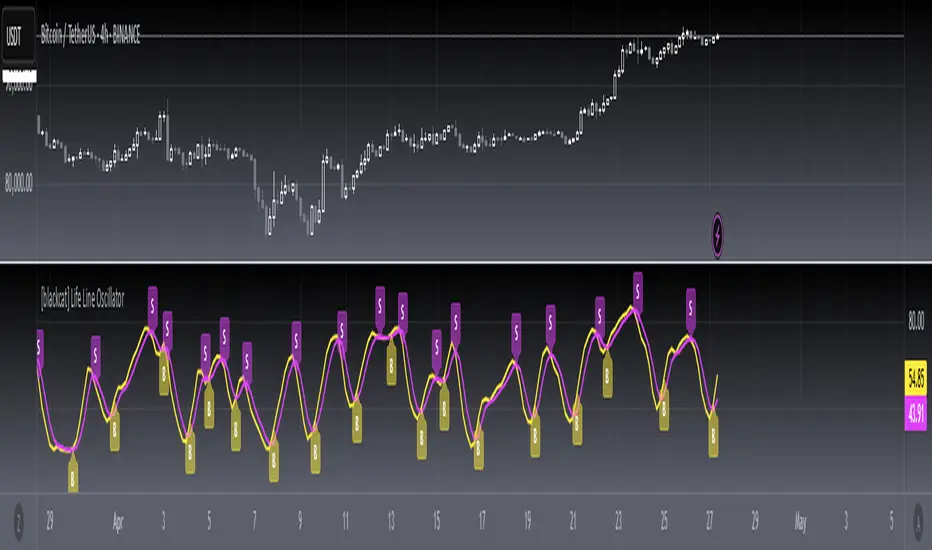
Equilibrium Candles + Pattern [Honestcowboy]The Equilibrium Candles is a very simple trend continuation or reversal strategy depending on your settings.
How an Equilibrium Candle is created:
We calculate the equilibrium by measuring the mid point between highest and lowest point over X amount of bars back.
This now is the opening price for each bar and will be considered a green bar if price closes above equilibrium.
Bars get shaded by checking if regular candle close is higher than open etc. So you still see what the normal candles are doing.
Why are they useful?
The equilibrium is calculated the same as Baseline in Ichimoku Cloud. Which provides a point where price is very likely to retrace to. This script visualises the distance between close and equilibrium using candles. To provide a clear visual of how price relates to this equilibrium point.
This also makes it more straightforward to develop strategies based on this simple concept and makes the trader purely focus on this relationship and not think of any Ichimoku Cloud theories.
Script uses a very simple pattern to enter trades:
It will count how many candles have been one directional (above or below equilibrium)
Based on user input after X candles (7 by default) script shows we are in a trend (bg colors)
On the first pullback (candle closes on other side of equilibrium) it will look to enter a trade.
Places a stop order at the high of the candle if bullish trend or reverse if bearish trend.
If based on user input after X opposite candles (2 by default) order is not filled will cancel it and look for a new trend.
Use Reverse Logic:
There is a use reverse logic in the settings which on default is turned on. It will turn long orders into short orders making the stop orders become limit orders. It will use the normal long SL as target for the short. And TP as stop for the short. This to provide a means to reverse equity curve in case your pair is mean reverting by nature instead of trending.
ATR Calculation:
Averaged ATR, which is using ta.percentile_nearest_rank of 60% of a normal ATR (14 period) over the last 200 bars. This in simple words finds a value slightly above the mean ATR value over that period.
Big Candle Exit Logic:
Using Averaged ATR the script will check if a candle closes X times that ATR from the equilibrium point. This is then considered an overextension and all trades are closed.
This is also based on user input.
Simple trade management logic:
Checks if the user has selected to use TP and SL, or/and big candle exit.
Places a TP and SL based on averaged ATR at a multiplier based on user Input.
Closes trade if there is a Big Candle Exit or an opposite direction signal from indicator.
Script can be fully automated to MT5
There are risk settings in % and symbol settings provided at the bottom of the indicator. The script will send alert to MT5 broker trying to mimic the execution that happens on tradingview. There are always delays when using a bridge to MT5 broker and there could be errors so be mindful of that. This script sends alerts in format so they can be read by tradingview.to which is a bridge between the platforms.
Use the all alert function calls feature when setting up alerts and make sure you provide the right webhook if you want to use this approach.
There is also a simple buy and sell alert feature if you don't want to fully automate but still get alerts. These are available in the dropdown when creating an alert.
Almost every setting in this indicator has a tooltip added to it. So if any setting is not clear hover over the (?) icon on the right of the setting.
The backtest uses a 4% exposure per trade and a 10 point slippage. I did not include a commission cause I'm not personaly aware what the commissions are on most forex brokers. I'm only aware of minimal slippage to use in a backtest. Trading conditions vary per broker you use so always pay close attention to trading costs on your own broker. Use a full automation at your own risk and discretion and do proper backtesting.
