Hull AMA SignalsThis script is a comprehensive trading indicator named "Hull AMA Signals", which combines AMA and HSO by LuxAlgo and ther video based strategy techniques to provide buy (long) and sell (short) signals. It overlays directly on the price chart, offering a dynamic and visually intuitive trading aid. The core components of this indicator are Adaptive Moving Averages (AMA), Hull Moving Average (HMA), and a unique Hull squeeze oscillator (HSO), each configured with customizable parameters for flexibility and adaptability to various market conditions.
Features and Components
Adaptive Moving Averages (AMA): This indicator employs two sets of AMAs, each with distinct lengths, multipliers, lags, and overshoot parameters. The AMAs are designed to adapt their sensitivity based on the market's volatility, making them more responsive during significant price movements and less prone to false signals during periods of consolidation.
Hull Moving Average (HMA): The HMA is calculated using a sophisticated algorithm that aims to reduce the lag commonly associated with traditional moving averages. It provides a smoother and more responsive moving average line, which helps in identifying the prevailing market trend more accurately.
Hull Squeeze Oscillator (HSO): A novel component of this indicator, the HSO, is designed to identify potential market breakouts. It does so by comparing the Hull Moving Average's direction and momentum against a dynamically calculated mean, generating bullish or bearish signals based on the crossover and divergence from this mean.
Buy (Long) and Sell (Short) Signals: The script intelligently combines signals from the AMA crossovers and the Hull squeeze oscillator to pinpoint potential buy and sell opportunities. Bullish signals are generated when there's a positive crossover in the AMAs accompanied by a bullish dot from the HSO, whereas bearish signals are indicated by a negative crossover in the AMAs along with a bearish dot from the HSO.
Customization and Style Options: Users have the ability to adjust various parameters such as the length of the moving averages, multipliers, and source data, enabling customization for different trading strategies and asset classes. Additionally, color-coded visual elements like gradients and shapes enhance the readability and instant recognition of trading signals.
Use Cases
Trend Identification: By analyzing the direction and position of the AMAs and HMA, traders can easily discern the prevailing market trend, helping them to align their trades with the market momentum.
Signal Confirmation: The combination of AMA crossovers and HSO signals provides a robust framework for confirming trade entries and exits, potentially increasing the reliability of the trading signals.
Volatility Adaptation: The adaptive nature of the AMAs and the dynamic calculation of the HSO mean allow this indicator to adjust to changing market volatility, making it suitable for a wide range of market environments.
This indicator is suitable for traders looking for a comprehensive and dynamic technical analysis tool that combines trend analysis with signal generation, offering both visual appeal and practical trading utility.
Cari skrip untuk "averages"

Adaptive Fisherized Z-scoreHello Fellas,
It's time for a new adaptive fisherized indicator of me, where I apply adaptive length and more on a classic indicator.
Today, I chose the Z-score, also called standard score, as indicator of interest.
Special Features
Advanced Smoothing: JMA, T3, Hann Window and Super Smoother
Adaptive Length Algorithms: In-Phase Quadrature, Homodyne Discriminator, Median and Hilbert Transform
Inverse Fisher Transform (IFT)
Signals: Enter Long, Enter Short, Exit Long and Exit Short
Bar Coloring: Presents the trade state as bar colors
Band Levels: Changes the band levels
Decision Making
When you create such a mod you need to think about which concepts are the best to conclude. I decided to take Inverse Fisher Transform instead of normalization to make a version which fits to a fixed scale to avoid the usual distortion created by normalization.
Moreover, I chose JMA, T3, Hann Window and Super Smoother, because JMA and T3 are the bleeding-edge MA's at the moment with the best balance of lag and responsiveness. Additionally, I chose Hann Window and Super Smoother because of their extraordinary smoothing capabilities and because Ehlers favours them.
Furthermore, I decided to choose the half length of the dominant cycle instead of the full dominant cycle to make the indicator more responsive which is very important for a signal emitter like Z-score. Signal emitters always need to be faster or have the same speed as the filters they are combined with.
Usage
The Z-score is a low timeframe scalper which works best during choppy/ranging phases. The direction you should trade is determined by the last trend change. E.g. when the last trend change was from bearish market to bullish market and you are now in a choppy/ranging phase confirmed by e.g. Chop Zone or KAMA slope you want to do long trades.
Interpretation
The Z-score indicator is a momentum indicator which shows the number of standard deviations by which the value of a raw score (price/source) is above or below the mean value of what is being observed or measured. Easily explained, it is almost the same as Bollinger Bands with another visual representation form.
Signals
B -> Buy -> Z-score crosses above lower band
S -> Short -> Z-score crosses below upper band
BE -> Buy Exit -> Z-score crosses above 0
SE -> Sell Exit -> Z-score crosses below 0
If you were reading till here, thank you already. Now, follows a bunch of knowledge for people who don't know the concepts I talk about.
T3
The T3 moving average, short for "Tim Tillson's Triple Exponential Moving Average," is a technical indicator used in financial markets and technical analysis to smooth out price data over a specific period. It was developed by Tim Tillson, a software project manager at Hewlett-Packard, with expertise in Mathematics and Computer Science.
The T3 moving average is an enhancement of the traditional Exponential Moving Average (EMA) and aims to overcome some of its limitations. The primary goal of the T3 moving average is to provide a smoother representation of price trends while minimizing lag compared to other moving averages like Simple Moving Average (SMA), Weighted Moving Average (WMA), or EMA.
To compute the T3 moving average, it involves a triple smoothing process using exponential moving averages. Here's how it works:
Calculate the first exponential moving average (EMA1) of the price data over a specific period 'n.'
Calculate the second exponential moving average (EMA2) of EMA1 using the same period 'n.'
Calculate the third exponential moving average (EMA3) of EMA2 using the same period 'n.'
The formula for the T3 moving average is as follows:
T3 = 3 * (EMA1) - 3 * (EMA2) + (EMA3)
By applying this triple smoothing process, the T3 moving average is intended to offer reduced noise and improved responsiveness to price trends. It achieves this by incorporating multiple time frames of the exponential moving averages, resulting in a more accurate representation of the underlying price action.
JMA
The Jurik Moving Average (JMA) is a technical indicator used in trading to predict price direction. Developed by Mark Jurik, it’s a type of weighted moving average that gives more weight to recent market data rather than past historical data.
JMA is known for its superior noise elimination. It’s a causal, nonlinear, and adaptive filter, meaning it responds to changes in price action without introducing unnecessary lag. This makes JMA a world-class moving average that tracks and smooths price charts or any market-related time series with surprising agility.
In comparison to other moving averages, such as the Exponential Moving Average (EMA), JMA is known to track fast price movement more accurately. This allows traders to apply their strategies to a more accurate picture of price action.
Inverse Fisher Transform
The Inverse Fisher Transform is a transform used in DSP to alter the Probability Distribution Function (PDF) of a signal or in our case of indicators.
The result of using the Inverse Fisher Transform is that the output has a very high probability of being either +1 or –1. This bipolar probability distribution makes the Inverse Fisher Transform ideal for generating an indicator that provides clear buy and sell signals.
Hann Window
The Hann function (aka Hann Window) is named after the Austrian meteorologist Julius von Hann. It is a window function used to perform Hann smoothing.
Super Smoother
The Super Smoother uses a special mathematical process for the smoothing of data points.
The Super Smoother is a technical analysis indicator designed to be smoother and with less lag than a traditional moving average.
Adaptive Length
Length based on the dominant cycle length measured by a "dominant cycle measurement" algorithm.
Happy Trading!
Best regards,
simwai
---
Credits to
@cheatcountry
@everget
@loxx
@DasanC
@blackcat1402

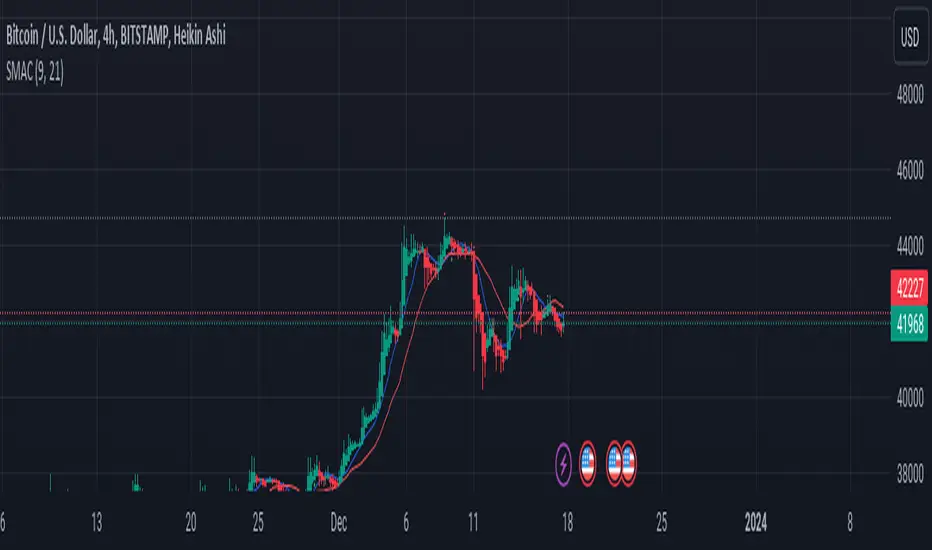
MoonFlag BTC Daily Swing PredictorThis script mainly works on BTC on the daily timeframe. Other coins also show similar usefulness with this script however, BTC on the daily timeframe is the main design for this script.
(Please note this is not trading advice this is just comments about how this indicator works.)
This script is predictive. It colors the background yellow when the script calculates a large BTC swing is potentially about to happen. It does not predict in which direction the swing will occur but it leads the price action so can be useful for leveraged trades. When the background gets colored with vertical yellow lines - this shows that a largish price swing is probably going to occur.
The scripts also shades bands around the price action that are used to estimate an acceptable volatility at any given time. If the bands are wide that means price action is volatile and large swings are not easily predicted. Over time, with reducing volatility, these price action bands narrow and then at a set point or percentage (%) which can be set in the script settings, the background gets colored yellow. This indicates present price action is not volatile and a large price swing is potentially going to happen in the near future. When price action breaks through the narrowing bands, the background is no longer presented because this is seen as an increase in volatility and a considerable portion of the time, a large sudden drop in price action or momentous gain in price is realized.
This indicator leads price action. It predicts that a swing is possibly going to happen in the near future. As the indicator works on the BTC daily, this means on a day-to-day basis if the bands continually narrow - a breakout is more likely to happen. In order to see how well this indicator works, have a look at the results on the screenshot provided. Note the regions where vertical yellow lines are present on the price action - and then look after these to see if a sizeable swing in price has occurred.
To use this indicator - wait until yellow vertical lines are presented on the BTC daily. Then use your experience to determine which way the price action might swing and consider entering a trade or leveraged trade in this direction. Alternatively wait a while to see in which direction the break-out occurs and considering and attempt to trade with this. Sometimes swings can be unexpected and breakout in one direction before then swinging much larger in the other. Its important to remember/consider that this indicator works on the BTC daily timeframe, so any consideration of entering a trade should be expected to cover a duration over many days or weeks, or possibly months. A large swing is only estimated every several plus months.
Most indicators are based on moving averages. A moving average is not predictive in the sense in that it lags price actions. This indicator creates bands that are based on the momentum of the price action. A change in momentum of price action therefore causes the bands to widen. When the bands narrow this means that the momentum of the price action is steady and price action volatility has converged/reduced over time. With BTC this generally means that a large swing in price action is going to occur as momentum in price action then pick-up again in one direction or another. Trying to view this using moving averages is not easy as a moving average lags price action which means that it is difficult to predict any sudden movements in price action ahead of when they might occur. Although, moving averages will converge over time in a similar manner as the bands calculated by this script. This script however, uses the price action momentum in a predictive manner to estimate where the price action might go based on present price momentum. This script therefore reacts to reduced volatility in price action much faster than a set of moving averages over various timescales can achieve.
MoonFlag

Simple Moving Average CrossoverThis Pine Script is a TradingView script for creating a technical analysis indicator known as a Simple Moving Average Crossover (SMAC). The script visualizes two moving averages on a chart and provides buy and sell signals based on the crossover of these moving averages.
Here's a breakdown of the script:
Input Parameters:
fastLength: The length of the fast/simple moving average.
slowLength: The length of the slow/simple moving average.
Moving Averages Calculation:
fastMA: Calculates the simple moving average with a length of fastLength using the closing prices.
slowMA: Calculates the simple moving average with a length of slowLength using the closing prices.
Plotting:
Plots the fast and slow moving averages on the chart using different colors.
Buy and Sell Signals:
buySignal: Generates a boolean series indicating a buy signal when the fast moving average crosses above the slow moving average.
sellSignal: Generates a boolean series indicating a sell signal when the fast moving average crosses below the slow moving average.
Plotting Signals:
Plots green triangle-up shapes below price bars for buy signals.
Plots red triangle-down shapes above price bars for sell signals.
In summary, this script helps traders visualize potential trend reversals by identifying points where a shorter-term moving average crosses above (buy signal) or below (sell signal) a longer-term moving average. These crossover signals are often used in trend-following strategies to capture potential changes in market direction. Traders can customize the script by adjusting the input parameters to suit their trading preferences.
Webby's Quick & Grateful Dead RSWebby's Quick & Grateful Dead RS combines a Relative Strength Line and Moving Averages to help traders hold a core position in a winning stock by identifying moments of strength and weakness in a stocks advance.
The Relative Strength (RS) line is something many investors are familiar with. It is used to measure a stocks performance versus the S&P 500 (default setting) and is typically calculated by dividing the closing price of the stock by the closing price of the S&P. This means if a stock moves up and the S&P moves down or the stock moves up more than the S&P the RS line will increase, if the stock moves down while the S&P moves up the line will decrease.
While the RS Line by itself is a powerful tool, adding moving averages to the RS line can help better understand trends. This work was done by Mike Webster (Webby) as he tried to reverse engineer how William O'Neil was able to hold some of his biggest winning positions.
This indicator plots the RS line along with two moving averages and clearly labels and alerts the 3 signals shared by Webby:
Quick Break - RS line crosses below the fast moving average
Quicksand - RS line moves lower than it was at the time of the Quick Break
Grateful Dead Break - RS line crosses below the slow moving average
To ensure your chart doesn't get skewed, please use the multiplier in the setting to adjust the vertical offset of the RS line and moving averages.

Price Strength Index + RSI Buy/Sell ZonesThe Price Strength Index + RSI Buy/Sell Zones indicator is a technical analysis tool designed to evaluate the strength of a financial asset's price movement by comparing it with a series of Volume Weighted Moving Averages (VWMAs) of different lengths calculated from historical data.
Hypothesis :
The core hypothesis behind this indicator is that assessing the relationship between the current price and a range of VWMAs with varying lengths can provide valuable insights into the strength and direction of a price trend. Additionally, it incorporates Relative Strength Index (RSI) conditions to further refine potential buy and sell signals.
How It Works :
Multiple VWMA Calculation: The indicator calculates multiple VWMAs, each with a different length, using historical price data and volume. These VWMAs represent weighted moving averages over various periods, helping to capture different aspects of the price trend.
Comparison with Current Price : For each of these VWMAs, the indicator compares the current bar's price with the VWMA value. This comparison is crucial in understanding how the current price relates to historical averages, shedding light on the strength and direction of the prevailing trend.
SMA of Percentage Above VWMA : The indicator calculates the Simple Moving Average (SMA) of the percentage of prices above the various VWMAs over a specified period. This moving average smoothens out the percentage data, providing a clearer trend signal.
Buy and Sell Zones : User-defined upper and lower thresholds for the percentage of prices above the VWMAs are used to define buy and sell zones. When the percentage falls below the lower threshold, it signals a potential buy zone, suggesting a weakening trend. Conversely, when it exceeds the upper threshold, it signifies a potential sell zone, indicating a strengthening trend.
RSI Integration : The RSI is calculated for the selected price source with a specified length. When the SMA of the percentage above VWMAs falls within the buy zone and the RSI is below the lower RSI threshold, it indicates an oversold condition, potentially signaling a buy opportunity. Conversely, when the SMA falls within the sell zone and the RSI is above the upper RSI threshold, it suggests an overbought condition, possibly signaling a sell opportunity.
Color Coding : The indicator employs color-coding to visually represent the buy and sell zones, as well as extreme RSI conditions. Green color denotes the buy zone, red represents the sell zone, and orange lines indicate the median and potential reversal points.
In summary, the Price Strength Index + RSI Buy/Sell Zones indicator leverages multiple VWMAs of different lengths to assess the relationship between current prices and historical moving averages. This comprehensive analysis, coupled with RSI conditions, aids traders in identifying potential buy and sell zones, as well as extreme RSI points within those zones, enhancing the evaluation of price strength and potential trend reversals.

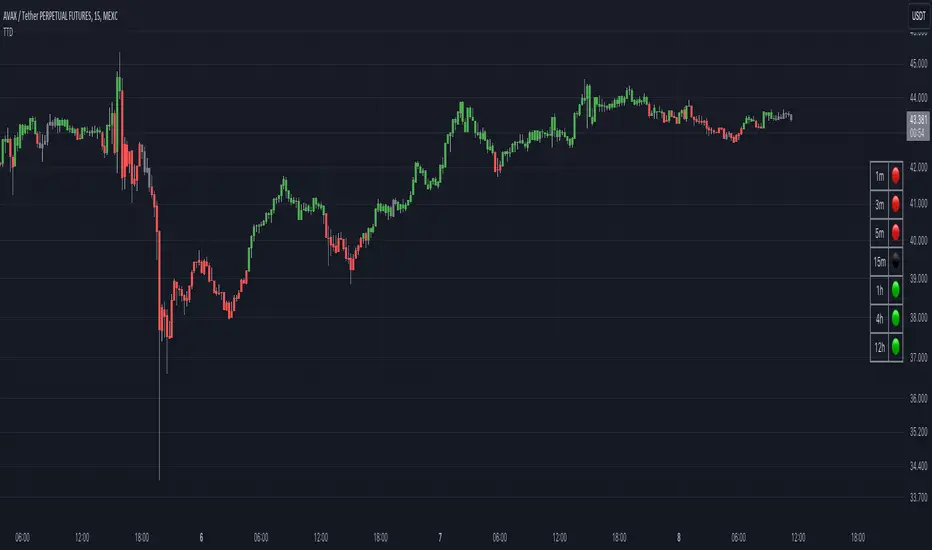
Traders Trend DashboardThe Traders Trend Dashboard (TTD) is a comprehensive trend analysis tool designed to assist traders in making informed trading decisions across various markets and timeframes. Unlike conventional trend-following scripts, TTD goes beyond simple trend detection by incorporating a unique combination of moving averages and a visual dashboard, providing traders with a clear and actionable overview of market trends. Here's how TTD stands out from the crowd:
Originality and Uniqueness:
TTD doesn't rely on just one moving average crossover to detect trends. Instead, it employs a dynamic approach by comparing two moving averages of distinct periods across multiple timeframes. This innovative methodology enhances trend detection accuracy and reduces false signals commonly associated with single moving average systems.
Market Applicability:
TTD is versatile and adaptable to various financial markets, including forex, stocks, cryptocurrencies, and commodities. Its flexibility ensures that traders can utilize it across different asset classes and capitalize on market opportunities.
Optimal Timeframe Utilization:
Unlike many trend indicators that work best on specific timeframes, TTD caters to traders with diverse trading preferences. It offers support for intraday trading (1m, 3m, 5m), short-term trading (15m, 30m, 1h), and swing trading (4h, D, W, M), making it suitable for a wide range of trading styles.
Underlying Conditions and Interpretation:
TTD is particularly effective during trending markets, where its multi-timeframe approach helps identify consistent trends across various time horizons. In ranging markets, TTD can indicate potential reversals or areas of uncertainty when moving averages converge or cross frequently.
How to Use TTD:
1. Timeframe Selection: Choose the relevant timeframes based on your trading style and preferences. Enable or disable timeframes in the settings to focus on the most relevant ones for your strategy.
2. Dashboard Interpretation: The TTD dashboard displays green (🟢) and red (🔴) symbols to indicate the relationship between two moving averages. A green symbol suggests that the shorter moving average is above the longer one, indicating a potential bullish trend. A red symbol suggests the opposite, indicating a potential bearish trend.
3. Confirmation and Strategy: Consider TTD signals as confirmation for your trading strategy. For instance, in an uptrend, look for long opportunities when the dashboard displays consistent green symbols. Conversely, in a downtrend, focus on short opportunities when red symbols dominate.
4. Risk Management: As with any indicator, use TTD in conjunction with proper risk management techniques. Avoid trading solely based on indicator signals; instead, integrate them into a comprehensive trading plan.
Conclusion:
The Traders Trend Dashboard (TTD) offers traders a powerful edge in trend analysis, combining innovation, versatility, and clarity. By understanding its unique methodology and integrating its signals with your trading strategy, you can make more informed trading decisions across various markets and timeframes. Elevate your trading with TTD and unlock a new level of trend analysis precision.
Normalized Adaptive Trend Lines [MAMA and FAMA]These indicators was originally developed by John F. Ehlers (Stocks & Commodities V. 19:10: MESA Adaptive Moving Averages). Everget wrote the initial functions for these in pine script. I have simply normalized the indicators and chosen to use the Laplace transformation instead of the hilbert transformation
How the Indicator Works:
The indicator employs a series of complex calculations, but we'll break it down into key steps to understand its functionality:
LaplaceTransform: Calculates the Laplace distribution for the given src input. The Laplace distribution is a continuous probability distribution, also known as the double exponential distribution. I use this because of the assymetrical return profile
MESA Period: The indicator calculates a MESA period, which represents the dominant cycle length in the price data. This period is continuously adjusted to adapt to market changes.
InPhase and Quadrature Components: The InPhase and Quadrature components are derived from the Hilbert Transform output. These components represent different aspects of the price's cyclical behavior.
Homodyne Discriminator: The Homodyne Discriminator is a phase-sensitive technique used to determine the phase and amplitude of a signal. It helps in detecting trend changes.
Alpha Calculation: Alpha represents the adaptive factor that adjusts the sensitivity of the indicator. It is based on the MESA period and the phase of the InPhase component. Alpha helps in dynamically adjusting the indicator's responsiveness to changes in market conditions.
MAMA and FAMA Calculation: The MAMA and FAMA values are calculated using the adaptive factor (alpha) and the input price data. These values are essentially adaptive moving averages that aim to capture the current trend more effectively than traditional moving averages.
But Omar, why would anyone want to use this?
The MAMA and FAMA lines offer benefits:
The indicator offers a distinct advantage over conventional moving averages due to its adaptive nature, which allows it to adjust to changing market conditions. This adaptability ensures that investors can stay on the right side of the trend, as the indicator becomes more responsive during trending periods and less sensitive in choppy or sideways markets.
One of the key strengths of this indicator lies in its ability to identify trends effectively by combining the MESA and MAMA techniques. By doing so, it efficiently filters out market noise, making it highly valuable for trend-following strategies. Investors can rely on this feature to gain clearer insights into the prevailing trends and make well-informed trading decisions.
This indicator is primarily suppoest to be used on the big timeframes to see which trend is prevailing, however I am not against someone using it on a timeframe below the 1D, just be careful if you are using this for modern portfolio theory, this is not suppoest to be a mid-term component, but rather a long term component that works well with proper use of detrended fluctuation analysis.
Dont hesitate to ask me if you have any questions
Again, I want to give credit to Everget and ChartPrime!

Multi-Band Breakout IndicatorThe Multi-Band Breakout Indicator was created to help identify potential breakout opportunities in the market. It combines multiple bands (ATR-Based and Donchian) and moving averages to provide valuable insights into the underlying trend and potential breakouts. By understanding the calculations, interpretation, parameter adjustments, potential applications, and limitations of the indicator, traders can effectively incorporate it into their trading strategy.
Calculation:
The indicator utilizes several calculations to plot the bands and moving averages. The length parameter determines the period used for the Average True Range (ATR), which measures volatility. A higher length captures a longer-term view of price movement, while a lower length focuses on shorter-term volatility. The multiplier parameter adjusts the distance of the upper and lower bands from the ATR. A higher multiplier expands the bands, accommodating greater price volatility, while a lower multiplier tightens the bands, reflecting lower volatility. The MA Length parameter determines the period for the moving averages used to calculate the trend and trend moving average. A higher MA Length creates a smoother trend line, filtering out shorter-term fluctuations, while a lower MA Length provides a more sensitive trend line.
The Donchian calculations in the Multi-Band Breakout Indicator play a significant role in identifying potential breakout opportunities and providing additional confirmation for trading signals. In this indicator, the Donchian calculations are applied to the trend line, which represents the average of the upper and lower bands. To calculate the Donchian levels, the indicator uses the Donchian Length parameter, which determines the period over which the highest high and lowest low are calculated. A longer Donchian Length captures a broader price range, while a shorter length focuses on more recent price action. By incorporating the Donchian calculations into the Multi-Band Breakout Indicator, traders gain an additional layer of confirmation for breakout signals.
Interpretation:
The Multi-Band Breakout Indicator offers valuable interpretation for traders. The upper and lower bands represent dynamic levels of resistance and support, respectively. These bands reflect the potential price range within which the asset is expected to trade. The trend line is the average of these bands and provides a central reference point for the overall trend. When the price moves above the upper band, it suggests a potential overbought condition and a higher probability of a pullback. Conversely, when the price falls below the lower band, it indicates a potential oversold condition and an increased likelihood of a bounce. The trend moving average further smooths the trend line, making it easier to identify the prevailing direction.
The crossover of the trend line (representing the average of the upper and lower bands) and the trend moving average holds a significant benefit for traders. This crossover serves as a powerful signal for potential trend changes and breakout opportunities in the market. When the trend line crosses above the trend moving average, it suggests a shift in momentum towards the upside, indicating a potential bullish trend. This provides traders with an early indication of a possible upward movement in prices. Conversely, when the trend line crosses below the trend moving average, it indicates a shift in momentum towards the downside, signaling a potential bearish trend. This crossover acts as an early warning for potential downward price movement. By identifying these crossovers, traders can capture the initial stages of a new trend, enabling them to enter trades at favorable entry points and potentially maximize their profit potential.
Breakout Signals:
For bullish breakouts, the indicator looks for a bullish crossover between the trend line and the trend moving average. This crossover suggests a shift in momentum towards the upside. Additionally, it checks if the current price has broken above the upper band and the previous Donchian high. This confirms that the price is surpassing a previous resistance level, indicating further upward movement.
For bearish breakouts, the indicator looks for a bearish crossunder between the trend line and the trend moving average. This crossunder indicates a shift in momentum towards the downside. It also checks if the current price has broken below the lower band and the previous Donchian low. This confirms that the price is breaking through a previous support level, signaling potential downward movement.
When a bullish or bearish breakout is detected, it suggests a potential trading opportunity. Traders may consider initiating positions in the direction of the breakout, anticipating further price movement in that direction. However, it's important to remember that breakouts alone do not guarantee a successful trade. Other factors, such as market conditions, volume, and confirmation from additional indicators, should be taken into account. Risk management techniques should also be implemented to manage potential losses.
Coloration:
The coloration in the Multi-Band Breakout Indicator is used to visually represent different aspects of the indicator and provide valuable insights to traders. Let's break down the coloration components:
-- Trend/Basis Color : The tColor variable determines the color of the bars based on the relationship between the trend line (trend) and the closing price (close), as well as the relationship between the trend line and the trend moving average (trendMA). If the trend line is above the closing price and the trend moving average is also above the closing price, the bars are colored fuchsia, indicating a potential bullish trend. If the trend line is below the closing price and the trend moving average is also below the closing price, the bars are colored lime, indicating a potential bearish trend. If neither of these conditions is met, the bars are colored yellow, representing a neutral or indecisive market condition.
-- Moving Average Color : The maColor variable determines the color of the filled area between the trend line and the trend moving average. If the trend line is above the trend moving average, the area is filled with a lime color with 70% opacity, indicating a potential bullish trend. Conversely, if the trend line is below the trend moving average, the area is filled with a fuchsia color with 70% opacity, indicating a potential bearish trend. This coloration helps traders visually identify the relationship between the trend line and the trend moving average.
-- highColor and lowColor : The highColor and lowColor variables determine the colors of the high Donchian band (hhigh) and the low Donchian band (llow), respectively. These bands represent dynamic levels of resistance and support. If the highest point in the previous Donchian period (hhigh) is above the upper band, the highColor is set to olive with 90% opacity, indicating a potential resistance level. On the other hand, if the lowest point in the previous Donchian period (llow) is below the lower band, the lowColor is set to red with 90% opacity, suggesting a potential support level. These colorations help traders quickly identify important price levels and assess their significance in relation to the bands.
By incorporating coloration, the Multi-Band Breakout Indicator provides visual cues to traders, making it easier to interpret the relationships between various components and assisting in identifying potential trend changes and breakout opportunities. Traders can use these color cues to quickly assess the prevailing market conditions and make informed trading decisions.
Adjusting Parameters:
The Multi-Band Breakout Indicator offers flexibility through parameter adjustments. Traders can customize the indicator based on their preferences and trading style. The length parameter controls the sensitivity to price changes, with higher values capturing longer-term trends, while lower values focus on shorter-term price movements. By adjusting the parameters, such as the ATR length, multiplier, Donchian length, and MA length, traders can customize the indicator to suit different timeframes and trading strategies. For shorter timeframes, smaller values for these parameters may be more suitable, while longer timeframes may require larger values.
Potential Applications:
The Multi-Band Breakout Indicator can be applied in various trading strategies. It helps identify potential breakout opportunities, allowing traders to enter trades in the direction of the breakout. Traders can use the indicator to initiate trades when the price moves above the upper band or below the lower band, confirming a potential breakout and providing a signal to enter a trade. Additionally, the indicator can be combined with other technical analysis tools, such as support and resistance levels, candlestick patterns, or trend indicators, to increase the probability of successful trades. By incorporating the Multi-Band Breakout Indicator into their trading approach, traders can gain a better understanding of market trends and capture potential profit opportunities.
Limitations:
While the Multi-Band Breakout Indicator is a useful tool, it has some limitations that traders should consider. The indicator performs best in trending markets where price movements are relatively strong and sustained. During ranging or choppy market conditions, the indicator may generate false signals, leading to potential losses. It is crucial to use the indicator in conjunction with other analysis techniques and risk management strategies to enhance its effectiveness. Additionally, traders should consider external factors such as market news, economic events, and overall market sentiment when interpreting the signals generated by the indicator.
By combining multiple bands and moving averages, this indicator offers valuable insights into the underlying trend and helps traders make informed trading decisions. With customization options and careful interpretation, this indicator can be a valuable addition to any trader's toolkit, assisting in identifying potential breakouts, capturing profitable trades, and enhancing overall trading performance.

HK Percentile Interpolation One
This script is designed to execute a trading strategy based on Heikin Ashi candlesticks, moving averages, and percentile levels.
Please note that you should keep your original chart in normal candlestick mode and not switch it to Heikin Ashi mode. The script itself calculates Heikin Ashi values from regular candlesticks. If your chart is already in Heikin Ashi mode, the script would be calculating Heikin Ashi values based on Heikin Ashi values, which would produce incorrect results.
The strategy begins trading from a start date that you can specify by modifying the `startDate` parameter. The format of the date is "YYYY MM DD". So, for example, to start the strategy from January 1, 2022, you would set `startDate = timestamp("2022 01 01")`.
The script uses Heikin Ashi candlesticks, which are plotted in the chart. This approach can be useful for spotting trends and reversals more easily than with regular candlestick charts. This is particularly useful when backtesting in TradingView's "Rewind" mode, as you can see how the Heikin Ashi candles behaved at each step of the strategy.
Buy and sell signals are generated based on two factors:
1. The crossing over or under of the Heikin Ashi close price and the 75th percentile price level.
2. The Heikin Ashi close price being above certain moving averages.
You have the flexibility to adjust several parameters in the script, including:
1. The stop loss and trailing stop percentages (`stopLossPercentage` and `trailStopPercentage`). These parameters allow the strategy to exit trades if the price moves against you by a certain percentage.
2. The lookback period (`lookback`) used to calculate percentile levels. This determines the range of past bars used in the percentile calculation.
3. The lengths of the two moving averages (`yellowLine_length` and `purplLine_length`). These determine how sensitive the moving averages are to recent price changes.
4. The minimum holding period (`holdPeriod`). This sets the minimum number of bars that a trade must be kept open before it can be closed.
Please adjust these parameters according to your trading preferences and risk tolerance. Happy trading!

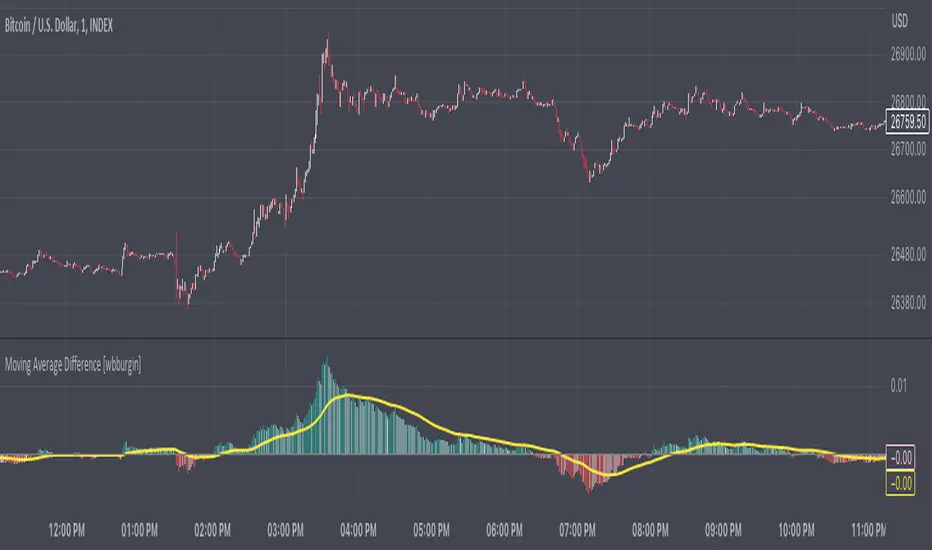
Recursive Moving Average DifferenceThe relative difference between a moving average and the price can be a useful tool for interpreting trend direction and identifying pullbacks or breakdowns. This indicator recursively finds all the relative moving average differences between two simple moving averages of your choosing and weighs them by their lengths. It then returns a value that represents the weighted average of all the moving average differences. This can represent the gradient of motion between moving averages, or the path of least resistance, which the price may revert to in certain situations.
For the settings: minimum MA represents the minimum simple moving average to consider for the total weighted average. Maximum MA represents the maximum simple moving average to consider. "Move By" is the increment that you want to move between these two moving averages.
A positive moving average difference indicates that the price is above the moving average difference (i.e. the weighted average of all moving average differences between your two selected moving averages). A negative moving average difference indicates that the price is below the moving average difference. I have added a signal with a configurable length input as well to smooth out trends.
You can configure colors and lengths, as well as the counting increment. Future updates may include different ways to calculate weights, perhaps on overlay or strategy.
MultiMovesCombines 3 different moving averages together with the linear regression. The moving averages are the HMA, EMA, and SMA. The script makes use of two different lengths to allow the end user to utilize common crossovers in order to determine entry into a trade. The edge of each "cloud" is where each of the moving averages actually are. The bar color is the average of the shorter length combined moving averages.
-The Hull Moving Average (HMA), developed by Alan Hull, is an extremely fast and smooth moving average. In fact, the HMA almost eliminates lag altogether and manages to improve smoothing at the same time. A longer period HMA may be used to identify trend.
-The exponential moving average (EMA) is a technical chart indicator that tracks the price of an investment (like a stock or commodity) over time. The EMA is a type of weighted moving average (WMA) that gives more weighting or importance to recent price data.
-A simple moving average (SMA) is an arithmetic moving average calculated by adding recent prices and then dividing that figure by the number of time periods in the calculation average.
-The Linear Regression Indicator plots the ending value of a Linear Regression Line for a specified number of bars; showing, statistically, where the price is expected to be. Instead of plotting an average of past price action, it is plotting where a Linear Regression Line would expect the price to be, making the Linear Regression Indicator more responsive than a moving average.
The lighter colors = default 50 MA
The darker colors = default 200 MA

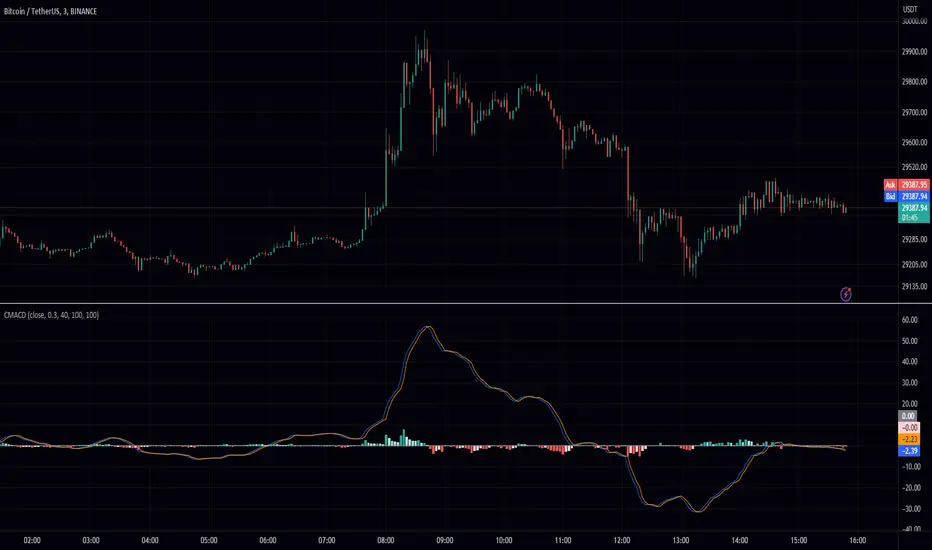
MACD Chebyshev (CMACD)Introducing the Advanced MACD Chebyshev Indicator
Enhanced Convergence Divergence with Gate Compressor for Improved Trading Signals
Introduction
We are excited to introduce a new, advanced Moving Average Convergence Divergence (MACD) indicator that we've developed, called the MACD Chebyshev (CMACD). This innovative indicator uses the dominant period to determine the frequency of the band pass and employs a delayed version of the signal for better convergence divergence. To further enhance the quality of the signals, we've incorporated a gate compressor in the histogram. In this blog post, we will provide an extensive overview of the CMACD indicator, detailing its features and explaining how it works.
The MACD Chebyshev Indicator
The CMACD indicator is based on the well-known MACD indicator, which is a popular technical analysis tool for identifying potential trend reversals in financial markets. The MACD indicator calculates the difference between two Exponential Moving Averages (EMAs) and plots a histogram to represent the convergence and divergence between these EMAs. The CMACD indicator builds on this concept by using the Chebyshev Type I and Type II Moving Averages, which offer superior smoothing and reduced lag compared to traditional EMAs.
The main components of the CMACD indicator are:
1. Signal Line (Blue Line)
2. Delay Line (Orange Line)
3. Histogram (Green and Red bars)
4. Zero Line (Gray Line)
The indicator calculates the difference between the two Chebyshev Moving Averages and plots the histogram based on this difference. The histogram bars change color depending on whether they are above or below the zero line and whether they are growing or falling.
Custom Functions and Features
The CMACD indicator includes several custom functions and features that set it apart from the standard MACD indicator:
1. Dominant Period: The CMACD indicator uses the dominant period to determine the frequency of the band pass. This ensures that the indicator is more responsive to the current market conditions, as it adapts to the dominant cycle in the price data.
2. Delayed Signal: The CMACD indicator employs a delayed version of the signal to provide better convergence divergence. This helps to reduce false signals and improve the accuracy of the indicator.
3. Ripple: The Ripple parameter allows users to adjust the smoothing factor of the Chebyshev Moving Averages. This can be customized to suit individual trading preferences and strategies.
4. Gate Compressor: The CMACD indicator incorporates a gate compressor in the histogram. This unique feature allows users to specify a Percent Rank for the gate signal level, a Gate Ratio, and a Knee Type (either "hard" or "soft"). The gate compressor works by reducing the amplitude of the histogram bars when their absolute value is below the specified threshold. This helps to filter out noise and improve the clarity of the signals generated by the indicator.
Color Scheme
The CMACD indicator features an intuitive color scheme for easy interpretation of the histogram:
1. Green Bars (Above Zero Line): The histogram bars are green when they are above the zero line. The darker green color indicates a growing bar, while the lighter green color represents a falling bar.
2. Red Bars (Below Zero Line): The histogram bars are red when they are below the zero line. The darker red color indicates a growing bar, while the lighter red color represents a falling bar.
Conclusion
The MACD Chebyshev (CMACD) indicator is an innovative and powerful tool for technical analysis, offering superior performance compared to the standard MACD indicator. With its advanced features, such as the dominant period, delayed signal, ripple adjustment, and gate compressor, the CMACD indicator provides more accurate and reliable trading signals. Incorporate the CMACD indicator into your trading strategy today and experience the enhanced convergence divergence for better trading decisions.
peacefulIndicatorsWe are delighted to present the PeacefulIndicators library, a modest yet powerful collection of custom technical indicators created to enhance your trading analysis. The library features an array of practical tools, including MACD with Dynamic Length, Stochastic RSI with ATR Stop Loss, Bollinger Bands with RSI Divergence, and more.
The PeacefulIndicators library offers the following functions:
macdDynamicLength: An adaptive version of the classic MACD indicator, which adjusts the lengths of the moving averages based on the dominant cycle period, providing a more responsive signal.
rsiDivergence: A unique implementation of RSI Divergence detection that identifies potential bullish and bearish divergences using a combination of RSI and linear regression.
trendReversalDetection: A helpful tool for detecting trend reversals using the Rate of Change (ROC) and Moving Averages, offering valuable insights into possible market shifts.
volume_flow_oscillator: A custom oscillator that combines price movement strength and volume to provide a unique perspective on market dynamics.
weighted_volatility_oscillator: Another custom oscillator that factors in price volatility and volume to deliver a comprehensive view of market fluctuations.
rvo: The Relative Volume Oscillator highlights changes in volume relative to historical averages, helping to identify potential breakouts or reversals.
acb: The Adaptive Channel Breakout indicator combines a moving average with an adjustable volatility multiplier to create dynamic channels, useful for identifying potential trend shifts.
We hope this library proves to be a valuable addition to your trading toolbox.
Library "peacefulIndicators"
A custom library of technical indicators for trading analysis, including MACD with Dynamic Length, Stochastic RSI with ATR Stop Loss, Bollinger Bands with RSI Divergence, and more.
macdDynamicLength(src, shortLen, longLen, signalLen, dynLow, dynHigh)
Moving Average Convergence Divergence with Dynamic Length
Parameters:
src (float) : Series to use
shortLen (int) : Shorter moving average length
longLen (int) : Longer moving average length
signalLen (int) : Signal line length
dynLow (int) : Lower bound for the dynamic length
dynHigh (int) : Upper bound for the dynamic length
Returns: tuple of MACD line and Signal line
Computes MACD using lengths adapted based on the dominant cycle period
rsiDivergence(src, rsiLen, divThreshold, linRegLength)
RSI Divergence Detection
Parameters:
src (float) : Series to use
rsiLen (simple int) : Length for RSI calculation
divThreshold (float) : Divergence threshold for RSI
linRegLength (int) : Length for linear regression calculation
Returns: tuple of RSI Divergence (positive, negative)
Computes RSI Divergence detection that identifies bullish (positive) and bearish (negative) divergences
trendReversalDetection(src, rocLength, maLength, maType)
Trend Reversal Detection (TRD)
Parameters:
src (float) : Series to use
rocLength (int) : Length for Rate of Change calculation
maLength (int) : Length for Moving Average calculation
maType (string) : Type of Moving Average to use (default: "sma")
Returns: A tuple containing trend reversal direction and the reversal point
Detects trend reversals using the Rate of Change (ROC) and Moving Averages.
volume_flow_oscillator(src, length)
Volume Flow Oscillator
Parameters:
src (float) : Series to use
length (int) : Period for the calculation
Returns: Custom Oscillator value
Computes the custom oscillator based on price movement strength and volume
weighted_volatility_oscillator(src, length)
Weighted Volatility Oscillator
Parameters:
src (float) : Series to use
length (int) : Period for the calculation
Returns: Custom Oscillator value
Computes the custom oscillator based on price volatility and volume
rvo(length)
Relative Volume Oscillator
Parameters:
length (int) : Period for the calculation
Returns: Custom Oscillator value
Computes the custom oscillator based on relative volume
acb(price_series, ma_length, vol_length, multiplier)
Adaptive Channel Breakout
Parameters:
price_series (float) : Price series to use
ma_length (int) : Period for the moving average calculation
vol_length (int) : Period for the volatility calculation
multiplier (float) : Multiplier for the volatility
Returns: Tuple containing the ACB upper and lower values and the trend direction (1 for uptrend, -1 for downtrend)

Supply and Demand Visible Range [LuxAlgo]The Supply and Demand Visible Range indicator displays areas & levels on the user's chart for the visible range using a novel volume-based method. The script also makes use of intra-bar data to create precise Supply & Demand zones.
🔶 SETTINGS
Threshold %: Percentage of the total visible range volume used as a threshold to set supply/demand areas. Higher values return wider areas.
Resolution: Determines the number of bins used to find each area. Higher values will return more precise results.
Intra-bar TF: Timeframe used to obtain intra-bar data.
🔶 USAGE
The supply/demand areas and levels displayed by the script are aimed at providing potential supports/resistances for users. The script's behavior makes it recalculate each time the visible chart interval/range changes, as such this script is more suited as a descriptive tool.
Price reaching a supply (upper) area that might have been tested a few times might be indicative of a potential reversal down, while price reaching a demand (lower) area that might have been tested a few times could be indicative of a potential reversal up.
The width of each area can also indicate which areas are more liquid, with thinner areas indicating more significant liquidity.
The user can control the width of each area using the Threshold % setting, with a higher setting returning wider areas. The precision setting can also return wider supply/demand areas if very low values are used and has the benefit of improving the script execution time at the cost of precision.
The Supply and Demand Zones indicator returns various levels. The solid-colored levels display the average of each area, while dashed colored lines display the weighted averages of each area. These weighted averages can highlight more liquid price levels within the supply/demand areas.
Central solid/dashed lines display the average between the areas' averages and weighted averages.
🔶 DETAILS
Each supply/demand area is constructed from volume data. The calculation is done as follows:
The accumulated volume within the chart visible range is calculated.
The chart visible range is divided into N bins of equal width (where N is the resolution setting)
Calculation start from the highest visible range price value for the supply area, and lowest value for the demand area.
The volume within each bin after the starting calculation level is accumulated, once this accumulated volume is equal or exceed the threshold value ( p % of the total visible range volume) the area is set.
Each bin volume accumulation within an area is displayed on the left, this can help indicate how fast volume accumulates within an area.
🔶 LIMITATIONS
The script execution time is dependent on all of the script's settings, using more demanding settings might return errors so make sure to be aware of the potential scenarios that might make the script exceed the allowed execution time:
Having a chart's visible range including a high number of bars.
Using a high number of bins (high resolution value) will increase computation time, this can be worsened by using a high threshold %.
Using very low intra-bar timeframe can drastically increase computation time but can also simply throw an error if the chart timeframe is high.
Users facing issues can lower the resolution value or use the chart timeframe for intra-bar data.

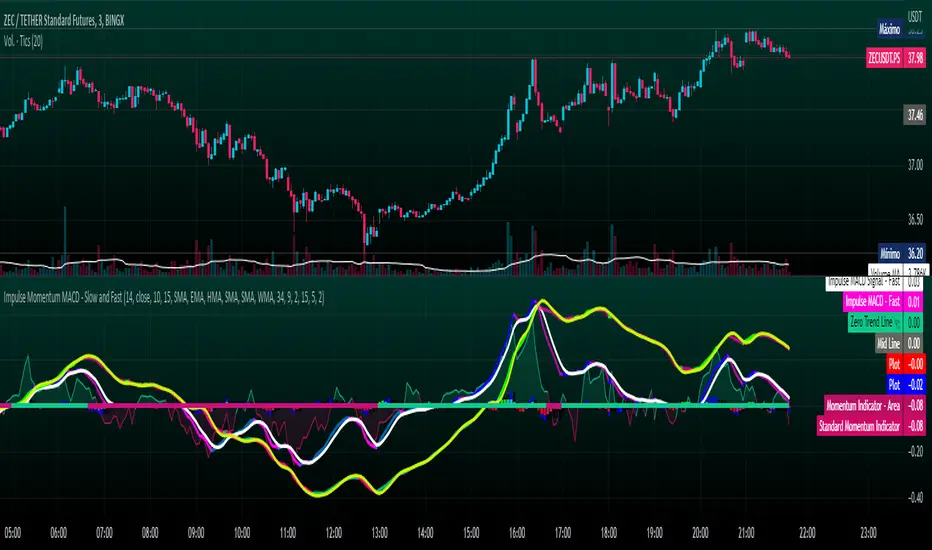
Impulse Momentum MACD - Slow and FastImpulse Momentum MACD - Slow and Fast
The Momentum indicator is a technical indicator that measures the speed and strength of the price movement of a financial asset. This indicator is used to identify the underlying strength of a trend and predict potential changes in price direction, when the indicator crosses the zero line, it can signal a change of direction in the price trend.
On the other hand, the MACD is an indicator used to identify the trend and strength of the market and shows the difference between two exponential moving averages ( EMA ) of different periods. The MACD is commonly used to determine the direction of an asset's price trend.
COPOSITION AND USE OF THE INDICATOR
This script is an implementation of the Impulse Momentum MACD indicator with two variations: slow and fast. It uses a combination of the Momentum indicator and the Moving Average Convergence/Divergence (MACD) indicator to identify trend reversals and momentum changes in an asset's price.
The combination of both indicators can help traders identify market entry and exit opportunities. The Impulse Momentum MACD is a Modified MACD, it is formed by filtering the values in a range of Modifiable Moving Averages by calculating their high and low ranges,This indicator has two parts: a slow part and a fast part. The slow part uses input values for the lengths of the moving averages and the length of the signal for the MACD indicator. The fast part uses different input values for the lengths of the moving averages. Also, each part has its own set of line colors and histogram colors for easy visualization.
The script also includes inputs to choose the type of moving average to use (SMA, EMA, etc.), the lookback period, the colors for the histogram lines and bars, and a zero trend line (also known as a horizontal trend line). ).
* Highest performing custom settings for the zero trend line. For Operations of:
- One Minute: Trend Line Time Frame = Five Minutes.
- Three Minutes: Trend Line Time Frame = Fifteen Minutes.
- Five Minutes: Trend Line Time Frame = Thirty Minutes.
- Fifteen Minutes: Trend Line Time Frame = Sixty Minutes.
Rules For Trading
🔹 Bullish:
* The Zero Horizontal Trend Line should be in Green Color.
* The Slow Histogram Bar should be in Green Color.
* The Fast Histogram Bar must be in Blue or Black Color or No Bar Appears.
* The Momentum Line or Momentum Area must be in Green Color.
crosses:
- When the Impulse Momentum MACD Slow line crosses the Impulse Momentum MACD Slow signal line upwards.
- When the Impulse Momentum MACD Fast line crosses the Impulse Momentum MACD Fast signal line upwards.
- Note 1: A Position is Opened when the condition of any of the aforementioned crossovers is met.
- Note 2: If the two aforementioned crossings anticipate the condition of the Zero Horizontal Tendency Line because it is in Red; A position is only opened immediately when the Zero Horizontal Trend line turns Green.
🔹 Bearish:
* The Zero Horizontal Trend Line should be in Red Color.
* The Slow Histogram Bar should be in Red Color.
* The Fast Histogram Bar must be in Blue or Black Color or No Bar Appears.
* The Momentum Line or Momentum Area must be in Red Color.
crosses:
- When the Impulse Momentum MACD Slow line crosses the Impulse Momentum MACD Slow signal line downwards.
- When the Impulse Momentum MACD Fast line crosses the Impulse Momentum MACD Fast signal line downwards.
- Note 1: A Position is Opened when the condition of any of the aforementioned crossovers is met.
- Note 2: If the two aforementioned crossings anticipate the condition of the Zero Horizontal Tendency Line because it is Green, an immediate position is only opened when the Zero Horizontal Tendency line turns Red.
This script can be used in different markets such as forex, indices and cryptocurrencies for analysis and trading. However, it is important to note that no trading strategy is guaranteed to be profitable, and traders should always conduct their own research and risk management.
Stochastic MACD - Slow and FastStochastic MACD - Slow and Fast
The "Stochastic MACD - Slow and Fast" indicator combines two popular technical indicators, the Stochastic Oscillator and the Moving Average Convergence Divergence ( MACD ).
The Stochastic Oscillator is a momentum indicator that measures the current closing position of an asset relative to its recent price range. This indicator helps traders identify possible turning points in an asset's trend, it is used to identify if the market is overbought or oversold.
On the other hand, the MACD is an indicator used to identify the trend and strength of the market and shows the difference between two exponential moving averages ( EMA ) of different periods. The MACD is commonly used to determine the direction of an asset's price trend.
The combination of both indicators can help traders identify market entry and exit opportunities. This indicator has two parts: a slow part and a fast part. The slow part uses input values for the lengths of the moving averages and the length of the signal for the MACD indicator. The fast part uses different input values for the lengths of the moving averages. Also, each part has its own set of line colors and histogram colors for easy visualization.
In general, the "Stochastic MACD - Slow and Fast" indicator is used to identify possible turning points in the trend of an asset. Traders can use the indicator to determine when to enter or exit a position based on the signals generated by the indicator. The stochastic MACD is a variation of the regular MACD that incorporates a stochastic oscillator to provide additional signals.
In summary, this indicator can be useful for those looking for a combination of two popular indicators to help identify trading opportunities.
In addition, parameters were defined to activate or deactivate the graphic signal.
When the Stochastic MACD Slow Line Crosses the Stochastic MACD Slow Signal Line:
Long or Buy = ↑ // The Entry is more Effective if it is made when the signal is below the Zero Trend Line .
Short or Sell = ↓ // The Entry is more Effective if it is made when the signal is above the Zero Trend Line .
When the Fast Stochastic MACD Line Crosses the Slow Stochastic MACD Line:
Long or Buy = ▲ // The Entry is more Effective if it is made when the signal is below the Zero Trend Line .
Short or Sell = ▼ // The Entry is more Effective if it is made when the signal is above the Zero Trend Line .
Taking into account the above, alerts were also defined for possible Purchases or Sales or entries in Long or Short.
COPOSITION AND USE OF THE INDICATOR
This script is an implementation of the Stochastic MACD indicator with two variations - Slow and Fast. It uses a combination of the Stochastic Oscillator and the Moving Average Convergence Divergence (MACD) indicator to identify trend reversals and momentum shifts in the price of an asset.
The Slow version of the Stochastic MACD is built using three inputs - fastLength, slowLength, and signalLength. The fastLength and slowLength are used to calculate two exponential moving averages (EMAs), while the signalLength is used to calculate a signal line as an EMA of the difference between the two EMAs. The Stochastic Oscillator is then applied to the difference between the two EMAs, and the resulting values are plotted on the chart.
The Fast version of the Stochastic MACD is built using the same inputs as the Slow version, but with different values. It uses a shorter fastLength value and a longer slowLength value to generate the two EMAs, and the resulting values are plotted on the chart.
The script also includes inputs for choosing the type of moving average to use (SMA, EMA, etc.), the source of price data (open, close, etc.), the lookback period, and the colors for the lines and histogram bars.
This script can be used in different markets such as forex, indices, and cryptocurrencies for analysis and trading. However, it is important to note that no trading strategy is guaranteed to be profitable, and traders should always conduct their own research and risk management.

ROC (Rate of Change) Refurbished▮ Introduction
The Rate of Change indicator (ROC) is a momentum oscillator.
It was first introduced in the early 1970s by the American technical analyst Welles Wilder.
It calculates the percentage change in price between periods.
ROC takes the current price and compares it to a price 'n' periods (user defined) ago.
The calculated value is then plotted and fluctuates above and below a Zero Line.
A technical analyst may use ROC for:
- trend identification;
- identifying overbought and oversold conditions.
Even though ROC is an oscillator, it is not bounded to a set range.
The reason for this is that there is no limit to how far a security can advance in price but of course there is a limit to how far it can decline.
If price goes to $0, then it obviously will not decline any further.
Because of this, ROC can sometimes appear to be unbalanced.
(TradingView)
▮ Improvements
The following features were added:
1. Eight moving averages for the indicator;
2. Dynamic Zones;
3. Rules for coloring bars/candles.
▮ Motivation
Averages have been added to improve trend identification.
For finer tuning, you can choose the type of averages.
You can hide them if you don't need them.
The Dynamic Zones has been added to make it easier to identify overbought/oversold regions.
Unlike other oscillators like the RSI for example, the ROC does not have a predetermined range of oscillations.
Therefore, a fixed line that defines an overbought/oversold range becomes unfeasible.
It is in this matter that the Dynamic Zone helps.
It dynamically adjusts as the indicator oscillates.
▮ About Dynamic Zones
'Most indicators use a fixed zone for buy and sell signals.
Here's a concept based on zones that are responsive to the past levels of the indicator.'
The concept of Dynamic Zones was described by Leo Zamansky (Ph.D.) and David Stendahl, in the magazine of Stocks & Commodities V15:7 (306-310).
Basically, a statistical calculation is made to define the extreme levels, delimiting a possible overbought/oversold region.
Given user-defined probabilities, the percentile is calculated using the method of Nearest Rank.
It is calculated by taking the difference between the data point and the number of data points below it, then dividing by the total number of data points in the set.
The result is expressed as a percentage.
This provides a measure of how a particular value compares to other values in a data set, identifying outliers or values that are significantly higher or lower than the rest of the data.
▮ Thanks and Credits
- TradingView: for ROC and Moving Averages
- allanster: for Dynamic Zones

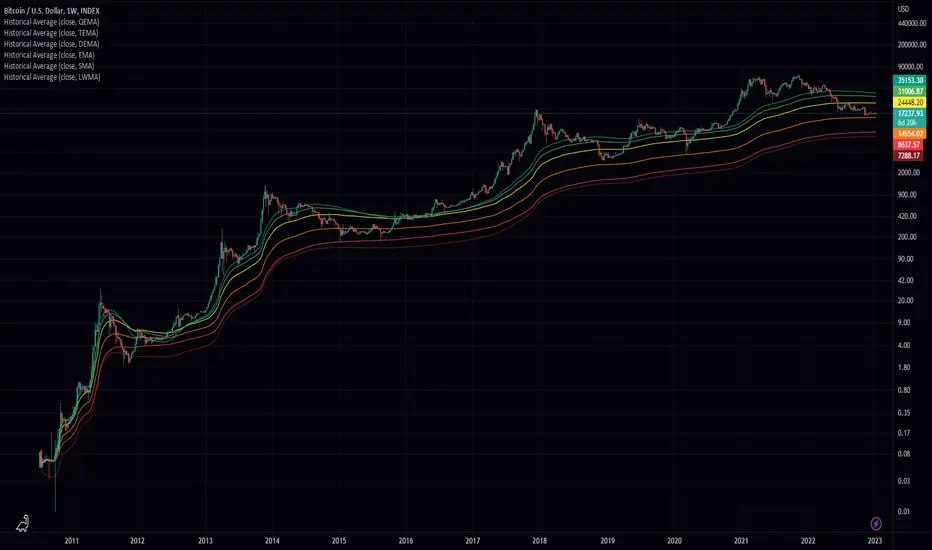
Historical AverageHistorical Average is a script written in the Pine Script language and is used to calculate various types of moving averages. Moving averages are statistical measures that smooth out data over time, making it easier to identify trends and patterns. This script allows the user to select from several different types of moving averages, including Simple Moving Average (SMA), Linear Weighted Moving Average (LWMA), Exponential Moving Average (EMA), Double Exponential Moving Average (DEMA), Triple Exponential Moving Average (TEMA), and Quadruple Exponential Moving Average (QEMA). The script also allows the user to specify a data source for the moving averages to be calculated from.
To use this script, the user simply needs to specify the data source and select the desired moving average type from the list. The script will then calculate and plot the selected moving average on the chart. This can be useful for traders and investors who want to gain a better understanding of the trends and patterns in the data they are analyzing.
Smoothed RSI Heikin Ashi Oscillator w/ Expanded Types [Loxx]Smoothed RSI Heikin-Ashi Oscillator w/ Expanded Types is a spin on Heikin Ashi RSI Oscillator by @JayRogers. The purpose of this modification is to reduce noise in the original version thereby increasing suitability of the signal output. This indicator is tuned for Forex markets.
Differences:
35+ Smoothing Options for RSI
35+ Smoothing Options for HA Candles
Heiken-Ashi Better Expanded Source input. This source input is use for the RSI calculation only.
Signals
Alerts
What are Heiken-Ashi "better" candles?
The "better formula" was proposed in an article/memo by BNP-Paribas (In Warrants & Zertifikate, No. 8, August 2004 (a monthly German magazine published by BNP Paribas, Frankfurt), there is an article by Sebastian Schmidt about further development (smoothing) of Heikin-Ashi chart.)
They proposed to use the following :
(Open+Close)/2+(((Close-Open)/( High-Low ))*ABS((Close-Open)/2))
instead of using :
haClose = (O+H+L+C)/4
According to that document the HA representation using their proposed formula is better than the traditional formula.
What are traditional Heiken-Ashi candles?
The Heikin-Ashi technique averages price data to create a Japanese candlestick chart that filters out market noise.
Heikin-Ashi charts, developed by Munehisa Homma in the 1700s, share some characteristics with standard candlestick charts but differ based on the values used to create each candle. Instead of using the open, high, low, and close like standard candlestick charts, the Heikin-Ashi technique uses a modified formula based on two-period averages. This gives the chart a smoother appearance, making it easier to spots trends and reversals, but also obscures gaps and some price data.
Future updates
Expand signal options to include RSI-, Zero-, and color-crosses

Adaptive Oscillator constructor [lastguru]Adaptive Oscillators use the same principle as Adaptive Moving Averages. This is an experiment to separate length generation from oscillators, offering multiple alternatives to be combined. Some of the combinations are widely known, some are not. Note that all Oscillators here are normalized to -1..1 range. This indicator is based on my previously published public libraries and also serve as a usage demonstration for them. I will try to expand the collection (suggestions are welcome), however it is not meant as an encyclopaedic resource , so you are encouraged to experiment yourself: by looking on the source code of this indicator, I am sure you will see how trivial it is to use the provided libraries and expand them with your own ideas and combinations. I give no recommendation on what settings to use, but if you find some useful setting, combination or application ideas (or bugs in my code), I would be happy to read about them in the comments section.
The indicator works in three stages: Prefiltering, Length Adaptation and Oscillators.
Prefiltering is a fast smoothing to get rid of high-frequency (2, 3 or 4 bar) noise.
Adaptation algorithms are roughly subdivided in two categories: classic Length Adaptations and Cycle Estimators (they are also implemented in separate libraries), all are selected in Adaptation dropdown. Length Adaptation used in the Adaptive Moving Averages and the Adaptive Oscillators try to follow price movements and accelerate/decelerate accordingly (usually quite rapidly with a huge range). Cycle Estimators, on the other hand, try to measure the cycle period of the current market, which does not reflect price movement or the rate of change (the rate of change may also differ depending on the cycle phase, but the cycle period itself usually changes slowly).
Chande (Price) - based on Chande's Dynamic Momentum Index (CDMI or DYMOI), which is dynamic RSI with this length
Chande (Volume) - a variant of Chande's algorithm, where volume is used instead of price
VIDYA - based on VIDYA algorithm. The period oscillates from the Lower Bound up (slow)
VIDYA-RS - based on Vitali Apirine's modification of VIDYA algorithm (he calls it Relative Strength Moving Average). The period oscillates from the Upper Bound down (fast)
Kaufman Efficiency Scaling - based on Efficiency Ratio calculation originally used in KAMA
Deviation Scaling - based on DSSS by John F. Ehlers
Median Average - based on Median Average Adaptive Filter by John F. Ehlers
Fractal Adaptation - based on FRAMA by John F. Ehlers
MESA MAMA Alpha - based on MESA Adaptive Moving Average by John F. Ehlers
MESA MAMA Cycle - based on MESA Adaptive Moving Average by John F. Ehlers , but unlike Alpha calculation, this adaptation estimates cycle period
Pearson Autocorrelation* - based on Pearson Autocorrelation Periodogram by John F. Ehlers
DFT Cycle* - based on Discrete Fourier Transform Spectrum estimator by John F. Ehlers
Phase Accumulation* - based on Dominant Cycle from Phase Accumulation by John F. Ehlers
Length Adaptation usually take two parameters: Bound From (lower bound) and To (upper bound). These are the limits for Adaptation values. Note that the Cycle Estimators marked with asterisks(*) are very computationally intensive, so the bounds should not be set much higher than 50, otherwise you may receive a timeout error (also, it does not seem to be a useful thing to do, but you may correct me if I'm wrong).
The Cycle Estimators marked with asterisks(*) also have 3 checkboxes: HP (Highpass Filter), SS (Super Smoother) and HW (Hann Window). These enable or disable their internal prefilters, which are recommended by their author - John F. Ehlers . I do not know, which combination works best, so you can experiment.
Chande's Adaptations also have 3 additional parameters: SD Length (lookback length of Standard deviation), Smooth (smoothing length of Standard deviation) and Power ( exponent of the length adaptation - lower is smaller variation). These are internal tweaks for the calculation.
Oscillators section offer you a choice of Oscillator algorithms:
Stochastic - Stochastic
Super Smooth Stochastic - Super Smooth Stochastic (part of MESA Stochastic) by John F. Ehlers
CMO - Chande Momentum Oscillator
RSI - Relative Strength Index
Volume-scaled RSI - my own version of RSI. It scales price movements by the proportion of RMS of volume
Momentum RSI - RSI of price momentum
Rocket RSI - inspired by RocketRSI by John F. Ehlers (not an exact implementation)
MFI - Money Flow Index
LRSI - Laguerre RSI by John F. Ehlers
LRSI with Fractal Energy - a combo oscillator that uses Fractal Energy to tune LRSI gamma
Fractal Energy - Fractal Energy or Choppiness Index by E. W. Dreiss
Efficiency ratio - based on Kaufman Adaptive Moving Average calculation
DMI - Directional Movement Index (only ADX is drawn)
Fast DMI - same as DMI, but without secondary smoothing
If no Adaptation is selected (None option), you can set Length directly. If an Adaptation is selected, then Cycle multiplier can be set.
Before an Oscillator, a High Pass filter may be executed to remove cyclic components longer than the provided Highpass Length (no High Pass filter, if Highpass Length = 0). Both before and after the Oscillator a Moving Average can be applied. The following Moving Averages are included: SMA, RMA, EMA, HMA , VWMA, 2-pole Super Smoother, 3-pole Super Smoother, Filt11, Triangle Window, Hamming Window, Hann Window, Lowpass, DSSS. For more details on these Moving Averages, you can check my other Adaptive Constructor indicator:
The Oscillator output may be renormalized and postprocessed with the following Normalization algorithms:
Stochastic - Stochastic
Super Smooth Stochastic - Super Smooth Stochastic (part of MESA Stochastic) by John F. Ehlers
Inverse Fisher Transform - Inverse Fisher Transform
Noise Elimination Technology - a simplified Kendall correlation algorithm "Noise Elimination Technology" by John F. Ehlers
Except for Inverse Fisher Transform, all Normalization algorithms can have Length parameter. If it is not specified (set to 0), then the calculated Oscillator length is used.
More information on the algorithms is given in the code for the libraries used. I am also very grateful to other TradingView community members (they are also mentioned in the library code) without whom this script would not have been possible.

Adaptive MA constructor [lastguru]Adaptive Moving Averages are nothing new, however most of them use EMA as their MA of choice once the preferred smoothing length is determined. I have decided to make an experiment and separate length generation from smoothing, offering multiple alternatives to be combined. Some of the combinations are widely known, some are not. This indicator is based on my previously published public libraries and also serve as a usage demonstration for them. I will try to expand the collection (suggestions are welcome), however it is not meant as an encyclopaedic resource, so you are encouraged to experiment yourself: by looking on the source code of this indicator, I am sure you will see how trivial it is to use the provided libraries and expand them with your own ideas and combinations. I give no recommendation on what settings to use, but if you find some useful setting, combination or application ideas (or bugs in my code), I would be happy to read about them in the comments section.
The indicator works in three stages: Prefiltering, Length Adaptation and Moving Averages.
Prefiltering is a fast smoothing to get rid of high-frequency (2, 3 or 4 bar) noise.
Adaptation algorithms are roughly subdivided in two categories: classic Length Adaptations and Cycle Estimators (they are also implemented in separate libraries), all are selected in Adaptation dropdown. Length Adaptation used in the Adaptive Moving Averages and the Adaptive Oscillators try to follow price movements and accelerate/decelerate accordingly (usually quite rapidly with a huge range). Cycle Estimators, on the other hand, try to measure the cycle period of the current market, which does not reflect price movement or the rate of change (the rate of change may also differ depending on the cycle phase, but the cycle period itself usually changes slowly).
Chande (Price) - based on Chande's Dynamic Momentum Index (CDMI or DYMOI), which is dynamic RSI with this length
Chande (Volume) - a variant of Chande's algorithm, where volume is used instead of price
VIDYA - based on VIDYA algorithm. The period oscillates from the Lower Bound up (slow)
VIDYA-RS - based on Vitali Apirine's modification of VIDYA algorithm (he calls it Relative Strength Moving Average). The period oscillates from the Upper Bound down (fast)
Kaufman Efficiency Scaling - based on Efficiency Ratio calculation originally used in KAMA
Deviation Scaling - based on DSSS by John F. Ehlers
Median Average - based on Median Average Adaptive Filter by John F. Ehlers
Fractal Adaptation - based on FRAMA by John F. Ehlers
MESA MAMA Alpha - based on MESA Adaptive Moving Average by John F. Ehlers
MESA MAMA Cycle - based on MESA Adaptive Moving Average by John F. Ehlers, but unlike Alpha calculation, this adaptation estimates cycle period
Pearson Autocorrelation* - based on Pearson Autocorrelation Periodogram by John F. Ehlers
DFT Cycle* - based on Discrete Fourier Transform Spectrum estimator by John F. Ehlers
Phase Accumulation* - based on Dominant Cycle from Phase Accumulation by John F. Ehlers
Length Adaptation usually take two parameters: Bound From (lower bound) and To (upper bound). These are the limits for Adaptation values. Note that the Cycle Estimators marked with asterisks(*) are very computationally intensive, so the bounds should not be set much higher than 50, otherwise you may receive a timeout error (also, it does not seem to be a useful thing to do, but you may correct me if I'm wrong).
The Cycle Estimators marked with asterisks(*) also have 3 checkboxes: HP (Highpass Filter), SS (Super Smoother) and HW (Hann Window). These enable or disable their internal prefilters, which are recommended by their author - John F. Ehlers. I do not know, which combination works best, so you can experiment.
Chande's Adaptations also have 3 additional parameters: SD Length (lookback length of Standard deviation), Smooth (smoothing length of Standard deviation) and Power (exponent of the length adaptation - lower is smaller variation). These are internal tweaks for the calculation.
Length Adaptaton section offer you a choice of Moving Average algorithms. Most of the Adaptations are originally used with EMA, so this is a good starting point for exploration.
SMA - Simple Moving Average
RMA - Running Moving Average
EMA - Exponential Moving Average
HMA - Hull Moving Average
VWMA - Volume Weighted Moving Average
2-pole Super Smoother - 2-pole Super Smoother by John F. Ehlers
3-pole Super Smoother - 3-pole Super Smoother by John F. Ehlers
Filt11 -a variant of 2-pole Super Smoother with error averaging for zero-lag response by John F. Ehlers
Triangle Window - Triangle Window Filter by John F. Ehlers
Hamming Window - Hamming Window Filter by John F. Ehlers
Hann Window - Hann Window Filter by John F. Ehlers
Lowpass - removes cyclic components shorter than length (Price - Highpass)
DSSS - Derivation Scaled Super Smoother by John F. Ehlers
There are two Moving Averages that are drown on the chart, so length for both needs to be selected. If no Adaptation is selected ( None option), you can set Fast Length and Slow Length directly. If an Adaptation is selected, then Cycle multiplier can be selected for Fast and Slow MA.
More information on the algorithms is given in the code for the libraries used. I am also very grateful to other TradingView community members (they are also mentioned in the library code) without whom this script would not have been possible.

Adaptive Ehlers Deviation Scaled Moving Average (AEDSMA)AEDSMA INTRODUCTION
This indicator is a functional enhancement to “Ehlers Deviation Scaled Moving Average (EDSMA / DSMA)”. I’ve used Volume Breakout and Volatility for dynamic length adaption and further Slope too for trend evaluation.
EDSMA was originally developed by John F. Ehlers (Stocks & Commodities V. 36:8: The Deviation-Scaled Moving Average).
IDEA PLACEMENT
I’ve traded almost every kind of market with different volatility conditions using Moving Averages. It was too much of a hassle to select and use different MA length depending upon market trend. So, the journey started with adapting Moving Averages with another parameter and that’s how “MZ SAMA ” came into being where Slope was used to adapt Adaptive Moving Average with trend change. The problem was still pretty much the same as SAMA might not be effective on every market condition. Hence, I worked on Volume to adapt Moving Averages accordingly. I cane up with “MZ RVSI ” which I used in “MZ DVAMA ” to adapt dynamic length in Adaptive Moving Average and also used “MZ RVSI " alongside Slope as confirmation of trend changes.
Meanwhile, I started using DVAMA methodology on different types on Moving Averages that allow dynamic length for example Hull Moving Average, Linear Regression Curve, SMA, WMA, TMA and many more. All of my tested Mas showed too much flexibility because of volume based Adaptive length.
I came across a script of “Adaptive Hull Moving Average” which pretty much used the similar methodology as DVAMA but when I looked into its depth, its volume oscillator wasn’t working at all and only volatility based dynamic length was used. It was an interesting idea so, I decided to use Volume and Volatility alongside for better results but was nearly impossible to achieve what I wanted using only Hull Moving Average.
I had been using EDSMA in “MA MTF Cross Strategy” and “MZ SRSI Strategy V1.0” previously. It was the perfect choice when comparing to usage of slope on it. DSMA works perfectly as support and resistance as its Deviation Scaled. So, I tried using it to adapt dynamic length based on Volume and Volatility and I wasn’t disappointed. It worked like a charm when I adapted dynamic length between 50 and 255.
DYNAMIC LENGTH BENEFITS
Dynamic length adaption methodology works in a way of adapting Relatively Lower Length leading toward overfitting if trend is supported by Volume and Volatility . Similarly, adapting Relatively Higher Length leading toward underfitting if trend isn’t supported by Volume and Volatility .
Dynamic length adaption makes Moving Average to work better for both Bull and Bear-runs avoiding almost every fake break-in and breakouts. Hence, adaptive MA becomes more reliable for breakout trading.
MA would be more useful as it would adapt almost every chart based on its Volume and Volatility data.
DYNAMIC COLORS AND TREND CORRELATION
I’ve used dynamic coloring to identify trends with more detail which are as follows:
Lime Color: Strong Uptrend supported by Volume and Volatility or whatever you’ve chosen from both of them.
Fuchsia Color: Weak uptrend only supported by Slope or whatever you’ve selected.
Red Color: Strong Downtrend supported by Volume and Volatility or whatever you’ve chosen from both of them.
Grey Color: Weak Downtrend only supported by Slope or whatever you’ve selected.
Yellow Color: Possible reversal indication by Slope if enabled. Market is either sideways, consolidating or showing choppiness during that period.
SIGNALS
Green Circle: Market good for long with support of Volume and Volatility or whatever you’ve chosen from both of them.
Red Circle: Market good to short with support from Volume and Volatility or whatever you’ve chosen from both of them.
Yellow Cross: Market either touched top or bottom ATR band and can act as good TP or SL.
EDSMA EVELOPE/BANDS: I’ve included ATR based bands to the Adaptive EDSMA which act as good support/resistance despite from main Adaptive EDSMA Curve.
DEFAULT SETTINGS
I’ve set default Minimum length to 50 and Maximum length to 255 which I’ve found works best for almost all timeframes but you can change this delta to adapt your timeframe accordingly with more precision.
Dynamic length adoption is enabled based on both Volume and Volatility but only one or none of them can also be selected.
Trend signals are enabled based on Slope and Volume but Volatility can be enabled for more precise confirmations.
In “ RVSI ” settings TFS Volume Oscillator is set to default but others work good too especially Volume Zone Oscillator. For more details about Volume Breakout you can check “MZ RVSI Indicator".
ATR breakout is set to be positive if period 14 exceeds period 46 but can be changed if more adaption with volatility is required.
EDSMA super smoother filter length is set to 20 which can be increased to 50 or more for better smoothing but this will also change slope results accordingly.
EDSMA super smoother filter poles are set to 2 because found better results with 2 instead of 3.
FURTHER ENHANCEMENTS
So far, I’ve seen better results with Volume Breakout and Volatility but other parameters such as Linear Slope of Particular MA, MACD, “MZ SRSI ”, a Conditional Uptrend MA or simply KDJ can also be used for dynamic length adaption.
I haven't yet gotten used to pine script arrays so, defining and using conditional operators is pretty much lazy programming for me. Would be great redefining everything through truth matrix instead of using if-else conditions.
