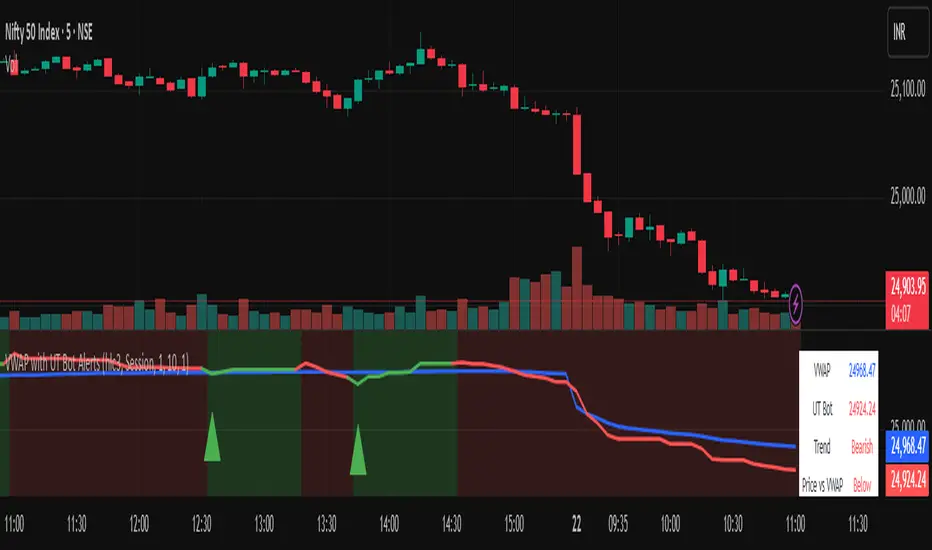
Vwapbot (VWAP + Ut Bot Alerts)Vwapbot (VWAP + Ut Bot Alerts) - Complete Guide
This Pine Script indicator combines two powerful trading tools: Volume Weighted Average Price (VWAP) and the UT Bot trend-following system. Here's a comprehensive breakdown:
What This Indicator Does
The indicator provides:
1. VWAP calculation with deviation bands
2. UT Bot trend signals with trailing stops
3. Combined confluence alerts when both indicators align
4. Visual information table showing current market conditions
Core Components
1. VWAP (Volume Weighted Average Price)
What it is: VWAP calculates the average price weighted by volume, giving more importance to high-volume periods.
Settings:
• VWAP Source: Price used for calculation (default: hlc3 - average of high, low, close)
• VWAP Anchor: Reset period (Session/Week/Month/Quarter/Year)
Usage:
• Price above VWAP = bullish bias
• Price below VWAP = bearish bias
• VWAP acts as dynamic support/resistance
2. VWAP Deviation Bands
What they show: Statistical boundaries around VWAP based on price volatility
Settings:
• Standard Deviation Multiplier: How far the bands extend (default: 1.0)
• Show Bands: Toggle visibility
Usage:
• Gray dashed lines: 1 standard deviation bands (normal price range)
• Red dotted lines: 2 standard deviation bands (extreme price levels)
• Price touching outer bands may indicate reversal opportunities
3. UT Bot (Ultimate Trend Bot)
What it does: Creates a trailing stop system that follows trends and signals reversals
Settings:
• Key Value: Sensitivity multiplier (1.0 = balanced, lower = more sensitive)
• ATR Period: Lookback period for volatility calculation (default: 10)
How it works:
• Uses ATR (Average True Range) to calculate dynamic support/resistance levels
• Green line = uptrend (trailing stop below price)
• Red line = downtrend (trailing stop above price)
4. UT Bot Alerts are integrated to the logic of Volume Profile i,e VWAP, the UT Bot Stop trailing line plot its data and change trends obtaining it's logic from the VWAP and Standard Deviation bands, thus it differs in it's logic of UT Bot alerts from other indicators.
Visual Elements
On-Chart Displays:
1. Blue line: VWAP
2. Gray lines: 1st deviation bands
3. Red lines: 2nd deviation bands
4. Green/Red thick line: UT Bot trailing stop
5. Green triangles up: Buy signals
6. Red triangles down: Sell signals
7. Background color: Light green (bullish) / Light red (bearish)
Information Table (Top Right):
• VWAP: Current VWAP value
• UT Bot: Current trailing stop level
• Trend: Bullish/Bearish status
• Price vs VWAP: Above/Below comparison
• Deviation: Percentage distance from VWAP
• Volume: Current bar volume
Trading Signals
Basic Signals:
1. UT Bot Buy: Green triangle when trend turns bullish
2. UT Bot Sell: Red triangle when trend turns bearish
3. VWAP Cross Above: Price crosses above VWAP
4. VWAP Cross Below: Price crosses below VWAP
Confluence Signals :
1. Bullish Confluence: UT Bot buy signal + Price above VWAP
2. Bearish Confluence: UT Bot sell signal + Price below VWAP
How to Use This Indicator
For Trend Following:
1. Enter long when you get a bullish confluence signal
2. Enter short when you get a bearish confluence signal
3. Exit when the UT Bot trend changes color
For Mean Reversion:
1. Look for reversals when price hits the 2nd deviation bands
2. Confirm with UT Bot signals
3. Target return to VWAP
For Support/Resistance:
1. Use VWAP as dynamic support in uptrends, resistance in downtrends
2. Watch for bounces at deviation bands
3. Confirm direction with UT Bot trend color
Best Practices
Timeframes:
• Intraday: Use Session VWAP anchor
• Swing trading: Use Weekly/Monthly anchors
• Position trading: Use Monthly/Quarterly anchors
Risk Management:
• Stop loss: Below/above the UT Bot trailing stop
• Position sizing: Smaller positions when price is at extreme deviation bands
• Confluence: Wait for both VWAP and UT Bot alignment for strongest signals
Market Conditions:
• Trending markets: Focus on UT Bot signals and VWAP direction bias
• Ranging markets: Use deviation bands for entry/exit points
• High volume periods: VWAP becomes more significant
Alert System
The indicator provides 6 types of alerts:
1. UT Bot buy/sell signals
2. VWAP crossover alerts
3. Confluence alerts (most important)
Set up alerts for confluence signals to catch the highest probability setups when both indicators align.
This indicator works best when combined with proper risk management and used in conjunction with market structure analysis. The confluence signals provide the highest probability entries, while the individual components help with market.
Advice from the publisher:
For using with Indices e.g NIFTY 50, BANKNIFTY etc. use parameters:
UT BOT Key Value : 1
UT BOT ATR Period : 10
Standard Deviation Multiplier : 1 {Default}
For using with commodities e.g NATURALGAS, CRUDEOIL etc. use parameters:
UT BOT Key Value : 2
UT BOT ATR Period : 7
Standard Deviation Multiplier : 1 {Default}
Cari skrip untuk "alert"
📱 EMA Stability Mobile + Pulse BG + Alerts (edegrano)User Manual: 📱 EMA Stability Mobile + Pulse BG + Alerts
Overview
This indicator monitors the stability of the market trend by analyzing the relative positions and gaps between the 50, 100, and 200 EMAs (Exponential Moving Averages) on a user-defined higher timeframe. It detects when the EMAs align bullishly or bearishly with a minimum gap tolerance and provides visual signals, background pulses, and alerts when such stable conditions start.
Key Features
Uses 3 EMAs (50, 100, 200) from a selectable timeframe.
Checks if EMAs are aligned in a stable bullish or bearish order with configurable minimum percentage gaps.
Confirms that price is not touching the EMA50 (to avoid instability).
Displays arrow, text status ("Bull", "Bear", or "Unst" for unstable).
Shows a strength score representing the average EMA gap relative to tolerance.
Pulses the chart background green or red when stability starts.
Sends alerts when a new bullish or bearish stability condition begins.
Displays a table summary at the top center of the chart.
Inputs
Parameter Description Default Value
EMA TF Timeframe to fetch EMA values from. "15" (15 min)
Min Gap (%) Minimum % gap required between EMAs for stability. 0.1%
Background Opacity Opacity level (0-100) for the pulse background color. 85
How It Works
The indicator fetches EMA50, EMA100, and EMA200 values from the chosen timeframe.
It calculates the percentage gap between EMA50 & EMA100 and EMA100 & EMA200.
It checks if:
For bullish stability: EMA50 > EMA100 by at least the tolerance and EMA100 > EMA200 by at least tolerance, AND current candle’s low is above EMA50.
For bearish stability: EMA50 < EMA100 by at least the tolerance and EMA100 < EMA200 by at least tolerance, AND current candle’s high is below EMA50.
When a stable bullish or bearish condition starts (i.e., it was not stable the previous bar), it triggers a pulse on the background and sends an alert.
The strength score reflects how strong the EMA gaps are relative to the minimum gap set.
A table displays key info: stability arrow, status, strength percentage, and gap percentages.
Visuals on Chart
Arrow:
▲ = Bullish Stability
▼ = Bearish Stability
• = Unstable (no stability detected)
Status Text: "Bull", "Bear", or "Unst"
Background Pulse: Green for bullish stability start, red for bearish stability start (fades based on opacity setting).
Table at top center shows:
EMA stability arrow and status
Strength score (%)
Percentage gaps between EMAs 50-100 and 100-200
Alerts
The indicator sends alerts when a new stable bullish or bearish trend begins.
Alert messages include:
📈 Bullish Stability detected on ( )
📉 Bearish Stability detected on ( )
Alerts are triggered only once per bar close on the condition's start.
Recommended Usage Tips
Adjust EMA TF to your preferred higher timeframe for trend confirmation.
Set Min Gap (%) depending on how strict you want the gap between EMAs for stability (smaller gap = more sensitive).
Use Background Opacity to make pulses subtle or prominent according to your preference.
Combine this indicator with price action or other tools for entry/exit timing.
Use alerts to be notified instantly when stable trends form.

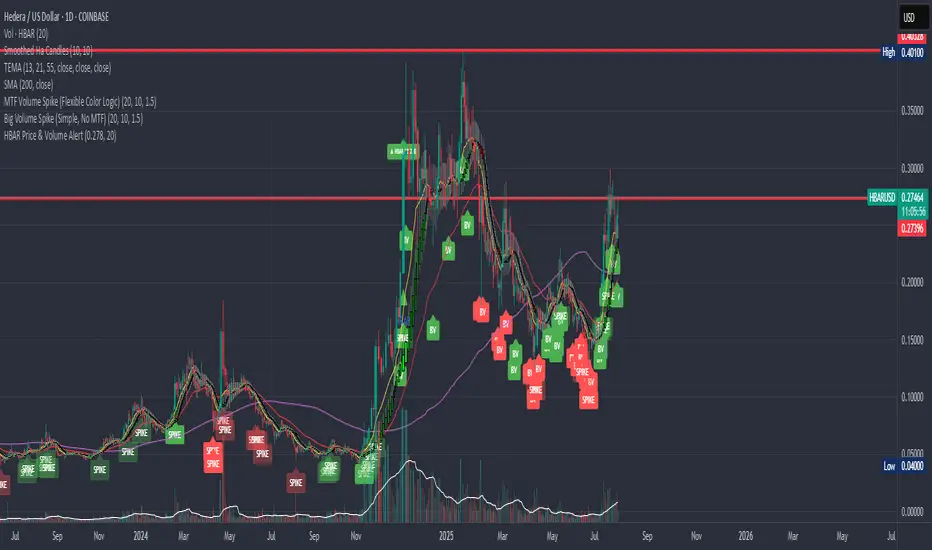
HBAR Price & Volume AlertThis indicator is designed for the COINBASE:HBARUSD chart. It continuously monitors price action and trading volume to alert you when a significant move happens:
Triggers an alert every time HBAR’s price crosses above a user-defined target price (default $0.27800, adjustable).
Alert only fires if the current volume is above the user-defined moving average of volume (default 20 bars, adjustable).
Visually marks every alert event on the chart with a triangle and an optional label showing the cross.
Includes a ready-to-use alertcondition for push notifications in TradingView.
All critical parameters (target price and volume MA length) are user-editable.
Use this indicator to catch price breakouts with strong volume confirmation—filtering out weak, low-volume moves. Alerts are continuous, not one-time, so you never miss an opportunity as long as conditions are met.
Dominance Candle Raja Saien (Detector with Alerts)Dominance Candle Finder with Alerts by Raja Saien
This powerful indicator is designed to detect dominance candles—those strong-bodied candles that often signify momentum and trend strength. Whether you're trading breakouts, trend continuations, or reversals, this tool helps you identify key market moves in real time with optional alerts.
🔍 Features:
Automatic Detection of Dominance Candles: Highlights candles with strong body size, showing decisive market movement.
Customizable Thresholds: Adjust sensitivity according to your strategy or asset volatility.
Built-in Alerts: Get notified the moment a dominance candle forms—no need to stare at charts all day!
Multi-Timeframe Compatibility: Works on any timeframe from 1-minute to daily or higher.
📊 Use Cases:
Entry confirmation on breakouts
Trend strength analysis
Volatility surge detection
Combine with support/resistance or order block zones for powerful setups
Tip: Best used with strong support/resistance levels or price action strategies for confluence

ds-Volume with Flags & Alerts v1.2ds-Volume with Flags & Alerts: User & Training Guide
1. Summary of Features
This indicator is a powerful, all-in-one tool designed to give you a deep and customizable view of market volume. By analyzing volume in multiple ways, it helps you spot unusual activity, confirm trends, and identify potential reversals.
How It Helps a Trader:
Spotting Institutional Activity: The core purpose of the Volume Flags (using either the Multiplier or Standard Deviation method) is to highlight bars with exceptionally high volume. These spikes often signal the entry or exit of large institutional players. A high-volume up-bar can confirm bullish conviction, while a high-volume down-bar can signal significant selling pressure.
Identifying Climactic Events: The HVE (Highest Volume Ever) and HV1 (Highest Volume - 1 Year) labels automatically pinpoint the most significant volume events on the chart. A "blow-off top" at the end of a long uptrend or a "capitulation" event at a market bottom is almost always accompanied by an HVE or HV1 bar. These are critical moments to watch for potential trend reversals.
Gauging Buying vs. Selling Pressure: The Up/Down Volume Ratio gives you a more nuanced view than volume alone. A ratio consistently above 1.2 suggests that buyers are more aggressive, while a ratio below 0.8 suggests sellers are in control. Watching this ratio can help you confirm the strength of a trend or spot divergences where price is rising but the ratio is falling (a potential warning sign).
Visual Confirmation & Customization: With options to color both the volume bars and the main price bars, you can get instant visual confirmation of these events without having to look away from the price action. The ability to toggle features on and off keeps your chart clean and focused on what matters most to you.
Actionable Alerts: The comprehensive alert system ensures you don't miss a key event. You can be notified of everything from a new all-time high volume bar to a subtle shift in the Up/Down Volume Ratio, allowing you to react to market changes in real-time.
2. User-Changeable Options
This indicator is highly customizable. Here is a breakdown of every setting available in the "Inputs" tab.
General Settings
MA Length: The lookback period for the simple moving average (the gray area plot) of the volume.
Volume Flags
Color Price Bars with Flags: If checked, the main price bars on your chart will be colored when a high or low volume flag condition is met.
Color Volume Bars with Flags: If checked, the volume bars in the indicator pane will be colored for flag conditions.
Flag Calculation Method: This is a crucial setting.
Multiplier (Default): Identifies high volume based on a simple multiple of the average volume (e.g., volume is 1.4x its average). It's simple and intuitive.
Standard Deviation: Identifies high volume based on how statistically unusual it is compared to its recent behavior. This method is more adaptive to changing market volatility.
Daily/Weekly Lookback (Multiplier): Sets the lookback period for calculating the average volume when using the "Multiplier" method.
Daily/Weekly High-Vol Multiplier: Sets the multiplier for a high volume event (e.g., 1.4).
STDEV Length (Daily/Weekly): Sets the lookback period for calculating the average and standard deviation when using the "Standard Deviation" method.
STDEV Threshold (Daily/Weekly): Sets the number of standard deviations above the average required to trigger a high volume flag (e.g., 2.0).
Daily/Weekly Low-Vol Multiplier: Sets the threshold for a low volume event (e.g., 0.5 means volume is less than 50% of its average). This is always based on the multiplier method.
Ratios & Stats
Up/Down Ratio Daily/Weekly Lookback: Sets the lookback period for calculating the sum of up volume and down volume for the ratio.
Ratio Calculation Method:
Close vs. Open: Defines an "up volume" bar as one where the close is higher than the open.
Close vs. Previous Close (Default): Defines an "up volume" bar as one where the close is higher than the previous bar's close. This is a common standard.
Up Ratio Arrow Threshold: If the U/D Ratio exceeds this value, a green "up" arrow will appear.
Show Up Ratio Arrow: Toggles the visibility of the green "up" arrow.
Down Ratio Arrow Threshold: If the U/D Ratio falls below this value, a red "down" arrow will appear.
Show Down Ratio Arrow: Toggles the visibility of the red "down" arrow.

Hybrid Swing/Day Alert System - PLATINUM EditionThis indicator is a complete trading assistant designed for crypto swing and day traders, built to identify high-probability long and short setups based on a multi-confirmation system.
Strategy Logic
The system scans and confirms entries only when 6 major confluences align:
1. EMA Trend: Price is above or below the EMA 9, 21, and 200 (bullish or bearish trend).
2. RSI Zone: RSI(14) is between 40-60 (ideal reversal zone).
3. Volume Confirmation: Volume is declining on pullback and then spikes.
4. Accumulation/Distribution: A/D line rising (for longs) or falling (for shorts).
5. Fibonacci Pullback Zone: Automatic detection of swing high/low and checks if price is inside the golden zone (0.5-0.618).
Built-In Alerts
- Long Setup Confirmed - Short Setup Confirmed - Setup Forming: Monitor
Conclusion
This script is ideal for disciplined traders who value confluence-based entries, risk/reward logic, and trend-aligned trades. Perfect for semi-automated trading via alerts or manual execution.6. Candle Pattern: Bullish (hammer, doji, engulfing) or Bearish (rejection wick, engulfing, doji).
Visual Features
- Long Entry: Green square
- Short Entry: Red triangle
- Pre-Signal Alert: Blue circle (confluence forming)
- Dynamic Table: Displays all 6 confirmations in real time
- Fibonacci Zones: Auto-plotted long/short retracement zones
- Customizable: Turn on/off alerts, overlays, and direction filters
Best Use Cases
- 4H/Daily: Trend confirmation
- 1H: Entry execution
- 15min: Scalping (use cautiously)
- Works great with BTC, ETH, SOL, XAU, and meme coins

TTM Scalper AlertTTM Scalper Alert — Real-Time Pivot Detector
Description:
This is a custom implementation of the classic TTM Scalper Alert, adapted to show early pivot detection and trend structure tracking in real-time. The script identifies potential highs and lows before the full pivot confirmation—giving traders an early edge—and removes outdated signals once pivots are confirmed.
It supports two levels of detection:
Fast Alert Pivots : Identified after Alert Period candles confirm a local reversal.
Confirmed Pivots : Validated only after Pivot Period candles on both sides ensure a true swing high/low.
How It Works:
Fast Detection (Early Pivots):
Detected after Alert Period (AP) candles. These are provisional signals, shown as triangle labels (▲▼) near current price. Only the latest signal is shown; previous fast pivots are deleted to avoid clutter.
Confirmed Pivots:
Detected with a full lookback of Pivot Period (PP) on both sides of the candle. Shown using plotshape with triangle markers (▲▼). Serve as anchors for price structure analysis (HH-HL or LL-LH tracking).
Custom Source Option:
Users can choose to base pivots on High/Low or Close/Open range. Helps adjust sensitivity depending on volatility or bar structure.
How to Interpret:
Trend & Market Structure:
Use Confirmed Pivots (plotshapes) to analyze market structure:
HH → HL: Uptrend
LL → LH: Downtrend
Watch for breaks in structure for possible reversals
Early Alerts:
The floating labels (▲▼) represent early warnings of a potential pivot. Use them to anticipate:
Short-term exhaustion
Quick scalping entries
Divergence setups
Inputs:
Source : Choose from High/Low or Close/Open — affects how pivots are calculated
Alert Period : How fast the script detects an early reversal pattern (used for entry timing)
Pivot Period : How many candles before/after to confirm a full pivot (used for structural analysis)
Best For:
Traders who follow price action and structure
Scalpers and intraday traders who want early signals
Anyone using pivot highs/lows for confluence with other tools (like RSI divergence, Bollinger Bands, VWAP, etc.)
Pro Tips:
Combine this with:
Trend Magic or Supertrend for directional bias
Volume spike filters to confirm reversal intent
RSI/CCI divergence to strengthen reversal pivots
Adjust Alert Period to tune early signal sensitivity (lower = faster but noisier)

Premarket High/Low Breakout AlertsPremarket High/Low Breakout Alerts
Description: This custom TradingView indicator helps you track premarket breakouts and breakdowns for a list of selected stocks. The indicator monitors the premarket session and sends an alert every time the stock's price breaks above the premarket high or below the premarket low.
Key Features:
Track Multiple Stocks: Easily monitor multiple stocks (e.g., AAPL, TSLA, NVDA, etc.) and get alerts when they break premarket levels.
Premarket Session Monitoring: The indicator checks for price movements during the premarket session (4:00 AM to 9:30 AM EST).
Customizable Ticker List: Modify the list of tickers directly from the TradingView settings to suit your daily trading needs.
Breakout and Breakdown Alerts: Receive instant alerts for both breakout (above premarket high) and breakdown (below premarket low) conditions.
Plot Premarket Levels: The premarket high and low levels are plotted on the chart for easy reference.
How to Use:
Add this indicator to your chart.
Go to the indicator settings and input your desired stock tickers (e.g., AAPL, TSLA, MSFT).
The indicator will automatically track the premarket levels and send alerts when those levels are broken.
Customize the tickers daily if needed.
Ideal For:
Day Traders who want to track premarket movements.
Swing Traders looking for strong breakouts from premarket levels.
Scalpers who need quick alerts to catch price action early.

SMA Angle AlertsSMA Angle Alerts
Overview:
The "SMA Angle Alerts" indicator measures the angle of the Simple Moving Average (SMA) over a specified number of bars, helping traders identify when the market is gaining or losing momentum. The indicator provides real-time alerts when the angle of the SMA crosses user-defined thresholds, indicating strong upward or downward movements in the trend.
How it works:
SMA Calculation: The indicator calculates the Simple Moving Average (SMA) of the closing price over a customizable length.
Angle Calculation: It determines the slope of the SMA by measuring the price change over a set number of bars and converts that slope into an angle (in degrees).
Alerts: Alerts are triggered when the SMA angle crosses above or below specified thresholds, allowing traders to react to significant trend changes in real time.
Key Features:
Customizable SMA and Angle Threshold:
The length of the SMA and the threshold for the angle can be customized to fit your trading strategy.
Real-Time Alerts:
Alerts are triggered when the angle of the SMA crosses upward or downward by more than the defined threshold, providing actionable insights into trend strength and direction.
Visual Markers:
The chart visually highlights points where the angle of the SMA exceeds the threshold, with "UP" and "DOWN" labels to mark when the angle is steep enough to signal significant trend changes.
Background Color Alerts:
The chart’s background color changes when the angle exceeds the thresholds—green for upward crosses and red for downward crosses—allowing traders to quickly spot moments of interest.
Plotting the Angle:
The slope of the SMA is plotted in degrees, giving traders a visual representation of the market's momentum. Horizontal lines mark the upper and lower angle thresholds, offering a clear view of when price momentum is accelerating or decelerating.
Use Case:
This indicator is ideal for traders looking to catch strong trend reversals, breakouts, or momentum shifts. It can be used across multiple timeframes to monitor market momentum and identify key moments when the trend is gaining strength in either direction.
Customization:
SMA Length: Adjust the length of the SMA to suit different timeframes or asset classes.
Angle Threshold: Define the angle at which alerts are triggered, allowing you to focus on strong upward or downward movements.
Bars to Check: Customize how many bars are used to calculate the slope and angle of the SMA.
Alerts:
Set alerts to notify you when the SMA is angling up or down by more than your specified threshold, ensuring that you never miss a significant trend shift.

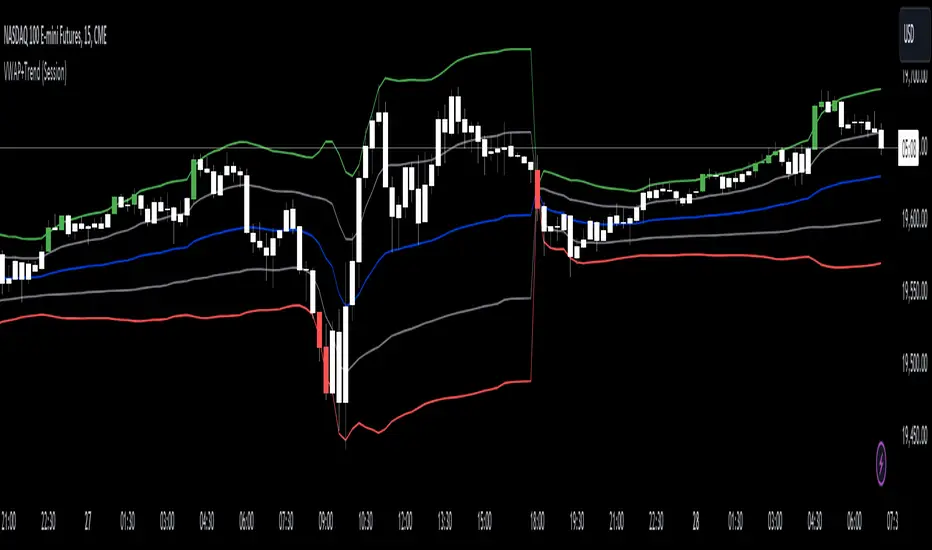
VWAP with Trend Alerts [CrossTrade]The VWAP with Trend Alerts indicator is designed to provide a comprehensive visual and analytical tool for traders using the Volume Weighted Average Price (VWAP) along with additional features like custom bar coloring and trend-based signal alerts.
Key Components and Functionalities:
1. VWAP Calculation: The core of this indicator is the VWAP, which represents the average price of an asset, weighted by volume. It's a popular tool among traders to identify the general direction and strength of a trend, and for assessing entry and exit points.
2. Standard Deviation Bands: Surrounding the VWAP are multiple bands calculated based on standard deviation values. These bands serve as dynamic support and resistance levels. The script allows up to three bands, each with customizable multipliers, giving insights into price volatility and potential breakout or reversal points.
3. Bar Coloring Options:
- Color All Bars: When enabled, all bars on the chart are colored based on whether they close above (green) or below (red) the VWAP.
- Trend Bars Only: This option, when selected, colors only the bars that close beyond the second standard deviation band. It helps in identifying stronger trends and significant market movements.
4. Buy and Sell Signal Conditions: The script includes conditions for buy and sell signals specifically tailored for trend bars. A buy signal is generated when a bar closes above both the VWAP and the upper second standard deviation band, indicating a potential strong uptrend. Conversely, a sell signal is triggered when a bar closes below both the VWAP and the lower second standard deviation band, suggesting a strong downtrend.
5. Alert Conditions: To aid in timely decision-making, the script features alert conditions corresponding to the buy and sell signals.
Usage and Application:
- For Trend Identification: The VWAP and its bands can help identify the prevailing market trend. Bars closing consistently above the VWAP suggest an uptrend, while those closing below indicate a downtrend.
- Volatility Assessment: The standard deviation bands provide a visual representation of market volatility. Narrower bands suggest low volatility, while wider bands indicate high volatility.
- Signal Alerts for Trading: The buy and sell signals, especially those filtered by the trend bars condition, can be valuable for traders looking for strong movement confirmations.
Flexibility and Customization:
This indicator is highly customizable and builds off of the core logic found in standard VWAP indicators. By allowing traders to adjust the standard deviation multipliers and choose their preferred bar coloring strategy. It caters to various trading styles, whether focusing on the broader market trend or pinpointing significant trend-based movements.
DOUBLE RSI+MA ALERTS SETUPThis is an indicator that provides two verses of relative force indices (RSI) - an RSI Rapid and an RSI Normal, but as moving media (MA) applied with an RSI Rapid for suavização.
Rapid RSI and Normal RSI:
Or RSI is a momentum indicator that mediates the speed and alteração of preço movements of an ativo. No script, we calculate the RSI variations:
O RSI Rápido, com um período configurável que por padrão é but curto (5 períodos), para reactor but quickly to these mudanças no preço.
Or RSI Normal, with a configured period, but with a maximum value (14 periods), proportionate to an analysis but correct.
Media Móvel do RSI Rápido:
We have a simple mobile media (SMA) application with RSI Rapido, using the same number of times as RSI to monitor variations and facilitate viewing of the direction of the trend.
Levels of Overbought and Oversold:
These are the levels of overbought (sobrevendido) and oversold (sobrecomprado). Therefore, the overbought level is set at 80 and the overbought level is 20, depending on the classic RSI settings.
Alert Conditions:
Criamos alert conditions to inform you when the RSI of each type is ultrapassed or they are not defined as overbought and oversold. Assim, we can be notified of potential entry points or conditions based on these extreme market conditions. These messages are personalized to ensure that you quickly identify when the RSI has disappeared or alerted you if it is an overbought or oversold condition.
Visualization Graphic:
The indicator plots as RSI Rapid and RSI Normal lines not graphically for visual analysis, but with horizontal lines indicating the level of overbought and oversold. A cor dessas linehas éjustável para clareza.
Informative Table:
The tab is added to the lower side of the graphic fornecendo values at the real time of the RSI Fast as the RSI Normal, making it easier to visualize quickly and to compare unless it is necessary to print directly for the graphic.
This script has a powerful ferrament for operators that provides integrated analysis of RSI into its strategies, offering flexibility to monitor the dynamics of the preço and different tempo scales. Personal alerts are particularly important to be aware of marketing conditions without the need for constant monitoring. Algum additional functionality that you find useful or extra personalization that you want?

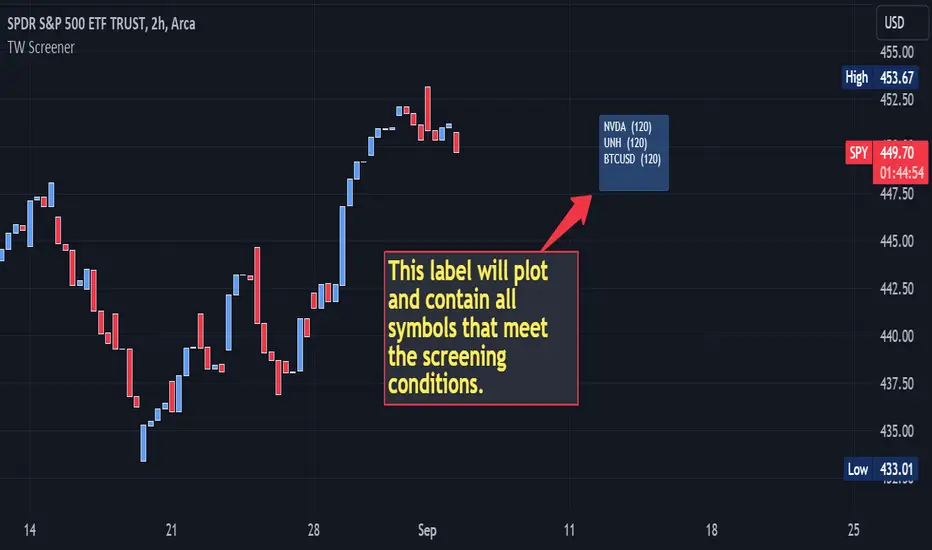
Multi-Symbol Indicator Screener w/ Alert [TradingWhale]This screener allows to screen multiple (up to 40) symbols for a condition defined by the user, including some other indicator plot values (not all of them) and their relation to other indicator plot values (data sources) or to absolute values defined in the condition.
It plots a label and adds the symbols and chart time frames to the label for those symbols that meet the screening condition. There are some examples further below.
The indicator / screener is designed to use other indicators as a data source, where possible.
On the label the symbols represent stock symbols. The numbers represent the chart time frame in which the condition was screened. (30) = 30 minutes, (120) = 120 minutes, (D) = 1 day, (3D) = 3 days, (W) = 1 week, and so forth.
Requirements:
- the indicators you want to use as source data need to be on the same chart as the screener, but not in the same pane.
- It will not work for all 3rd-party indicators.
The script provides the specific capabilities detailed below:
1. Data inputs:
- add up to 40 symbols to be screened
- check field for each symbol allow the user to enable/disable screening for each symbol individually
- ability to add up to two (2) external source data that can be compared to each other, where possible, by a logical operator or compared to an absolute value
- a check field to select whether the logical operation takes places between Source #1 and Source #2 or between Source # 1 and an absolute value.
- users can also define how far from the last bar the label is plotted on the chart
2. Operations available, whenever possible based on source data:
- "crossing"
- "cross up"
- "cross down"
- "rejected from resistance (Source #1) in the last bar", which means "High was above Source #1 (resistance level) in the last completed bar and 'close' (current price of the symbol) is now below Source #1" (resistance level).
- "rejected from resistance (Source #1) in the last 2 bars", which means "High was above Source #1 (resistance level) in one of the last two (2) completed bars and 'close' (current price of the symbol) is now below Source #1" (resistance level).
- "rejected from support (Source #1) in the last bar" --- similar to above except with Lows and rejection from support level
- "rejected from support (Source #1) in the last 2 bars" --- similar to above except with Lows and rejection from support level
- "greater than"
- "less than"
- "is up"
- "is down"
- "is up %"
- "is down %"
Screening examples could be:
- Source #1 "crossed up" Source #2
- Source #1 is "greater than" 20
3. Output:
a. Label
The label can be modified in terms of colors and position (how many bars away from the last bar)
b. Alerts
- Get alerted if one or more symbols meet the condition.
- To set up the alert visit the alerts setup screen in TV and select this screener.
ICT HTF Liquidity Levels /w Alert [MsF]Japanese below / 日本語説明は英文の後にあります。
-------------------------
*This indicator is based on sbtnc's "HTF Liquidity Levels". It's a very cool indicator. thank you.
It has 3 functions: visualization of HTF liquidity (with alert), candle color change when displacement occurs, and MSB (market structure break) line display.
=== Function description ===
1. HTF liquidity (with alert)
Lines visualize the liquidity pools on the HTF bars. Alerts can be set for each TF's line.
Once the price reaches the line, the line is repaint.
To put it plainly, the old line disappears and a new line appears. The line that disappeared remains as a purged line. (It is also possible to hide the purged line with a parameter)
The alert will be triggered at the moment the line disappears. An alert will be issued when you touch the HTF's liquid pools where the loss is accumulated, so you can notice the stop hunting with the alert.
This alert is an original feature of this indicator.
The timeframe of the HTF can't modify. You can get Monthly, weekly, daily and H1 and H4.
Each timeframe displays the 3 most recent lines. By narrowing it down to 3, it is devised to make it easier to see visually. (This indicator original)
2. Displacement
Change the color display of the candlesticks when a bullish candle stick or bearish candle stick is attached. Furthermore, by enabling the "Require FVG" option, you can easily discover the FVG (Fair Value Gap). It is a very useful function for ICT trading.
3. MSB (market structure break)
Displays High/Low lines for the period specified by the parameter. It is useful for discovering BoS & CHoCH/MSS, which are important in ICT trading.
=== Parameter description ===
- HTF LIQUIDITY
- Daily … Daily line display settings (color, line width)
- Weekly … Weekly line display settings (color, line width)
- Monthly … Monthly line display settings (color, line width)
- INTRADAY LIQUIDITY
- 1H … 1H line display settings (color, line width)
- 4H … 4H line display settings (color, line width)
- PURGED LIQUIDITY … Display setting of the line once the candle reaches
- Show Purge Daily … Daily purged line display/non-display setting
- Show Purge Weekly … Weekly purged line display/non-display setting
- Show Purge Monthly … Monthly purged line display/non-display setting
- Show Purge 1H … 1H purged line display/non-display setting
- Show Purge 4H … 4H purged line display/non-display setting
- MARKET STRUCTURE BREAK - MBS
- Loopback … Period for searching High/Low
- DISPLACEMENT FOR FVG
- Require FVG … Draw only when FVG occurs
- Displacement Type … Displacement from open to close? or from high to low?
- Displacement Length … Period over which to calculate the standard deviation
- Displacement Strength … The larger the number, the stronger the displacement detected
-------------------------
このインジケータはsbtncさんの"HTF Liquidity Levels"をベースに作成しています。
上位足流動性の可視化(アラート付き)、変位発生時のローソク色変更、MSB(market structure break)ライン表示の3つの機能を有します。
<機能説明>
■上位足流動性の可視化
上位足の流動性の吹き溜まり(ストップが溜まっているところ)をラインで可視化します。ラインにはアラートを設定することが可能です。
一度価格がラインに到達するとそのラインは再描画されます。
平たく言うと、今までのラインが消えて新しいラインが出現する。という事です。
消えたラインはpurgeラインとして残ります。(パラメータでpurgeラインを非表示にすることも可能です)
アラートはラインが消える瞬間に発報します。上位足の損切り溜まってるところにタッチするとアラートを発報するので、アラートにてストップ狩りに気づくことができます。
このアラート発報については本インジケータオリジナルの機能となります。
表示可能な上位足のタイムフレームは固定です。月足、週足、日足およびH1とH4を表示することができます。
各タイムフレーム、直近から3つのラインを表示します。3つに絞ることで視覚的に見やすく工夫しています。(本インジケータオリジナル)
■変位発生時のローソク色変更
大きな陽線、陰線を付けた場合に、そのローソク足をカラー表示を変更します。
さらに"Require FVG"オプションを有効にすることで、FVG(Fair Value Gap)を容易に発見することができます。ICTトレードにを行うにあたり大変有用な機能となっています。
■MSB(market structure break)ライン表示
パラメータで指定した期間のHigh/Lowをライン表示します。ICTトレードで重要視しているBoS & CHoCH/MSSの発見に役立ちます。
<パラメータ説明>
- HTF LIQUIDITY
- Daily … 日足ライン表示設定(色、線幅)
- Weekly … 週足ライン表示設定(色、線幅)
- Monthly … 月足ライン表示設定(色、線幅)
- INTRADAY LIQUIDITY
- 1H … 1時間足ライン表示設定(色、線幅)
- 4H … 4時間足ライン表示設定(色、線幅)
- PURGED LIQUIDITY … 一度到達したラインの表示設定
- Show Purge Daily … 日足ライン表示/非表示設定
- Show Purge Weekly … 週足ライン表示/非表示設定
- Show Purge Monthly … 月足ライン表示/非表示設定
- Show Purge 1H … 1時間足ライン表示/非表示設定
- Show Purge 4H … 4時間足ライン表示/非表示設定
- MARKET STRUCTURE BREAK - MBS
- Loopback … High/Lowを探索する期間
- DISPLACEMENT FOR FVG
- Require FVG … FVG発生時のみ描画する
- Displacement Type … openからcloseまでの変位か?highからlowまでの変位か?
- Displacement Length … 標準偏差を計算する期間
- Displacement Strength … 変位の強さ(数字が大きいほど強い変位を検出)

Inside Candle and mother candle range with alert++>>This script allows you the inside bar candle and the cnadle is shown in white.
The range of the mother candle is identified and tracked until it breaks.
Once the first range is over ridden then the next similar pattern will be occured and the tracking will be done for the mother candle latest occurrence.
It also has the alert mechanism where you can go and the alert for the indicator in Alerts.
5 min is the most preferrable time frame and while saving the alert Note to save the time frame of the chart. For which ever time frame is saved the Alert will be triggered for the same .
And when th inside bar is triggered it throws an alert condition. this alert condition has to be configured in your alerts and will be buzzing on the screen.
Oct 20
Release Notes: updated with Mother candle top and bottom lines of previous occurrences and tracks the current latest Inside bar mother candle
Release Notes: this script allows you the inside bar cnadle and the cnadle is shown in white. highlighter is configurable and line colors as well.

Previous Day/Week High & Low + 50% w/ Alerts| by Octopu$
📈 Previous Day/Week High & Low + 50% w/ Alerts| by Octopu$
This Indicator includes Previous Day High and Low Levels and 50% (Half of High & Low)
As well as Previous Week High and Low Levels ((Half of High & Low))
And also Pre-Market Session High and Low.
All of them with Built-in alerts.
Can be used in any timeframe with any ticker.
(Using SPY 5m just as an example:)
www.tradingview.com
SPY
Features:
• D High: Green Top Line
• D Low: Red Bottom Line
• D 50%: White 50% Line
• Week High and Low: Blue Top and Bottom Lines
• Pre-Market and Afterhours Session: Gray Lines
• Labels for Identification
Options:
• Toggle on/off for Day High, Low and 50%
• Toggle on/off for DWeek High, Low and 50%
• Toggle on/off for PM and AH Sessions
• Show/Hide the Labels with names
• Show/Hide the Lines themselves
• Fully Customizable Style and Color
Alerts:
• Triggers for Day (above or below level)
• Triggers for Week (above or below level)
Notes:
v1.0
Release of the Indicator
Changes and updates can come in the future for additional functionalities or per requests.
Did you like it? Shoot me a message! I'd appreciate if you dropped by to say thanks.
- Octopu$
🐙

Camarilla Pivots - Signals, Alerts, TP and SL by Tech Store OnThis is a Camarilla Pivots indicator script, which will show signals, take profit and stop-loss on the chart with alerts based on Camarilla Pivot strategies:
LONG signals: S5 > S4, TP1: S4, TP2: S3, TP3: R3 SL: Manual | S3 > R3, TP1: R3, TP2: R4, TP3: R5, SL: S4 | R4 > R5, TP1: R5, SL: R3
SHORT signals R5 > R4, TP1: R4, TP2: R3, TP3: S3, SL: Manual | R3 > S3, TP1: S3, TP2: S4, TP3: S5, S4 > S5, TP1: S5, SL: S3
Mainly, the script is based on the pivot levels and price action. The script will trigger a signal if a supporting direction candle breaks or bounces at certain pivot, triggering a direction of the potential trade with the next pivot serving as a Price Target area, each signal will potentially wait for 3 Price Target areas and if they happen will show each on chart. An opposite direction pivots are used as a Stop Loss, which the indicator will show on the chart. If stop-loss will be hit, the script will not show take profit areas considering the trade is closed with a loss. Same way if take profit area 1 is reach, it is considered that SL is moved to Entry and therefore the script will no longer show stop-loss for that trade. This indicator was mainly tested via 15min timeframe, but feel free to try different timeframes as the concept is the same.
This strategy was extensively manually tested, trade by trade, with S&P 500 ETF 15min timeframe, for back-testing results for the whole 2021 year (this is simply if you would LONG/SHORT stocks, don’t forget that if you trade Options, there is also Theta present (options price decay over time), the win rate is: 86.12%
*** If a trade was uncertain > it was marked immediately as stop-loss
*** A position was always closed at the end of the day no matter what (profit/loss)
Config: Alerts need to be set for each signal, take profit and stop-loss, it is pretty much self-explanatory, just right click the chart, select “Add alert” > next to Conditions select “Camarilla Pivot…”, for each trade signal and stop-loss, make sure it is “Once per Bar Close” and for each take-profit make sure it is “Once Per Bar”. Stop-losses are confirmed price breaks, while take-profits – we just need to touch those pivots.
Config: By Default, indicator signals are given during regular BEST (after 3PM ET – it’s power hour, which often is unpredictable + market will be closing soon) US standard market hours: 9:30AM-3PM ET, take profit and stop-losses by default are set to 9:30AM-4PM ET (US standard market hours. Both can be adjusted via Inputs. If you wish for the signals/take profit and stop-losses to be tracked 24/7 > choose the “EMPTY” space for both.
Config: Number of candles/bars to track back for opened positions is the number of Candles/Bars tracked back for each position. You can change this setting as it relates to timeframe versus trading style (day trading/swing), play around to find your best settings, by default it’s 13, which is best for day trading/15M timeframe. Please note: if position takes “too long” to reach TP or SL, it may not show TP or SL, so you need to keep an eye on this. It is best to use slightly lower number for day trading, because otherwise if you receive the same signal more than twice during the day > it will not show TP or SL for the second/third/etc. position. This is custom for you to change though, so if you want longer position tracking for the day, choose: 26 candles (this is the amount of 15M candles during the day), but keep in mind that for second/third position > it may not show you the TP1/SL.
Config: The table showing positions will show current open position on the bottom cell if position is opened per indicator, you can move or even hide this table in the indicator settings. (Please note: this is decorative thing and sometimes may show a position open, which is not actually open, especially when the market is not currently open).
Tip: Note: if pivots are too far away from each other and there is either big profit already or another support/resistance indicator (VWAP, SMA, support & resistance levels, etc.) – it is wise to take some profit off and move SL to Entry to secure profits in case market decides to turn around. This is especially wise if you trade Options as they include Theta (options price decay over time). Please note: back-test results displayed above were done without VWAP.
Tip: R5 > R4 and S5 > S4 are riskier signals as there are no pivots above/below for the SL, the script does not have a built-in stop-loss level/indicator for these, so you will need to manually set your stop-losses for these signals. Last day pivots often can help with this or simply use most recent support & resistance levels.
Tip: If trading S&P: be careful opening positions near 3PM ET, as during the “power hour” – 3-4PM ET > volatility increases and direction of the price becomes much more unpredictable. Similar: if you are in profit, it is wise to close the majority of your position at 3PM ET, before the “power hour” starts.
Tip: Very conservative trading approach: after signal happens, wait for a bounce back (price going back touching the pivot) and open position right there, that way > SL will be smaller and better risk/reward ration.
Tip: There is no limit on how many signals the script will show if it meets the conditions (in case you miss one of the signals and conditions repeat > you can still get into decent trade at next signal if it matches the condition).
Note1: if candle closes crossing/breaking several pivots at the same time and that same candle will touch take profit pivot – the script is configured to minimize showing/alerting signals/TP/SL for such conditions, so that you don’t get a very dirty chart / spammed with alerts, however sometimes it may or may not show signals and/or take profits/losses incorrectly. Overall, when you see such huge candles, it means that market volatility is bigger than usual, so a caution should be practiced.
Note2: If the signal candle almost nearly touches the first take profit area > it’s best not to open a position (you literally opening it at the first take profit pivot, and it may bounce the other way from that same pivot).
Note3: You may sometimes see take profit/stop-loss indicators in the beginning of the day or simply when pivot levels change, this is due to script registering the position open per old pivot levels and then show you take profit/stop-loss per new pivot levels.

TMA Centered Bands Indicator with alertsTo activate alert, you must manually create an alert. By selecting in 'Condition' TMA v0.42 and the option 'Any alert () function call'. The types of alerts can be found in the indicator settings. Each time the parameters are changed, a new alert must be created.
Good tool for estimation, but in no way should it be used in "signaling" mode since the signals are going to change because of recalculating and repainting.

Trailing Stop AlertsThis script is designed as an ATR-based trailing stop tool to assist in managing open positions.
Once you're involved in a profitable trade, if you add this script to your chart you'll be prompted to select a bar to begin trailing from.
You can then adjust the candle lookback distance for swing high/lows (7 by default), the ATR multiplier (1.0 by default), and the direction to trail (Long/Short).
You can also adjust the ATR period in the settings menu if you want to (14 period by default).
Once the script is added to your chart, it will begin drawing your trailing stop and you can then set up alerts.
Alert Options:
Any alert() function call : Will trigger an alert for both conditions (trailing stop updated, trailing stop hit)
Alert Conditions : Trailing Stop Update will trigger whenever the stop is updated, Trailing Stop Hit will trigger whenever the stop is hit.
Note: the alerts will only fire once per bar close and the trailing stop will not update on realtime bars.

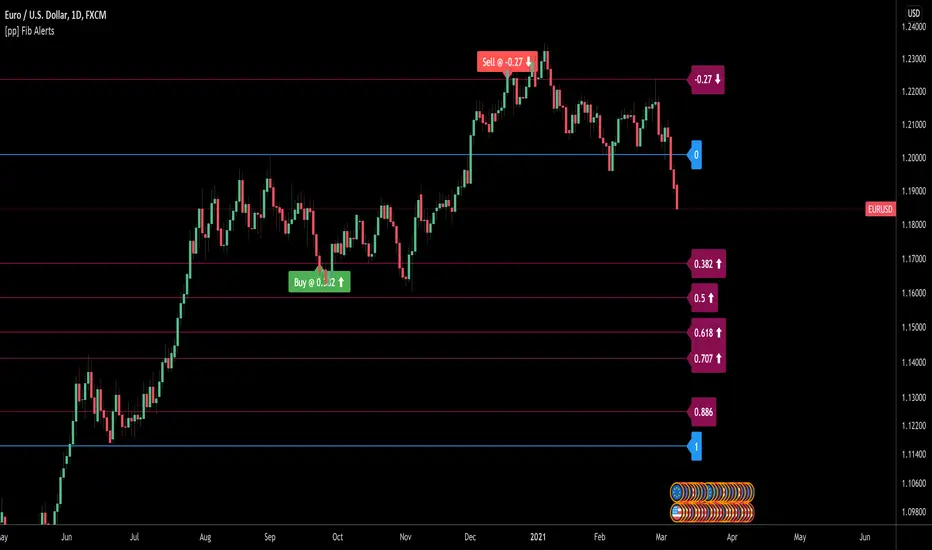
[pp] Fib AlertsUsing the new input.price() function we can now automate our fibonacci tools a little better.
This tool is designed with the intention of trading off of a fibonacci level using alerts.
How to use:
1.Add the indicator to your chart.
2. Place the bottom price where you would normally start your fibonnaci drawing
3. Place the top price where you would normally end your fibonacci drawing
4. Set your alert syntax "buy alert message" and "sell alert message" Should be replaced with webhook configurations or something better.
5. Fibonacci values > 1 (ie. 0.382, 0.5, 0.618) are recognized as retracements and work well as buying opportunities. When the price crosses one of these levels the "buy alert message" alert will be immediately triggered ONCE per BAR (I may update this in the future so it can only trigger ONCE ever to avoid multiple orders)
6. Fibonacci values < 1 (ie . -0.113, -0.27) are recognized as extensions levels and work well as selling opportunities. When the price crosses one of these levels the "Sell alert message" alert will be triggered.
If anyone knows how to convert the fibonacci values to logarithmic values I would greatly appreciate insight.
All in One StudyHere is my All in One Strategy converted into a Study with Alert Conditions you can use for whatever purpose you wish.
Each condition is set up similarly to the way I had the strategy set up, if you pick the indicators you want to base your alerts on it will alert you only if the check box is true.
You can pick one or more of the indicators if you'd like. I only suggest to pick one at a time so you don't have overlapping buy/sell alerts.
I think everyone will find the message of the market falling alert amusing :-)

MultiAlert LITEAllows one to set 5 price level alerts on one symbol (1 Stop Loss 4 Targets)
Alerts work by prices crosses under the stop loss or over the targets, enabling short reverses this.
Unlike regular MultiAlert, this actually draws a true horizontal price at your price.
This is a lighter version of MultiAlert, supporting only one symbol. Your price levels will appear on all charts unless you hide the indicator.
Make the alert with targets and stop loss set, every time you make a change you MUST REMAKE THE ALERT.
Please comment any problems .

MultiAlert, MultiTargets + TickersThis is my first script, completely made from scratch. Bear with me.
Script that allows one to set an alert for Multiple Price Levels, on Multiple Tickers, complete with Dynamic Messages showing you which ticker, at which price, at which alert (Stop loss, Target 1 etc.), set to Once Per Bar.
Select Ticker, type in price levels that you have for targets & stop loss, move on to the next, or don't and leave 0 and blank.
Disable the targets you do not need in STYLE tab to disable plotting & scaling, leave unused tickers & targets blank & 0.
Create Alert, select this indicator, anyfunction() alert.
MAKE SURE to remake the alert every time you change something, they are not smart enough to change as you change things. Can Confirm by using the numbers in the alert name. You will also have to set the profit level or stop loss to zero every time it triggers to avoid triggered again.
In fact, you do not need the indicator active at all. Add it to a chart and hide it by clicking on the little eyeball icon, to make an alert open the settings for the indicator and type in your targets like normal. Indicator will remain invisable.
I have not found a way to dynamic message the alert name, or else I would.
DISCLAIMER: NONE OF THIS IS FINANCIAL ADVICE. You are completely responsible for whatever happens to you. Do not use the targets in this chart. Do your own research before trading.
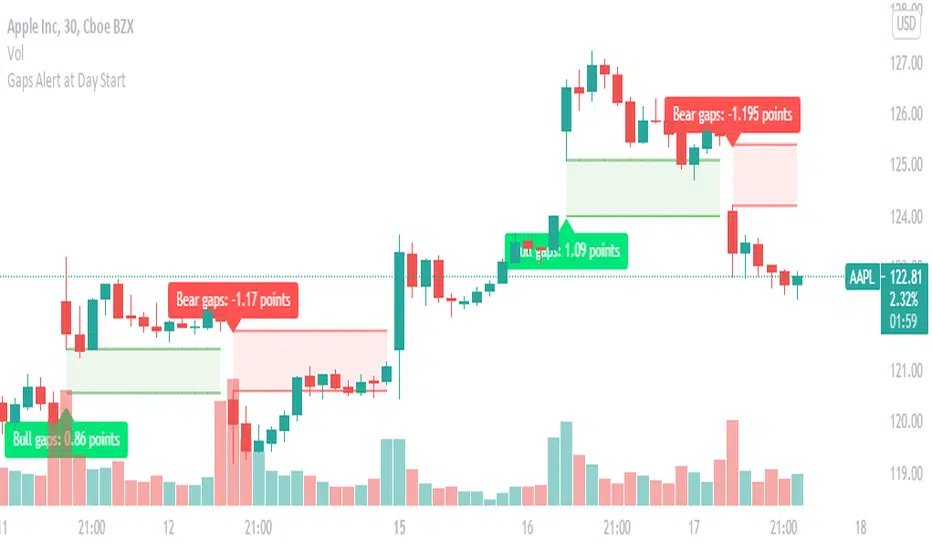
Gaps : set Alert to get Alert at Day StartGaps are areas on a chart where the price of a stock (or another financial instrument) moves sharply up or down,
with little or no trading in between. As a result, the asset's chart shows a gap in the normal price pattern.
The trader can interpret and exploit these gaps for profit.
What do i look for in these gaps, Will these gaps will fill or not fill?
When someone says a gap has been filled, that means the price has moved back to the original pre-gap level.
how you can benefit with this indicator?
this indicator instantly picks up the gap at the start of the day and also helps in identifying weather it is a bullish gap or a bearish gap
in this you can easily set up alerts, you will be instantly alerted if any gap occurs.
What does the visual on chart indicates ?
Green color gaps are bullish gaps or gap up ,label indicates the type of gap and the width of the gap
Red color gaps are bearish gaps or gap down ,label indicates the type of gap and the width of the gap
once you set alert you will Receive alert in the below format
Price (current price) 'Bear gap width: ' (gap Width in points)
Price (current price) 'Bull gap width: ' (gap Width in points)
This will work on all time frame equal to or less than "D".