No Wick Candle AlertNo Wick Candle Alert is a price-action indicator designed to identify strong momentum candles with no lower wick, signaling decisive buying or selling pressure.
This indicator automatically scans the chart and highlights:
Bullish candles with no lower wick (open = low)
Bearish candles with no lower wick (close = low)
When such a candle appears:
A clear visual marker is plotted slightly away from the candle (so it does not overlap)
An automatic alert is triggered to notify you in real time
🔹 Key Features
Detects true no-wick candles with precision
Works on any market (Forex, Crypto, Indices, Stocks)
Designed for 15-minute timeframe price action (can be adapted)
Non-repainting alerts (confirmed candle close)
Clean and minimal chart display
🔹 How Traders Use It
No-wick candles often indicate strong institutional pressure and can be used for:
Momentum confirmation
Breakout validation
Entry timing in price-action strategies
Confluence with support & resistance or session opens
🔹 Alerts
Once enabled, the indicator sends an alert immediately after the candle closes, allowing you to react without watching the screen.
Cari skrip untuk "alert"

SMC + Dual UT Bot buy and sell AlertsMise a jour avec un EMA 20/50 et vwap
his script is a composite indicator for TradingView (Pine Script v5) that merges Smart Money Concepts (SMC) with a Dual-instance UT Bot. It has been styled with a high-contrast "Neon Cyberpunk" theme (Cyan/Pink) and is fully compliant with the CC BY-NC-SA 4.0 license.
Here is a breakdown of its two main components:
1. Smart Money Concepts (SMC)
This portion, originally by LuxAlgo, is designed to identify institutional price levels and structural market shifts. It provides a detailed map of market structure rather than simple entry/exit signals.
Market Structure (BOS & CHoCH):
BOS (Break of Structure): Marks trend continuation (e.g., breaking a higher high in an uptrend).
CHoCH (Change of Character): Marks potential trend reversals (e.g., the first time a higher low is broken in an uptrend).
Order Blocks (OB):
Highlights specific candles where institutional buying or selling likely occurred. These act as high-probability support/resistance zones.
Neon Blue/Cyan for Bullish OBs.
Neon Pink for Bearish OBs.
Fair Value Gaps (FVG):
Identifies imbalances (gaps) in price action where the market often returns to "fill" orders.
Neon Mint for Bullish FVGs.
Neon Red for Bearish FVGs.
Premium/Discount Zones: Automatically plots the range equilibrium (50% level) to help you buy in "Discount" (low) and sell in "Premium" (high) areas.
Liquidity (EQH/EQL): Automatically detects "Equal Highs" and "Equal Lows," which are magnets for price as they represent liquidity pools (stop losses).
2. Dual UT Bot Alerts
This portion provides the actual Entry Signals. It runs two separate instances of the "UT Bot" strategy simultaneously with different sensitivity settings to filter noise.
Instance 1 (Buy Only):
Settings: Key Value = 4, ATR Period = 10 (Faster, more sensitive).
Visual: Plots a Neon Cyan "Buy" label.
Function: Looks for bullish reversals earlier to catch the start of a move.
Instance 2 (Sell Only):
Settings: Key Value = 7, ATR Period = 20 (Slower, smoother).
Visual: Plots a Neon Pink "Sell" label.
Function: Uses a wider ATR band to avoid getting shaken out of shorts too early, focusing on major downtrends.
How to Use It
The strength of this script is confluence.
Wait for a Signal: Look for a UT Bot "Buy" or "Sell" tag.
Confirm with SMC: Check if the signal aligns with SMC concepts.
Example Buy: Did the UT Bot give a "Buy" signal while price was bouncing off a Bullish Order Block?
Example Buy: Did price just sweep Liquidity (EQL) before the Buy signal?
Example Sell: Is the "Sell" signal happening inside a Premium Zone or a Bearish Fair Value Gap?
avant-hier
Notes de version
1. "Pro" Badge Buy/Sell Labels
The standard text signals have been replaced with modern, professional Badge Labels that provide more information at a glance.
Visuals: Instead of simple text, the script now uses label.new to create high-visibility badges.
BUY: A Neon Cyan badge with a Rocket icon (🚀).
SELL: A Neon Pink badge with a Chart icon (📉).
Price Details: Each badge displays the exact Entry Price directly on the label.
Tooltips: If you hover your mouse over a Buy or Sell badge, a tooltip will appear showing the exact Take Profit (TP) and Stop Loss (SL) prices calculated for that trade.
2. Dynamic Take Profit (TP)
The script now automatically calculates a profit target for every trade the moment a signal is generated.
Calculation: It measures the distance between your Entry Price and the initial Stop Loss (the ATR Trailing Stop).
Risk:Reward: It multiplies that distance by your chosen Risk:Reward Ratio (default is 1.5) to project a TP target.
Visual Line: A Green Line is drawn on the chart at the TP level. It remains active until price hits it or the stop loss.
3. Active Trailing Stop Loss (SL)
The Stop Loss is no longer static; it is now "alive" and manages the trade for you.
Trailing Logic: If Use Trailing SL? is enabled (default), the SL line will automatically move up (for longs) or move down (for shorts) as the trend continues in your favor. It locks in profit by following the UT Bot's ATR trailing band.
Visual Line: A Red Line is drawn at the SL level. You can see it physically step up or down on the chart as the trend progresses.
4. Real-Time Trade Simulation
The script now simulates the lifecycle of a trade directly on the chart:
Active State: When a trade is live, the TP and SL lines extend to the right of the current candle (bar_index + 1), showing you exactly where your exit points are in real-time.
Closed State: Once the price hits either the Green TP line or the Red SL line, the script detects the "Exit." The lines stop extending and turn dotted, indicating that the trade is closed and waiting for the next signal.
Summary of New Settings
You will find a new group in the settings panel called "UT Bot: Trade Management":
TP Risk:Reward Ratio: Adjust this to change how far the Green TP line is placed (e.g., set to 2.0 for 2x return).
Use Trailing SL?: Uncheck this if you want the Red SL line to stay fixed at the initial entry risk level.
avant-hier
Notes de version
1. Live Strategy Performance Dashboard (Backtester)
Since this is an indicator, TradingView does not automatically calculate PnL (Profit and Loss). I have built a custom Simulation Engine inside the script that tracks every UT Bot signal as if you had taken the trade.
Location: Bottom Right of your chart.
Win Rate: Displays the percentage of trades that hit the Take Profit target versus the Stop Loss.
Trades (W/L): Shows the total number of signals generated, broken down by Wins and Losses.
Net Profit (R): Calculates your theoretical profit in "R-Multiples" (Risk Units).
Example: If you set your Risk:Reward to 2.0, every win adds +2R, and every loss subtracts -1R.
Dynamic Colors: The Win Rate and Profit cells turn Neon Cyan if positive (>50% or >0R) and Neon Pink if negative.
2. Multi-Timeframe Trend Dashboard
A new panel at the Top Right gives you an instant "Market Bias" reading so you don't have to scan the whole chart.
SMC Trend: Reads the Smart Money structure (Break of Structure/Change of Character) to determine if the high-level timeframe is BULLISH or BEARISH.
UT Bot Status: Displays the current active signal state:
BUY (Active): You are currently in a Long trade.
SELL (Active): You are currently in a Short trade.
NEUTRAL: No active signal or the last trade hit TP/SL.
3. Integrated Alert System
I have connected the visual lines to the alert system. You can now set a single alert on this indicator, and it will trigger for:
Entry Signals: "UT Long Entry" / "UT Short Entry"
Exits: "Take Profit Hit" / "Stop Loss Hit"
4. Consolidated Settings
To make the script easier to manage, I organized the settings into clear groups:
Dashboards: Toggle the visibility of the new panels or move the Performance Panel to a different corner.
UT Bot: Trade Management: Quickly adjust your Risk:Reward Ratio (e.g., change from 1.5 to 2.0) to see how it affects your Win Rate in real-time on the dashboard.
avant-hier
Notes de version
1. Multi-Timeframe (MTF) Trend Scanner
I have replaced the basic "Market Bias" panel with a comprehensive MTF Trend Dashboard located at the Top Right of your chart.
What it tracks: It simultaneously monitors the trend direction on 5 distinct timeframes:
15 Minute
1 Hour
4 Hour
Daily
Weekly
How it works: It runs a background calculation (using UT Bot settings Key=5, ATR=15) on these higher timeframes without you needing to switch charts.
Visuals:
BULLISH: Highlighted in Neon Cyan.
BEARISH: Highlighted in Neon Pink.
2. Strategic Confluence (How to use it)
This new dashboard transforms the script from a simple "signal generator" into a complete trading system by allowing you to filter trades based on the bigger picture.
The "All-Green" Rule: If you are scalping on a 5-minute chart and you get a BUY signal, check the dashboard. If the 1H, 4H, and Daily are all Neon Cyan (Bullish), that trade has a significantly higher probability of success.
Avoid Counter-Trend Trades: If your main chart says BUY, but the dashboard shows the 4H and Daily are Neon Pink (Bearish), you are trading against the major trend. You might want to skip that trade or reduce your risk size.
3. Summary of Dashboards
You now have two professional-grade panels on your screen:
Bottom Right (Performance): Shows the past results of the strategy on your current timeframe (Win Rate, Profit Factor).
Top Right (Trend): Shows the current state of the market across all timeframes.

Matt's Multi-Timeframe MACD Direction AlertThe indicator monitors the direction of the Moving Average Convergence Divergence (MACD) lines on four specific timeframes: 1-hour, 15-minute, 5-minute, and 1-minute.
It only generates a signal when the MACD in all four timeframes is trending in the same direction (either all are bullish, or all are bearish). This alignment suggests a strong, synchronized market momentum from short-term scalping views up to immediate-term swing views.
Key Features:
Multi-Timeframe Confirmation: Uses TradingView's request.security() function to fetch data from different timeframes (1h, 15m, 5m, 1m), preventing the need to manually switch charts.
Visual Dashboard: A dashboard table is displayed on your chart, providing an immediate visual status (Bullish/Bearish/Neutral) for each of the four timeframes.
On-Chart Signals: The indicator plots visual shapes (green triangles for bullish alignment, red triangles for bearish alignment) directly on the sub-chart when the condition is met.
Custom Alert Integration: It includes a built-in alertcondition() function, allowing traders to set up real-time, hands-free notifications whenever a synchronized trading opportunity arises.
This tool helps filter out noise and potential false signals that might appear on a single timeframe, focusing instead on robust signals confirmed by a consensus of time perspectives.

BHUVANA Fib 50–61.8 • Turn Alerts when FIB directions change
Detects step-up / step-down on both Fib 50 & 61.8 (your “stairs” logic).
Triggers BUY/SELL on that slope change (optionally also requires price to be above/below the line).Spot volatility compression around the 50%–61.8% Fibonacci mid-band of the current swing, then trade the first expansion with clean, rules-based entries and auto SL references.
Swing mapping: Finds the active high/low over a user-defined lookback and computes Fib 50% and Fib 61.8%.
Squeeze detection: Measures the distance between 50% and 61.8%. If the band width is ≤ (ATR × multiplier), the zone is flagged as a Squeeze.
Breakout entries (on close):
Long when price crosses up through 50% while squeezed.
Short when price crosses down through 61.8% while squeezed.
Risk framework: Auto-plots stop lines from the signal bar:
Long SL = swing low; Short SL = swing high.
Visuals: Fib lines (50/61.8) + optional yellow zone highlight during squeeze.
Signals evaluate on bar close (no forward-looking data).
Works well on XAUUSD / US30 intraday (5–15m) during London/NY sessions.
Add your own alertcondition() lines if you want push alerts on Long/Short entries.

Strat 3-Bar (Outside Bar) AlertThis indicator automatically detects and alerts you when a Strat 3-Bar (Outside Bar) forms on any chart or timeframe.
An Outside Bar (3) occurs when both sides of the previous candle’s range are taken out — the high breaks above the prior bar’s high AND the low breaks below its low. It signals expansion in price discovery and potential reversals or continuations.
📈 How to Use:
1. Add this script to your chart.
2. Look for red “3” labels or triangles above outside bars.
3. To get alerts, click the TradingView alert icon (⏰):
• Condition → Strat 3-Bar (Outside Bar) Alert
• Option → “Outside Bar (3) Detected”
• Choose “Once per bar close.”
💡 Pro Tips:
- Use with Strat Assist for visual context.
- Combine with timeframe continuity for directional bias.
- Great on 15-min, 1H, and Daily charts.
---
👩🏽💻 Shared with love by Yolanda
Inspired by community discussions with Jalen (ChatGPT)
Let’s keep building each other up and mastering The Strat together! 💛
TheStrat, outsidebar, 3bar, priceaction, tradingstrategy, alert, reversal, continuation, stratassist, strat, technicalanalysis, pinev6, smartmoney

EMA Cloud + AlertsThe only EMA indicator you'll ever need.
- Flexible EMAs: Customize EMA lengths (e.g., 9, 21) to match your trading style.
- Dynamic Cloud: Auto-shades bullish (green) or bearish (red) clouds between EMAs for clear trend signals.
- Trend Change Alerts: Auto-alerts that signal when a trend change (EMA crossover) happens on the timeframe you're currently viewing.
- Timeframe Lock: Lock EMAs to a specific timeframe (e.g., 5m on a 1m chart) for consistent analysis.
- Personalized Design: Adjust EMA colors, thickness, and cloud transparency for optimal visibility.
A friendly reminder that no tool or indicator guarantees success. Integrate this into a robust trading plan.

Bollinger ALTswap Alert v1.0 (MA28 Rotation ALT↔BTC)Inspired by: Bollinger Awesome Alert R1 by JustUncleL
What is it?
BBALTSWAP overlays Bollinger Bands (20, 2), a 3-EMA, and a Rotation MA (default 28), then gives state-change alerts to rotate between ALT ↔ BTC on any ALT/BTC chart.
Core rotation rule
• Rotate → ALT when close > Bollinger middle and close > MA28.
• Rotate → BTC when close < Bollinger middle and close < MA28.
• Otherwise: Wait (no rotation).
Labels only print when the state changes (to avoid spam). You can also compute the rotation on a higher timeframe (default 4h) while viewing a lower one (e.g., 1h).
Optional extras
• Breakout arrows (scalping-style) when 3-EMA crosses the Bollinger middle with an Awesome Oscillator direction filter.
• Bollinger Squeeze coloring (relative width) to highlight expansion/contraction.
• Min bars between labels to throttle how often rotation labels appear.
Inputs (highlights)
• Use EMA for Bollinger / Rotation MA
• Bollinger length & multiplier
• AO fast/slow lengths
• Higher-timeframe selector for rotation (default 240 = 4h)
• Show breakout arrows / show “Wait” / min bars between labels
How to use (simple playbook)
1. Chart: open your ALT/BTC pair (e.g., ETHBTC).
2. Direction: leave rotation HTF at 4h for steadier signals.
3. Execution: take rotations on bar close; manage entries on your lower TF (1h/15m) if desired.
4. Override check (optional): when BTCUSDT is in a fresh breakout, prefer BTC even if ALT flashes briefly.
Alerts
Add two alerts, Once per bar close:
• “Rotate to ALT (state change)”
• “Rotate to BTC (state change)”
Notes
• Works on any ALT/BTC pair.
• The breakout arrows are optional and independent from the rotation signals.
• This tool is educational; not financial advice.

EMA 89 và EMA 34 - MTF AlertEMA34/89 in MTF and alert. If you want to find indicator for alert, I thing it for you

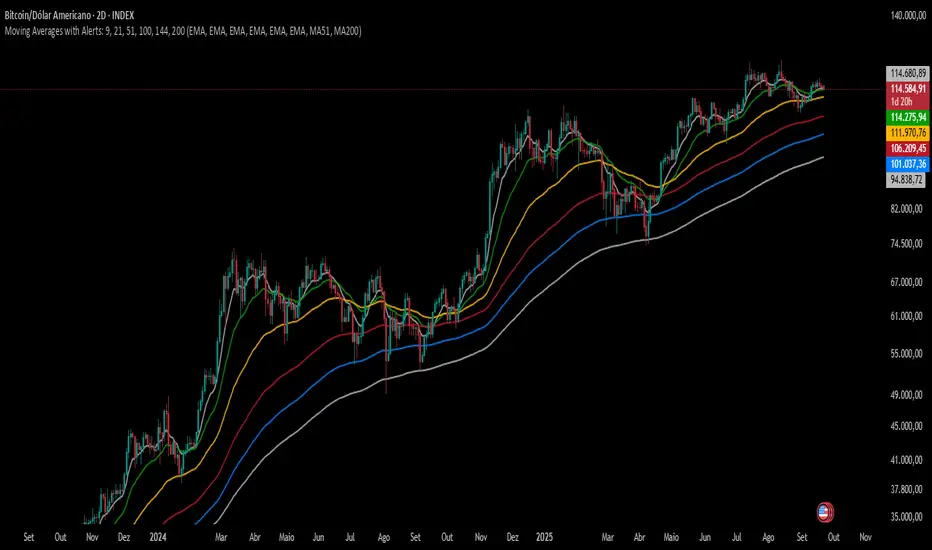
Moving Averages with Alerts: 9, 21, 51, 100, 144, 200---
This indicator plots six configurable moving averages (MA) with options for EMA, SMA, RCI, HMA, and Pivô Boss types. It highlights key crossover points, especially monitoring the 9-period MA for crosses with others. Users can enable alerts for these crossovers, as well as set custom alerts between any two selected MAs. Additionally, the indicator marks the important crossovers of the 51 and 200 MAs on the chart with an “X”. This helps traders identify trend changes and potential entry or exit points efficiently.
---
Emre AOI Zonen Daily & Weekly (mit Alerts, max 60 Pips)This TradingView indicator automatically highlights Areas of Interest (AOI) for Forex or other markets on Daily and Weekly timeframes. It identifies zones based on the high and low of the previous period, but only includes zones with a width of 60 pips or less.
Features:
Daily AOI Zones in blue, Weekly AOI Zones in yellow with 20% opacity, so candlesticks remain visible.
Persistent zones: AOI boxes stay on the chart until the price breaks the zone.
Multiple zones: Supports storing multiple Daily and Weekly AOIs simultaneously.
Break Alerts: Sends alerts whenever a Daily or Weekly AOI is broken, helping traders spot key levels in real-time.
Fully automated: No manual drawing needed; zones are updated and extended automatically.
Use Case:
Ideal for traders using a top-down approach, combining Weekly trend analysis with Daily entry signals. Helps identify support/resistance, supply/demand zones, and critical price levels efficiently.

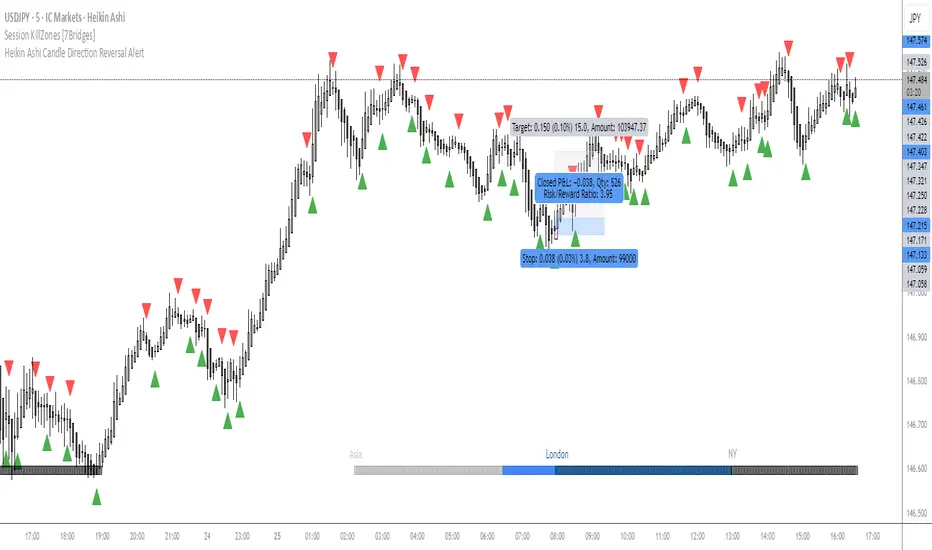
OMN Heikin Ashi Candle Direction Reversal AlertThis is a indicator to let you know once Heikin Ashi candle has changed direction compared to the candle before it. Set an alert on the indicator to get an audible alert.
Triple EMA with Alert | 21, 50, 200 EMA Strategy + Crossover🚀 Boost your trading edge with the Triple EMA with Alert — a professional-grade indicator designed for traders who want precise, real-time trend confirmation across short, medium, and long-term market movements.
🔹 What Makes This Indicator Powerful?
Three Adjustable EMAs — Default: 21, 50, 200 periods (fully customizable 1–200).
Toggle Visibility — Show only the EMAs you need for your strategy.
Real-Time Alerts — Get notified instantly when:
EMA 1 crosses EMA 2 → short-term trend change.
EMA 2 crosses EMA 3 → medium-term trend alignment.
Works on All Markets & Timeframes — Forex, crypto, stocks, indices, and commodities.
🔹 Why Traders Love It
📊 Multi-Timeframe Trend Confirmation — Filter out noise and trade with market momentum.
🎯 Accurate Crossover Signals — Identify bullish and bearish momentum shifts.
🔔 Hands-Free Monitoring — Alerts keep you informed even when you’re away from the chart.
💡 Versatile for Any Strategy — Perfect for scalping, swing trading, or long-term investing.
🔹 How to Use It
Bullish Signal — EMA 1 crossing above EMA 2 or EMA 2 crossing above EMA 3.
Bearish Signal — EMA 1 crossing below EMA 2 or EMA 2 crossing below EMA 3.
Combine with support/resistance zones, RSI, or volume for higher probability trades.
📌 Pro Tip:
Use EMA 21 & EMA 50 for momentum confirmation.
Use EMA 200 to spot the overall market direction.
If you’re serious about trend trading with precision, the Triple EMA with Alert will keep you one step ahead of market moves — no more missed entries or exits.

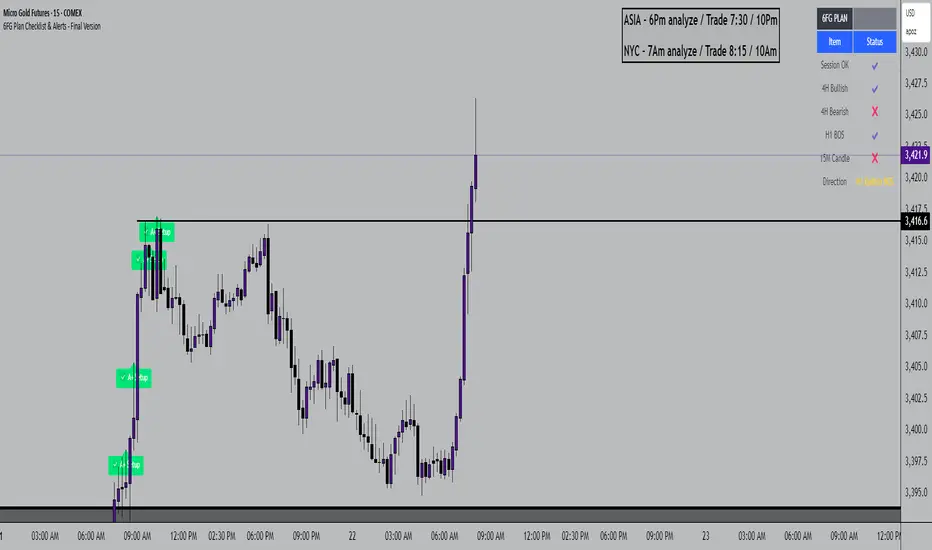
6FG Plan Checklist & Alerts - Final Version🧠 SCRIPT OVERVIEW: "6FG A+ SETUP - Simplified"
This script is designed to identify high-probability A+ trade setups in alignment with your personal 6FG trading plan, based on:
H1 Break of Structure (required)
4H trend confirmation
15M candle confirmation
Session filter
A+ Label & Visual Table Checklist
✅ KEY COMPONENTS
1. Toggle Inputs
These allow you to customize your view and filters without changing the code:
showSession: Only allow alerts inside Asian or NY sessions
show4hTrend: Include or ignore 4H directional bias
show15mConfirm: Include or ignore confirmation from 15M candles
showTable: Display checklist table on chart
showLabel: Display the “✅ A+” label on qualifying bars
2. Session Filter
Defines valid timeframes for trading (Asian or New York)
Helps avoid setups during low-liquidity hours
Controlled by showSession
3. 4H Trend (Confirmation Only)
Uses a 20-period SMA on 4H to detect general bias:
Bullish = Price above SMA
Bearish = Price below SMA
This trend is not mandatory for an alert if toggle is off
4. H1 Break of Structure (REQUIRED)
Looks at the highest high and lowest low of the last 10 candles on the 1H timeframe
Detects either:
Bullish BOS = Current close > highest high
Bearish BOS = Current close < lowest low
This is the core trigger for the A+ setup
If BOS doesn't happen, no entry is valid
5. 15M Confirmation Candles
(Optional - controlled by show15mConfirm)
Checks for one of three confirmation patterns:
Bullish Engulfing
Bearish Engulfing
Pin Bar
This adds confidence but can be toggled off
6. Entry Conditions (A+ Setup)
All the following must be true for entryOK = true:
✅ H1 BOS (required)
✅ Session is valid (if toggle is on)
✅ 15M confirmation pattern (if toggle is on)
✅ 4H trend (if toggle is on)
7. Visual Output
If entryOK = true:
✅ A green "A+" label appears below price
✅ A checklist table on the top-right shows:
Session status ✔️❌
4H bullish/bearish ✔️❌
H1 BOS ✔️❌
15M confirmation ✔️❌
Final Direction: Bullish / Bearish / —
A+ Setup: ✔️❌
8. Alerts
You will receive a TradingView alert when an A+ Setup is detected:
LTHB & HTLB Zones with AlertsIn price action trading, the Lowest Tick of the Highest Bar (LTHB) and the Highest Tick of the Lowest Bar (HTLB) are important concepts for support/resistance identification, trend exhaustion, and reversal confirmation. Here's what they mean and why they matter:
🔹 Definitions
1. Lowest Tick of the Highest Bar (LTHB):
The lowest price (tick) of the bar (candlestick) with the highest high in a recent price swing.
Significance: It marks the support inside an upward swing. If price breaks below this, it often indicates loss of upward momentum or reversal.
2. Highest Tick of the Lowest Bar (HTLB):
The highest price of the bar with the lowest low in a swing.
Significance: It acts as a resistance inside a downward swing. If price moves above this, it can signal a bullish reversal.
🔸 Why Are They Significant?
Concept LTHB HTLB
Trend Reversal - Break below LTHB → possible bearish reversal Break above HTLB → possible bullish reversal
Swing Confirmation -Holding above LTHB → continuation of uptrend Holding below HTLB → continuation of downtrend
Trap Detection - Stop hunts often occur just below LTHB Stop hunts often occur just above HTLB
Risk Management -Acts as logical stop-loss in long trades Acts as logical stop-loss in short trades
🔸 Uses in Strategy
1. Breakout Traders use these levels as entry triggers.
2. Reversal Traders look for price failing to hold these levels for early reversal signs.
3. Structure-Based Traders use them to confirm higher highs/lower lows.
4. Stop Placement: Tight stops just beyond LTHB/HTLB help manage risk in swing trades.
🔔 How to Set Alerts in TradingView:
Add the script to your chart.
Open the "⚠️ Alerts" tab.
Click "Create Alert".
In the "Condition" dropdown, select one of:
Enter LTHB Zone
Exit LTHB Zone
Enter HTLB Zone
Exit HTLB Zone
Set desired alert frequency (e.g., once per bar or once).
Click Create.

MTF Trend + Crossover AlertsMulti-Timeframe Trend Dashboard + Crossover Signals
This indicator provides a clean, real-time visual dashboard of trend directions across multiple timeframes (1m, 5m, 15m, 30m, 1H, 4H, 1D), based on moving average crossovers.
🔹 Trend Detection Logic:
When the fast MA is above the slow MA → Bullish trend 🚀
When the fast MA is below the slow MA → Bearish trend 🐻
When both are equal or ranging → Neutral
📊 Dashboard Features:
Displays trend status for each selected timeframe
Color-coded cells (green = bullish, red = bearish, gray = neutral)
Includes emojis for visual clarity
🔔 Buy/Sell Alerts:
On the active chart timeframe, buy and sell signals are plotted when the fast MA crosses above or below the slow MA. You can also enable TradingView alerts based on these events.
🧩 Customizable Inputs:
Fast MA period
Slow MA period
MA type (EMA or SMA)
🔧 Ideal for traders who want a quick snapshot of market structure across multiple timeframes and receive real-time crossover signals on their current chart.

Auto Trend Channel + Buy/Sell AlertsThis indicator automatically detects trend channels using a linear regression line, and dynamically plots upper and lower channel boundaries based on standard deviation. It helps traders identify potential Buy and Sell zones with clear visual signals and customizable alerts.
💡 How It Works:
🧠 Regression-Based Channel: Calculates the central trend line using ta.linreg() over a user-defined length.
📏 Dynamic Boundaries: Upper and lower channel lines are offset by a multiplier of the standard deviation for precision volatility tracking.
✅ Buy Signals: Triggered when price crosses above the lower boundary — potential bounce entry.
❌ Sell Signals: Triggered when price crosses below the upper boundary — potential reversal exit.
🔔 Alerts Enabled: Get real-time alerts when price touches the channel lines.

UT Bot Alerts – Time Filtered with ExitsThis indicator combines several technical approaches to generate precise entry and exit signals, while incorporating time filters that ensure signals are sent only during desired time windows and with defined cooldown periods. It is based on the original idea by QuantNomad.
Main Components:
ATR-based Trailing Stop:
Using the Average True Range (ATR) and an adjustable multiplier ("Key Value"), a dynamic trailing stop is calculated that adapts to the current price. This trailing stop forms the basis for the signal generation.
EMA-based Entry Signals:
A very short exponential moving average (EMA, period 1) is used in combination with the trailing stop to identify clear buy (long) and sell (short) signals via crossovers. An additional buffer zone helps reduce false signals.
Persistent Trade State:
The current state (long, short, or neutral) is maintained so that the system remains in the trend until a new signal is generated.
Linear Regression as Reference:
A linear regression line computed over a defined period serves as a reference for determining exit levels.
Exit Signals with Delay:
Exit signals are generated when the price deviates from the linear regression line by a defined percentage (Exit Signal Deviation) and the condition persists for at least a specified number of bars (Exit Signal Delay). Only one exit signal is issued per trade to avoid excessive exits.
Time Filters and Cooldown:
Session Filter: A user-defined session (e.g., "2200-0500") can disable signals during specified periods.
Cooldown Period: After a signal is triggered, a cooldown phase (in minutes) can be set during which no new signals are sent.
Visual Display and Alerts:
Entry Signals: Buy and sell signals are displayed as labels (green for long, red for short).
Exit Signals: Exit signals appear as triangles, with the exit long signal text displayed in white.
Reference Lines:
The upper exit level (Exit Short Level) is drawn as a solid line in turquoise (color.aqua).
The lower exit level (Exit Long Level) is drawn as a solid line in yellow.
Additionally, the ATR trailing stop and the linear regression line are clearly plotted on the chart.
Alerts can be configured for all signal types.
In Summary:
The indicator delivers precise entry signals based on an ATR trailing stop and a short EMA, supplemented by dynamic exit levels determined via linear regression. With integrated time filters (session and cooldown) and a flexible exit mechanism, this indicator offers controlled trade management—ideal for traders who wish to receive signals only during desired time periods.
Original Author: QuantNomad

Auto Fibonacci Extension and Retracement with Visual AlertsThis indicator automatically calculates and plots Fibonacci retracement and extension levels based on recent swing highs and lows, making it a powerful tool for traders who use Fibonacci analysis in their strategies.
Key Features:
• Dynamic Fibonacci Levels: Automatically detects swing highs and lows over a user-defined lookback period to calculate key Fibonacci retracement (e.g., 0.236, 0.382, 0.618, etc.) and extension (e.g., 1.618, 2.618, etc.) levels.
• Visual Alerts: Displays intuitive visual alerts when the price crosses important Fibonacci levels.
• Blue dashed lines for retracement levels.
• Green dashed lines for extension levels.
• Labels with up or down arrows indicating price interactions with these levels.
• Swing High/Low Visualization: Marks recent swing highs and lows with crosses for better clarity.
• Customizable: Adjust the lookback period and Fibonacci levels to suit your trading style.
Who is it for?
This indicator is perfect for:
• Swing Traders: To identify potential reversal or continuation zones.
• Day Traders: For short-term setups based on Fibonacci levels.
• Fibonacci Enthusiasts: To automate the time-consuming process of manually plotting levels.
Usage Ideas:
1. Use retracement levels (e.g., 0.618) to identify areas of potential support or resistance.
2. Use extension levels (e.g., 1.618) to target potential breakout or continuation zones.
3. Combine this indicator with candlestick patterns, volume analysis, or other tools for confirmation.
Limitations:
• This is a standalone indicator and does not provide buy/sell signals. It’s recommended to combine it with other technical analysis tools for best results.
• The lookback period and swing detection rely on past data, so adjustments may be needed based on the asset or timeframe.
Whether you’re looking to streamline your Fibonacci analysis or explore new opportunities in your trading, this indicator is designed to save time, increase accuracy, and enhance your overall trading experience.

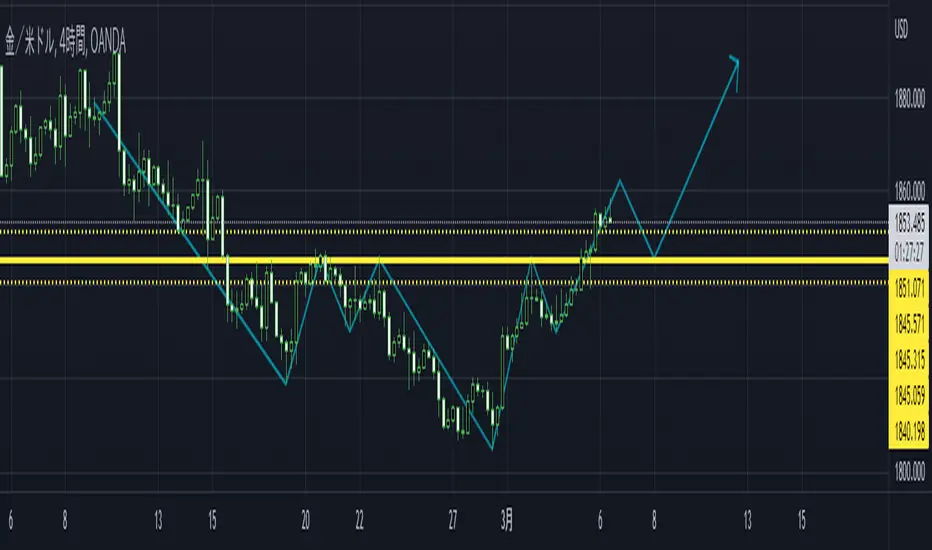
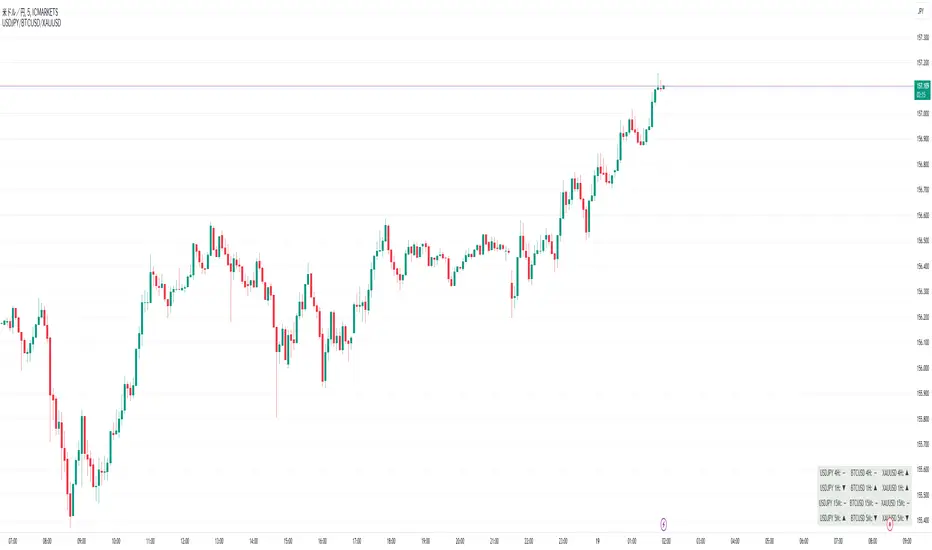
Perfect Order Alert USDJPY/BTCUSD/XAUUSDPerfect Order Alert USDJPY/BTCUSD/XAUUSD 日本語解説は下記
This indicator detects the perfect order of three moving averages and displays on the Panel in an easy-to-understand visual manner whether there is an uptrend, downtrend, or non-trend for each time leg.
This indicator detects perfect orders for the three currency pairs USDJPY/BTCUSD/XAUUSD on the 5-minute, 15-minute, 1-hour, and 4-hour time frames, and displays them on the Panel on the chart, with “▲” for up, “▼” for down, and “ー” for non-trend, so that you can quickly determine the trend. The panel is displayed on the chart.
In order to check for perfect orders without missing them, it is also possible to set up alerts that notify you of all the time frames and currency pairs as well.
Functions
Displaying 4H, 1H, 15M, 5M, up (▲), down (▼), other (-), of USDJPY/BTCUSD/XAUUSD on the panel.
*(By default, 20EMA, 75EMA, and 200EMA are hidden.)
Display position setting of the panel (You can choose from upper left, upper top, upper right, lower left, lower bottom, or lower right).
Panel color and text color change function
The moving average line can be hidden by default.
Moving average period change
Moving average color and thickness can be changed.
EMA/SMA switchable
Alert function - One alert can be set for each currency pair and time frame ▲▼, which is very useful.
Perfect Order Alert
You can use it even if you have a free account with only one alert setting.
To use the alert function, go to the Tradingview default alert settings, select “USDJPY/BTCUSD/XAUUSD” for the top item of conditions, and select “Call Alert() function” in the frame just below it!
_* Supplementary explanation: ____________
Please note that due to the limitation of the script, only 3 currency pairs and 4 time frames are displayed with 12 items (Panels for currency pairs other than USDJPY/BTCUSD/XAUUSD are also created, but they are indicators for other scripts, so if you are interested in other currency pairs, please use those. If you are interested in other currency pairs, please use them.)
Please note that we may change the functions or delete the indicator itself without prior notice.
Translated with DeepL.com (free version)
Reference image of the setting screenReference image of the setting screen
設定画面参考画像
3本の移動平均線のパーフェクトオーダーを検知し、時間足ごとに上昇トレンドか下降トレンドかノントレンドかを視覚的にわかりやすくPanelに表示するインジゲーターです。
このインジゲーターは、USDJPY/BTCUSD/XAUUSDの3通貨ペアの5分足、15分足、1時間足、4時間足のパーフェクトオーダーを検知して、チャートに表示されるPanelに、上昇は「▲」下降は「▼」ノントレンドは「ー」と、すぐに判断できる表示にしてあります。
パーフェクトオーダーを逃さずチェックできるように、それぞれの時間足や通貨ペアも全てを通知してくれるアラート設定が可能なのも特徴です。
機能紹介
・USDJPY/BTCUSD/XAUUSDの4H,1H,15M,5M,の上昇(▲),下降(▼),その他(-),をパネルに表示
※(デフォルトでは20EMA,75EMA,200EMAの3本で非表示にしてあります)
・パネルの表示位置設定(左上、上、右上、左下、下、右下、から選択できます。)
・パネルの色とテキスト色変更機能
・移動平均線表示非表示機能(デフォルトでは表示OFFにしてあります。)
・移動平均線期間変更
・移動平均線色と太さ変更
・EMA/SMA切り替え可能
・アラート機能ー1つのアラート設定で通貨ペアと時間足▲▼一つ一つを細かく教えてくれるので便利。
※パーフェクト オーダーアラート
無料アカウントで1つしかアラート設定できなくても使えます。
アラート機能はTradingviewデフォルトのアラート設定から、条件の一番上の項目を「USDJPY/BTCUSD/XAUUSD」選択、そのすぐ下の枠に「Alert()関数の呼び出し」を選択でOK!
_※ 補足説明____________
・スクリプトの制限の為、3通貨ペアと4つの時間足の12項目で表示させていますのでご了承ください
(USDJPY/BTCUSD/XAUUSD以外の通貨ペアのPanelも作成していますが別スクリプトのインジゲーターになりますので他の通貨ペアも興味がある方はそちらをお使いください)
・予告なしで機能の変更やインジゲーター自体の削除等行う事もあるかもなのでご了承ください。
Order Blocks & Breaker Blocks [TradingFinder] Signals + Alerts🔵 Introduction
Order Block and Breaker Block, are powerful tools in technical analysis. By understanding these concepts, traders can enhance their ability to predict potential price reversals and continuations, leading to more effective trading strategies.
Using historical price action, volume analysis, and candlestick patterns, traders can identify key areas where institutional activities influence market movements.
🟣 Demand Order Block and Supply Breaker Block
Demand Order Block : A Demand Order Block is formed when the price succeeds in breaking the previous high pivot.
Supply Breaker Block : A Supply Breaker Block is formed when the price succeeds in breaking the Demand Order Block. As a result, the Order Block changes its role and turns from the role of price support to resistance.
🟣 Supply Order Block and Demand Breaker Block
Supply Order Block : A Supply Order Block is formed when the price succeeds in breaking the previous low pivot.
Demand Breaker Block : A Demand Breaker Block is formed when the price succeeds in breaking the Supply Order Block. As a result, the Order Block changes its role and turns from the role of price resistance to support.
🔵 How to Use
🟣 Order Blocks (Supply and Demand)
Order blocks are zones where the likelihood of a price reversal is higher. In demand zones, buying opportunities arise, while in supply zones, selling opportunities can be explored.
The "Refinement" feature allows you to adjust the width of the order block to fit your trading strategy. There are two modes in the "Order Block Refine" feature: "Aggressive" and "Defensive." The primary difference between these modes is the width of the order block.
For risk-averse traders, the "Defensive" mode is ideal as it offers a lower loss limit and a higher reward-to-risk ratio.
Conversely, for traders who are willing to take more risks, the "Aggressive" mode is more suitable. This mode, with its wider order block width, caters to those who prefer entering trades at higher prices.
🟣 Breaker Blocks (Supply and Demand)
Trading based on breaker blocks is the same as order blocks and the price in these zones is likely to be reversed.
🔵 Setting
🟣 Global Setting
Pivot Period of Order Blocks Detector : Enter the desired pivot period to identify the Order Block.
Order Block Validity Period (Bar) : You can specify the maximum time the Order Block remains valid based on the number of candles from the origin.
Mitigation Level Order Block : Determining the basic level of a Order Block. When the price hits the basic level, the Order Block due to mitigation.
Mitigation Level Breaker Block : Determining the basic level of a Breaker Block. When the price hits the basic level, the Breaker Block due to mitigation.
Switching Colors Theme Mode : Three modes "Off", "Light" and "Dark" are included in this parameter. "Light" mode is for color adjustment for use in "Light Mode".
"Dark" mode is for color adjustment for use in "Dark Mode" and "Off" mode turns off the color adjustment function and the input color to the function is the same as the output color.
🟣 Order Block Display
Show All Order Block : If it is turned off, only the last Order Block will be displayed.
Demand Main Order Block : Show or not show and specify color.
Demand Sub (Propulsion & BoS Origin) Order Block : Show or not show and specify color.
Supply Main Order Block : Show or not show and specify color.
Supply Sub (Propulsion & BoS Origin) Order Block : Show or not show and specify color.
🟣 Breaker Block Display
Show All Breaker Block : If it is turned off, only the last Breaker Block will be displayed.
Demand Main Breaker Block : Show or not show and specify color.
Demand Sub (Propulsion & BoS Origin) Breaker Block : Show or not show and specify color.
Supply Main Breaker Block : Show or not show and specify color.
Supply Sub (Propulsion & BoS Origin) Breaker Block : Show or not show and specify color.
🟣 Order Block Refinement
Refine Order Blocks : Enable or disable the refinement feature. Mode selection.
🟣 Alert
Alert Name : The name of the alert you receive.
Alert Demand OB Mitigation :
On / Off
Alert Demand BB Mitigation :
On / Off
Alert Supply OB Mitigation :
On / Off
Alert Supply BB Mitigation :
On / Off
Message Frequency :
This string parameter defines the announcement frequency. Choices include: "All" (activates the alert every time the function is called), "Once Per Bar" (activates the alert only on the first call within the bar), and "Once Per Bar Close" (the alert is activated only by a call at the last script execution of the real-time bar upon closing). The default setting is "Once per Bar".
Show Alert Time by Time Zone :
The date, hour, and minute you receive in alert messages can be based on any time zone you choose. For example, if you want New York time, you should enter "UTC-4". This input is set to the time zone "UTC" by default.
Display More Info :
Displays information about the price range of the order blocks (Zone Price) and the date, hour, and minute under "Display More Info".
If you do not want this information to appear in the received message along with the alert, you should set it to "Off".

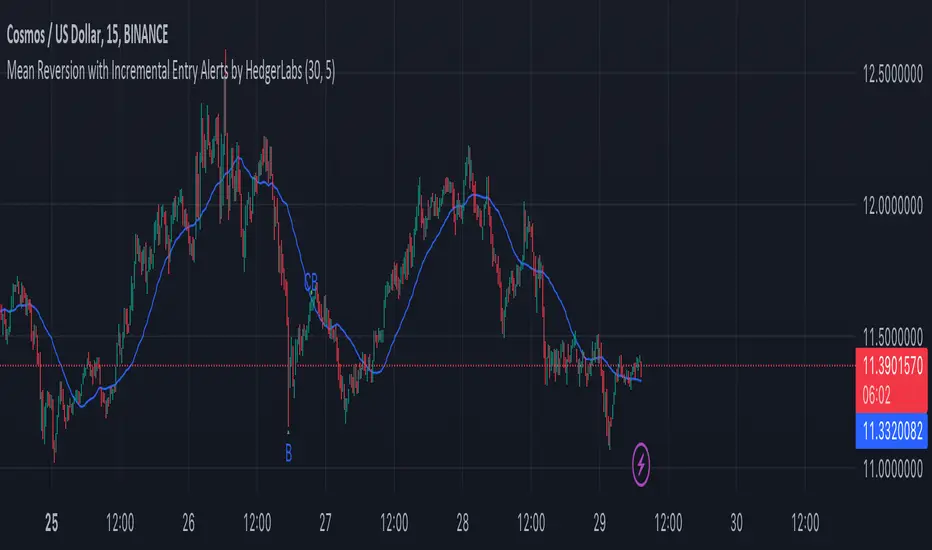
Mean Reversion with Incremental Entry Alerts by HedgerLabsThe "Mean Reversion with Incremental Entry Alerts" is a sophisticated TradingView indicator designed by HedgerLabs. It's built on the concept of mean reversion, a fundamental trading strategy in financial markets. This indicator is tailored for traders seeking systematic and disciplined entry points in volatile markets.
Key Features:
Moving Average (MA) Based: At its core, the indicator utilizes a simple moving average (SMA) as the baseline for mean reversion. You can customize the length of the MA according to your trading style.
Initial Entry Conditions: The script generates initial buy and sell alerts based on a defined percentage deviation from the moving average. This approach allows traders to enter trades at points where the price significantly deviates from its mean, potentially signaling a reversion opportunity.
Buy and Sell Signals: Clear visual cues are provided for buy and sell positions, making it easy to interpret and act upon the signals.
Close Conditions: In addition to entry signals, the indicator also plots closing signals (green and red crosses) when the price touches the moving average. This feature assists in timely exits from positions, aiming to optimize trade outcomes.
Alert System: Integrated alert conditions notify you when a new buy or sell order condition is met, as well as when to close existing positions. This ensures you never miss an opportunity or an exit point.
Usage Scenario:
This indicator is particularly useful in markets where prices tend to revert to a mean value over time. It's ideal for day traders who focus on asset price volatility.
Disclaimer:
Please note that this tool is for informational and educational purposes only and should not be considered as financial or investment advice. Trading involves substantial risk, including the potential loss of principal. We recommend conducting your research and consulting with a financial expert before making any investment decisions.
Change Analysis and AlertsThe "Change Analysis and Alerts" script in Pine Script allows you to analyze and visualize the percentage change of different values on a chart. It calculates the true change based on the closing prices and provides options to input custom values for comparison. The script also includes an alert feature that triggers when the true change exceeds a specified threshold.
Examples:
Analyzing True Change:
Show the true change between consecutive candle closes as a histogram.
Set a threshold for the true change and receive an alert when it surpasses the specified value.
Comparing Custom Values:
Input custom values to analyze the percentage change between different price levels (e.g., high-low, open-close).
Highlight the value with the highest change in each period.
Visualize the changes as columns on the chart for easy comparison.
By using the "Change Analysis and Alerts" script, traders and analysts can gain insights into the magnitude of price changes and receive alerts when significant changes occur.
Please note that this description and examples are provided for illustrative purposes and can be customized based on your specific needs and preferences.
If you need further assistance, feel free to ask.

Role Reversal Detection Alert [MsF]Japanese below / 日本語説明は英文の後にあります。
-------------------------
When you draw a horizontal line on the W top or W bottom and be waiting for roll reversal, have you ever missed it when it rebounded at the horizontal line? It is a helpful indicator to prevent such oversight.
After the candle touches the horizontal line (including the touch of the leg), and then the candle body passes the alert judgment horizontal line, it will be alert.
The horizon line and the alert judment horizon line should be entered as parameters.
- Parameter
Input Horizontal Value: Enter the horizontal value
Band Range by pips : Enter the offset from horizontal line by pips
-------------------------
WトップやWボトムに水平線を引いてロールリバーサルを待ってる時に見事水平線で反発したのに見逃すことはありませんか?
そんな見落としを防止するためのお助け的なインジケーターです。
メイン水平線にローソク(ひげ含む)タッチ後、からアラート判定水平線を実体で抜けた場合にアラートを発報します。
メイン水平線とアラート判定水平線はそれぞれパラメータで入力する必要があります。
<パラメータ>
Input Horizontal Value:メイン水平線の価格を入力します
Band Range by pips :メイン水平線からアラート判定水平線のオフセットをpipsで入力します