[PX] ADX BoxesHello guys,
today I would like to share an indicator that I had in my mind for quite some time. I call it ADX Boxes.
How does it work?
What the indicator does is very simple. Whenever the ADX falls below a certain threshold (which can be managed in the user input settings) a box will appear. The box will continue to grow as long as the ADX stays below the threshold. Once the ADX goes back above the threshold, the box will stop growing and will set its right border.
There are two modes, which can be used to determine the upper and lower border of the box. The first one is called "Extremes", which plots the borders the highest high and lowest low for the range below the threshold. The second one is called "Avg. High/Low", which plots the borders at the average high and average low within the range.
Furthermore, the indicator contains an option to show the average value of the detected range below the ADX threshold.
Just like all my other indicator scripts, this one comes with different styling options for boxes in progress, settled boxes and the average value.
Hopefully, some of you find it useful.
Make sure you leave a follow and a like :)
Happy trading!!
Cari skrip untuk "adx"

RSI + ADX + MACDINDICADOR COMBINADO DE RSI + ADX
Aprovecha las ventajas de cada indicador en uno solo.
Teniendo en un solo indicador el momentum de cada tendencia y la fuerza relativa con sus puntos de sobre compra y sobre venta.
También al poder analizar divergencias en el indicador oscilador RSI y poder crear estrategias de entrada con el ADX
-------------------------------------------------------------------------------------------------------------------------------------------------------------------------------
RSI + ADX COMBINED INDICATOR
Take advantage of each indicator in one.
Having in a single indicator the momentum of each trend and the relative strength with its points of overbought and oversold.
Also by being able to analyze divergences in the RSI oscillator indicator and being able to create entry strategies with the ADX
DERECHOS DEL CREADOR PARA: Dvd_trading
Trend Surfers - Momentum + ADX + EMAThis script mixes the Lazybear Momentum indicator, ADX indicator, and EMA.
Histogram meaning:
Green = The momentum is growing and the ADX is growing or above your set value
Red = The momentum is growing on the downside and the ADX is growing or above your set value
Orange = The market doesn't have enough momentum or the ADX is not growing or above your value (no trend)
Background meaning:
Blue = The price is above the EMA
Purple = The price is under the EMA
Cross color on 0 line:
Dark = The market might be sideway still
Light = The market is in a bigger move

ADX and DI LevelsADX:
ADX is used to quantify trend strength. ADX calculations are based on a moving average of price range expansion over a given period of time. The default setting is 14 bars, although other time periods can be used.1
ADX can be used on any trading vehicle such as stocks, mutual funds, exchange-traded funds and futures.
DI (+/-):
The directional movement index (DMI) is an indicator developed by J. Welles Wilder in 1978 that identifies in which direction the price of an asset is moving. The indicator does this by comparing prior highs and lows and drawing two lines: a positive directional movement line (+DI) and a negative directional movement line (-DI). An optional third line, called the average directional index (ADX), can also be used to gauge the strength of the uptrend or downtrend.
This indicator has the length changed from 14 to 9 so you can have more updated price calculation
I also add the 4 levels I use for day trading; the 10, 20, 30, 40-50 are the levels I like to see the Di to break over.
A lot of traders use different levels, but these I have and found most useful. You can set alerts when any Di crosses over the 40 for true trend breakout!

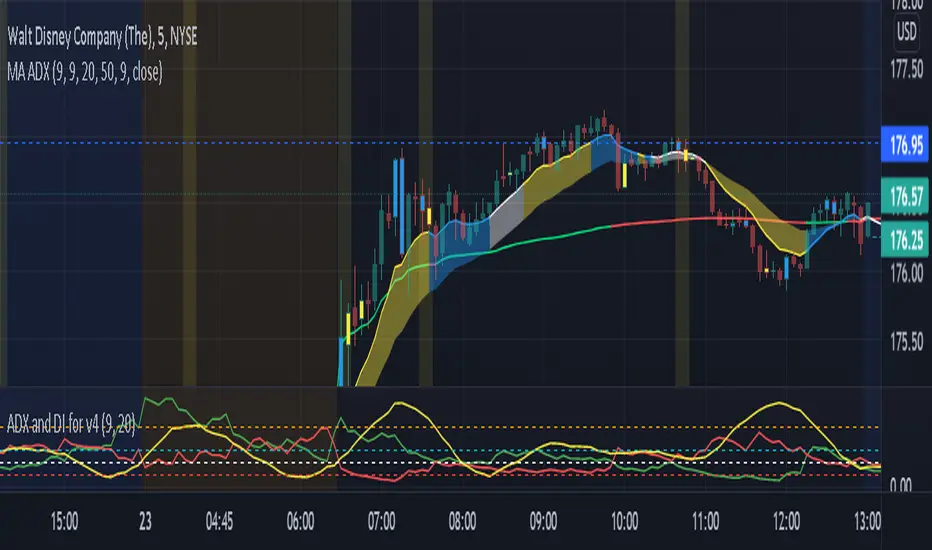
ADX and DI EMA Trend LineADX: The average directional index (ADX) is a technical analysis indicator used by some traders to determine the strength of a trend.
DI: The directional movement index (DMI) is an indicator developed by J. Welles Wilder in 1978 that identifies in which direction the price of an asset is moving. ... Conversely, if -DI is above +DI, then there is more downward pressure on the price. This indicator may help traders assess the trend direction.
EMA: The exponential moving average (EMA) is a technical chart indicator that tracks the price of an investment (like a stock or commodity) over time. The EMA is a type of weighted moving average (WMA) that gives more weighting or importance to recent price data.
UPDATE: This current indicator has been changed from MA and EMA trend lines the 9 and the 50, and also added Inside & Outside bars...You can toggle anything Off or On
The code in this indicator calculates the value of each ADX and DI (+/-) value to give a green color for DI + trend and a red color for DI - trend, and lastly white for no direction...The nice part of this code is the 50 EMA will be your bull or bear transition level. The colors heading to the ema will tell you if we are still bull or bear heading to the EMA.
I also changed the ADX to become the 9 EMA with Yellow showing a ADX positive rate of change, Blue showing a negative rate of change, and white to show that the trend has no direction.
Open settings to adjust how big or small you want the ema lines to be and adjust colors for what works for you. Hopefully you enjoy this update
[WJ] - ADX v2 [DMI, Alerts, Histogram, Customizable]A handy all-in-one package for DMI and ADX
Color-coordinated line for DMI with an EMA and histogram to gauge momentum, mark potential reversals, and quickly gather all the information you need to make your decisions.
Quick take-aways:
- Color of the ADX line indicates the current trend
- An ADX below the EMA indicates a potentially falling/reversing trend
- Customizable line w/ alerts for ADX crossovers
- Histogram to help catch potential reversals faster, and to gauge the momentum
Please let me know what you think, and in any features you think would increase the effectiveness of this amazing tool.

ZeroLag ema + adx = trueCombined LazyBears ZeroLag EMA and CapnOscars moving average ADX. Here's the result.
I figured it could be used as a trend trendtrading system,
ADX red + ema cross downards = short.
ADX green + ema cross up = long.
ADX black + ema cross = no trade
Or something along those line. A way filter out whipsaws.
This is just something I threw together in 5 min, so din't go all in tho. Haven't had time to test.
2 ADX
3 Z-EMAs
Colors/settings can be customized.

TTP SuperTrend ADXThis indicator uses the strength of the trend from ADX to decide how the SuperTrend (ST) should behave.
Motivation
ST is a great trend following indicator but it's not capable of adapting to the trend strength.
The ADX, Average Directional Index measures the strength of the trend and can be use to dynamically tweak the ST factor so that it's sensitivity can adapt to the trend strength.
Implementation
The indicator calculates a normalised value of the ADX based on the data available in the chart.
Based on these values ST will use different factors to increase or reduce the factor use by ST: expansion or compression.
ST expansion vs compression
Expanding the ST would mean that the stronger a trends get the ST factor will grow causing it to distance further from the price delaying the next ST trend flip.
Compressing the ST would mean that the stronger a trends get the ST factor will shrink causing it to get closer to the price speeding up the next ST trend flip.
Features
- Alerts for trend flip
- Alerts for trend status
- Backtestable stream
- SuperTrend color gets more intense with the strength of the trend

Soheil PKO's 5 min Hitman Scalp - 3MA + Laguerre RSI + ADX [Pt]Someone sent me this strategy found on YouTube. It is Soheil PKO's "The Best and Most Profitable Scalping Strategy" Best way to find out is to code it =)
This strategy uses Moving Average Ribbon, Laguerre RSI, and ADX. This script only displays the MA ribbon, you will need to add Laguerre RSI and ADX separately.
Long Entry Criteria:
- 16 EMA > 48 EMA > 200 SMA
- Laguerre RSI > 80
- ADX > 20
Long Exit Criterion:
- 16 EMA < 48 EMA
Short Entry Criteria:
- 16 EMA < 48 EMA < 200 SMA
- Laguerre RSI < 20
- ADX > 20
Short Exit Criterion:
- 16 EMA > 48 EMA
As mentioned in the video, risk management is very important, especially for scalping strategies. Therefore, I've added option for setting Stop Loss and Price Target in the options for you guys to play with.
All parameters are configurable.
Enjoy~~

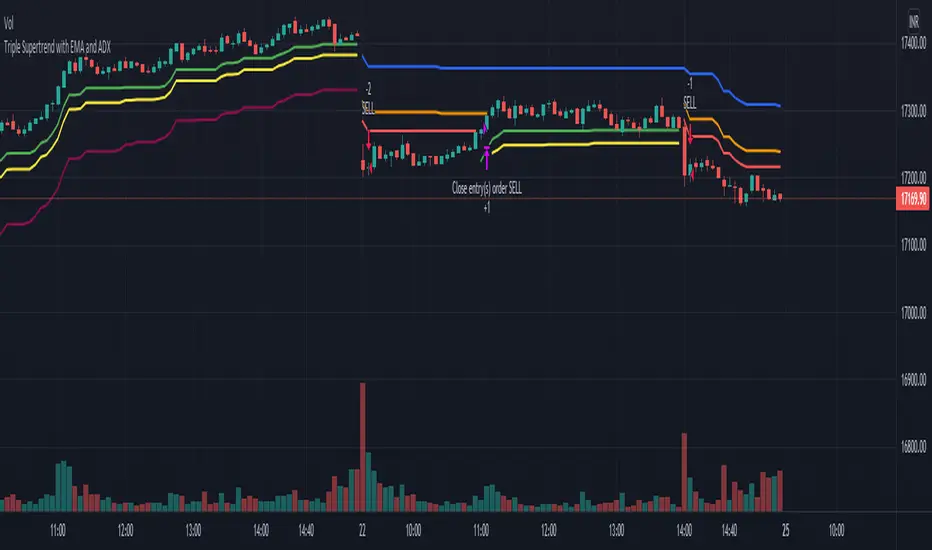
Triple Supertrend with EMA and ADX strategyPublishing a strategy that includes adx and ema filter as well
Entry: all three Supertrend turns positive. If a filter of ADX and EMA is applied, also check if ADX is above the selected level and close is above EMA
Exit: when the first supertrend turns negative
opposite for short entries
A FIlter is given to take or avoid re-enter on the same side. For example, After a long exit, if the entry condition is satisfied again for long before the short single is triggered it takes re-entry if selected.
Squeeze M + ADX + TTM (Trading Latino & John Carter) by [Rolgui]About this indicator:
This indicator aims to combine two good performing strategies, which can be used separately or together, mainly for investment positions, although it can also be used for intraday trading.
Strategy 1) Squeeze Oscillator and Average Directional Index:
This strategy is taught by Jaime Aibsai, which determines market entries based on reading the direction of the price movement (Directionality of the Oscillator) along with the strength of the Oscillator (Slope of the ADX).
Both tools are configured according to Jaime Abisai's strategy, by default (note that point 23 of the ADX is represented by point 0 on the panel, to make reading easier, its interpretation is not affected). Anyway you can adjust the input data according to your interest.
*You can see this setting in the first panel.
Strategy 2) Squeeze Momentum and Trade The Market Waves:
This strategy can be consulted either in John F. Carter's books or on his website.
This market reading is based on Price Volatility (Bollinger Bands and Keltner Channels interaction) and its Trend (Exponential Moving Averages), showing entries at times when price volatility is low and taking filtering active trend using T.T.M. Waves.
To configure the indicator in the same way that Carter does, it would be enough to turn off the ADX, turn on the Squeeze Momentum signals along with the T.T.M. Waves, and importantly, change the Linear Momentum value to 12 (this configuration can be found in his book).
*You can see this setting in the second panel.
Why this indicator?
I've added and removed the above flags as I needed to query them (which became tedious for me). The main objective of having merged them into one is to make their reading more agile and comfortable and thus improve the decision-making capacity of the trader who wishes to use them.
Credits and Acknowledgments:
I would like to give credits to other authors, for the sections of code that I have used to make this technical indicator. Thanks to @LazyBear, @matetaronna, @jombie and @joren for contributing to the community and keeping their code open. It is priceless!
Feel free to combine and practice your trading with both strategies, personally, they improved my profitability and this is why I recommend researching more about them. I've been using it for crypto investing, let me know if it's worth for you on stock market!
If you have any questions or suggestions you can leave it in the comments!
Greetings!

Scalping EMA ADX RSI with Buy/Sell AlertsThis is a study indicator that shows the entries in the strategy seen in one of the youtube channel so it does not belong to me. I can't tell who it is because it's against the House Rules to advertise but you can find out if you look for it on youtube. Default values of oscilators and ema adjusted as suggested. He says he got the best results in 5 min timeframe but i tried to make things as modifiable as possible so you can mess around with the settings and create your own strategy for different timeframes if you'd like. Suggested to use with normal candlestick charts. The blue line below indicates the ADX is above the selected threshold set in the settings named "Trend Ready Limit". You can set alerts for Buy, Sell or Buy/Sell signal together.
The entry strategy itself is pretty straight forward.
The rules for entry are as follows, the script will check all of this on auto and will give you buy or sell signal :
Recommended time frame: 5 min
For Long Entry:
- Check if price above the set EMA (Can disable this rule if you'd like in the settings)
- RSI is in Oversold
- ADX is above set "Trend Ready" threshold (Meaning there is a trend going on)
- Price must approve the trend of previous candles. This is bullish for buy entries and bearish for sell entries.
- Enter with stop loss below last swing low with 1:1 or 1.5:1 take profit ratio.
For Short Entry:
- Check if price below the set EMA (Can disable this rule if you'd like in the settings)
- RSI is in Overbought
- ADX is above set "Trend Ready" threshold (Meaning there is a trend going on)
- Price must approve the trend of previous candles. This is bullish for buy entries and bearish for sell entries.
- Enter with stop loss above last swing high with 1:1 or 1.5:1 take profit ratio.
This is my first indicator. Let me know if you want any updates. I am not sure if i can add everything but i'll try nonetheless.
Changed: Signals will check up to 2 candles before if the RSI is below or above the set value to show signal. This is because sometimes the entry signal is right but the response might be a bit late.

KINSKI ADXThis ADX indicator (Average Directional Index) tries to estimate the strength of a trend. The Average Directional Index is derived from the positive (+DI) and the negative directional indicator (-DI). The direction of movement is determined by comparing the highs and lows of the current and past periods.
As soon as the indicator determines a trend strength for upward or downward trend, a label is displayed. An upward trend is labelled "Bullish Trend". The downward trend bears the label "Bearish Trend".
The clouds in the background represent the movements of the Average Directional Index High/Low:
Color orange: neutral, uncertain in which direction it is going.
Color green: upward trend
Color red: downward trend
The line represents the average value of the ADX signal:
Color orange: neutral: still uncertain in which direction it is going
Color green / outgoing line: upward trend
Color green / descending line: weakening upward trend
Color red / exiting line: downward trend
Color red / descending line: weakening downward trend
The following configurable options are possible:
"ADX Smoothing
Directional Index Length
Level Range
Level Trend

Wolfs ADX + DII have created an alternative visualisation of the ADX + DI indicator created by MasaNakamura, credits to them for providing the source code! :-)
The histogram represents the distance between the DI+ and the DI-. The crossing of the histogram is equal to the crossing of the DI lines.
The ADX line is coloured based on the threshold.
This creates a clean representation of the ADX + DI.

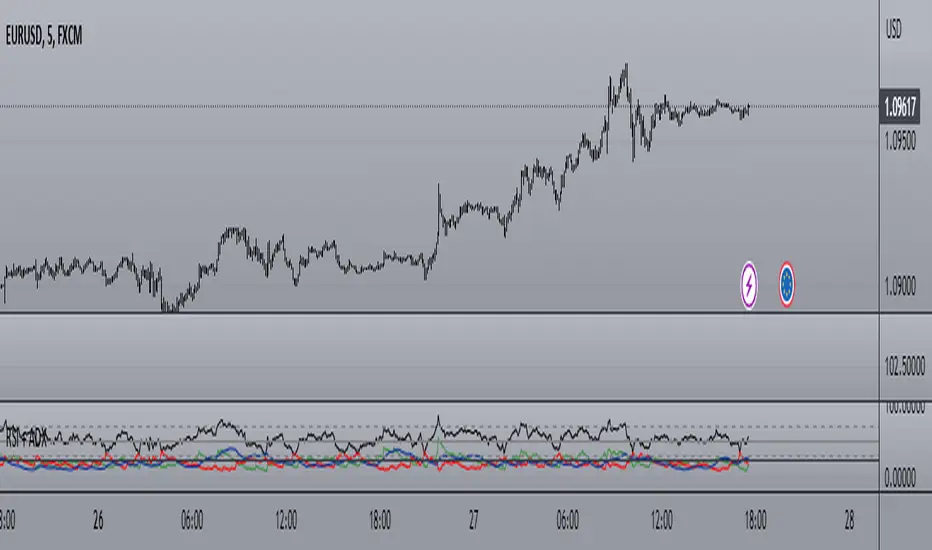
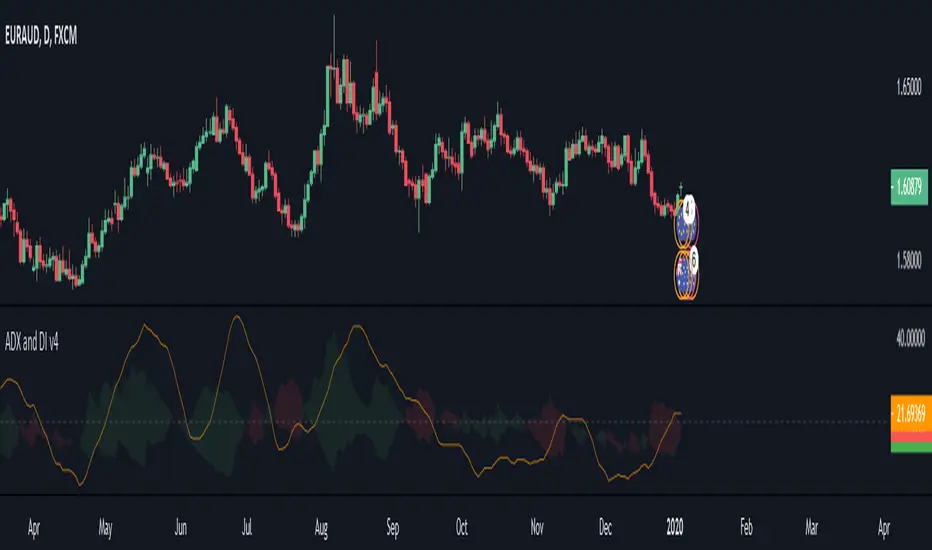
[PX] ADX and DI v4Hey guys,
I recently used the "ADX and DI" indicator in a variety of my own scripts. Because I keep on developing version 4 scripts and the "ADX and DI" indicator is developed in one of the previous PineScript versions, I had to update the old script every time I wanted to use it. I decided to publish the updated version and also changed a few things:
- ADX color is now orange
- Instead of plotting the DI+ and DI- lines, it's filling the space between the two (can be changed in the "style"-section)
Maybe some of you find it useful. If so, leave a like or follow :)
Happy trading,
paaax
P.S: The original indicator was developed by the user @MasaNakamura. Thanks for your great work!
Vol-Pace Projected-ATR-ADX-Alert-MAThe VolSC indicator analyzes stock volume trends with a focus on the Pace metric, which projects today's volume as a percentage of the 30-day average, highlighting unusual activity (e.g., over 200% turns bright green with alerts). The phantom projection bar, a wide green histogram to the right of the last bar, visually represents this projected volume on daily charts only, aiding quick identification of potential volume surges without cluttering intraday or weekly views. Additional features include ADX strength, ATR averages, and customizable table display for comprehensive insights.
Key Features:
* Primary Indicator: Volume with ADX (Average Directional Index) text.
* Pacing and Alerts: Calculates the volume pace for the day. Features an unusual volume alert with an adjustable threshold (e.g., 200%).
* Volume Projection: Projects a visual "Phantom Volume" for the day, offset to the right of the actual volume bar.
* ATR Indicator: Displays the 2x ATR (Average True Range) value as text.
* Volume Average: Displays the ADV (Average Daily Volume) Moving Average as text.
* Customization: Most settings are adjustable.

Volume Based RSI with ADXThe RSI indicator is a powerful tool that utilizes both volume and time to determine market trends. When there is a low volume of trades in a short period of time, but the trading activity is high, it is considered bullish or bearish. In the case of a bullish trend, the RSI indicator will display a green color, while a bearish trend will be represented by a red color. If there is no trading activity, the indicator will display a gray color. Additionally, if the ADX level meets the threshold level, the indicator will display a blue color. However, if the ADX level does not meet the threshold level, the indicator will revert back to displaying a gray color.

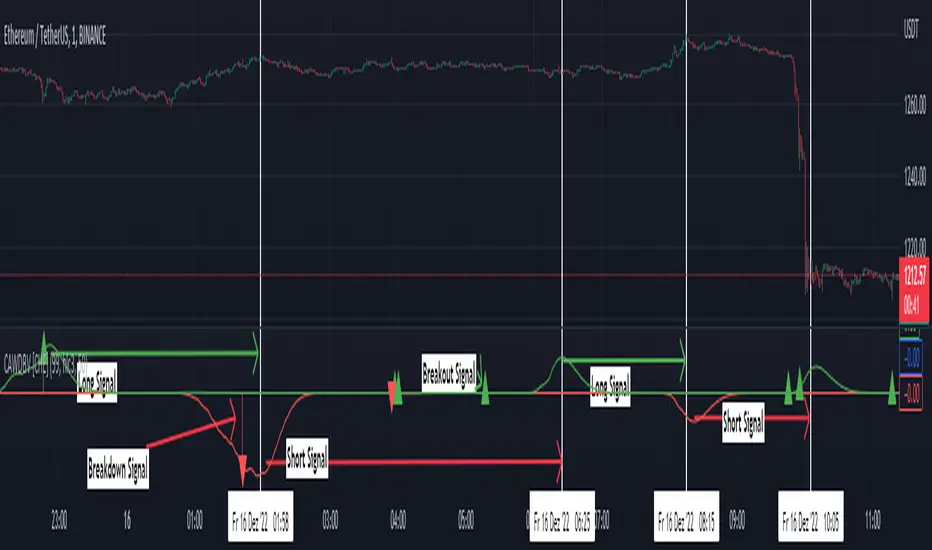
Clean ADX with bidirectional Breakout VolumeThe default Average Directional Index (ADX) helps traders determine the strength of a trend, not its actual direction. The Clean ADX helps traders determine the strength of a trend on a longer time, and the possible direction on different timeframes.
The bidirectional Breakout Volume determines both directions of breakout or breakdown volume. When volume is high by comparing the previous volume high over n periods to the current volume or when volume is lower by comparing the previous volume low over n periods to the current volume.
If the current volume exceeds the previous volume high or low, then the indicator columns will turn red or green.
This indicator should make trading easier and improve analysis. Nothing is worse than indicators that give confusingly different signals.
The combination of the first and second indicator therefore makes perfect sense to me and now you are able to find your long or short trends earlier.
I hope you enjoy my new ideas
best regards
Chervolino
StableF-AdxThe script is ADX-DMI modified verison
-Adx is labeled as Weak trend Below 25 and strong Trend above 25
-Hline is drawn at 25 for better clarification of crossover above 25
-Wait for crossover in +dmi and -dmi and to cross above 25 for any trend clarifcation
-crossover i.e upside cross of +dmi over -dmi is shown buy UP shape
-crossunder i.e downside cross of +dmi over -dmi is Shown buy DN shape
--disclaimer --This is just modified version of Bulit in ADX_DMI indicatior \ NOT advised for buy / Sell purpose

VWMA with kNN Machine Learning: MFI/ADXThis is an experimental strategy that uses a Volume-weighted MA (VWMA) crossing together with Machine Learning kNN filter that uses ADX and MFI to predict, whether the signal is useful. k-nearest neighbours (kNN) is one of the simplest Machine Learning classification algorithms: it puts input parameters in a multidimensional space, and then when a new set of parameters are given, it makes a prediction based on plurality vote of its k neighbours.
Money Flow Index (MFI) is an oscillator similar to RSI, but with volume taken into account. Average Directional Index (ADX) is an indicator of trend strength. By putting them together on two-dimensional space and checking, whether nearby values have indicated a strong uptrend or downtrend, we hope to filter out bad signals from the MA crossing strategy.
This is an experiment, so any feedback would be appreciated. It was tested on BTC/USDT pair on 5 minute timeframe. I am planning to expand this strategy in the future to include more moving averages and filters.

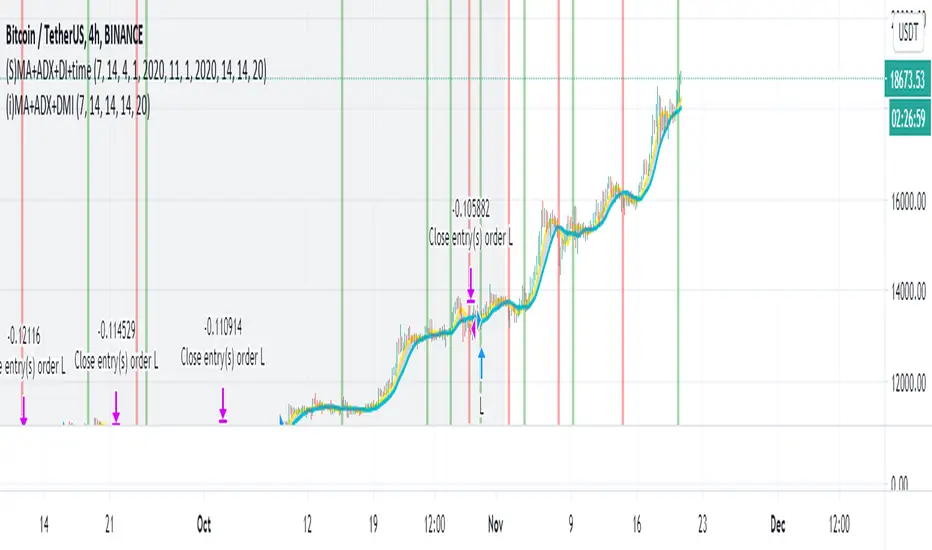
Simple Moving Average + ADX + DMI + Time Range Test
Use long and short moving average to look for a potential price in/out. (default as 14 and 7, bases on the history experience)
ADX and DMI to prevent the small volatility and tangling MA.
This script allows you to set the beginning & end time to test the bullish & bearish market.
If you want an indicator version, here is it.
Thanks.
Kal’s ADX Overlap with MACD FilterIt’s a method/study to find trending stocks/cryptocurrencies which uses two different periods (14, 5) ADX Overlap with a MACD Filter. The MACD filter may or may not be used.
More Details will follow as time permits. Please let me know if I am missing anything…..
Legal Disclaimer: I am not bribed to write here and I am not seeking insider favors. I wrote here so I get replies from fellow viewers to educate myself and for my daily expenses. Hence, if anyone uses this post for making their decisions, I am not responsible for any failures incurred.
Safe Trading!
Kal Gandikota
PS: If you found this script interesting and edifying please follow and upvote.
PS2: Please kindly donate for my daily expenses (atleast as you would on streets) at the following addresses:
'BTC Wallet' - 1NeDC1GvpFa49DFLuT1v28ohFjqtoWXNQ5
ETH Wallet - 0x0450DCB7d4084c6cc6967584263cF6fBebA761D1
'BTS Wallet' - chip-maker
QTUM Wallet - QhqqV3WQV236Tz5ZbPceXXvU8aK2N4i78A
NEO Wallet - AUdiNJDW7boeUyYYNhX86p2T8eWwuELSGr
PS3: To open a cryptocurrency trading account at the brokerage where I trade most for now, please kindly use the following website(with referral code attached):
www.binance.com
PS4: For more information on ADX and MACD, please 'Google' or search here on Tradingview

[naoligo] Simple ADXI'm publishing this indicator just for study purposes, because the result is exactly the same as DMI without the smoothing factor. It is exactly the same as ADX Wilder from MT5.
I was looking for the algorithm all over and it was a pain to find the right formula, meaning: one that would match with the built-in ones. After several study and comparison, I still didn't find the algorithm that match with the MT5's built-in simple ADX ...
Enjoy!
