Dynamic Timeframe Trend AnalyzerPurpose and Core Logic
This indicator automatically adjusts its calculations based on the current chart’s timeframe, allowing traders to analyze trends, momentum, and mean reversion opportunities without manually changing indicator settings for each interval. It detects potential long or short setups by combining several techniques:
Dynamic Timeframe Factor
The script compares the current timeframe to a base (e.g., 5 minutes) and calculates a “factor” to scale certain parameters, such as EMA lengths or ATR settings. This reduces the need to reconfigure indicators when switching timeframes.
Regime Detection
It uses ADX (Average Directional Index) to classify the market as strongly trending, moderately trending, choppy, or in a potential mean-reversion phase.
RSI (Relative Strength Index) is also monitored for extreme levels (e.g., overbought/oversold) to detect potential reversal zones.
Volume is compared to a moving average to confirm or refute volatility conditions.
Trend & Mean Reversion Signals
EMA Alignment (8/21/55) helps identify bullish or bearish phases (strong bull if all EMAs align upward, strong bear if aligned downward).
For mean reversion opportunities, the script checks if ADX is sufficiently low (indicating weak or no trend) while price and RSI are at extreme levels—suggesting a snapback or countertrend move may occur.
Dynamic Stop Loss & Take Profit
Uses ATR (Average True Range) to set initial stop-loss (SL) and take-profit (TP) levels, then adjusts these levels further with “regime multipliers” based on whether the market is in a high-volatility trend or a quieter mean-reversion environment.
This approach aims to place stops and targets in a more adaptive way, reflecting current market conditions rather than a one-size-fits-all approach.
Visual Aids
Color-coded chart backgrounds (e.g., greenish for bullish trend, red for bearish, yellow/orange for mean reversion).
Triangles to show recent bullish/bearish signals.
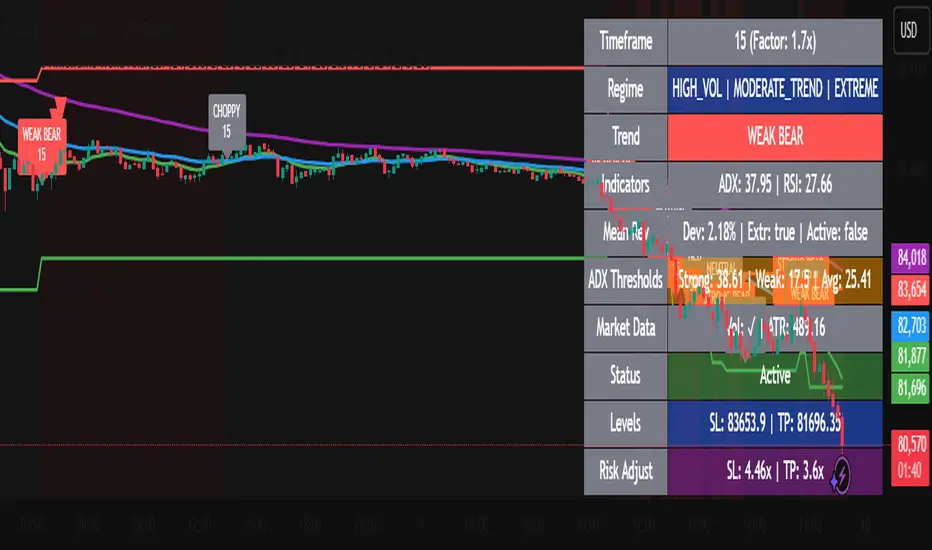
A status table in the top-right corner (optional) displaying key metrics like ADX, RSI, dynamic thresholds, current SL/TP levels, and whether a stop loss has been hit.
How It Works Internally
ADX & Dynamic Thresholds:
A moving average (adx_mean) and standard deviation (adx_std) of the ADX are calculated over a lookback period to define “strong” vs. “weak” ADX thresholds.
This allows the script to adapt to changing volatility and trend strength in different markets or timeframes.
Mean Reversion Criteria:
The indicator checks if price deviates significantly from its own moving average, alongside RSI extremes. If ADX suggests no strong directional push (i.e., the market is “quiet”), it may classify conditions as mean-reverting.
Regime Multipliers:
Once the script identifies the market regime (e.g., strong uptrend, choppy, mean reversion), it applies different multipliers to the user-defined base values for stop-loss and take-profit. For instance, strong trending conditions might allow for wider stops to handle volatility, while mean reversion signals use tighter exits to capture quick reversals.
How to Use It
Timeframe Agnostic
Simply apply it to any timeframe (from 1-minute up to daily or weekly). The “Dynamic Timeframe Factor” will scale the indicator parameters automatically.
Look for Buy/Sell Triangles
When the script detects a valid bullish trend shift or a mean-reversion long setup, it plots a green triangle under the price bar. Conversely, it plots a red triangle above the price bar for bearish or mean-reversion short setups.
Check the Status Table
The table in the top-right corner summarizes the indicator’s current readings: ADX, RSI, volume trends, and the market regime classification.
The table also shows if a stop loss has been hit (SL Hit) and displays recommended SL/TP levels if a signal is active.
Stop Loss & Take Profit
The script plots lines for SL and TP on your chart after a new signal. These lines are automatically adjusted based on ATR, volume conditions, and ADX-derived multipliers.
Mean Reversion vs. Trend-Following
If you see a “Mean Rev” state in the table or the background turning yellow/orange, it suggests potential countertrend trades. Conversely, “STRONG BULL” or “STRONG BEAR” states favor momentum-based entries in the prevailing direction.
Originality & Benefits
Adaptive to Timeframe: Many indicators require reconfiguration when switching from short to long timeframes. This script automates that process using the “timeframe factor” logic.
Regime-Based SL/TP: Instead of fixed risk parameters, the script dynamically tunes stop and target levels depending on whether the market is trending or reverting.
Comprehensive Market View: It combines multiple factors—ADX, RSI, volume, moving averages, and volatility measurements—into a single, integrated framework that categorizes the market regime in real time.
Best Practices & Notes
Timeframes: It typically performs well on intraday timeframes (5m, 15m, 1H) but can also be used for swing trading on 4H or Daily charts.
Settings: The defaults are a good starting point, but you can adjust the base ATR multiplier or ADX lookbacks if you prefer a different balance between sensitivity and stability.
Risk Management: This indicator is not a guarantee of any specific results. Always use proper risk management (position sizing, stop-losses, and diversified strategies).
Alert Conditions: Built-in alert conditions can notify you when a new long or short signal appears, or when a stop loss is triggered.
Cari skrip untuk "adx"
Trend Type Indicator by BobRivera990Usage:
The purpose of this indicator is to programmatically determine the type of price trend using technical analysis tools.
You can do a quick check on the asset’s higher and lower time frames. For example, if you are trading on an H1 chart, you can check the m5 chart to ensure that the trend is in the same direction and similarly check the H4 chart to ensure that the higher time frame price is also moving in the same direction.
If multiple time frame charts confirm a similar trend, then it is considered a very strong trend and ideal for Trend trading.
Remarks:
By default, the last status is related to 8 periods before the latest closing price.
Related definitions:
The three basic types of trends are up, down, and sideways.
1. Uptrend
An uptrend describes the price movement of a financial asset when the overall direction is upward. The uptrend is composed of higher swing lows and higher swing highs.
Some market participants ("long" trend traders) only choose to trade during uptrends.
2. Downtrend
A downtrend refers to the price action of a security that moves lower in price as it fluctuates over time.
The downtrend is composed of lower swing lows and lower swing highs.
3. Sideways
A sideways trend is the horizontal price movement that occurs when the forces of supply and demand are nearly equal. This typically occurs during a period of consolidation before the price continues a prior trend or reverses into a new trend.
How it works:
Step 1: Sideways Trend Detection
In this step we want to distinguish the sideways trend from uptrend and downtrend. For this purpose, we use two common technical analysis tools: ATR and ADX
1. Average True Range (ATR)
The average true range (ATR) is a technical analysis indicator that measures market volatility.
We also use a 20-period moving average of the ATR.
When the ATR is below the average of its last 20-periods, it means that the rate of price volatility has decreased and we conclude that the current trend is sideways
2. Average Directional Index (ADX)
The average directional index (ADX) is a technical analysis indicator used by some traders to determine the strength of a trend.
The trend has strength when ADX is above 25.
So when the ADX is less than or equal to 25, there is no strong trend, and we conclude that the current type of trend is sideways.
Step 2: Detect uptrend from downtrend
If it turns out that the current price trend is not sideways, then it is either uptrend or downtrend.
For this purpose, we use plus and minus directional Indicators (+ DI & -DI).
A general interpretation would be that during a strong trend, when +DI is higher than -DI, it is an uptrend. When -DI is higher than +DI, it is a downtrend.
Parameters:
"Use ATR …" ________________________// Use Average True Range (ATR) to detect Sideways Movements
"ATR Length"_______________________ // length of the Average True Range (ATR) used to detect Sideways Movements
"ATR Moving Average Type" ___________// Type of the moving average of the ATR used to detect Sideways Movements
"ATR MA Length" ____________________// length of the moving average of the ATR used to detect Sideways Movements
"Use ADX ..."_______________________ // Use Average Directional Index (ADX) to detect Sideways Movements
"ADX Smoothing”____________________// length of the Average Directional Index (ADX) used to detect Sideways Movements
"DI Length"_________________________// length of the Plus and Minus Directional Indicators (+DI & -DI) used to determine the direction of the trend
"ADX Limit" ________________________// A level of ADX used as the boundary between Trend Market and Sideways Market
"Smoothing Factor"__________________// Factor used for smoothing the oscillator
"Lag"______________________________// lag used to match indicator and chart
Resources:
www.investopedia.com

Weekly Regime Filter - Trend + Momentum + Structure (MTF)A multi-timeframe weekly regime indicator that classifies market conditions into BULL , BEAR , or CHOP using three components: trend, momentum, and market structure.
Works on any timeframe while always referencing weekly data — no repainting.
━━━━━━━━━━━━━━━━━━━━━━━━━━━━━━
🎯 WHAT IT DOES
Answers one question: What is the weekly regime?
• Trend — EMA hierarchy (Price > EMA Fast > EMA Slow)
• Momentum — DI+ vs DI- with optional ADX filter
• Structure — Break of Structure (BOS) and Change of Character (CHOCH)
BULL = All three bullish
BEAR = All three bearish
CHOP = Mixed signals
━━━━━━━━━━━━━━━━━━━━━━━━━━━━━━
⚡ KEY FEATURES
• Multi-Timeframe (MTF) — View on 1H, 4H, Daily; regime stays consistent
• Auto-Detect Asset Type — Automatically applies optimized settings for Crypto, Stocks, Forex, Gold, Silver, Oil, Commodities
• BOS/CHOCH Labels — Visual market structure breaks on chart
• Live Status Panel — Shows regime, components, and active parameters
• Non-Repainting — Uses confirmed weekly closes only
━━━━━━━━━━━━━━━━━━━━━━━━━━━━━━
📊 ASSET PRESETS
• Crypto — EMA 50/200, ADX Off, Pivot 2
• Stocks/Indices — EMA 50/200, ADX >20, Pivot 3
• Forex — EMA 30/100, ADX >25, Pivot 2
• Gold — EMA 40/150, ADX >20, Pivot 3
• Silver — EMA 40/150, ADX >22, Pivot 3
• Oil — EMA 30/100, ADX >25, Pivot 2
• Commodities — EMA 40/120, ADX >20, Pivot 3
Select "Custom" to use your own values.
━━━━━━━━━━━━━━━━━━━━━━━━━━━━━━
📈 HOW TO USE
For Swing Trading:
• Set chart to Daily
• Use Auto-Detect or select preset
• Long only when BULL, short only when BEAR
• Reduce size or avoid when CHOP
Structure Signals:
• CHOCH ↑ after bear regime = Early reversal signal
• CHOCH ↓ after bull regime = Tighten stops
• BOS in regime direction = Trend continuation
━━━━━━━━━━━━━━━━━━━━━━━━━━━━━━
🔔 ALERTS
• Regime → BULL
• Regime → BEAR
• CHOCH → Bull
• CHOCH → Bear
━━━━━━━━━━━━━━━━━━━━━━━━━━━━━━
⚙️ SETTINGS
Preset: Auto-Detect, Crypto, Stocks, Forex, Gold, Silver, Oil, Commodities, Custom
Custom Settings (when Custom selected):
• EMA Fast/Slow lengths
• ADX Length & Threshold
• ADX Filter toggle
• Pivot Left/Right
Display:
• Plot Weekly EMAs
• Show BOS/CHOCH Labels
• Show Regime Background
• Background Opacity
• Show Status Label
━━━━━━━━━━━━━━━━━━━━━━━━━━━━━━
📝 NOTES
• Needs ~200 weeks of history for full calculation
• Weekly signals are slower by design — filters noise
• Not a standalone system — combine with entries and risk management
• When using presets, Custom input fields won't visually update (Pine limitation) — status label shows actual values

VIOP Scalping - OriginalVIOP Scalping – Original is a rule-based scalping strategy ported from an original C# logic set. It aims to trade only when trend direction, momentum, and trend strength align, then manages the position using fixed take-profit/stop-loss percentages with an optional trailing mechanism to protect gains during favorable moves.
This strategy is provided for educational and backtesting purposes only. It is not financial advice and does not guarantee profitability. Always test thoroughly before any live usage.
Core Concept
Follow the dominant WMA trend, confirm momentum with EMA separation, filter conditions with RSI + ADX, then exit using fixed TP/SL with trailing behavior after a defined profit threshold.
How the Strategy Works
Trend Direction is defined by WMA: above WMA = long bias, below WMA = short bias.
Momentum is measured via Fast EMA vs Slow EMA and the EMA difference.
Trend Strength is confirmed using ADX (must exceed a threshold).
RSI filters trades to avoid entering when momentum is likely overextended or weak.
A no-trade session blocks entries during a predefined time window (default 09:30–10:05).
Exit logic uses fixed percent TP/SL, with an optional trailing mechanism that activates after a profit threshold.
Inputs and Settings
Trend and Indicator Settings
Main Trend WMA: Determines directional bias (price above = long, price below = short).
Fast EMA / Slow EMA: Used to measure momentum and directional separation.
RSI Period: Filters entries based on RSI range constraints.
ADX Period: Measures trend strength (must exceed threshold to allow entries).
Threshold Settings
EMA Difference Threshold: Minimum EMA separation required to validate momentum.
ADX Threshold: Minimum ADX required to confirm trend strength.
RSI Long Ceiling: RSI must remain below this value for long entries.
RSI Short Floor: RSI must remain above this value for short entries.
Risk Management Settings
Take Profit %: Default TP distance in percent.
Strong Trend Take Profit %: Higher TP used when a “strong trend” condition is detected.
Stop Loss %: Fixed SL distance in percent.
Trailing Activation %: Profit threshold at which trailing starts.
Trailing Distance %: Trailing offset distance used once trailing is active.
Time Filter
No-Trade Hours: Default session is 09:30–10:05. During this window, the strategy does not open new trades.
Entry Logic
No-Trade Time Filter
If the current bar falls inside the no-trade session, entries are blocked.
Long Entry Conditions
Price is above the WMA trend line.
EMA difference is positive and greater than the EMA Difference Threshold.
EMA momentum is increasing (current EMA diff > previous EMA diff).
RSI is within the defined range (RSI > 48 and RSI < RSI Long Ceiling).
Close is higher than the previous close.
ADX is above the ADX Threshold.
Short Entry Conditions
Price is below the WMA trend line.
EMA difference is negative and lower than -EMA Difference Threshold.
Bearish momentum is increasing (current EMA diff < previous EMA diff).
RSI is within the defined range (RSI < 52 and RSI > RSI Short Floor).
Close is lower than the previous close.
ADX is above the ADX Threshold.
Strong Trend Logic (Dynamic TP Selection)
If price is far from the WMA (absolute distance > 20 points) AND EMA separation is strong (absolute EMA diff > 1.5 points), the strategy treats the environment as a strong trend.
In strong trend mode, the strategy uses “Strong Trend Take Profit %” instead of the default “Take Profit %”.
Exit Management (TP/SL + Trailing)
The strategy uses fixed percentage-based TP and SL levels.
Trailing logic is enabled via strategy.exit and activates only after price moves in profit by the defined Trailing Activation %.
Once activated, trailing follows price using the defined Trailing Distance % offset.
This is designed to secure partial gains during extended moves while still allowing room for continuation.
What You See on the Chart
WMA Trend Line (Main Trend Filter).
Fast EMA and Slow EMA (Momentum Confirmation).
Strategy entry/exit markers generated by TradingView.
Recommended Use
Scalping systems that rely on trend-following and momentum confirmation.
Markets where ADX filtering helps avoid choppy conditions.
Traders who want a simple, parameter-driven TP/SL system with trailing after confirmation.
Important Notes
The no-trade session depends on your chart/session settings. Ensure your symbol/session configuration matches your intended market hours.
Percent-based exits scale with price; results will vary across instruments and volatility regimes.
Always validate behavior using bar replay, forward testing, and realistic commission/slippage assumptions.

OpenAI Signal Generator - Enhanced Accuracy# AI-Powered Trading Signal Generator Guide
## Overview
This is an advanced trading signal generator that combines multiple technical indicators using AI-enhanced logic to generate high-accuracy trading signals. The indicator uses a sophisticated combination of RSI, MACD, Bollinger Bands, EMAs, ADX, and volume analysis to provide reliable buy/sell signals with comprehensive market analysis.
## Key Features
### 1. Multi-Indicator Analysis
- **RSI (Relative Strength Index)**
- Length: 14 periods (default)
- Overbought: 70 (default)
- Oversold: 30 (default)
- Used for identifying overbought/oversold conditions
- **MACD (Moving Average Convergence Divergence)**
- Fast Length: 12 (default)
- Slow Length: 26 (default)
- Signal Length: 9 (default)
- Identifies trend direction and momentum
- **Bollinger Bands**
- Length: 20 periods (default)
- Multiplier: 2.0 (default)
- Measures volatility and potential reversal points
- **EMAs (Exponential Moving Averages)**
- Fast EMA: 9 periods (default)
- Slow EMA: 21 periods (default)
- Used for trend confirmation
- **ADX (Average Directional Index)**
- Length: 14 periods (default)
- Threshold: 25 (default)
- Measures trend strength
- **Volume Analysis**
- MA Length: 20 periods (default)
- Threshold: 1.5x average (default)
- Confirms signal strength
### 2. Advanced Features
- **Customizable Signal Frequency**
- Daily
- Weekly
- 4-Hour
- Hourly
- On Every Close
- **Enhanced Filtering**
- EMA crossover confirmation
- ADX trend strength filter
- Volume confirmation
- ATR-based volatility filter
- **Comprehensive Alert System**
- JSON-formatted alerts
- Detailed technical analysis
- Multiple timeframe analysis
- Customizable alert frequency
## How to Use
### 1. Initial Setup
1. Open TradingView and create a new chart
2. Select your preferred trading pair
3. Choose an appropriate timeframe
4. Apply the indicator to your chart
### 2. Configuration
#### Basic Settings
- **Signal Frequency**: Choose how often signals are generated
- Daily: Signals at the start of each day
- Weekly: Signals at the start of each week
- 4-Hour: Signals every 4 hours
- Hourly: Signals every hour
- On Every Close: Signals on every candle close
- **Enable Signals**: Toggle signal generation on/off
- **Include Volume**: Toggle volume analysis on/off
#### Technical Parameters
##### RSI Settings
- Adjust `rsi_length` (default: 14)
- Modify `rsi_overbought` (default: 70)
- Modify `rsi_oversold` (default: 30)
##### EMA Settings
- Fast EMA Length (default: 9)
- Slow EMA Length (default: 21)
##### MACD Settings
- Fast Length (default: 12)
- Slow Length (default: 26)
- Signal Length (default: 9)
##### Bollinger Bands
- Length (default: 20)
- Multiplier (default: 2.0)
##### Enhanced Filters
- ADX Length (default: 14)
- ADX Threshold (default: 25)
- Volume MA Length (default: 20)
- Volume Threshold (default: 1.5)
- ATR Length (default: 14)
- ATR Multiplier (default: 1.5)
### 3. Signal Interpretation
#### Buy Signal Requirements
1. RSI crosses above oversold level (30)
2. Price below lower Bollinger Band
3. MACD histogram increasing
4. Fast EMA above Slow EMA
5. ADX above threshold (25)
6. Volume above threshold (if enabled)
7. Market volatility check (if enabled)
#### Sell Signal Requirements
1. RSI crosses below overbought level (70)
2. Price above upper Bollinger Band
3. MACD histogram decreasing
4. Fast EMA below Slow EMA
5. ADX above threshold (25)
6. Volume above threshold (if enabled)
7. Market volatility check (if enabled)
### 4. Visual Indicators
#### Chart Elements
- **Moving Averages**
- SMA (Blue line)
- Fast EMA (Yellow line)
- Slow EMA (Purple line)
- **Bollinger Bands**
- Upper Band (Green line)
- Middle Band (Orange line)
- Lower Band (Green line)
- **Signal Markers**
- Buy Signals: Green triangles below bars
- Sell Signals: Red triangles above bars
- **Background Colors**
- Light green: Buy signal period
- Light red: Sell signal period
### 5. Alert System
#### Alert Types
1. **Signal Alerts**
- Generated when buy/sell conditions are met
- Includes comprehensive technical analysis
- JSON-formatted for easy integration
2. **Frequency-Based Alerts**
- Daily/Weekly/4-Hour/Hourly/Every Close
- Includes current market conditions
- Technical indicator values
#### Alert Message Format
```json
{
"symbol": "TICKER",
"side": "BUY/SELL/NONE",
"rsi": "value",
"macd": "value",
"signal": "value",
"adx": "value",
"bb_upper": "value",
"bb_middle": "value",
"bb_lower": "value",
"ema_fast": "value",
"ema_slow": "value",
"volume": "value",
"vol_ma": "value",
"atr": "value",
"leverage": 10,
"stop_loss_percent": 2,
"take_profit_percent": 5
}
```
## Best Practices
### 1. Signal Confirmation
- Wait for multiple confirmations
- Consider market conditions
- Check volume confirmation
- Verify trend strength with ADX
### 2. Risk Management
- Use appropriate position sizing
- Implement stop losses (default 2%)
- Set take profit levels (default 5%)
- Monitor market volatility
### 3. Optimization
- Adjust parameters based on:
- Trading pair volatility
- Market conditions
- Timeframe
- Trading style
### 4. Common Mistakes to Avoid
1. Trading without volume confirmation
2. Ignoring ADX trend strength
3. Trading against the trend
4. Not considering market volatility
5. Overtrading on weak signals
## Performance Monitoring
Regularly review:
1. Signal accuracy
2. Win rate
3. Average profit per trade
4. False signal frequency
5. Performance in different market conditions
## Disclaimer
This indicator is for educational purposes only. Past performance is not indicative of future results. Always use proper risk management and trade responsibly. Trading involves significant risk of loss and is not suitable for all investors.

Advanced Candlestick Pattern DetectorWhat Does This Indicator Do?
This indicator looks at the way price moves in the market using candlesticks (those red and green bars you see on charts). It tries to find special patterns like Bullish Engulfing, Hammer, Doji, and others. When one of these patterns shows up, the indicator checks a bunch of filters to decide if the pattern is strong enough to be a signal to buy or sell.
The Main Parts of the Indicator
1. Candlestick Pattern Detection
Bullish Engulfing:
Imagine you see a small down candle (red) and then a big up candle (green) that completely “covers” the red one. That’s a bullish engulfing pattern. It can signal that buyers are taking over.
Bearish Engulfing:
The opposite of bullish engulfing. A small up candle (green) is followed by a big down candle (red) that covers the previous candle. This suggests sellers might be in control.
Hammer & Shooting Star:
Hammer: A candle with a very short body and a long shadow at the bottom. It shows that buyers stepped in after a drop.
Shooting Star:
Similar to the hammer but with a long shadow on top. It can indicate that sellers are starting to push the price down.
Doji:
A candle with almost no body. This means the opening and closing prices are very close. It shows indecision in the market.
Harami Patterns (Bullish & Bearish):
These are two-candle patterns where the second candle is completely inside the body of the first candle. They signal that the previous trend might be about to change.
Morning Star & Evening Star:
These are three-candle patterns.
Morning Star:
Often seen at the bottom of a downtrend, it can signal a reversal to an uptrend.
Evening Star:
Seen at the top of an uptrend, it can signal that the price may soon go down.
2. Filters: Making the Signals Smarter
The indicator doesn’t just rely on patterns. It uses several “filters” to decide if a pattern is strong enough to trade on. Here’s what each filter does:
a. Adaptive Thresholds (ATR-Based)
What It Is:
The indicator uses something called ATR (Average True Range) to see how much the price is moving (volatility).
How It Works:
Instead of using fixed numbers to decide if a candle is a Hammer or a Doji, it adjusts these numbers based on current market activity.
User Settings:
Use Adaptive Thresholds: Turn this on to let the indicator adjust automatically.
Body Factor, Shadow Factor, Doji Factor: These numbers are multipliers that decide how small or big the body and shadows of the candle should be. You can change them if you want the indicator to be more or less sensitive.
b. Volume Filter
What It Is:
Volume shows how many trades are happening.
How It Works:
The filter checks if the current volume is higher than the average volume (multiplied by a set factor). This helps ensure that the signal isn’t coming from a very quiet market.
User Settings:
Use Volume Filter: Turn this on if you want to ignore signals when there’s not much trading.
Volume MA Period & Volume Multiplier: These settings determine what “normal” volume is and how much higher the current volume must be to count.
c. Multi-Timeframe Trend Filter
What It Is:
This filter looks at a bigger picture by using a moving average (MA) from a higher timeframe (for example, daily charts).
How It Works:
For a bullish (buy) signal, the indicator checks if the price is above this MA.
For a bearish (sell) signal, the price must be below the MA.
User Settings:
Use Multi-Timeframe Trend Filter: Enable or disable this filter.
Higher Timeframe for Trend: Choose which timeframe (like Daily) to use.
Trend MA Type (SMA or EMA) & Trend MA Period: Choose the type of moving average and how many candles to average.
d. Additional Trend Filters (ADX & RSI)
ADX Filter:
What It Is:
ADX stands for Average Directional Index. It measures how strong a trend is.
How It Works:
If the ADX is above a certain threshold, it means the trend is strong.
User Setting:
ADX Threshold: Set the minimum strength the trend should have.
RSI Filter:
What It Is:
RSI (Relative Strength Index) tells you if the price is overbought (too high) or oversold (too low).
How It Works:
For a buy signal, RSI should be low (under a set threshold).
For a sell signal, RSI should be high (above a set threshold).
User Settings:
RSI Buy Threshold & RSI Sell Threshold: These set the levels for buying or selling.
3. How the Final Signal Is Determined
For a signal (buy or sell) to be generated, the indicator first checks if one of the candlestick patterns is present. Then it goes through all these filters (trend, volume, ADX, RSI). Only if everything is in line will it show:
A BUY signal when all bullish conditions are met.
A SELL signal when all bearish conditions are met.
4. Visual Elements on the Chart
Trend MA Line:
A blue line is drawn on your chart showing the moving average from the higher timeframe (if you enable the trend filter). This helps you see the overall direction of the market.
Labels on the Chart:
When a signal is detected, you’ll see:
A BUY label below the candle (green).
A SELL label above the candle (red).
Background Colors:
The chart background might change slightly (green for bullish and red for bearish) to give you a quick visual cue.
Histogram:
At the bottom, there is a histogram that shows +1 for bullish signals, -1 for bearish signals, and 0 when there’s no clear signal.
5. Alerts
Alerts are built into the indicator so you can get a notification when a signal appears. The alert messages are fixed strings, meaning they always say something like “BUY signal on at price .” You can set up these alerts in TradingView to be notified via sound, email, or pop-up.
How to Use and Adjust the Filters
Deciding on Patterns:
You can choose which candlestick patterns you want to detect by toggling the options (e.g., Bullish Engulfing, Hammer, etc.).
Adjusting Adaptive Thresholds:
If you feel that the indicator is too sensitive (or not sensitive enough) during volatile times, adjust the Body Factor, Shadow Factor, and Doji Factor. These change how the indicator recognizes different candle shapes based on market movement.
Volume Filter Settings:
Use Volume Filter:
Turn this on if you want to ignore signals when there’s not enough trading activity.
Adjust the Volume MA Period and Volume Multiplier to change what “normal” volume is for your chart.
Multi-Timeframe Trend Filter Settings:
Choose a higher timeframe (like Daily) to see the bigger picture trend. Select the type of moving average (SMA or EMA) and its period. This filter ensures you only trade in the direction of the overall trend.
ADX & RSI Filters:
ADX:
Adjust the ADX Threshold if you want to change the minimum strength of the trend needed for a signal.
RSI:
Set the RSI Buy Threshold (for oversold conditions) and RSI Sell Threshold (for overbought conditions) to refine when a signal is valid.
Summary
This indicator is like having a smart assistant that not only looks for specific price patterns (candlesticks) but also checks if the overall market conditions are right using several filters. By combining:
Pattern Detection
Adaptive thresholds (based on ATR)
Volume Checks
Multi-Timeframe Trend Analysis
Additional Trend Strength and Overbought/Oversold Indicators (ADX & RSI)
...it helps you decide if it might be a good time to buy or sell. You can customize each part to fit your trading style, and with the built-in alerts, you can be notified when everything lines up.
Feel free to adjust the settings to see how each filter changes the signals on your chart. Experimenting with these will help you learn how the market behaves and how you can best use the indicator for your own strategy!

Crypto Scanner v4This guide explains a version 6 Pine Script that scans a user-provided list of cryptocurrency tokens to identify high probability tradable opportunities using several technical indicators. The script combines trend, momentum, and volume-based analyses to generate potential buying or selling signals, and it displays the results in a neatly formatted table with alerts for trading setups. Below is a detailed walkthrough of the script’s design, how traders can interpret its outputs, and recommendations for optimizing indicator inputs across different timeframes.
## Overview and Key Components
The script is designed to help traders assess multiple tokens by calculating several indicators for each one. The key components include:
- **Input Settings:**
- A comma-separated list of symbols to scan.
- Adjustable parameters for technical indicators such as ADX, RSI, MFI, and a custom Wave Trend indicator.
- Options to enable alerts and set update frequencies.
- **Indicator Calculations:**
- **ADX (Average Directional Index):** Measures trend strength. A value above the provided threshold indicates a strong trend, which is essential for validating momentum before entering a trade.
- **RSI (Relative Strength Index):** Helps determine overbought or oversold conditions. When the RSI is below the oversold level, it may present a buying opportunity, while an overbought condition (not explicitly part of this setup) could suggest selling.
- **MFI (Money Flow Index):** Similar in concept to RSI but incorporates volume, thus assessing buying and selling pressure. Values below the designated oversold threshold indicate potential undervaluation.
- **Wave Trend:** A custom indicator that calculates two components (WT1 and WT2); a crossover where WT1 moves from below to above WT2 (particularly near oversold levels) may signal a reversal and a potential entry point.
- **Scanning and Trading Zone:**
- The script identifies a *bullish setup* when the following conditions are met for a token:
- ADX exceeds the threshold (strong trend).
- Both RSI and MFI are below their oversold levels (indicating potential buying opportunities).
- A Wave Trend crossover confirms near-term reversal dynamics.
- A *trading zone* condition is also defined by specific ranges for ADX, RSI, MFI, and a limited difference between WT1 and WT2. This zone suggests that the token might be in a consolidation phase where even small moves may be significant.
- **Alerts and Table Reporting:**
- A table is generated, with each row corresponding to a token. The table contains columns for the symbol, ADX, RSI, MFI, WT1, WT2, and the trading zone status.
- Visual cues—such as different background colors—highlight tokens with a bullish setup or that are within the trading zone.
- Alerts are issued based on the detection of a bullish setup or entry into a trading zone. These alerts are limited per bar to avoid flooding the trader with notifications.
## How to Interpret the Indicator Outputs
Traders should use the indicator values as guidance, verifying them against their own analysis before making any trading decision. Here’s how to assess each output:
- **ADX:**
- **High values (above threshold):** Indicate strong trends. If other indicators confirm an oversold condition, a trader may consider a long position for a corrective reversal.
- **Low values:** Suggest that the market is not trending strongly, and caution should be taken when considering entry.
- **RSI and MFI:**
- **Below oversold levels:** These conditions are traditionally seen as signals that an asset is undervalued, potentially triggering a bounce.
- **Above typical resistance levels (not explicitly used here):** Would normally caution a trader against entering a long position.
- **Wave Trend (WT1 and WT2):**
- A crossover where WT1 moves upward above WT2 in an oversold environment can signal the beginning of a recovery or reversal, thereby reinforcing buy signals.
- **Trading Zone:**
- Being “in zone” means that the asset’s current values for ADX, RSI, MFI, and the closeness of the Wave Trend lines indicate a period of consolidation. This scenario might be suitable for both short-term scalping or as an early exit indicator, depending on further market analysis.
## Timeframe Optimization Input Table
Traders can optimize indicator inputs depending on the timeframe they use. The following table provides a set of recommended input values for various timeframes. These values are suggestions and should be adjusted based on market conditions and individual trading styles.
Timeframe ADX RSI MFI ADX RSI MFI WT Channel WT Average
5-min 10 10 10 20 30 20 7 15
15-min 12 12 12 22 30 20 9 18
1-hour 14 14 14 25 30 20 10 21
4-hour 16 16 16 27 30 20 12 24
1-day 18 18 18 30 30 20 14 28
Adjust these parameters directly in the script’s input settings to match the selected timeframe. For shorter timeframes (e.g., 5-min or 15-min), the shorter lengths help filter high-frequency noise. For longer timeframes (e.g., 1-day), longer input values may reduce false signals and capture more significant trends.
## Best Practices and Usage Tips
- **Token Limit:**
- Limit the number of tokens scanned to 10 per query line. If you need to scan more tokens, initiate a new query line. This helps manage screen real estate and ensures the table remains legible.
- **Confirming Signals:**
- Use this script as a starting point for identifying high potential trades. Each indicator’s output should be used to confirm your trading decision. Always cross-reference with additional technical analysis tools or market context.
- **Regular Review:**
- Since the script updates the table every few bars (as defined by the update frequency), review the table and alerts regularly. Market conditions change rapidly, so timely decisions are crucial.
## Conclusion
This Pine Script provides a comprehensive approach for scanning multiple cryptocurrencies using a combination of trend strength (ADX), momentum (RSI and MFI), and reversal signals (Wave Trend). By using the provided recommendation table for different timeframes and limiting the tokens to 20 per query line (with a maximum of four query lines), traders can streamline their scanning process and more effectively identify high probability tradable tokens. Ultimately, the outputs should be critically evaluated and combined with additional market research before executing any trades.

Johnny's Machine Learning Moving Average (MLMA) w/ Trend Alerts📖 Overview
Johnny's Machine Learning Moving Average (MLMA) w/ Trend Alerts is a powerful adaptive moving average indicator designed to capture market trends dynamically. Unlike traditional moving averages (e.g., SMA, EMA, WMA), this indicator incorporates volatility-based trend detection, Bollinger Bands, ADX, and RSI, offering a comprehensive view of market conditions.
The MLMA is "machine learning-inspired" because it adapts dynamically to market conditions using ATR-based windowing and integrates multiple trend strength indicators (ADX, RSI, and volatility bands) to provide an intelligent moving average calculation that learns from recent price action rather than being static.
🛠 How It Works
1️⃣ Adaptive Moving Average Selection
The MLMA automatically selects one of four different moving averages:
📊 EMA (Exponential Moving Average) – Reacts quickly to price changes.
🔵 HMA (Hull Moving Average) – Smooth and fast, reducing lag.
🟡 WMA (Weighted Moving Average) – Gives recent prices more importance.
🔴 VWAP (Volume Weighted Average Price) – Accounts for volume impact.
The user can select which moving average type to use, making the indicator customizable based on their strategy.
2️⃣ Dynamic Trend Detection
ATR-Based Adaptive Window 📏
The Average True Range (ATR) determines the window size dynamically.
When volatility is high, the moving average window expands, making the MLMA more stable.
When volatility is low, the window shrinks, making the MLMA more responsive.
Trend Strength Filters 📊
ADX (Average Directional Index) > 25 → Indicates a strong trend.
RSI (Relative Strength Index) > 70 or < 30 → Identifies overbought/oversold conditions.
Price Position Relative to Upper/Lower Bands → Determines bullish vs. bearish momentum.
3️⃣ Volatility Bands & Dynamic Support/Resistance
Bollinger Bands (BB) 📉
Uses standard deviation-based bands around the MLMA to detect overbought and oversold zones.
Upper Band = Resistance, Lower Band = Support.
Helps traders identify breakout potential.
Adaptive Trend Bands 🔵🔴
The MLMA has built-in trend envelopes.
When price breaks the upper band, bullish momentum is confirmed.
When price breaks the lower band, bearish momentum is confirmed.
4️⃣ Visual Enhancements
Dynamic Gradient Fills 🌈
The trend strength (ADX-based) determines the gradient intensity.
Stronger trends = More vivid colors.
Weaker trends = Lighter colors.
Trend Reversal Arrows 🔄
🔼 Green Up Arrow: Bullish reversal signal.
🔽 Red Down Arrow: Bearish reversal signal.
Trend Table Overlay 🖥
Displays ADX, RSI, and Trend State dynamically on the chart.
📢 Trading Signals & How to Use It
1️⃣ Bullish Signals 📈
✅ Conditions for a Long (Buy) Trade:
The MLMA crosses above the lower band.
The ADX is above 25 (confirming trend strength).
RSI is above 55, indicating positive momentum.
Green trend reversal arrow appears (confirmation of a bullish reversal).
🔹 How to Trade It:
Enter a long trade when the MLMA turns bullish.
Set stop-loss below the lower Bollinger Band.
Target previous resistance levels or use the upper band as take-profit.
2️⃣ Bearish Signals 📉
✅ Conditions for a Short (Sell) Trade:
The MLMA crosses below the upper band.
The ADX is above 25 (confirming trend strength).
RSI is below 45, indicating bearish pressure.
Red trend reversal arrow appears (confirmation of a bearish reversal).
🔹 How to Trade It:
Enter a short trade when the MLMA turns bearish.
Set stop-loss above the upper Bollinger Band.
Target the lower band as take-profit.
💡 What Makes This a Machine Learning Moving Average?
📍 1️⃣ Adaptive & Self-Tuning
Unlike static moving averages that rely on fixed parameters, this MLMA automatically adjusts its sensitivity to market conditions using:
ATR-based dynamic windowing 📏 (Expands/contracts based on volatility).
Adaptive smoothing using EMA, HMA, WMA, or VWAP 📊.
Multi-indicator confirmation (ADX, RSI, Volatility Bands) 🏆.
📍 2️⃣ Intelligent Trend Confirmation
The MLMA "learns" from recent price movements instead of blindly following a fixed-length average.
It incorporates ADX & RSI trend filtering to reduce noise & false signals.
📍 3️⃣ Dynamic Color-Coding for Trend Strength
Strong trends trigger more vivid colors, mimicking confidence levels in machine learning models.
Weaker trends appear faded, suggesting uncertainty.
🎯 Why Use the MLMA?
✅ Pros
✔ Combines multiple trend indicators (MA, ADX, RSI, BB).
✔ Automatically adjusts to market conditions.
✔ Filters out weak trends, making it more reliable.
✔ Visually intuitive (gradient colors & reversal arrows).
✔ Works across all timeframes and assets.
⚠️ Cons
❌ Not a standalone strategy → Best used with volume confirmation or candlestick analysis.
❌ Can lag slightly in fast-moving markets (due to smoothing).

Strength Measurement -HTStrength Measurement -HT
This indicator provides a comprehensive view of trend strength by calculating the average ADX (Average Directional Index) across multiple timeframes. It helps traders identify strong trends, potential reversals, and confirm signals from other indicators.
Key Features:
Multi-Timeframe Analysis: Analyze trend strength across different timeframes. Choose which timeframes to include in the calculation (5 min, 15 min, 30 min, 1 hour, 4 hour).
Customizable ADX Parameters: Adjust the ADX smoothing (adxlen) and DI length (dilen) parameters to fine-tune the indicator to your preferred settings.
Smoothed Average ADX: The average ADX is smoothed using a Simple Moving Average to reduce noise and provide a clearer picture of the overall trend.
Color-Coded Visualization: The histogram clearly indicates trend direction and strength:
Green: Uptrend
Red: Downtrend
Darker shades: Stronger trend
Lighter shades: Weaker trend
Reference Levels: Includes horizontal lines at 25, 50, and 75 to provide benchmarks for trend strength classification.
Alerts: Set alerts for strong trend up (ADX crossing above 50) and weakening trend (ADX crossing below 25).
How to Use:
Select Timeframes: Choose the timeframes you want to include in the average ADX calculation.
Adjust ADX Parameters: Fine-tune the adxlen and dilen values based on your trading style and the timeframe of the chart.
Identify Strong Trends: Look for histogram bars with darker green or red colors, indicating a strong trend.
Spot Potential Reversals: Watch for changes in histogram color and height, which may suggest a weakening trend or a potential reversal.
Combine with Other Indicators: Use this indicator with other technical analysis tools to confirm trading signals.
Note: This indicator is based on the ADX, which is a lagging indicator.

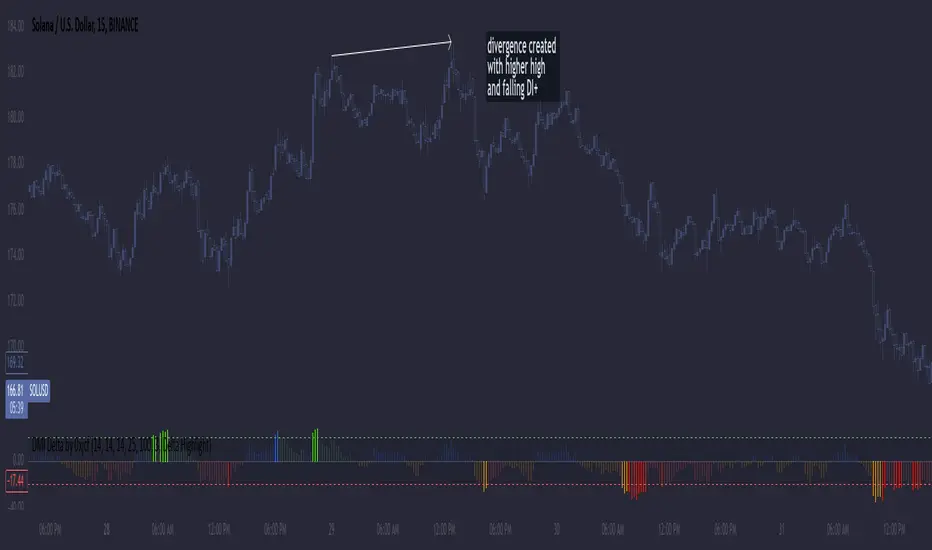
DMI Delta by 0xjcfOverview
This indicator integrates the Directional Movement Index (DMI), Average Directional Index (ADX), and volume analysis into an Oscillator designed to help traders identify divergence-based trading signals. Unlike typical volume or momentum indicators, this combination provides insight into directional momentum and volume intensity, allowing traders to make well-informed decisions based on multiple facets of market behavior.
Purpose and How Components Work Together
By combining DMI and ADX with volume analysis, this indicator helps traders detect when momentum diverges from price action—a common precursor to potential reversals or significant moves. The ADX filter enhances this by distinguishing trending from range-bound conditions, while volume analysis highlights moments of extreme sentiment, such as solid buying or selling. Together, these elements provide traders with a comprehensive view of market strength, directional bias, and volume surges, which help filter out weaker signals.
Key Features
DMI Delta and Oscillator: The DMI indicator measures directional movement by comparing DI+ and DI- values. This difference (DMI Delta) is calculated and displayed as a histogram, visualizing changes in directional bias. When combined with ADX filtering, this histogram helps traders gauge the strength of momentum and spot directional shifts early. For instance, a rising histogram in a bearish price trend might signal a potential bullish reversal.
Volume Analysis with Extremes: Volume is monitored to reveal when market participation is unusually high, using a customizable multiplier to highlight significant volume spikes. These extreme levels are color-coded directly on the histogram, providing visual cues on whether buying or selling interest is particularly strong. Volume analysis adds depth to the directional insights from DMI, allowing traders to differentiate between regular and powerful moves.
ADX Trending Filter: The ADX component filters trends by measuring the overall strength of a price move, with a default threshold of 25. When ADX is above this level, it suggests that the market is trending strongly, making the DMI Delta readings more reliable. Below this threshold, the market is likely range-bound, cautioning traders that signals might not have as much follow-through.
Using the Indicator in Divergence Strategies
This indicator excels in divergence strategies by highlighting moments when price action diverges from directional momentum. Here’s how it aids in decision-making:
Bullish Divergence: If the price is falling to new lows while the DMI Delta histogram rises, it can indicate weakening bearish momentum and signal a potential price reversal to the upside.
Bearish Divergence: Conversely, if prices are climbing but the DMI Delta histogram falls, it may point to waning bullish momentum, suggesting a bearish reversal.
Visual Cues and Customization
The color-coded output enhances usability:
Bright Green/Red: Extreme volume with strong bullish or bearish signals, often at points of high potential for trend continuation or reversal.
Green/Red Shades: These shades reflect trending conditions (bullish or bearish) based on ADX, factoring in volume. Green signals a bullish trend, and red is a bearish trend.
Blue/Orange Shades: Indicates non-trending or weaker conditions, suggesting a more cautious approach in range-bound markets.
Customizable for Diverse Trading Styles
This indicator allows users to adjust settings like the ADX threshold and volume multiplier to optimize performance for various timeframes and strategies. Whether a trader prefers swing trading or intraday scalping, these parameters enable fine-tuning to enhance signal reliability across different market contexts.
Practical Usage Tips
Entry and Exit Signals: Use this indicator in conjunction with price action. Divergences between the price and DMI Delta histogram can reinforce entry or exit decisions.
Adjust Thresholds: Based on backtesting, customize the ADX Trending Threshold and Volume Multiplier to ensure optimal performance on different timeframes or trading styles.
In summary, this indicator is tailored for traders seeking a multi-dimensional approach to market analysis. It blends momentum, trend strength, and volume insights to support divergence-based strategies, helping traders confidently make informed decisions. Remember to validate signals through backtesting and use it alongside price action for the best results.
Previous Day High Low Strategy only for LongWelcome to the "Previous Day High Low Strategy only for Long"!.
This strategy aims to identify potential long trading opportunities based on the previous day's high and low prices, along with certain market strength conditions.
Key Features:
Entry Conditions: The strategy triggers a long position when the current day's closing price crosses above the previous day's high or low.
Market Strength Filter: The strategy incorporates a market strength filter using the Average Directional Index (ADX). It only takes long positions when the ADX value is above a specific threshold and when there is a predominance of upward movement.
Trade Timing: The strategy operates within a specified trade window, starting at 09:30 and ending at 15:10. Positions are closed at 15:15 if still active.
Risk Management: The strategy employs dynamic stop-loss and profit-taking levels based on a user-defined Max Profit value. It has three profit targets (T1, T2, T3) and a stop-loss level to manage risk effectively.
Rules:
Ensure that the strategy idea is clearly understandable. Provide an easy-to-read title and a thoughtful description explaining the reasoning behind the strategy.
All content should be ad-free. Avoid any form of promotion, advertising, or solicitation.
No fundraising requests or money solicitation is allowed on TradingView.
Publish in the same language as the TradingView subdomain you're on, except for script titles, which must be in English.
Don't plagiarize. Create and share only unique content, and always give credit when using someone else's work.
Be respectful, kind, and constructive when engaging with others.
Zero tolerance for contentious political discourse, defamatory, threatening, or discriminatory remarks.
Avoid sharing harmful, misleading, or inappropriate content.
Respect the moderators' work and address complaints privately.
Use only your original account and avoid creating duplicate or fake accounts.
Do not attempt to manipulate the reputation system or engage in like-for-like schemes.
Explanation of how the strategy works
1. Previous Day's High and Low (HH, LL):
In this strategy, we start by obtaining the high and low prices of the previous day (not the current day) using the request.security function. This function allows us to access historical data for a specific time frame. The high and low prices are stored in the variables HH and LL, respectively.
2. Entry Conditions:
The strategy uses two conditions to trigger a long position:
Condition 1 (Long Condition 1): If the closing price of the current day crosses above the previous day's high (HH), it generates a long signal. This is achieved using the ta.crossover function, which detects when a crossover occurs.
Condition 2 (Long Condition 2): Similarly, if the closing price of the current day crosses above the previous day's low (LL), it also generates a long signal.
Combined Condition: To take long positions, the strategy combines both long conditions using the logical OR operator (or). This means that if either of the two conditions is met, a long position will be initiated.
3. Market Strength Filter:
The strategy also includes a filter based on the Average Directional Index (ADX) to gauge the market's strength before taking long positions. The ADX measures the strength of a trend in the market. The higher the ADX value, the stronger the trend.
Calculation of ADX: The ADX is calculated using the adx function, which takes two parameters: LWdilength (DMI Length) and LWadxlength (ADX period).
Strength Condition (strength_up): The strategy requires that the ADX value should be above a threshold (11 in this case) and that there is a predominance of upward movement (up > down) before initiating a long position. The LWADX value is multiplied by 2.5 and compared to the highest value of LWADX from the last 4 periods using ta.highest(LWADX , 4). If these conditions are met, the variable strength_up is set to true.
Combined Condition: The strength_up condition is then combined with the long conditions using the logical AND operator (and). This means that the strategy will only take a long position if both the long conditions and the market strength condition are met.
4. Trade Timing:
The strategy sets a specific trade window between 09:30 and 15:10. It will only execute trades within this time frame (TradeTime).
5. Risk Management:
The strategy implements dynamic stop-loss (SL) and profit-taking levels (T1, T2, T3) based on a user-defined Max Profit value. The stop-loss is set as a percentage of the Max Profit value. As the position moves in favor of the trader, the profit targets are adjusted accordingly.
6. Position Management:
The strategy uses the strategy.entry function to enter long positions based on the combined entry conditions. Once a position is open, the script uses strategy.exit to define the exit condition when either the profit target or stop-loss level is hit. The strategy.close function is used to close any open position at the end of the trade window (15:15).
7. Plotting:
The strategy uses the plot function to visualize the previous day's high and low prices, as well as the stop-loss (SL) and profit-taking (T1, T2, T3) levels on the chart.
Overall, the "Previous Day High Low Strategy only for Long" aims to identify potential long trading opportunities based on the previous day's price action and market strength conditions. However, as with any trading strategy, it's essential to thoroughly test it and consider risk management before applying it to real-world trading scenarios.
Disclaimer:
The information presented by this strategy is for educational purposes only and should not be considered as investment advice. The strategy is not designed for qualified investors. Always conduct your own research and consult with a financial advisor before making any trading decisions.
Remember, the success of any trading strategy depends on various factors, including market conditions, risk management, and individual trading skills. Past performance is not indicative of future results.

Trend Strength Matrix [JOAT]Trend Strength Matrix — Multi-Timeframe Confluence Analysis System
This indicator addresses a specific analytical challenge: how to efficiently compare multiple technical measurements across different timeframes while accounting for their varying scales and interpretations. Rather than managing separate indicator windows with different scales, this tool normalizes four distinct analytical approaches to a common -1 to +1 scale and presents them in a unified matrix format.
Why This Combination Adds Value
The core problem this indicator solves is analytical fragmentation. Traders often use multiple indicators but struggle with:
1. **Scale Inconsistency**: RSI ranges 0-100, MACD has no fixed range, ADX ranges 0-100 but measures strength not direction
2. **Timeframe Coordination**: Checking multiple timeframes requires switching between charts or cramming multiple indicators
3. **Cognitive Load**: Processing different indicator types simultaneously creates mental overhead
4. **Confluence Assessment**: Determining when multiple approaches agree requires manual comparison
This indicator specifically addresses these issues by creating a standardized analytical framework where different measurement approaches can be directly compared both within and across timeframes.
Originality and Technical Innovation
While the individual components (RSI, MACD, ADX, Moving Average) are standard, the originality lies in:
1. **Unified Normalization System**: Each component is mathematically transformed to a -1 to +1 scale using component-specific normalization that preserves the indicator's core characteristics
2. **Multi-Timeframe Weighting Algorithm**: Higher timeframes receive proportionally more weight (40% current, 25% next, 20% third, 15% fourth) based on the principle that longer timeframes provide more significant context
3. **Real-Time Confluence Scoring**: The composite calculation provides an instant assessment of how much the different analytical approaches agree
4. **Adaptive Visual Encoding**: The heatmap format allows immediate pattern recognition of agreement/disagreement across both indicators and timeframes
How the Components Work Together
Each component measures a different aspect of market behavior, and their combination provides a more complete analytical picture:
**Momentum Component (RSI-based)**: Measures the velocity of price changes by comparing average gains to losses
**Trend Component (MACD-based)**: Measures the relationship between fast and slow moving averages, indicating trend acceleration/deceleration
**Strength Component (ADX-based)**: Measures trend strength regardless of direction, then applies directional bias
**Position Component (MA-based)**: Measures price position relative to a reference average
The mathematical relationship between these components creates a comprehensive view:
- When all four agree (similar colors), it suggests multiple analytical approaches are aligned
- When they disagree (mixed colors), it highlights analytical uncertainty or transition periods
- The composite score quantifies the degree of agreement numerically
Detailed Component Analysis
**1. Momentum Oscillator Component**
This component transforms RSI into a centered oscillator by subtracting 50 and dividing by 50, creating a -1 to +1 range where 0 represents equilibrium between buying and selling pressure.
// Momentum calculation normalized to -1 to +1 scale
float rsi = ta.rsi(close, rsiLength)
float rsiScore = (rsi - 50) / 50
// Result: 0 at equilibrium, +1 at extreme overbought, -1 at extreme oversold
**2. Moving Average Convergence Component**
MACD is normalized by its own volatility (standard deviation) to create a bounded oscillator. This prevents the unbounded nature of MACD from dominating the composite calculation.
// MACD normalized by its historical volatility
= ta.macd(close, macdFast, macdSlow, macdSignal)
float macdStdev = ta.stdev(macdLine, 100)
float macdScore = macdStdev != 0 ? math.max(-1, math.min(1, macdLine / (macdStdev * 2))) : 0
**3. Directional Movement Component**
This combines ADX (strength) with directional movement (+DI vs -DI) to create a directional strength measurement. ADX alone shows strength but not direction; this component adds directional context.
// ADX-based directional strength
= calcADX(adxLength)
float adxStrength = math.min(adx / 50, 1) // Normalize ADX to 0-1
float adxDirection = plusDI > minusDI ? 1 : -1 // Direction bias
float adxScore = adxStrength * adxDirection // Combine strength and direction
**4. Price Position Component**
This measures price deviation from a moving average, weighted by the magnitude of deviation to distinguish between minor and significant displacements.
// Price position relative to moving average
float ma = ta.sma(close, maLength)
float maDirection = close > ma ? 1 : -1
float maDeviation = math.abs(close - ma) / ma * 10 // Percentage deviation scaled
float maScore = math.max(-1, math.min(1, maDirection * math.min(maDeviation, 1)))
Multi-Timeframe Integration Logic
The multi-timeframe system uses a weighted average that gives more influence to higher timeframes:
// Timeframe weighting system
float currentTF = composite * 0.40 // Current timeframe: 40%
float higherTF1 = composite_tf2 * 0.25 // Next higher: 25%
float higherTF2 = composite_tf3 * 0.20 // Third higher: 20%
float higherTF3 = composite_tf4 * 0.15 // Fourth higher: 15%
float multiTFComposite = currentTF + higherTF1 + higherTF2 + higherTF3
This weighting reflects the principle that higher timeframes provide more significant context for market direction, while lower timeframes provide timing precision.
What the Dashboard Shows
The heatmap displays a grid where:
Each row represents a timeframe
Each column shows one component's normalized reading
Colors indicate the value: green shades for positive, red shades for negative, gray for neutral
The rightmost column shows the composite average for that timeframe
Visual Elements
Moving Average Line — A simple moving average plotted on the price chart
Background Tint — Subtle coloring based on the composite score
Shift Labels — Markers when the composite crosses threshold values
Dashboard Table — The main heatmap display
Inputs
Calculation Parameters:
Momentum Length (default: 14)
MACD Fast/Slow/Signal (default: 12/26/9)
Directional Movement Length (default: 14)
Moving Average Length (default: 50)
Timeframe Settings:
Enable/disable multi-timeframe analysis
Select additional timeframes to display
How to Read the Display
Similar colors across a row indicate the components are showing similar readings
Mixed colors indicate the components are showing different readings
The composite percentage shows the average of all four components
Alerts
Composite crossed above/below threshold values
Strong readings (above 50% or below -50%)
Important Limitations and Realistic Expectations
This indicator displays current analytical conditions—it does not predict future price movements
Agreement between components indicates current analytical alignment, not future price direction
All four components are based on historical price data and inherently lag price action
Market conditions can change rapidly, making current readings irrelevant
Different parameter settings will produce different readings and interpretations
No combination of technical indicators can reliably predict future market behavior
Strong readings in one direction do not guarantee continued movement in that direction
The composite score reflects mathematical relationships, not market fundamentals or sentiment
This tool should be used as one input among many in a comprehensive analytical approach
Appropriate Use Cases
This indicator is designed for:
- Analytical organization and efficiency
- Multi-timeframe confluence assessment
- Pattern recognition in indicator relationships
- Educational study of how different analytical approaches relate
- Supplementary analysis alongside other methods
This indicator is NOT designed for:
- Standalone trading signals
- Guaranteed profit generation
- Market timing precision
- Replacement of fundamental analysis
- Automated trading systems
— Made with passion by officialjackofalltrades

PRO Scalper(EN)
## What it is
**PRO Scalper** is an intraday price–action and liquidity map that helps you see where the market is likely to move **now**, not just where it has been.
It combines five building blocks that professional scalpers often watch together:
1. **Session Volume-Weighted Average Price (VWAP)** — the intraday “fair value” anchor.
2. **Opening Range** — the first minutes of the session that set the day’s balance.
3. **Trend filter** — higher-timeframe bias using **Exponential Moving Averages (EMA)** and optional **Average Directional Index (ADX)** strength.
4. **Two independent Supply/Demand zone engines** — zones are drawn from confirmed swing pivots, with midlines and **touch counters**.
5. **Order-flow style visuals**:
* **Delta bubbles** (green/red circles) show where buying or selling pressure was unusually strong, using a safe **delta proxy** (no external feeds).
* **Liquidity densities** (subtle rectangular bands) highlight clusters of large activity that often act as magnets or barriers and disappear when “eaten” by strong moves.
This mix gives you a **complete intraday picture**: the mean (VWAP), the day’s initial balance (Opening Range), the higher-timeframe push (trend filter), the nearby fuel or brakes (zones), and the live pressure points (bubbles and densities).
---
## Why these components
* **VWAP** tracks where the bulk of traded value sits. Price tends to rotate around it or accelerate away from it — a perfect compass for scalps.
* **Opening Range** frames the early auction. Many intraday breaks, fades and retests start at its boundaries.
* **EMA bias + ADX strength** separates trending conditions from chop, so you can keep only the zones that agree with the bigger push.
* **Pivot-based zones (two pairs at once)** are simple, objective and fast. Midlines help with confirmations; touch counters quantify how many times the zone was tested.
* **Bubbles and densities** add the “effort” layer: where the push appeared and where liquidity is concentrated. You see **where** a move is likely to continue or fail.
Together they reduce ambiguity: **context + level + effort** — all on one screen.
---
## How it works (plain language)
* **VWAP** resets each day and is calculated as the cumulative sum of typical price multiplied by volume divided by total volume.
* **Opening Range** is either automatic (a multiple of your chart timeframe) or a manual number of minutes. While it is forming, the highest high and lowest low are captured and plotted as the range.
* **Trend filter**
* **EMA Fast** and **EMA Slow** define directional bias.
* **ADX (optional)** adds “trend strength”: only when the Average Directional Index is above the chosen threshold do we treat the move as strong. You can source this from a higher timeframe.
* **Zones**
* There are **two independent pairs** of pivots at the same time (for example 10-left 10-right and 5-left 5-right).
* Each detected pivot creates a **Supply** (from a swing high) or **Demand** (from a swing low) box. Box depth = **zone depth × Average True Range** for adaptive sizing; the boxes **extend forward**.
* Midline (optional dashed line inside the box) is the “balance” of the zone.
* **“Only in trend”** mode can hide boxes that go against the higher-timeframe bias.
* The **touch counter** increases when price revisits the box. Labels show the pair name and the number of touches.
* **Bubbles**
* A safe **delta proxy** measures bar pressure (for example, range-weighted close vs open).
* A **quantile filter** shows only unusually large pressure: choose lookback and percentile, and the script draws a circle sized by intensity (green = bullish pressure, red = bearish).
* **Densities**
* The script marks heavy activity clusters as **subtle bands** around price (depth = fraction of Average True Range).
* If price **breaks** a density with volume above its moving average, the band **disappears** (“eaten”), which often precedes continuation.
---
## How to use — practical playbooks
> Recommended chart: crypto or index futures, one to five minutes. Use **one hour** or **fifteen minutes** for the higher-timeframe bias.
### 1) Trend pullback scalp (continuation)
1. Enable **Only in trend** zones.
2. In an uptrend: wait for a pullback into a **Demand** zone that overlaps with VWAP or sits just below the Opening Range midpoint.
3. Look for **green bubbles** near the zone’s bottom or a fresh **density** under price.
4. Enter on a candle closing **back above the zone midline**.
5. Stop-loss: below the bottom of the zone or a small multiple of Average True Range.
6. Targets: previous swing high, Opening Range high, fixed risk multiples, or VWAP.
Mirror the logic for downtrends using Supply zones, red bubbles and densities above price.
### 2) Reversion with liquidity sweep (fade)
1. Bias neutral or countertrend allowed.
2. Price **wicks through** a zone boundary (or an Opening Range line) and **closes back inside** the zone.
3. The bubble color often flips (absorption).
4. Enter toward the **inside** of the zone; stop beyond the sweep wick; first target = zone midline, second = opposite side of the zone or VWAP.
### 3) Opening Range break and retest
1. Wait for the Opening Range to complete.
2. A break with a large bubble suggests intent.
3. Look for a **retest** into a nearby zone aligned with VWAP.
4. Trade continuation toward the next zone or the session extremes.
### 4) Density “eaten” continuation
1. When a density band **disappears** on high volume, it often means the resting liquidity was consumed.
2. Trade in the direction of the break, toward the nearest opposing zone.
---
## Settings — quick guide
**Core**
* *ATR Length* — used for zone and density depths.
* *Show VWAP / Show Opening Range*.
* *Opening Range*: Auto (multiple of timeframe minutes) or Manual minutes.
**Trend Filter**
* *Mode*: Off, EMA only, or EMA with ADX strength.
* *Use higher timeframe* and its value.
* *EMA Fast / EMA Slow*, *ADX Length*, *ADX threshold*.
* *Plot EMA filter* to display the moving averages.
**Zones (two pairs)**
* *Pivot A Left / Right* and *Pivot B Left / Right*.
* *Zone depth × ATR*, *Extend bars*.
* *Show zone midline*, *Only in trend zones*.
* Labels automatically show the touch counters.
**Bubbles**
* *Show Bubbles*.
* *Quantile lookback* and *Quantile percent* (higher percent = stricter filter, fewer bubbles).
**Densities**
* *Metric*: absolute delta proxy or raw volume.
* *Quantile lookback / percent*.
* *Depth × ATR*, *Extend bars*, *Merge distance* (in ATR),
* *Break condition*: volume moving average length and multiplier,
* *Midline for densities* (optional dashed line).
---
## Tips and risk management
* This script **does not use external order-flow feeds**. Delta is a **proxy** suitable for TradingView; tune quantiles per symbol and timeframe.
* Do not trade every bubble. Combine **context (trend + VWAP + Opening Range)** with **level (zone)** and **effort (bubble/density)**.
* Set stop-losses beyond the zone or at a fraction of Average True Range. Predefine risk per trade.
* Backtest your rules with a strategy script before using real funds.
* Markets differ. Parameters that work on Bitcoin may not transfer to low-liquidity altcoins or stocks.
* Nothing here is financial advice. Scalping is high-risk; slippage and over-trading can quickly damage your account.
---
## What makes PRO Scalper unique
* Two **independent** zone engines run in parallel, so you can see both **larger structure** and **fine intraday levels** at the same time.
* Clean **“only in trend” rendering** — zones and midlines against the bias can be hidden, reducing clutter and hesitation.
* **Touch counters** convert “feel” into numbers.
* **Self-contained order-flow visuals** (bubbles and densities) that require no extra data sources.
* Careful defaults: subtle colors for densities, clearer zones, and responsive auto Opening Range.
---
(RU)
## Что это такое
**PRO Scalper** — это индикатор для внутридневной торговли, который показывает **контекст и ликвидность прямо сейчас**.
Он объединяет пять модулей, которыми профессиональные скальперы пользуются вместе:
1. **VWAP** — средневзвешенная по объему цена за сессию, «справедливая стоимость» дня.
2. **Opening Range** — первая часть сессии, задающая баланс дня.
3. **Фильтр тренда** — направление старшего таймфрейма по **экспоненциальным средним** и при желании по силе тренда **Average Directional Index**.
4. **Две независимые системы зон спроса/предложения** — зоны строятся от подтвержденных экстремумов (пивотов), имеют **среднюю линию** и **счетчик касаний**.
5. **Визуализация «ордер-флоу»**:
* **Пузыри дельты** (зеленые/красные круги) — места повышенного покупательного/продажного давления, рассчитанные через безопасный **прокси-дельты**.
* **Плотности ликвидности** (ненавязчивые прямоугольные ленты) — скопления объема, которые нередко притягивают цену или удерживают ее и исчезают, когда «разъедаются» сильным движением.
Итог — **полная картинка момента**: среднее (VWAP), баланс дня (Opening Range), старшая сила (фильтр тренда), ближайшие уровни топлива/тормозов (зоны), текущие точки усилия (пузыри и плотности).
---
## Почему именно эти элементы
* **VWAP** показывает, где сосредоточена стоимость; цена либо вращается вокруг него, либо быстро уходит — идеальный ориентир скальпера.
* **Opening Range** фиксирует ранний аукцион — от его границ часто начинаются пробои, возвраты и ретесты.
* **EMA + ADX** отделяют тренд от «пилы», позволяя оставлять на графике только зоны по направлению старшего таймфрейма.
* **Зоны от пивотов** просты, объективны и быстры; средняя линия помогает подтверждать разворот, счетчик касаний переводит субъективность в цифры.
* **Пузыри и плотности** добавляют слой «усилия»: где именно возник толчок и где сконцентрирована ликвидность.
Комбинация **контекста + уровня + усилия** уменьшает двусмысленность и ускоряет принятие решения.
---
## Как это работает (простыми словами)
* **VWAP** каждый день стартует заново: сумма «типичной цены × объем» делится на суммарный объем.
* **Opening Range** — автоматический (кратный минутам вашего таймфрейма) или вручную заданный период; пока он формируется, фиксируются максимум и минимум.
* **Фильтр тренда**
* Две экспоненциальные средние задают направление.
* **ADX** (по желанию) добавляет «силу». Источник можно взять со старшего таймфрейма.
* **Зоны**
* Одновременно работает **две пары** пивотов (например 10-лево 10-право и 5-лево 5-право).
* От пивота строится зона **предложения** (от максимума) или **спроса** (от минимума). Глубина зоны = **коэффициент × Average True Range**; зона тянется вперед.
* Внутри рисуется **средняя линия** (по желанию).
* Режим **«только по тренду»** скрывает зоны против старшего направления.
* **Счетчик касаний** увеличивается, когда цена снова входит в зону; подпись показывает пару и количество касаний.
* **Пузыри**
* Используется безопасный **прокси-дельты** — измерение «напряжения» внутри свечи.
* Через **квантильный фильтр** выводятся только необычно сильные места: настраиваются окно и процент квантиля; размер кружка — сила, цвет: зеленый покупатели, красный продавцы.
* **Плотности**
* Крупные активности отмечаются **ненавязчивыми прямоугольниками** (глубина — доля Average True Range).
* Если плотность **пробивается** объемом выше среднего, она **исчезает** — часто это предвещает продолжение.
---
## Как пользоваться — практические схемы
> Рекомендация: крипто или фьючерсы, таймфрейм 1–5 минут. Для старшего фильтра удобно взять **1 час** или **15 минут**.
### 1) Скальп на откат по тренду
1. Включите **«только по тренду»**.
2. В восходящем тренде дождитесь отката в **зону спроса**, желательно рядом с **VWAP** или серединой **Opening Range**.
3. Подтверждение — **зеленые пузыри** у нижней границы зоны или свежая **плотность** под ценой.
4. Вход после закрытия свечи **выше средней линии** зоны.
5. Стоп-лосс: за нижнюю границу зоны или небольшой множитель Average True Range.
6. Цели: предыдущий максимум, верх Opening Range, фиксированные R-множители, либо VWAP.
Для нисходящего тренда зеркально: зоны предложения, красные пузыри и плотности над ценой.
### 2) Контрдвижение с «выбиванием ликвидности»
1. Нейтральный или контртрендовый режим.
2. Цена **выносит хвостом** границу зоны (или линию Opening Range) и **закрывается обратно внутри**.
3. Цвет пузыря часто меняется (поглощение).
4. Вход внутрь зоны; стоп — за хвост выбивания; цели: средняя линия, противоположная граница зоны или VWAP.
### 3) Пробой Opening Range + ретест
1. Дождитесь завершения диапазона.
2. Сильный пробой с крупным пузырем — признак намерения.
3. Ищите **ретест** в зоне по тренду рядом с линией диапазона и VWAP.
4. Торгуйте продолжение к следующей зоне.
### 4) Продолжение после «съеденной» плотности
1. Когда прямоугольник плотности **исчезает** на повышенном объеме, это значит, что ликвидность поглощена.
2. Торгуйте в сторону пробоя к ближайшей противоположной зоне.
---
## Настройки — краткая шпаргалка
**Core**
— Длина Average True Range (для размеров зон и плотностей).
— Включение VWAP и Opening Range.
— Длина Opening Range: автоматическая (кратная минутам ТФ) или ручная.
**Trend Filter**
— Режим: выкл., только средние, либо средние + ADX.
— Источник со старшего таймфрейма и его значение.
— Длины средних, длина ADX и порог силы.
— Показать/скрыть линий средних.
**Zones (две пары одновременно)**
— Пара A: лев/прав; Пара B: лев/прав.
— Глубина зоны × Average True Range, продление по барам.
— Средняя линия, режим **«только по тренду»**.
— Подписи со счетчиком касаний.
**Bubbles**
— Вкл./выкл., окно поиска и процент квантиля (чем выше процент — тем реже пузыри).
**Densities**
— Метрика: абсолютная прокси-дельты или чистый объем.
— Окно/квантиль, глубина × Average True Range, продление,
— Порог объединения (в Average True Range),
— Условие «разъедания» по объему,
— Средняя линия плотности (по желанию).
---
## Советы и риски
* Индикатор **не использует внешние потоки ордер-флоу**. Дельта — **прокси**, подходящая для TradingView; подбирайте квантили под инструмент и таймфрейм.
* Не торгуйте каждый пузырь. Склейте **контекст (тренд + VWAP + Opening Range)** с **уровнем (зона)** и **усилием (пузырь/плотность)**.
* Стоп-лосс — за границей зоны или по Average True Range. Риск на сделку задавайте заранее.
* Перед реальными деньгами протестируйте правила в стратегии.
* Разные рынки ведут себя по-разному; настройки из Биткоина могут не подойти малоликвидным альткоинам или акциям.
* Это не инвестиционная рекомендация. Скальпинг — высокий риск; проскальзывание и переизбыток сделок быстро наносят ущерб капиталу.
---
## Чем уникален PRO Scalper
* Две **одновременные** системы зон показывают и **крупную структуру**, и **точные локальные уровни**.
* Режим **«только по тренду»** чистит экран от лишних уровней и ускоряет решение.
* **Счетчики касаний** дают количественную опору.
* **Самодостаточные визуализации усилия** (пузыри и плотности) — без сторонних источников данных.
* Аккуратная цветовая схема: плотности — мягко, зоны — ясно; Opening Range — адаптивный.
Пусть он станет вашей «картой местности» для быстрых и дисциплинированных решений внутри дня.

sideways market for strangleThis Pine Script is designed to identify **sideways or range-bound markets**, which are often ideal conditions for trading **options strangle strategies**. Here's a breakdown of what the script does:
---
### 🛠 **Purpose:**
To **detect low-volatility, sideways market conditions** where price is not trending strongly in either direction — suitable for **neutral options strategies like short strangles**.
---
### 📌 **Key Components:**
#### 1. **Inputs:**
- `RSI Length`: Default 14 — used for calculating the Relative Strength Index (RSI).
- `ADX Length`: Default 14 — used for calculating the Average Directional Index (ADX), DI+ (positive directional movement), and DI- (negative directional movement).
#### 2. **RSI Calculation:**
- `rsiValue` is calculated using the built-in `ta.rsi(close, rsiLength)`.
- A **sideways market** is expected when RSI is in the **40–60 range**, indicating lack of strong momentum.
#### 3. **ADX and Directional Indicators (DI+ and DI-):**
- `diPlus` and `diMinus` are calculated based on recent price movements and the True Range.
- `dx` (Directional Index) measures the strength of trend direction using the difference between DI+ and DI-.
- `adx` is a smoothed version of `dx` and represents **overall trend strength**.
#### 4. **Sideways Market Conditions:**
- **RSI Condition**: RSI is between 40 and 60.
- **ADX Condition**:
- `adx <= 25` → Weak or no trend.
- `adx < diPlus` and `adx < diMinus` → Confirms ADX is lower than directional components, reducing likelihood of a trending market.
#### 5. **Signal Plot:**
- A **green label below the bar** (`shape.labelup`) is plotted when both conditions are met.
- Indicates potential sideways market conditions.
---
### ✅ **Use Case:**
- This signal can help identify **low-volatility zones** suitable for **short strangles** or **iron condors**, where you profit from time decay while expecting the price to stay within a range.
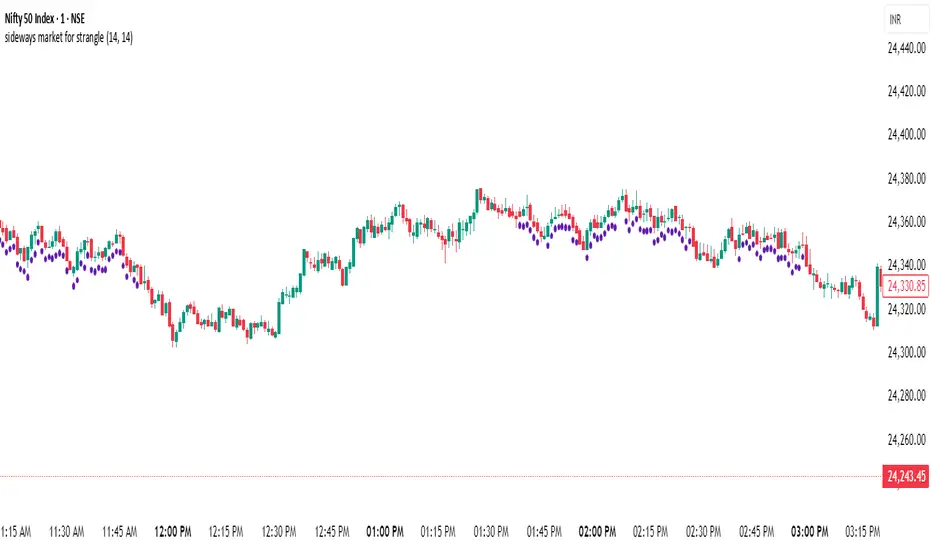
Reversal Trading Bot Strategy[BullByte]Overview :
The indicator Reversal Trading Bot Strategy is crafted to capture potential market reversal points by combining momentum, volatility, and trend alignment filters. It uses a blend of technical indicators to identify both bullish and bearish reversal setups, ensuring that multiple market conditions are met before entering a trade.
Core Components :
Technical Indicators Used :
RSI (Relative Strength Index) :
Purpose : Detects divergence conditions by comparing recent lows/highs in price with the RSI.
Parameter : Length of 8.
Bollinger Bands (BB) :
Purpose : Measures volatility and identifies price levels that are statistically extreme.
Parameter : Length of 20 and a 2-standard deviation multiplier.
ADX (Average Directional Index) & DMI (Directional Movement Index) :
Purpose : Quantifies the strength of the trend. The ADX threshold is set at 20, and additional filters check for the alignment of the directional indicators (DI+ and DI–).
ATR (Average True Range) :
Purpose : Provides a volatility measure used to set stop levels and determine risk through trailing stops.
Volume SMA (Simple Moving Average of Volume ):
Purpose : Helps confirm strength by comparing the current volume against a 20-period average, with an optional filter to ensure volume is at least twice the SMA.
User-Defined Toggle Filters :
Volume Filter : Confirms that the volume is above average (or twice the SMA) before taking trades.
ADX Trend Alignment Filter : Checks that the ADX’s directional indicators support the trade direction.
BB Close Confirmation : Optionally refines the entry by requiring price to be beyond the upper or lower Bollinger Band rather than just above or below.
RSI Divergence Exit : Allows the script to close positions if RSI divergence is detected.
BB Mean Reversion Exit : Closes positions if the price reverts to the Bollinger Bands’ middle line.
Risk/Reward Filter : Ensures that the potential reward is at least twice the risk by comparing the distance to the Bollinger Band with the ATR.
Candle Movement Filter : Optional filter to require a minimum percentage move in the candle to confirm momentum.
ADX Trend Exit : Closes positions if the ADX falls below the threshold and the directional indicators reverse.
Entry Conditions :
Bullish Entry :
RSI Divergence : Checks if the current close is lower than a previous low while the RSI is above the previous low, suggesting bullish divergence.
Bollinger Confirmation : Requires that the price is above the lower (or upper if confirmation is toggled) Bollinger Band.
Volume & Trend Filters : Combines volume condition, ADX strength, and an optional candle momentum condition.
Risk/Reward Check : Validates that the trade meets a favorable risk-to-reward ratio.
Bearish Entry :
Uses a mirror logic of the bullish entry by checking for bearish divergence, ensuring the price is below the appropriate Bollinger level, and confirming volume, trend strength, candle pattern, and risk/reward criteria.
Trade Execution and Exit Strateg y:
Trade Execution :
Upon meeting the entry conditions, the strategy initiates a long or short position.
Stop Loss & Trailing Stops :
A stop-loss is dynamically set using the ATR value, and trailing stops are implemented as a percentage of the close price.
Exit Conditions :
Additional exit filters can trigger early closures based on RSI divergence, mean reversion (via the middle Bollinger Band), or a weakening trend as signaled by ADX falling below its threshold.
This multi-layered exit strategy is designed to lock in gains or minimize losses if the market begins to reverse unexpectedly.
How the Strategy Works in Different Market Conditions :
Trending Markets :
The ADX filter ensures that trades are only taken when the trend is strong. When the market is trending, the directional movement indicators help confirm the momentum, making the reversal signal more reliable.
Ranging Markets :
In choppy markets, the Bollinger Bands expand and contract, while the RSI divergence can highlight potential turning points. The optional filters can be adjusted to avoid false signals in low-volume or low-volatility conditions.
Volatility Management :
With ATR-based stop-losses and a risk/reward filter, the strategy adapts to current market volatility, ensuring that risk is managed consistently.
Recommendation on using this Strategy with a Trading Bot :
This strategy is well-suited for high-frequency trading (HFT) due to its ability to quickly identify reversal setups and execute trades dynamically with automated stop-loss and trailing exits. By integrating this script with a TradingView webhook-based bot or an API-driven execution system, traders can automate trade entries and exits in real-time, reducing manual execution delays and capitalizing on fast market movements.
Disclaimer :
This script is provided for educational and informational purposes only. It is not intended as investment advice. Trading involves significant risk, and you should always conduct your own research and analysis before making any trading decisions. The author is not responsible for any losses incurred while using this script.

Trend Momentum Strength Indicator, Built for Pairs TradingOverview:
This script combines multiple indicators to provide a comprehensive analysis of both trend strength and trend momentum. It is tailored specifically for pairs trading strategies but can also be used for other trading strategies.
Benefit of Comprehensive Analysis:
Having an indicator that evaluates both trend strength and trend momentum is crucial for traders looking to make informed decisions. It allows traders to not only identify the direction and intensity of a trend but also gauge the momentum behind it. This dual capability helps in confirming potential trade opportunities, whether for entering trades with strong trends or considering reversals during overbought or oversold conditions. By integrating both aspects into one tool, traders can gain a holistic view of market dynamics, enhancing their ability to time entries and manage risk effectively.
Features:
* Trend Strength:
Enhanced ADX Formula: The script includes modifications to the standard ADX formula along with DI+ and DI- to provide more responsive trend strength readings.
Directional Indicators: DI+ (green line) indicates positive directional movement, while DI- (red line) indicates negative directional movement.
Trend Momentum:
Modified Stochastic Indicators: The script uses %K and %D indicators, modified and combined with ADX to give a clear indication of trend momentum.
Momentum Strength: This helps determine the strength and direction of the momentum.
Trading Signals:
Combining Indicators: The script combines ADX, DI+, DI-, %K, and %D to generate comprehensive trading signals.
Optimal Entry Points: Designed to identify optimal entry points for trades, particularly in pairs trading.
Colored Area at Bottom:
This area provides two easy-to-read functions:
Color:
Green: Upward momentum (ratio above 1)
Red: Downward momentum (ratio below 1)
Height:
Higher in green: Stronger upward momentum
Lower in red: Stronger downward momentum
Legend:
Green Line: DI+ (Positive)
Red Line: DI- (Negative)
Black Line: ADX
How to Read This Indicator:
1) Trend Direction:
DI+ above DI-: Indicates an upward trend.
DI- above DI+: Indicates a downward trend.
2) Trend Strength:
ADX below 20: Indicates a neutral trend.
ADX between 20 and 25: Indicates a weak trend.
ADX above 25: Indicates a strong trend.
Trading Signals in Pairs Trading:
Neutral Trend: Ideal for pairs trading when no strong trend is detected.
Overbought/Oversold: Uses %K and %D to identify overbought/oversold conditions that support trade decisions.
Entry Signals: Green signals for long positions, red signals for short positions, based on combined criteria of neutral trend strength and supportive momentum.
Application in Pairs Trading:
Neutral trend: In pairs trading strategies, where neutral movement is often sought, this indicator provides signals that are especially relevant during periods of neutral trend strength and supportive momentum, aiding traders in identifying optimal entry
Risk Management: Combining signals from ADX, DI+, DI-, %K, and %D helps traders make more informed decisions regarding entry points, enhancing risk management.
Example Chart (The indicator is on the upper right corner):
Clean Presentation: The chart only includes the necessary elements to demonstrate the indicator’s functionality.
Demonstrates: Overbought/oversold conditions, upward/downward/no momentum, and trading signals with/without specific scenarios.

AI SuperTrend x Pivot Percentile - Strategy [PresentTrading]█ Introduction and How it is Different
The AI SuperTrend x Pivot Percentile strategy is a sophisticated trading approach that integrates AI-driven analysis with traditional technical indicators. Combining the AI SuperTrend with the Pivot Percentile strategy highlights several key advantages:
1. Enhanced Accuracy in Trend Prediction: The AI SuperTrend utilizes K-Nearest Neighbors (KNN) algorithm for trend prediction, improving accuracy by considering historical data patterns. This is complemented by the Pivot Percentile analysis which provides additional context on trend strength.
2. Comprehensive Market Analysis: The integration offers a multi-faceted approach to market analysis, combining AI insights with traditional technical indicators. This dual approach captures a broader range of market dynamics.
BTC 6H L/S Performance
Local
█ Strategy: How it Works - Detailed Explanation
🔶 AI-Enhanced SuperTrend Indicators
1. SuperTrend Calculation:
- The SuperTrend indicator is calculated using a moving average and the Average True Range (ATR). The basic formula is:
- Upper Band = Moving Average + (Multiplier × ATR)
- Lower Band = Moving Average - (Multiplier × ATR)
- The moving average type (SMA, EMA, WMA, RMA, VWMA) and the length of the moving average and ATR are adjustable parameters.
- The direction of the trend is determined based on the position of the closing price in relation to these bands.
2. AI Integration with K-Nearest Neighbors (KNN):
- The KNN algorithm is applied to predict trend direction. It uses historical price data and SuperTrend values to classify the current trend as bullish or bearish.
- The algorithm calculates the 'distance' between the current data point and historical points. The 'k' nearest data points (neighbors) are identified based on this distance.
- A weighted average of these neighbors' trends (bullish or bearish) is calculated to predict the current trend.
For more please check: Multi-TF AI SuperTrend with ADX - Strategy
🔶 Pivot Percentile Analysis
1. Percentile Calculation:
- This involves calculating the percentile ranks for high and low prices over a set of predefined lengths.
- The percentile function is typically defined as:
- Percentile = Value at (P/100) × (N + 1)th position
- Where P is the desired percentile, and N is the number of data points.
2. Trend Strength Evaluation:
- The calculated percentiles for highs and lows are used to determine the strength of bullish and bearish trends.
- For instance, a high percentile rank in the high prices may indicate a strong bullish trend, and vice versa for bearish trends.
For more please check: Pivot Percentile Trend - Strategy
🔶 Strategy Integration
1. Combining SuperTrend and Pivot Percentile:
- The strategy synthesizes the insights from both AI-enhanced SuperTrend and Pivot Percentile analysis.
- It compares the trend direction indicated by the SuperTrend with the strength of the trend as suggested by the Pivot Percentile analysis.
2. Signal Generation:
- A trading signal is generated when both the AI-enhanced SuperTrend and the Pivot Percentile analysis agree on the trend direction.
- For instance, a bullish signal is generated when both the SuperTrend is bullish, and the Pivot Percentile analysis shows strength in bullish trends.
🔶 Risk Management and Filters
- ADX and DMI Filter: The strategy uses the Average Directional Index (ADX) and the Directional Movement Index (DMI) as filters to assess the trend's strength and direction.
- Dynamic Trailing Stop Loss: Based on the SuperTrend indicator, the strategy dynamically adjusts stop-loss levels to manage risk effectively.
This strategy stands out for its ability to combine real-time AI analysis with established technical indicators, offering traders a nuanced and responsive tool for navigating complex market conditions. The equations and algorithms involved are pivotal in accurately identifying market trends and potential trade opportunities.
█ Usage
To effectively use this strategy, traders should:
1. Understand the AI and Pivot Percentile Indicators: A clear grasp of how these indicators work will enable traders to make informed decisions.
2. Interpret the Signals Accurately: The strategy provides bullish, bearish, and neutral signals. Traders should align these signals with their market analysis and trading goals.
3. Monitor Market Conditions: Given that this strategy is sensitive to market dynamics, continuous monitoring is crucial for timely decision-making.
4. Adjust Settings as Needed: Traders should feel free to tweak the input parameters to suit their trading preferences and to respond to changing market conditions.
█Default Settings and Their Impact on Performance
1. Trading Direction (Default: "Both")
Effect: Determines whether the strategy will take long positions, short positions, or both. Adjusting this setting can align the strategy with the trader's market outlook or risk preference.
2. AI Settings (Neighbors: 3, Data Points: 24)
Neighbors: The number of nearest neighbors in the KNN algorithm. A higher number might smooth out noise but could miss subtle, recent changes. A lower number makes the model more sensitive to recent data but may increase noise.
Data Points: Defines the amount of historical data considered. More data points provide a broader context but may dilute recent trends' impact.
3. SuperTrend Settings (Length: 10, Factor: 3.0, MA Source: "WMA")
Length: Affects the sensitivity of the SuperTrend indicator. A longer length results in a smoother, less sensitive indicator, ideal for long-term trends.
Factor: Determines the bandwidth of the SuperTrend. A higher factor creates wider bands, capturing larger price movements but potentially missing short-term signals.
MA Source: The type of moving average used (e.g., WMA - Weighted Moving Average). Different MA types can affect the trend indicator's responsiveness and smoothness.
4. AI Trend Prediction Settings (Price Trend: 10, Prediction Trend: 80)
Price Trend and Prediction Trend Lengths: These settings define the lengths of weighted moving averages for price and SuperTrend, impacting the responsiveness and smoothness of the AI's trend predictions.
5. Pivot Percentile Settings (Length: 10)
Length: Influences the calculation of pivot percentiles. A shorter length makes the percentile more responsive to recent price changes, while a longer length offers a broader view of price trends.
6. ADX and DMI Settings (ADX Length: 14, Time Frame: 'D')
ADX Length: Defines the period for the Average Directional Index calculation. A longer period results in a smoother ADX line.
Time Frame: Sets the time frame for the ADX and DMI calculations, affecting the sensitivity to market changes.
7. Commission, Slippage, and Initial Capital
These settings relate to transaction costs and initial investment, directly impacting net profitability and strategy feasibility.

Machine Learning: Lorentzian Classification█ OVERVIEW
A Lorentzian Distance Classifier (LDC) is a Machine Learning classification algorithm capable of categorizing historical data from a multi-dimensional feature space. This indicator demonstrates how Lorentzian Classification can also be used to predict the direction of future price movements when used as the distance metric for a novel implementation of an Approximate Nearest Neighbors (ANN) algorithm.
█ BACKGROUND
In physics, Lorentzian space is perhaps best known for its role in describing the curvature of space-time in Einstein's theory of General Relativity (2). Interestingly, however, this abstract concept from theoretical physics also has tangible real-world applications in trading.
Recently, it was hypothesized that Lorentzian space was also well-suited for analyzing time-series data (4), (5). This hypothesis has been supported by several empirical studies that demonstrate that Lorentzian distance is more robust to outliers and noise than the more commonly used Euclidean distance (1), (3), (6). Furthermore, Lorentzian distance was also shown to outperform dozens of other highly regarded distance metrics, including Manhattan distance, Bhattacharyya similarity, and Cosine similarity (1), (3). Outside of Dynamic Time Warping based approaches, which are unfortunately too computationally intensive for PineScript at this time, the Lorentzian Distance metric consistently scores the highest mean accuracy over a wide variety of time series data sets (1).
Euclidean distance is commonly used as the default distance metric for NN-based search algorithms, but it may not always be the best choice when dealing with financial market data. This is because financial market data can be significantly impacted by proximity to major world events such as FOMC Meetings and Black Swan events. This event-based distortion of market data can be framed as similar to the gravitational warping caused by a massive object on the space-time continuum. For financial markets, the analogous continuum that experiences warping can be referred to as "price-time".
Below is a side-by-side comparison of how neighborhoods of similar historical points appear in three-dimensional Euclidean Space and Lorentzian Space:
This figure demonstrates how Lorentzian space can better accommodate the warping of price-time since the Lorentzian distance function compresses the Euclidean neighborhood in such a way that the new neighborhood distribution in Lorentzian space tends to cluster around each of the major feature axes in addition to the origin itself. This means that, even though some nearest neighbors will be the same regardless of the distance metric used, Lorentzian space will also allow for the consideration of historical points that would otherwise never be considered with a Euclidean distance metric.
Intuitively, the advantage inherent in the Lorentzian distance metric makes sense. For example, it is logical that the price action that occurs in the hours after Chairman Powell finishes delivering a speech would resemble at least some of the previous times when he finished delivering a speech. This may be true regardless of other factors, such as whether or not the market was overbought or oversold at the time or if the macro conditions were more bullish or bearish overall. These historical reference points are extremely valuable for predictive models, yet the Euclidean distance metric would miss these neighbors entirely, often in favor of irrelevant data points from the day before the event. By using Lorentzian distance as a metric, the ML model is instead able to consider the warping of price-time caused by the event and, ultimately, transcend the temporal bias imposed on it by the time series.
For more information on the implementation details of the Approximate Nearest Neighbors (ANN) algorithm used in this indicator, please refer to the detailed comments in the source code.
█ HOW TO USE
Below is an explanatory breakdown of the different parts of this indicator as it appears in the interface:
Below is an explanation of the different settings for this indicator:
General Settings:
Source - This has a default value of "hlc3" and is used to control the input data source.
Neighbors Count - This has a default value of 8, a minimum value of 1, a maximum value of 100, and a step of 1. It is used to control the number of neighbors to consider.
Max Bars Back - This has a default value of 2000.
Feature Count - This has a default value of 5, a minimum value of 2, and a maximum value of 5. It controls the number of features to use for ML predictions.
Color Compression - This has a default value of 1, a minimum value of 1, and a maximum value of 10. It is used to control the compression factor for adjusting the intensity of the color scale.
Show Exits - This has a default value of false. It controls whether to show the exit threshold on the chart.
Use Dynamic Exits - This has a default value of false. It is used to control whether to attempt to let profits ride by dynamically adjusting the exit threshold based on kernel regression.
Feature Engineering Settings:
Note: The Feature Engineering section is for fine-tuning the features used for ML predictions. The default values are optimized for the 4H to 12H timeframes for most charts, but they should also work reasonably well for other timeframes. By default, the model can support features that accept two parameters (Parameter A and Parameter B, respectively). Even though there are only 4 features provided by default, the same feature with different settings counts as two separate features. If the feature only accepts one parameter, then the second parameter will default to EMA-based smoothing with a default value of 1. These features represent the most effective combination I have encountered in my testing, but additional features may be added as additional options in the future.
Feature 1 - This has a default value of "RSI" and options are: "RSI", "WT", "CCI", "ADX".
Feature 2 - This has a default value of "WT" and options are: "RSI", "WT", "CCI", "ADX".
Feature 3 - This has a default value of "CCI" and options are: "RSI", "WT", "CCI", "ADX".
Feature 4 - This has a default value of "ADX" and options are: "RSI", "WT", "CCI", "ADX".
Feature 5 - This has a default value of "RSI" and options are: "RSI", "WT", "CCI", "ADX".
Filters Settings:
Use Volatility Filter - This has a default value of true. It is used to control whether to use the volatility filter.
Use Regime Filter - This has a default value of true. It is used to control whether to use the trend detection filter.
Use ADX Filter - This has a default value of false. It is used to control whether to use the ADX filter.
Regime Threshold - This has a default value of -0.1, a minimum value of -10, a maximum value of 10, and a step of 0.1. It is used to control the Regime Detection filter for detecting Trending/Ranging markets.
ADX Threshold - This has a default value of 20, a minimum value of 0, a maximum value of 100, and a step of 1. It is used to control the threshold for detecting Trending/Ranging markets.
Kernel Regression Settings:
Trade with Kernel - This has a default value of true. It is used to control whether to trade with the kernel.
Show Kernel Estimate - This has a default value of true. It is used to control whether to show the kernel estimate.
Lookback Window - This has a default value of 8 and a minimum value of 3. It is used to control the number of bars used for the estimation. Recommended range: 3-50
Relative Weighting - This has a default value of 8 and a step size of 0.25. It is used to control the relative weighting of time frames. Recommended range: 0.25-25
Start Regression at Bar - This has a default value of 25. It is used to control the bar index on which to start regression. Recommended range: 0-25
Display Settings:
Show Bar Colors - This has a default value of true. It is used to control whether to show the bar colors.
Show Bar Prediction Values - This has a default value of true. It controls whether to show the ML model's evaluation of each bar as an integer.
Use ATR Offset - This has a default value of false. It controls whether to use the ATR offset instead of the bar prediction offset.
Bar Prediction Offset - This has a default value of 0 and a minimum value of 0. It is used to control the offset of the bar predictions as a percentage from the bar high or close.
Backtesting Settings:
Show Backtest Results - This has a default value of true. It is used to control whether to display the win rate of the given configuration.
█ WORKS CITED
(1) R. Giusti and G. E. A. P. A. Batista, "An Empirical Comparison of Dissimilarity Measures for Time Series Classification," 2013 Brazilian Conference on Intelligent Systems, Oct. 2013, DOI: 10.1109/bracis.2013.22.
(2) Y. Kerimbekov, H. Ş. Bilge, and H. H. Uğurlu, "The use of Lorentzian distance metric in classification problems," Pattern Recognition Letters, vol. 84, 170–176, Dec. 2016, DOI: 10.1016/j.patrec.2016.09.006.
(3) A. Bagnall, A. Bostrom, J. Large, and J. Lines, "The Great Time Series Classification Bake Off: An Experimental Evaluation of Recently Proposed Algorithms." ResearchGate, Feb. 04, 2016.
(4) H. Ş. Bilge, Yerzhan Kerimbekov, and Hasan Hüseyin Uğurlu, "A new classification method by using Lorentzian distance metric," ResearchGate, Sep. 02, 2015.
(5) Y. Kerimbekov and H. Şakir Bilge, "Lorentzian Distance Classifier for Multiple Features," Proceedings of the 6th International Conference on Pattern Recognition Applications and Methods, 2017, DOI: 10.5220/0006197004930501.
(6) V. Surya Prasath et al., "Effects of Distance Measure Choice on KNN Classifier Performance - A Review." .
█ ACKNOWLEDGEMENTS
@veryfid - For many invaluable insights, discussions, and advice that helped to shape this project.
@capissimo - For open sourcing his interesting ideas regarding various KNN implementations in PineScript, several of which helped inspire my original undertaking of this project.
@RikkiTavi - For many invaluable physics-related conversations and for his helping me develop a mechanism for visualizing various distance algorithms in 3D using JavaScript
@jlaurel - For invaluable literature recommendations that helped me to understand the underlying subject matter of this project.
@annutara - For help in beta-testing this indicator and for sharing many helpful ideas and insights early on in its development.
@jasontaylor7 - For helping to beta-test this indicator and for many helpful conversations that helped to shape my backtesting workflow
@meddymarkusvanhala - For helping to beta-test this indicator
@dlbnext - For incredibly detailed backtesting testing of this indicator and for sharing numerous ideas on how the user experience could be improved.

Standard Error of the Estimate -Jon Andersen- V2Original implementation idea of bands by:
Traders issue: Stocks & Commodities V. 14:9 (375-379):
Standard Error Bands by Jon Andersen
Standard Error Bands are quite different than Bollinger's.
First, they are bands constructed around a linear regression curve.
Second, the bands are based on two standard errors above and below this regression line.
The error bands measure the standard error of the estimate around the linear regression line.
Therefore, as a price series follows the course of the regression line the bands will narrow , showing little error in the estimate. As the market gets noisy and random, the error will be greater resulting in wider bands .
Thanks to the work of @glaz & @XeL_arjona
In this version you can change the type of moving averages and the source of the bands.
Add a few studies of @dgtrd
1- ADX Colored Directional Movement Line
Directional Movement (DMI) (created by J. Welles Wilder ) consists of the Average Directional Index ( ADX ), to define whether or not there is a trend present, and Plus Directional Indicator (+D I) and Minus Directional Indicator (-D I) serve the purpose of determining trend direction
ADX Colored Directional Movement Line is custom interpretation of Directional Movement (DMI) with aim to present all 3 DMI indicator components with SINGLE line and ability to be added on top of the price chart (main chart)
How to interpret :
* triangle shapes:
▲- bullish : diplus >= diminus
▼- bearish : diplus < diminus
* colors:
green - bullish trend : adx >= strongTrend and di+ > di-
red - bearish trend : adx >= strongTrend and di+ < di-
gray - no trend : weekTrend < adx < strongTrend
yellow - week trend : adx < weekTrend
* color density:
darker : adx growing
lighter : adx falling
2- Volatility Colored Price/MA Line
Custom interpretation of the idea “Prices high above the moving average (MA) or low below it are likely to be remedied in the future by a reverse price movement”. Further details can be found under study “Price Distance to its MA by DGT”
How to interpret :
-▲ – Bullish , Price Action above Moving Average
-▼ – Bearish , Price Action below Moving Average
-Gray/Black - Low Volatility
-Green/Red – Price Action in Threshold Bands
-Dark Green/Red – Price Action Exceeds Threshold Bands
3- Volume Weighted Bar s
Volume Weighted Bars, a study of Kıvanç Özbilgiç, aims to present whether volume supports price movements. Volume Weighted Bars are calculated based on volume moving average.
How to interpret :
-Volume high above the volume moving average be displayed with red/green colors
-Average volume values will remain as they are and
-Volume low below the volume moving average will be indicated with darker colors
4- Fear & Greed index value, using technical anlysis approach calculated based on :
⮩1 - Price Momentum : Price Distance to its Moving Average
⮩2 - Strenght : Rate of Return, price movement over a period of time
⮩3 - Money Flow : Chaikin Money Flow, quantify changes in buying and selling pressure. CMF calculations is based on Accumulation/Distribution
⮩4 - Market Volatility : CBOE Volatility Index ( VIX ), the Volatility Index, or VIX , is a real-time market index that represents the market's expectation. It provides a measure of market risk and investors' sentiments
⮩5 -Safe Haven Demand: in this study GOLD demand is assumed
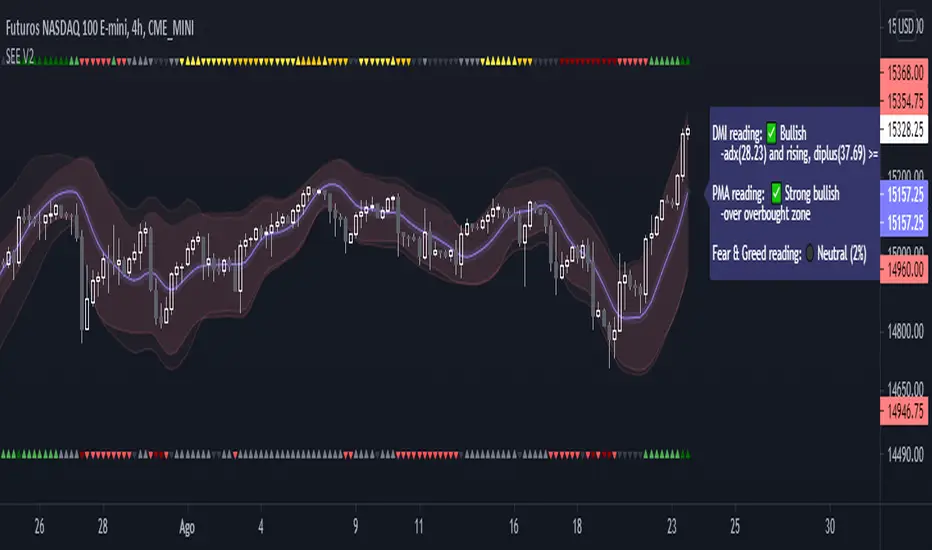
Estrategia de Monitor - RSI/EMAThis indicator, competes the signals of two of the most important and reliable indicators for monitoring price trends, the Squeeze Monitor and the RSI.
For a better visualization of the relationship of the indicators with the price, the Squeeze Monitor is presented in colored bars that represent the trend of the indicator. The RSI is combined with the EMA of the RSI that supports its directionality.
As additional support for decision making, the ADX is also plotted, as an element to project the force of the next movement.
The indicator settings are presented in the configuration of the indicator. The following parameters can be adjusted there:
** Monitor Parameters **
Monitor Length Squeeze -> "Long. Monitor"
** ADX parameters **
ADX Longitug -> "Long. ADX"
ADX Smoother -> "Suavizador ADX"
ADX Variation Factor -> "Factor Var. ADX"
This parameter defines the minimum variation for the
ADX address highlighting
** RSI parameters **
RSI Length -> "Long. RSI"
RSI Smoothing -> "Suavizador RSI"
RSI EMA Length -> "Long. EMA del RSI"
Finally, the Script consolidates the information, based on the trends of the indicators, and changes the color of the candle body. The color code considers Green for the uptrend, Red for the Downtrend and Yellow in transition processes (not operable).

PSAR Laboratory [DAFE]PSAR Laboratory : The Ultimate Adaptive Trailing Stop & Reversal Engine
23 Advanced Algorithms. Adaptive Acceleration. Smart Flip Logic. Parabolic SAR Reimagined.
█ PHILOSOPHY: WELCOME TO THE LABORATORY
The standard Parabolic SAR, created by the legendary J. Welles Wilder Jr., is a tool of beautiful simplicity. But in today's complex, algorithm-driven markets, its simplicity is its fatal flaw. Its fixed acceleration and rigid flip logic cause it to fail precisely when you need it most: it whipsaws in choppy conditions and gives back too much profit in strong trends.
The PSAR Laboratory was not created to be just another PSAR. It was engineered to be the definitive evolution of Wilder's original concept. This is not an indicator; it is a powerful, interactive research environment. It is a sandbox where you, the trader, can move beyond the static "one-size-fits-all" approach and forge a PSAR that is perfectly adapted to your specific market, timeframe, and trading style.
We have deconstructed the very DNA of the Parabolic SAR and rebuilt it from the ground up, infusing it with modern quantitative techniques. The result is an institutional-grade suite of 23 distinct, mathematically diverse algorithms that dynamically control every aspect of the PSAR's behavior.
█ WHAT MAKES THIS A "LABORATORY"? THE CORE INNOVATIONS
This tool stands in a class of its own. It is a collection of what could be 23 separate indicators, all seamlessly integrated into one powerful engine.
The 23 Algorithm Engine: This is the heart of the Laboratory. Instead of one rigid formula, you have a library of 23 unique mathematical engines at your command. These algorithms are not simple tweaks; they are complete re-imaginings of how the PSAR should behave, based on concepts from information theory, digital signal processing, fractal geometry, and institutional analysis.
Truly Adaptive Acceleration (AF): The standard PSAR's "gas pedal" (the AF) is dumb; it accelerates at a fixed rate. Our algorithms make it intelligent. The AF can now speed up in clean, trending environments to lock in profits, and automatically slow down in choppy, chaotic conditions to avoid whipsaws.
Advanced Flip Confirmation Logic: Say goodbye to noise-driven flips. You are no longer at the mercy of a single wick touching the SAR. The Laboratory provides multiple layers of flip confirmation, including requiring a bar close beyond the SAR, a volume spike to validate the reversal, or even a multi-bar confirmation .
Comprehensive Noise Filtering Core: In a revolutionary step, you can apply one of over 30 advanced signal processing filters directly to the SAR output itself. From ultra-low-lag filters like the Hull MA and DAFE Spectral Laguerre to adaptive filters like KAMA and FRAMA , you can surgically remove noise while preserving the responsiveness of the core signal.
Integrated Performance Engine: How do you know which of the 23 algorithms is best for your market? You test it. The built-in Performance Dashboard is a comprehensive backtesting and analytics engine that tracks every trade, providing real-time data on Win Rate, Profit Factor, Max Drawdown, and more. It allows you to scientifically validate your chosen configuration.
█ A GUIDED TOUR OF THE ALGORITHMS: 23 PATHS TO AN EDGE
b]These 23 algorithms are not simple settings; they are distinct mathematical philosophies for how a Parabolic SAR should adapt to the market. They are grouped into three primary categories: those that adapt the Acceleration Factor (AF) , those that enhance the Extreme Point (EP) detection, and those that redefine the Flip Logic .
CATEGORY A: ACCELERATION FACTOR (AF) ADAPTATION
These algorithms dynamically change the "gas pedal" of the PSAR.
1. Volatility-Scaled AF
Core Concept: Treats volatility as market friction. The PSAR should be more forgiving in high-volatility environments.
How It Works: It calculates a Volatility Ratio by comparing the short-term ATR to the long-term ATR. If current volatility is high (ratio > 1), it reduces the AF Step. If volatility is low (ratio < 1), it increases the AF Step to trail tighter.
Ideal Use Case: The best all-rounder. Excellent for any market, especially those with clear shifts between high and low volatility regimes (like indices and crypto).
2. Efficiency Ratio (ER) AF
Core Concept: The PSAR should accelerate aggressively in clean, efficient trends and slow down dramatically in choppy, inefficient markets.
How It Works: It uses Kaufman's Efficiency Ratio (ER), which measures the net directional movement versus the total price movement. A high ER (near 1.0) signifies a pure trend, triggering a high AF multiplier. A low ER (near 0.0) signifies chop, triggering a low AF multiplier.
Ideal Use Case: Markets that alternate between strong trends and sideways chop. It is exceptionally good at surviving ranging periods.
3. Shannon Entropy AF
Core Concept: Uses Information Theory to measure market disorder. The PSAR should be conservative in chaos and aggressive in order.
How It Works: It calculates the Shannon Entropy of recent price changes. High entropy means the market is unpredictable ("chaotic"), causing the AF to slow down. Low entropy means the market is organized and trending, causing the AF to speed up.
Ideal Use Case: Advanced traders looking for a mathematically pure way to distinguish between a tradable trend and random noise.
4. Fractal Dimension (FD) AF
Core Concept: Measures the "jaggedness" or complexity of the price path. A smooth path is a trend; a jagged, space-filling path is chop.
How It Works: It calculates the Fractal Dimension of the price series. An FD near 1.0 is a smooth line (high AF). An FD near 1.5 is a random walk (low AF).
Ideal Use Case: Visually identifying the moment a smooth trend begins to break down into chaotic, unpredictable movement.
5. ADX-Gated AF
Core Concept: Uses the classic ADX indicator to confirm the presence of a trend before allowing the PSAR to accelerate.
How It Works: If the ADX value is above a "Strong" threshold (e.g., 25), the AF accelerates normally. If the ADX is below a "Weak" threshold (e.g., 15), the AF is "frozen" and will not increase, preventing the SAR from tightening up in a non-trending market.
Ideal Use Case: For classic trend-following purists who trust the ADX as their primary regime filter.
6. Kalman AF Estimator
Core Concept: A sophisticated signal processing algorithm that predicts the "true" optimal AF by filtering out price "noise."
How It Works: It treats the PSAR's AF as a state to be estimated. It makes a prediction, then corrects it based on how far the actual price deviates. It's like a GPS constantly refining its position. The "Process Noise" input controls how fast it thinks the AF can change, while "Measurement Noise" controls how much it trusts the price data.
Ideal Use Case: Smooth, high-inertia markets like commodities or major forex pairs. It creates an incredibly smooth and responsive AF.
7. Volume-Momentum AF
Core Concept: A trend's acceleration is only valid if confirmed by both volume and price momentum.
How It Works: The AF will only increase if a new Extreme Point is made on above-average volume AND the Rate of Change (ROC) of the price is aligned with the trend's direction.
Ideal Use Case: Any market with reliable volume data (stocks, futures, crypto). It's excellent for filtering out low-conviction moves.
8. Garman-Klass (GK) AF
Core Concept: Uses a more advanced, statistically efficient measure of volatility (Garman-Klass, which uses OHLC data) to adapt the AF.
How It Works: It modulates the AF based on whether the current GK volatility is higher or lower than its historical average. Unlike the standard Volatility-Scaled algo, it tends to slow down more in high volatility and speed up less in low volatility, making it more conservative.
Ideal Use Case: Traders who want a volatility-adaptive model that is more focused on risk reduction during volatile periods.
9. RSI-Modulated AF
Core Concept: The RSI can identify points of potential trend exhaustion or strong momentum.
How It Works: If a trend is bullish but the RSI enters the "Overbought" zone, the AF slows down, anticipating a pullback. Conversely, if the RSI is in the strong momentum mid-range (40-60), the AF is boosted to trail more aggressively.
Ideal Use Case: Mean-reversion traders or those who want to automatically loosen their trail stop near potential exhaustion points.
10. Bollinger Squeeze AF
Core Concept: A Bollinger Band Squeeze signals a period of volatility compression, often preceding an explosive breakout.
How It Works: When the algorithm detects that the Bollinger Band Width is in a "Squeeze" (below a certain historical percentile), it boosts the AF in anticipation of a fast move, allowing the PSAR to catch the breakout quickly.
Ideal Use Case: Breakout traders. This algorithm primes the PSAR to be maximally responsive right at the moment a breakout is most likely.
11. Keltner Adaptive AF
Core Concept: Keltner Channels provide a robust measure of a trend's "normal" volatility channel.
How It Works: When price is trading strongly outside the Keltner Channel, it's considered a powerful trend, and the AF is boosted. When price falls back inside the channel, it's considered a consolidation or pullback, and the AF is slowed down.
Ideal Use Case: Trend followers who use channel breakouts as their primary confirmation.
12. Choppiness-Gated AF
Core Concept: Uses the Choppiness Index to quantify whether the market is trending or consolidating.
How It Works: If the Choppiness Index is below the "Trend" threshold (e.g., 38.2), the AF is boosted. If it's above the "Range" threshold (e.g., 61.8), the AF is significantly reduced.
Ideal Use Case: A more responsive alternative to the ADX-Gated algorithm for distinguishing between trending and ranging markets.
13. VIDYA-Style AF
Core Concept: Uses a Chande Momentum Oscillator (CMO) to create a variable-speed acceleration factor.
How It Works: The absolute value of the CMO is used to create a dynamic smoothing constant. Strong momentum (high absolute CMO) results in a faster, more responsive AF. Weak momentum results in a slower, smoother AF.
Ideal Use Case: Momentum traders who want their trailing stop's speed directly tied to the momentum of the price itself.
14. Hilbert Cycle AF
Core Concept: Uses Ehlers' Hilbert Transform to extract the dominant cycle period of the market and synchronizes the PSAR with it.
How It Works: It dynamically adjusts the AF based on the detected cycle period (shorter cycles = faster AF) and can also modulate it based on the current phase within that cycle (e.g., accelerate faster near cycle tops/bottoms).
Ideal Use Case: Markets with clear cyclical behavior, like commodities and some forex pairs.
CATEGORY B: EXTREME POINT (EP) ENHANCEMENT
These algorithms make the detection of new highs/lows more intelligent.
15. Volume-Weighted EP
Core Concept: A new high or low is more significant if it occurs on high volume.
How It Works: It can be configured to only accept a new EP if the volume on that bar is above average. It can also "weight" the EP by volume, pushing it further out on high-volume bars.
Ideal Use Case: Filtering out weak, low-conviction price probes in markets with reliable volume.
16. Wavelet Filtered EP
Core Concept: Uses wavelet decomposition (a signal processing technique) to separate the underlying trend from high-frequency noise.
How It Works: It calculates a smoothed, wavelet-filtered version of the price. A new EP is only registered if the actual high/low significantly exceeds this smoothed baseline, effectively ignoring minor noise spikes.
Ideal Use Case: Noisy markets where small, insignificant wicks can cause the AF to accelerate prematurely.
17. ATR-Validated EP
Core Concept: A new EP should represent a meaningful move, not just a one-tick poke.
How It Works: It requires a new high/low to exceed the previous EP by a minimum amount, defined as a multiple of the current ATR. This ensures only volatility-significant advances are counted.
Ideal Use Case: A simple, robust way to filter out "noise" EPs and slow down the AF's acceleration in choppy conditions.
18. Statistical EP Filter
Core Concept: A new EP is only valid if the price change that created it is statistically significant.
How It Works: It calculates the Z-Score of the bar's price change relative to recent history. A new EP is only accepted if its Z-Score exceeds a certain threshold (e.g., 1.5 sigma), meaning it was an unusually strong move.
Ideal Use Case: For quantitative traders who want to ensure their trailing stop only tightens in response to statistically meaningful price action.
CATEGORY C: FLIP LOGIC & CONFIRMATION
These algorithms change the very rules of when and why the PSAR reverses.
19. Dual-PSAR Gate
Core Concept: Uses two PSARs—one fast and one slow—to confirm a reversal.
How It Works: A flip signal for the main PSAR is only considered valid if both the fast (sensitive) PSAR and the slow (structural) PSAR have flipped. This acts as a powerful trend filter.
Ideal Use Case: An excellent method for reducing whipsaws. It forces the PSAR to wait for both short-term and longer-term momentum to align before signaling a reversal.
20. MTF Coherence PSAR
Core Concept: Do not flip against the higher timeframe macro trend.
How It Works: It pulls PSAR data from two higher timeframes. A flip is only allowed if the new direction does not contradict the trend on at least one (or both) of those higher timeframes. It also boosts the AF when all timeframes are aligned.
Ideal Use Case: The ultimate tool for multi-timeframe traders who want to ensure their entries and exits are in sync with the bigger picture.
21. Momentum-Gated Flip
Core Concept: A reversal is only valid if it is supported by a significant surge of momentum.
How It Works: A price cross of the SAR is not enough. The script also requires the Rate of Change (ROC) to exceed a certain threshold for a set number of bars, confirming that there is real force behind the reversal.
Ideal Use Case: Filtering out weak, drifting reversals and only taking signals that are initiated with explosive power.
22. Close-Only PSAR
Core Concept: Wicks are noise; the bar's close is the final decision.
How It Works: This algorithm modifies the flip logic to ignore wicks. A flip only occurs if one or more bars close beyond the SAR line.
Ideal Use Case: One of the most effective and simple ways to reduce false signals from volatile wicks. A fantastic default choice for any trader.
23. Ultimate PSAR Consensus
Core Concept: The highest conviction signal comes from the agreement of multiple, diverse mathematical models.
How It Works: This is the capstone algorithm. It runs a "vote" between a selection of the top-performing algorithms (e.g., Volatility-Scaled, Efficiency Ratio, Dual-PSAR). A flip is only signaled if a majority consensus is reached. It can even weight the votes based on each algorithm's recent performance.
Ideal Use Case: For traders who want the absolute highest level of confirmation and are willing to accept fewer, but more robust, signals.
█ PART II: THE NOISE FILTERING CORE - The Shield
This is a revolutionary feature that allows you to apply a second layer of signal processing directly to the SAR line itself, surgically removing noise before the flip logic is even considered.
FILTER CATEGORIES
Basic Filters (SMA, EMA, WMA, RMA): The classic moving averages. They provide basic smoothing but introduce significant lag. Best used for educational purposes.
Low-Lag Filters (DEMA, TEMA, Hull MA, ZLEMA): A family of filters designed to reduce the lag inherent in basic moving averages. The Hull MA is a standout, offering a superb balance of smoothness and responsiveness.
Adaptive Filters (KAMA, VIDYA, FRAMA): These are "smart" filters. They automatically adjust their smoothing level based on market conditions. They will be very smooth in choppy markets and become highly responsive in trending markets.
Advanced DSP & DAFE Filters: This is the pinnacle of signal processing.
Ehlers Filters (SuperSmoother, 2-Pole, 3-Pole): Based on the work of John Ehlers, these use digital signal processing techniques to remove high-frequency noise with minimal lag.
Gaussian & ALMA: These use a bell-curve weighting, giving the most importance to recent data in a smooth, non-linear fashion.
DAFE Spectral Laguerre: A proprietary, non-linear filter that uses a feedback loop and adapts its "gamma" based on volatility, providing exceptional tracking in all market conditions.
How to Choose a Filter
Start with "None": First, find an algorithm you like with no filtering to understand its raw behavior.
Introduce Low Lag: If you are getting too many whipsaws from noise, apply a short-length Hull MA (e.g., 5-8). This is often the best solution.
Go Adaptive: If your market has very distinct trend/chop regimes, try an Adaptive KAMA .
Maximum Purity: For the smoothest possible output with excellent responsiveness, use the DAFE Spectral Laguerre or Ehlers SuperSmoother .
█ THE VISUAL EXPERIENCE: DATA AS ART
The PSAR Laboratory is not just functional; it is beautiful. The visualization engine is designed to provide you with an intuitive, at-a-glance understanding of the market's state.
Algorithm-Specific Theming: Each of the 23 algorithms comes with its own unique, professionally designed color palette. This not only provides visual variety but allows you to instantly recognize which engine is active.
Dynamic Glow Effects: For many algorithms, the PSAR dots will emit a soft "glow." The brightness and color of this glow are not random; they are tied to a key metric of the active algorithm (e.g., trend strength, volatility, consensus), providing a subtle, visual cue about the health of the trend.
Adaptive Volatility Bands: Certain algorithms will display dynamic bands around the PSAR. These are not standard deviation bands; their width is controlled by the specific logic of the active algorithm, showing you a visual representation of the market's expected range or energy level.
Secondary Reference Lines: For algorithms like the Dual-PSAR or MTF Coherence, a secondary line will be plotted on the chart, giving you a clear visual of the underlying data (e.g., the slow PSAR, the HTF trend) that is driving the decision-making process.
█ THE MASTER DASHBOARD: YOUR MISSION CONTROL
The comprehensive dashboard is your unified command center for analysis and performance tracking.
Engine Status: See the currently selected Algorithm, the active Noise Filter, the Trend direction, and a real-time progress bar of the current Acceleration Factor (AF).
Algorithm-Specific Metrics: This is the most powerful section. It displays the key real-time data from the currently active algorithm. If you're using "Shannon Entropy," you'll see the Entropy score. If you're using "ADX-Gated," you'll see the ADX value. This gives you a direct, quantitative look under the hood.
Performance Readout: When enabled, this section provides a full breakdown of your backtesting results, including Win Rate, Profit Factor, Net P&L, Max Drawdown, and your current trade status.
█ DEVELOPMENT PHILOSOPHY
The PSAR Laboratory was born from a deep respect for Wilder's original work and a relentless desire to push it into the 21st century. We believe that in modern markets, static tools are obsolete. The future of trading lies in adaptation. This indicator is for the serious trader, the tinkerer, the scientist—the individual who is not content with a black box, but who seeks to understand, test, and refine their edge with surgical precision. It is a tool for forging, not just following.
The PSAR Laboratory is designed to be the ultimate tool for that evolution, allowing you to discover and codify the rules that truly fit you.
█ DISCLAIMER AND BEST PRACTICES
THIS IS A TOOL, NOT A STRATEGY: This indicator provides a sophisticated trailing stop and reversal signal. It must be integrated into a complete trading plan that includes risk management, position sizing, and your own contextual analysis.
TEST, DON'T GUESS: The power of this tool is its adaptability. Use the Performance Dashboard to rigorously test different algorithms and settings on your chosen asset and timeframe. Find what works, and build your strategy around that data.
START SIMPLE: Begin with the "Volatility-Scaled AF" algorithm, as it is a powerful and intuitive all-rounder. Once you are comfortable, begin experimenting with other engines.
RISK MANAGEMENT IS PARAMOUNT: All trading involves substantial risk. The backtesting results are hypothetical and do not account for slippage or psychological factors. Never risk more capital than you are prepared to lose.
"I don't think traders can follow rules for very long unless they reflect their own trading style. Eventually, a breaking point is reached and the trader has to quit or change, or find a new set of rules he can follow. This seems to be part of the process of evolution and growth of a trader."
— Ed Seykota, Market Wizard
Taking you to school. - Dskyz, Trade with Volume. Trade with Density. Trade with DAFE

EL OJO DE DIOS - FINAL (ORDEN CORREGIDO)//@version=6
indicator("EL OJO DE DIOS - FINAL (ORDEN CORREGIDO)", overlay=true, max_boxes_count=500, max_lines_count=500, max_labels_count=500)
// --- 1. CONFIGURACIÓN ---
grpEMA = "Medias Móviles"
inpShowEMA = input.bool(true, "Mostrar EMAs", group=grpEMA)
inpEMA21 = input.int(21, "EMA 21", minval=1, group=grpEMA)
inpEMA50 = input.int(50, "EMA 50", minval=1, group=grpEMA)
inpEMA200 = input.int(200, "EMA 200", minval=1, group=grpEMA)
grpStrategy = "Estrategia"
inpTrendTF = input.string("Current", "Timeframe Señal", options= , group=grpStrategy)
inpADXFilter = input.bool(true, "Filtro ADX", group=grpStrategy)
inpADXPeriod = input.int(14, "Período ADX", group=grpStrategy)
inpADXLimit = input.int(20, "Límite ADX", group=grpStrategy)
inpRR = input.float(2.0, "Riesgo:Beneficio", group=grpStrategy)
grpVisuals = "Visuales"
inpShowPrevDay = input.bool(true, "Máx/Mín Ayer", group=grpVisuals)
inpShowNY = input.bool(true, "Sesión NY", group=grpVisuals)
// --- 2. VARIABLES ---
var float t1Price = na
var bool t1Bull = false
var bool t1Conf = false
var line slLine = na
var line tpLine = na
// Variables Prev Day
var float pdH = na
var float pdL = na
var line linePDH = na
var line linePDL = na
// Variables Session
var box nySessionBox = na
// --- 3. CÁLCULO ADX MANUAL ---
f_calcADX(_high, _low, _close, _len) =>
// True Range Manual
tr = math.max(_high - _low, math.abs(_high - _close ), math.abs(_low - _close ))
// Directional Movement
up = _high - _high
down = _low - _low
plusDM = (up > down and up > 0) ? up : 0.0
minusDM = (down > up and down > 0) ? down : 0.0
// Smoothed averages
atr = ta.rma(tr, _len)
plus = 100.0 * ta.rma(plusDM, _len) / atr
minus = 100.0 * ta.rma(minusDM, _len) / atr
// DX y ADX
sum = plus + minus
dx = sum == 0 ? 0.0 : 100.0 * math.abs(plus - minus) / sum
adx = ta.rma(dx, _len)
adx
// --- 4. CÁLCULO DE DATOS ---
ema21 = ta.ema(close, inpEMA21)
ema50 = ta.ema(close, inpEMA50)
ema200 = ta.ema(close, inpEMA200)
// MTF Logic
targetTF = inpTrendTF == "Current" ? timeframe.period : inpTrendTF == "15m" ? "15" : "60"
// CORRECCIÓN AQUÍ: Uso de argumentos nominales (gaps=, lookahead=) para evitar errores de orden
f_getSeries(src, tf) =>
tf == timeframe.period ? src : request.security(syminfo.tickerid, tf, src, gaps=barmerge.gaps_on, lookahead=barmerge.lookahead_off)
tf_close = f_getSeries(close, targetTF)
tf_high = f_getSeries(high, targetTF)
tf_low = f_getSeries(low, targetTF)
tf_ema21 = ta.ema(tf_close, inpEMA21)
tf_ema50 = ta.ema(tf_close, inpEMA50)
// Calcular ADX
float tf_adx = f_calcADX(tf_high, tf_low, tf_close, inpADXPeriod)
// Cruces
bool crossUp = ta.crossover(tf_ema21, tf_ema50)
bool crossDown = ta.crossunder(tf_ema21, tf_ema50)
bool crossSignal = crossUp or crossDown
bool adxOk = inpADXFilter ? tf_adx > inpADXLimit : true
// --- 5. LÓGICA DE SEÑALES ---
if crossSignal and adxOk and barstate.isconfirmed
t1Price := tf_ema21
t1Bull := tf_ema21 > tf_ema50
t1Conf := false
if not na(slLine)
line.delete(slLine)
slLine := na
if not na(tpLine)
line.delete(tpLine)
tpLine := na
label.new(bar_index, high + (ta.atr(14)*0.5), text="CRUCE T1", color=t1Bull ? color.green : color.red, textcolor=color.white, size=size.small)
bool touch = false
if not na(t1Price) and not t1Conf
if t1Bull
touch := low <= t1Price and close >= t1Price
else
touch := high >= t1Price and close <= t1Price
if touch and barstate.isconfirmed
t1Conf := true
float atr = ta.atr(14)
float sl = t1Bull ? low - (atr*0.1) : high + (atr*0.1)
float dist = math.abs(t1Price - sl)
float tp = t1Bull ? t1Price + (dist * inpRR) : t1Price - (dist * inpRR)
label.new(bar_index, t1Price, text="ENTRADA", color=color.yellow, textcolor=color.black, size=size.small)
slLine := line.new(bar_index, sl, bar_index + 15, sl, color=color.red, style=line.style_dashed, width=2)
tpLine := line.new(bar_index, tp, bar_index + 15, tp, color=color.green, style=line.style_dashed, width=2)
// --- 6. GRÁFICO ---
col21 = ema21 > ema21 ? color.teal : color.maroon
col50 = ema50 > ema50 ? color.aqua : color.fuchsia
col200 = ema200 > ema200 ? color.blue : color.red
plot(inpShowEMA ? ema21 : na, "EMA21", color=col21, linewidth=2)
plot(inpShowEMA ? ema50 : na, "EMA50", color=col50, linewidth=2)
plot(inpShowEMA ? ema200 : na, "EMA200", color=col200, linewidth=2)
bgcolor(ema50 > ema200 ? color.new(color.green, 95) : color.new(color.red, 95))
// --- 7. SESIÓN NY ---
isNYSummer = (month(time) == 3 and dayofmonth(time) >= 14) or (month(time) > 3 and month(time) < 11)
hourOffset = isNYSummer ? 4 : 5
nyHour = (hour - hourOffset) % 24
bool isSession = nyHour >= 6 and nyHour < 11
if isSession and inpShowNY
if na(nySessionBox)
nySessionBox := box.new(bar_index, high, bar_index, low, bgcolor=color.new(color.blue, 92), border_color=color.new(color.white, 0))
else
box.set_right(nySessionBox, bar_index)
box.set_top(nySessionBox, math.max(high, box.get_top(nySessionBox)))
box.set_bottom(nySessionBox, math.min(low, box.get_bottom(nySessionBox)))
if not isSession and not na(nySessionBox)
box.delete(nySessionBox)
nySessionBox := na
// --- 8. MÁX/MÍN AYER ---
hCheck = request.security(syminfo.tickerid, "D", high , lookahead=barmerge.lookahead_on)
lCheck = request.security(syminfo.tickerid, "D", low , lookahead=barmerge.lookahead_on)
if not na(hCheck)
pdH := hCheck
if not na(lCheck)
pdL := lCheck
if barstate.islast and inpShowPrevDay
line.delete(linePDH)
line.delete(linePDL)
if not na(pdH)
linePDH := line.new(bar_index - 50, pdH, bar_index, pdH, color=color.green)
if not na(pdL)
linePDL := line.new(bar_index - 50, pdL, bar_index, pdL, color=color.red)
alertcondition(crossSignal, "Cruce T1", "Cruce Tendencia 1")
alertcondition(touch, "Entrada Confirmada", "Entrada Confirmada")

Market Regime: Squeeze Box + Trend DashboardMarket Regime: Squeeze Box + Trend Dashboard
Market Regime is a overlay designed to provide instant market context (trend vs consolidation) and highlight volatility compression (squeeze) setups before potential breakouts. Built with stock charts in mind, it focuses on clean visuals and practical decision support.
What this indicator shows:
1) Market Regime (TREND / RANGE / NEUTRAL)
The regime is detected using DMI/ADX with built-in confirmation to reduce flicker:
TREND : ADX stays above a threshold for N bars
RANGE : ADX stays below a threshold for N bars
NEUTRAL : neither trend nor range is confirmed
Trend direction is derived from DI+ vs DI- (UP / DOWN / MIXED).
2) Squeeze (BB inside KC)
A squeeze is detected when Bollinger Bands contract inside Keltner Channels (volatility compression).
SQZ = squeeze start
REL = squeeze release (the first bar *after* squeeze — technically correct)
3) Squeeze Box
The core feature: a box drawn from SQZ → REL , dynamically tracking the highest high / lowest low during the squeeze. This creates a clean visual range for the compression zone and helps frame breakout context.
4) EMA Ribbon with ADX-based intensity
Two EMAs (fast/slow) form a ribbon. The fill becomes more pronounced as ADX strength increases, making trend momentum easier to read at a glance.
5) Trend Dashboard (corner panel)
A compact dashboard summarizing key metrics:
REGIME, DIR, ADX (with normalized strength %)
SQUEEZE ON/OFF
Relative Volume (relVol + tier)
ATR% (14), EMA Slope%, GAP% (Open vs previous Close)
Customization / Settings
Fully configurable for different styles and markets:
ADX/DMI lengths and thresholds
BB/KC parameters (lengths and multipliers)
Relative Volume thresholds
Background mode: Off / Squeeze only / All regimes
Visual toggles: ribbon, squeeze box, markers, dashboard
History controls and limits for boxes/labels (clean chart + performance)
How to use (practical workflow)
Trend context : read REGIME + DIR and ribbon intensity (ADX strength).
Squeeze setup : when squeeze is active, the box defines the compression range (high/low).
Release : REL marks the first bar after squeeze ends (potential breakout/expansion context).
Notes
No look-ahead logic is used; calculations rely on current and historical bars only.
On realtime (still-forming) candles, values can change intrabar, normal behavior for indicators computed on the current bar.
Trading Disclaimer:
This indicator is provided for research and informational purposes only and does not constitute financial advice. Past performance is not indicative of future results. Use at your own risk. You are solely responsible for any trading decisions made using this script.
