Intraday TS ,BB + Buy/Sell +Squeeze Mom.+ adx-dmiIntraday 5+ min indicator/strategy. Mix of indicator as BB, Ema , Roc , adx/dmi with buy and TP/SL point. All in 1 indicator easy to use . Just look the color chnge and the shape add the the bars
Cari skrip untuk "adx"

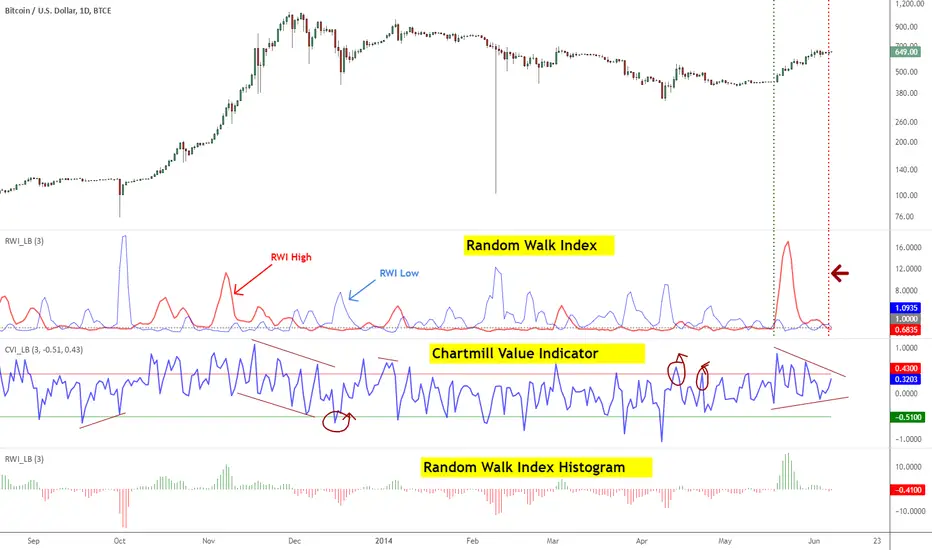
Indicators: Chartmill Value Indicator & Random Walk IndexChartMill Value Indicator & Modified ChartMill Value Indicator :
-------------------------------
Developed by Dirk Vandycke, CVI tracks how far the price spread is from its MA. Since MA keeps increasing even when price consolidates or stalls, it is very difficult for the deviation from a moving average to remain in the overbought or oversold regions for extended periods, which represents a significant improvement over other oscillators such as the RSI and Stochastic indicators.
However, a simple price spread from a moving average would not be comparable across all securities, which would preclude us from using the spread in systematic strategies. Fortunately, Mr.Vandycke addresses this problem by dividing the spread by the average true range, which is dependent on both the price level and volatility of the underlying security.
There is a variation of CVI called Modified CVI, which does time normalization of ATR (not the MA). This indicator supports displaying "Modified CVI" too. Check the options page.
This indicator is best used with other oscillators, to confirm signals. Zero line (in this case, "1" line since the gray line is drawn at the value of 1) crossovers should also be considered as signals.
I suggest tuning the OB/OS levels to match your instrument (usually it is around 0.5/-0.5 range).
More info:
www.traders.com
Random Walk Index
-------------------------
RWI is used to determine if an issue is trending or in a random trading range (like ADX/Aroon). It attempts to do this by first determining an issue's trading range. The next step is to calculate a series of RWI indexes for the maximum look-back period. The largest index move in relation to a random walk is used as today's index.
Michael Poulos, inventor of RWI, recommends 2 to 7 for the short-term time frames and 8-64 for long terms. An issue is trending higher if the long term RWI of highs is greater than 1, while a downtrend is indicated if the long term RWI of lows is greater than 1.
Below are some more rules developed by Mr.Poulos:
- Enter a long (or close short) when the long-term RWI of the highs is greater than 1 and the short-term RWI of lows peaks above 1
- Enter short (or close long) when the long-term RWI of the lows is greater than 1 and the short-term RWI of highs peaks above 1
More info:
- tradingsim.com
For displaying only the histogram (as shown in the bottom pane), select "ShowOnlyHistogram" in the options page.
Directional Movement Index-25adx with horizontal lines
low line 15 for low volume
mid line 25
high line 40 for high volume and maybe reverse

ADX DI Signal v1.BitUniversityAverage Directional Index with buy and sell signals
This oscillator is used in a training course conducted by @Bituniversity
For a reliable trading you need more information related to market and this oscillator just give us a big picture of of the market.
Please, do not trade just using this tool alone.

ADX and DI+ & DI- sub levelsThis indicator contains 3 levels of configuration to measure the strength of DI + and DI- when any of the two is below level 20 it is possible that the price will change trend.
Este indicador contiene 3 niveles de configuracion para medir la fuerza de DI+ y DI- cuando cualquira de los dos este por debajo del nivel 20 es posible que el precio cambie de tendencia.

ADX indicatorUsed for trendanalysis - fill colors give the user an idea of trend direction - and/or shift in trend.
Enjoy

ADX/DI Trend Strengthpink line = directional with price, bull strength
black line = counter-directional with price, bear strength
histogram = trend strength confirmation
high pink + high histogram = strong bull
high pink + low histogram = weak bull
high black+ high histogram = strong bear
high black + low histogram = weak bear


ADX Volatility Moving AverageThe ADXVMA is a volatility based moving average with the volatility being determined by the value of the ADX. The ADXVMA provides levels of support during uptrends and resistance during downtrends. Original NT indicator by Fat Tails on futures.io, just ported it to pinescript


Nexus Momentum Flow [JOAT]
Nexus Momentum Flow - ADX-Based Trend Strength Analysis
Introduction and Purpose
Nexus Momentum Flow is an open-source oscillator indicator that combines the ADX (Average Directional Index) with directional movement indicators (+DI/-DI) to create a comprehensive trend strength and direction analysis tool. The core problem this indicator solves is that ADX alone tells you trend strength but not direction, while +DI/-DI alone tells you direction but not strength. Traders need both pieces of information together.
This indicator addresses that by combining ADX strength classification with directional bias into a single confluence score, making it easy to identify when strong trends exist and which direction they favor.
Why These Components Work Together
1. ADX (Average Directional Index) - Measures trend strength regardless of direction. Values above 25 indicate trending; below 20 indicate ranging.
2. +DI (Positive Directional Indicator) - Measures upward price movement strength.
3. -DI (Negative Directional Indicator) - Measures downward price movement strength.
4. Confluence Score - Combines ADX strength with DI bias to create a single actionable metric.
The combination works because:
ADX filters out ranging markets where DI crossovers produce whipsaws
DI relationship provides direction when ADX confirms trend
Confluence score simplifies the analysis into one number
How the Calculation Works
float directionBias = diPlus - diMinus
float confluenceScore = (adx / 100) * directionBias
The confluence score is positive when +DI > -DI (bullish) and negative when -DI > +DI (bearish), with magnitude scaled by ADX strength.
Trend State Classification
EXTREME - ADX > 50 (very strong trend)
STRONG - ADX 35-50 (strong trend)
TRENDING - ADX 25-35 (moderate trend)
RANGING - ADX < 25 (no clear trend)
Dashboard Information
Status - Current trend state (EXTREME/STRONG/TRENDING/RANGING)
Direction - BULLISH or BEARISH based on DI relationship
ADX - Current ADX value
DI Bias - Difference between +DI and -DI
Confluence - Combined score with directional context
How to Use This Indicator
For Trend Following:
1. Wait for ADX to show TRENDING or higher
2. Check direction matches your trade bias
3. Enter on pullbacks when confluence remains positive/negative
4. Exit when ADX drops to RANGING
For Avoiding Whipsaws:
1. Do not trade DI crossovers when ADX shows RANGING
2. Only trust directional signals when ADX confirms trend
3. Use RANGING periods for mean-reversion strategies instead
For Trend Exhaustion:
1. Watch for EXTREME ADX readings
2. Extreme trends often precede reversals
3. Consider taking profits when ADX reaches extreme levels
Input Parameters
ADX Length (14) - Period for ADX calculation
DI Length (14) - Period for directional indicators
ADX Smoothing (14) - Smoothing period for ADX
Trend Threshold (25) - ADX level for trend confirmation
Strong Threshold (35) - ADX level for strong trend
Extreme Threshold (50) - ADX level for extreme trend
Timeframe Recommendations
Daily/4H: Best for swing trading trend analysis
1H: Good for intraday trend following
15m: More signals but requires faster reaction
Limitations
ADX is a lagging indicator - trends are confirmed after they start
DI crossovers can whipsaw even with ADX filter
Works best in markets that trend clearly
May miss early trend entries due to confirmation requirement
Open-Source and Disclaimer
This script is published as open-source under the Mozilla Public License 2.0 for educational purposes.
This indicator does not constitute financial advice. Trend analysis does not guarantee profitable trades. Always use proper risk management.
- Made with passion by officialjackofalltrades

FibPulse144 [CHE] FibPulse144 — ADX-gated 13/21 crossover with 144-trend regime and closed-bar labels
Summary
FibPulse144 combines a fast moving-average crossover with a 144-period trend regime and an ADX strength gate. Signals are confirmed on closed bars only and drawn as labels on the price chart, while an ADX line in a separate pane provides context. Color gradients are derived from normalized ADX, so visual intensity reflects trend strength without changing the underlying logic. The approach reduces false flips during weak conditions and keeps entries aligned with the dominant trend.
Motivation: Why this design?
Traditional crossover signals can flip repeatedly during sideways phases and often trigger against the higher-time regime. By requiring alignment with a slower trend proxy and by gating entries through a rising ADX condition, FibPulse144 favors structurally cleaner transitions. Gradient coloring communicates strength visually, helping users temper aggressiveness without additional indicators.
What’s different vs. standard approaches?
Baseline: Classic dual-MA crossover with unconditional signals.
Architecture differences:
Two-bar regime confirmation against a 144-period trend average.
Pending-signal logic that waits for regime and optional ADX approval.
ADX strength gate using the prior reading relative to a user threshold and earlier value.
Gradient colors scaled by an ADX window with gamma controls.
Price-chart labels enforced via overlay on an otherwise pane-based indicator.
Practical effect: Fewer signals during weak or choppy conditions, labels that appear only after a bar closes, and color intensity that mirrors trend quality.
How it works (technical)
The script computes fast and slow moving averages using the selected method and lengths. A separate 144-length average defines the regime using a two-bar confirmation above or below it. Crossovers are observed on the previous bar to avoid intrabar ambiguity; once a prior crossover is detected, it is stored as pending. A pending long requires regime alignment and, if enabled, an ADX condition based on the previous reading being above the threshold and greater than an earlier reading. The state machine holds neutral, long, or short until an exit condition or ADX reset is met. ADX is normalized within a user window, scaled with gamma, and mapped to up and down color palettes to render gradients. Labels on the price panel are forced to overlay, while the ADX line and threshold guide remain in a separate pane.
Parameter Guide
Source — Input data for all calculations. Default: close. Tip: keep consistent with your chart.
MA Type — EMA or SMA. Default: EMA. EMA reacts faster; SMA is smoother.
Fast / Slow — Fast and slow lengths for crossover. Defaults: 13 and 21. Shorter reacts earlier; longer reduces noise.
Trend — Regime average length. Default: 144. Larger values stabilize regime; smaller values increase sensitivity.
Use 144 as trend filter — Enables regime gating. Default: true. Disable to allow raw crossovers.
Use ADX filter — Requires ADX strength. Default: true. Disable to allow signals regardless of strength.
ADX Len — DI and ADX smoothing length. Default: 14. Higher values smooth strength; lower values react faster.
ADX Thresh — Minimum strength for signals. Default: 25. Raise to reduce flips; lower to capture earlier moves.
Entry/Exit labels (price) — Price-panel labels on state changes. Default: true.
Signal labels in ADX pane — Small markers at the ADX value on entries. Default: true.
Label size — tiny, small, normal, large. Default: normal.
Enable barcolor — Optional candle tint by regime and gradient. Default: false.
Enable gradient — Turns on ADX-driven color blending. Default: true.
Window — Bars used to normalize ADX for colors. Default: 100; minimum: 5.
Gamma bars / Gamma plots — Nonlinear scaling for bar and line intensities. Default: 0.80; between 0.30 and 2.00.
Gradient transp (0–90) — Transparency for gradient colors. Default: 0.
MA fill transparency (0–100) — Fill opacity between fast and slow lines. Default: 65.
Palette colors (Up/Down) — Dark and neon endpoints for up and down gradients. Defaults as in the code.
Reading & Interpretation
Fast/Slow lines: When the fast line is above the slow line, the line and fill use the long palette; when below, the short palette is used.
Trend MA (144): Neutral gray line indicating the regime boundary.
Labels on price: “LONG” appears when the state turns long; “SHORT” when it turns short. Labels appear only after the bar closes and conditions are satisfied.
ADX pane: The ADX line shows current strength. The dotted threshold line is the user level for gating. Optional small markers indicate entries at the ADX value.
Bar colors (optional): Candle tint intensity reflects normalized ADX. Higher intensity implies stronger conditions.
Practical Workflows & Combinations
Trend following: Use long entries when fast crosses above slow and price has held above the trend average for two bars, with ADX above threshold. Mirror this for shorts below the trend average.
Exits and stops: Consider reducing exposure when price closes on the opposite side of the trend average for two consecutive bars or when ADX fades below the threshold if the ADX filter is enabled.
Structure confirmation: Combine with higher-timeframe structure such as swing highs and lows or a simple market structure overlay for confirmation.
Multi-asset/Multi-TF: Works across liquid assets. For lower timeframes, consider a slightly lower ADX threshold; for higher timeframes, maintain or raise the threshold to avoid unnecessary flips.
Behavior, Constraints & Performance
Repaint/confirmation: Signals are based on previous-bar crossovers and are confirmed on bar close. No higher-timeframe or security calls are used. Intrabar markers are not relied upon.
Resources: The script declares `max_bars_back` of 2000, uses no loops or arrays, and employs persistent variables for pending signals and state.
Known limits: Crossover systems can lag after sudden reversals. During tight ranges, disabling the ADX filter may increase flips; keeping it enabled may skip early transitions.
Sensible Defaults & Quick Tuning
Starting point: EMA, 13/21/144, ADX length 14, ADX threshold 25, gradients on, barcolor off.
Too many flips: Increase ADX threshold or length; increase trend length; consider SMA instead of EMA.
Too sluggish: Lower ADX threshold slightly; shorten fast and slow lengths; reduce the trend length.
Colors overpowering: Increase gradient transparency or reduce gamma values toward one.
What this indicator is—and isn’t
This is a visualization and signal layer that combines crossover, regime, and strength gating. It does not predict future movements, manage risk, or execute trades. Use it alongside clear structure, risk controls, and a defined position management plan.
Disclaimer
The content provided, including all code and materials, is strictly for educational and informational purposes only. It is not intended as, and should not be interpreted as, financial advice, a recommendation to buy or sell any financial instrument, or an offer of any financial product or service. All strategies, tools, and examples discussed are provided for illustrative purposes to demonstrate coding techniques and the functionality of Pine Script within a trading context.
Any results from strategies or tools provided are hypothetical, and past performance is not indicative of future results. Trading and investing involve high risk, including the potential loss of principal, and may not be suitable for all individuals. Before making any trading decisions, please consult with a qualified financial professional to understand the risks involved.
By using this script, you acknowledge and agree that any trading decisions are made solely at your discretion and risk.
Do not use this indicator on Heikin-Ashi, Renko, Kagi, Point-and-Figure, or Range charts, as these chart types can produce unrealistic results for signal markers and alerts.
Best regards and happy trading
Chervolino

Trend Gauge [BullByte]Trend Gauge
Summary
A multi-factor trend detection indicator that aggregates EMA alignment, VWMA momentum scaling, volume spikes, ATR breakout strength, higher-timeframe confirmation, ADX-based regime filtering, and RSI pivot-divergence penalty into one normalized trend score. It also provides a confidence meter, a Δ Score momentum histogram, divergence highlights, and a compact, scalable dashboard for at-a-glance status.
________________________________________
## 1. Purpose of the Indicator
Why this was built
Traders often monitor several indicators in parallel - EMAs, volume signals, volatility breakouts, higher-timeframe trends, ADX readings, divergence alerts, etc., which can be cumbersome and sometimes contradictory. The “Trend Gauge” indicator was created to consolidate these complementary checks into a single, normalized score that reflects the prevailing market bias (bullish, bearish, or neutral) and its strength. By combining multiple inputs with an adaptive regime filter, scaling contributions by magnitude, and penalizing weakening signals (divergence), this tool aims to reduce noise, highlight genuine trend opportunities, and warn when momentum fades.
Key Design Goals
Signal Aggregation
Merged trend-following signals (EMA crossover, ATR breakout, higher-timeframe confirmation) and momentum signals (VWMA thrust, volume spikes) into a unified score that reflects directional bias more holistically.
Market Regime Awareness
Implemented an ADX-style filter to distinguish between trending and ranging markets, reducing the influence of trend signals during sideways phases to avoid false breakouts.
Magnitude-Based Scaling
Replaced binary contributions with scaled inputs: VWMA thrust and ATR breakout are weighted relative to recent averages, allowing for more nuanced score adjustments based on signal strength.
Momentum Divergence Penalty
Integrated pivot-based RSI divergence detection to slightly reduce the overall score when early signs of momentum weakening are detected, improving risk-awareness in entries.
Confidence Transparency
Added a live confidence metric that shows what percentage of enabled sub-indicators currently agree with the overall bias, making the scoring system more interpretable.
Momentum Acceleration Visualization
Plotted the change in score (Δ Score) as a histogram bar-to-bar, highlighting whether momentum is increasing, flattening, or reversing, aiding in more timely decision-making.
Compact Informational Dashboard
Presented a clean, scalable dashboard that displays each component’s status, the final score, confidence %, detected regime (Trending/Ranging), and a labeled strength gauge for quick visual assessment.
________________________________________
## 2. Why a Trader Should Use It
Main benefits and use cases
1. Unified View: Rather than juggling multiple windows or panels, this indicator delivers a single score synthesizing diverse signals.
2. Regime Filtering: In ranging markets, trend signals often generate false entries. The ADX-based regime filter automatically down-weights trend-following components, helping you avoid chasing false breakouts.
3. Nuanced Momentum & Volatility: VWMA and ATR breakout contributions are normalized by recent averages, so strong moves register strongly while smaller fluctuations are de-emphasized.
4. Early Warning of Weakening: Pivot-based RSI divergence is detected and used to slightly reduce the score when price/momentum diverges, giving a cautionary signal before a full reversal.
5. Confidence Meter: See at a glance how many sub-indicators align with the aggregated bias (e.g., “80% confidence” means 4 out of 5 components agree ). This transparency avoids black-box decisions.
6. Trend Acceleration/Deceleration View: The Δ Score histogram visualizes whether the aggregated score is rising (accelerating trend) or falling (momentum fading), supplementing the main oscillator.
7. Compact Dashboard: A corner table lists each check’s status (“Bull”, “Bear”, “Flat” or “Disabled”), plus overall Score, Confidence %, Regime, Trend Strength label, and a gauge bar. Users can scale text size (Normal, Small, Tiny) without removing elements, so the full picture remains visible even in compact layouts.
8. Customizable & Transparent: All components can be enabled/disabled and parameterized (lengths, thresholds, weights). The full Pine code is open and well-commented, letting users inspect or adapt the logic.
9. Alert-ready: Built-in alert conditions fire when the score crosses weak thresholds to bullish/bearish or returns to neutral, enabling timely notifications.
________________________________________
## 3. Component Rationale (“Why These Specific Indicators?”)
Each sub-component was chosen because it adds complementary information about trend or momentum:
1. EMA Cross
o Basic trend measure: compares a faster EMA vs. a slower EMA. Quickly reflects trend shifts but by itself can whipsaw in sideways markets.
2. VWMA Momentum
o Volume-weighted moving average change indicates momentum with volume context. By normalizing (dividing by a recent average absolute change), we capture the strength of momentum relative to recent history. This scaling prevents tiny moves from dominating and highlights genuinely strong momentum.
3. Volume Spikes
o Sudden jumps in volume combined with price movement often accompany stronger moves or reversals. A binary detection (+1 for bullish spike, -1 for bearish spike) flags high-conviction bars.
4. ATR Breakout
o Detects price breaking beyond recent highs/lows by a multiple of ATR. Measures breakout strength by how far beyond the threshold price moves relative to ATR, capped to avoid extreme outliers. This gives a volatility-contextual trend signal.
5. Higher-Timeframe EMA Alignment
o Confirms whether the shorter-term trend aligns with a higher timeframe trend. Uses request.security with lookahead_off to avoid future data. When multiple timeframes agree, confidence in direction increases.
6. ADX Regime Filter (Manual Calculation)
o Computes directional movement (+DM/–DM), smoothes via RMA, computes DI+ and DI–, then a DX and ADX-like value. If ADX ≥ threshold, market is “Trending” and trend components carry full weight; if ADX < threshold, “Ranging” mode applies a configurable weight multiplier (e.g., 0.5) to trend-based contributions, reducing false signals in sideways conditions. Volume spikes remain binary (optional behavior; can be adjusted if desired).
7. RSI Pivot-Divergence Penalty
o Uses ta.pivothigh / ta.pivotlow with a lookback to detect pivot highs/lows on price and corresponding RSI values. When price makes a higher high but RSI makes a lower high (bearish divergence), or price makes a lower low but RSI makes a higher low (bullish divergence), a divergence signal is set. Rather than flipping the trend outright, the indicator subtracts (or adds) a small penalty (configurable) from the aggregated score if it would weaken the current bias. This subtle adjustment warns of weakening momentum without overreacting to noise.
8. Confidence Meter
o Counts how many enabled components currently agree in direction with the aggregated score (i.e., component sign × score sign > 0). Displays this as a percentage. A high percentage indicates strong corroboration; a low percentage warns of mixed signals.
9. Δ Score Momentum View
o Plots the bar-to-bar change in the aggregated score (delta_score = score - score ) as a histogram. When positive, bars are drawn in green above zero; when negative, bars are drawn in red below zero. This reveals acceleration (rising Δ) or deceleration (falling Δ), supplementing the main oscillator.
10. Dashboard
• A table in the indicator pane’s top-right with 11 rows:
1. EMA Cross status
2. VWMA Momentum status
3. Volume Spike status
4. ATR Breakout status
5. Higher-Timeframe Trend status
6. Score (numeric)
7. Confidence %
8. Regime (“Trending” or “Ranging”)
9. Trend Strength label (e.g., “Weak Bullish Trend”, “Strong Bearish Trend”)
10. Gauge bar visually representing score magnitude
• All rows always present; size_opt (Normal, Small, Tiny) only changes text size via text_size, not which elements appear. This ensures full transparency.
________________________________________
## 4. What Makes This Indicator Stand Out
• Regime-Weighted Multi-Factor Score: Trend and momentum signals are adaptively weighted by market regime (trending vs. ranging) , reducing false signals.
• Magnitude Scaling: VWMA and ATR breakout contributions are normalized by recent average momentum or ATR, giving finer gradation compared to simple ±1.
• Integrated Divergence Penalty: Divergence directly adjusts the aggregated score rather than appearing as a separate subplot; this influences alerts and trend labeling in real time.
• Confidence Meter: Shows the percentage of sub-signals in agreement, providing transparency and preventing blind trust in a single metric.
• Δ Score Histogram Momentum View: A histogram highlights acceleration or deceleration of the aggregated trend score, helping detect shifts early.
• Flexible Dashboard: Always-visible component statuses and summary metrics in one place; text size scaling keeps the full picture available in cramped layouts.
• Lookahead-Safe HTF Confirmation: Uses lookahead_off so no future data is accessed from higher timeframes, avoiding repaint bias.
• Repaint Transparency: Divergence detection uses pivot functions that inherently confirm only after lookback bars; description documents this lag so users understand how and when divergence labels appear.
• Open-Source & Educational: Full, well-commented Pine v6 code is provided; users can learn from its structure: manual ADX computation, conditional plotting with series = show ? value : na, efficient use of table.new in barstate.islast, and grouped inputs with tooltips.
• Compliance-Conscious: All plots have descriptive titles; inputs use clear names; no unnamed generic “Plot” entries; manual ADX uses RMA; all request.security calls use lookahead_off. Code comments mention repaint behavior and limitations.
________________________________________
## 5. Recommended Timeframes & Tuning
• Any Timeframe: The indicator works on small (e.g., 1m) to large (daily, weekly) timeframes. However:
o On very low timeframes (<1m or tick charts), noise may produce frequent whipsaws. Consider increasing smoothing lengths, disabling certain components (e.g., volume spike if volume data noisy), or using a larger pivot lookback for divergence.
o On higher timeframes (daily, weekly), consider longer lookbacks for ATR breakout or divergence, and set Higher-Timeframe trend appropriately (e.g., 4H HTF when on 5 Min chart).
• Defaults & Experimentation: Default input values are chosen to be balanced for many liquid markets. Users should test with replay or historical analysis on their symbol/timeframe and adjust:
o ADX threshold (e.g., 20–30) based on instrument volatility.
o VWMA and ATR scaling lengths to match average volatility cycles.
o Pivot lookback for divergence: shorter for faster markets, longer for slower ones.
• Combining with Other Analysis: Use in conjunction with price action, support/resistance, candlestick patterns, order flow, or other tools as desired. The aggregated score and alerts can guide attention but should not be the sole decision-factor.
________________________________________
## 6. How Scoring and Logic Works (Step-by-Step)
1. Compute Sub-Scores
o EMA Cross: Evaluate fast EMA > slow EMA ? +1 : fast EMA < slow EMA ? -1 : 0.
o VWMA Momentum: Calculate vwma = ta.vwma(close, length), then vwma_mom = vwma - vwma . Normalize: divide by recent average absolute momentum (e.g., ta.sma(abs(vwma_mom), lookback)), clip to .
o Volume Spike: Compute vol_SMA = ta.sma(volume, len). If volume > vol_SMA * multiplier AND price moved up ≥ threshold%, assign +1; if moved down ≥ threshold%, assign -1; else 0.
o ATR Breakout: Determine recent high/low over lookback. If close > high + ATR*mult, compute distance = close - (high + ATR*mult), normalize by ATR, cap at a configured maximum. Assign positive contribution. Similarly for bearish breakout below low.
o Higher-Timeframe Trend: Use request.security(..., lookahead=barmerge.lookahead_off) to fetch HTF EMAs; assign +1 or -1 based on alignment.
2. ADX Regime Weighting
o Compute manual ADX: directional movements (+DM, –DM), smoothed via RMA, DI+ and DI–, then DX and ADX via RMA. If ADX ≥ threshold, market is considered “Trending”; otherwise “Ranging.”
o If trending, trend-based contributions (EMA, VWMA, ATR, HTF) use full weight = 1.0. If ranging, use weight = ranging_weight (e.g., 0.5) to down-weight them. Volume spike stays binary ±1 (optional to change if desired).
3. Aggregate Raw Score
o Sum weighted contributions of all enabled components. Count the number of enabled components; if zero, default count = 1 to avoid division by zero.
4. Divergence Penalty
o Detect pivot highs/lows on price and corresponding RSI values, using a lookback. When price and RSI diverge (bearish or bullish divergence), check if current raw score is in the opposing direction:
If bearish divergence (price higher high, RSI lower high) and raw score currently positive, subtract a penalty (e.g., 0.5).
If bullish divergence (price lower low, RSI higher low) and raw score currently negative, add a penalty.
o This reduces score magnitude to reflect weakening momentum, without flipping the trend outright.
5. Normalize and Smooth
o Normalized score = (raw_score / number_of_enabled_components) * 100. This yields a roughly range.
o Optional EMA smoothing of this normalized score to reduce noise.
6. Interpretation
o Sign: >0 = net bullish bias; <0 = net bearish bias; near zero = neutral.
o Magnitude Zones: Compare |score| to thresholds (Weak, Medium, Strong) to label trend strength (e.g., “Weak Bullish Trend”, “Medium Bearish Trend”, “Strong Bullish Trend”).
o Δ Score Histogram: The histogram bars from zero show change from previous bar’s score; positive bars indicate acceleration, negative bars indicate deceleration.
o Confidence: Percentage of sub-indicators aligned with the score’s sign.
o Regime: Indicates whether trend-based signals are fully weighted or down-weighted.
________________________________________
## 7. Oscillator Plot & Visualization: How to Read It
Main Score Line & Area
The oscillator plots the aggregated score as a line, with colored fill: green above zero for bullish area, red below zero for bearish area. Horizontal reference lines at ±Weak, ±Medium, and ±Strong thresholds mark zones: crossing above +Weak suggests beginning of bullish bias, above +Medium for moderate strength, above +Strong for strong trend; similarly for bearish below negative thresholds.
Δ Score Histogram
If enabled, a histogram shows score - score . When positive, bars appear in green above zero, indicating accelerating bullish momentum; when negative, bars appear in red below zero, indicating decelerating or reversing momentum. The height of each bar reflects the magnitude of change in the aggregated score from the prior bar.
Divergence Highlight Fill
If enabled, when a pivot-based divergence is confirmed:
• Bullish Divergence : fill the area below zero down to –Weak threshold in green, signaling potential reversal from bearish to bullish.
• Bearish Divergence : fill the area above zero up to +Weak threshold in red, signaling potential reversal from bullish to bearish.
These fills appear with a lag equal to pivot lookback (the number of bars needed to confirm the pivot). They do not repaint after confirmation, but users must understand this lag.
Trend Direction Label
When score crosses above or below the Weak threshold, a small label appears near the score line reading “Bullish” or “Bearish.” If the score returns within ±Weak, the label “Neutral” appears. This helps quickly identify shifts at the moment they occur.
Dashboard Panel
In the indicator pane’s top-right, a table shows:
1. EMA Cross status: “Bull”, “Bear”, “Flat”, or “Disabled”
2. VWMA Momentum status: similarly
3. Volume Spike status: “Bull”, “Bear”, “No”, or “Disabled”
4. ATR Breakout status: “Bull”, “Bear”, “No”, or “Disabled”
5. Higher-Timeframe Trend status: “Bull”, “Bear”, “Flat”, or “Disabled”
6. Score: numeric value (rounded)
7. Confidence: e.g., “80%” (colored: green for high, amber for medium, red for low)
8. Regime: “Trending” or “Ranging” (colored accordingly)
9. Trend Strength: textual label based on magnitude (e.g., “Medium Bullish Trend”)
10. Gauge: a bar of blocks representing |score|/100
All rows remain visible at all times; changing Dashboard Size only scales text size (Normal, Small, Tiny).
________________________________________
## 8. Example Usage (Illustrative Scenario)
Example: BTCUSD 5 Min
1. Setup: Add “Trend Gauge ” to your BTCUSD 5 Min chart. Defaults: EMAs (8/21), VWMA 14 with lookback 3, volume spike settings, ATR breakout 14/5, HTF = 5m (or adjust to 4H if preferred), ADX threshold 25, ranging weight 0.5, divergence RSI length 14 pivot lookback 5, penalty 0.5, smoothing length 3, thresholds Weak=20, Medium=50, Strong=80. Dashboard Size = Small.
2. Trend Onset: At some point, price breaks above recent high by ATR multiple, volume spikes upward, faster EMA crosses above slower EMA, HTF EMA also bullish, and ADX (manual) ≥ threshold → aggregated score rises above +20 (Weak threshold) into +Medium zone. Dashboard shows “Bull” for EMA, VWMA, Vol Spike, ATR, HTF; Score ~+60–+70; Confidence ~100%; Regime “Trending”; Trend Strength “Medium Bullish Trend”; Gauge ~6–7 blocks. Δ Score histogram bars are green and rising, indicating accelerating bullish momentum. Trader notes the alignment.
3. Divergence Warning: Later, price makes a slightly higher high but RSI fails to confirm (lower RSI high). Pivot lookback completes; the indicator highlights a bearish divergence fill above zero and subtracts a small penalty from the score, causing score to stall or retrace slightly. Dashboard still bullish but score dips toward +Weak. This warns the trader to tighten stops or take partial profits.
4. Trend Weakens: Score eventually crosses below +Weak back into neutral; a “Neutral” label appears, and a “Neutral Trend” alert fires if enabled. Trader exits or avoids new long entries. If score subsequently crosses below –Weak, a “Bearish” label and alert occur.
5. Customization: If the trader finds VWMA noise too frequent on this instrument, they may disable VWMA or increase lookback. If ATR breakouts are too rare, adjust ATR length or multiplier. If ADX threshold seems off, tune threshold. All these adjustments are explained in Inputs section.
6. Visualization: The screenshot shows the main score oscillator with colored areas, reference lines at ±20/50/80, Δ Score histogram bars below/above zero, divergence fill highlighting potential reversal, and the dashboard table in the top-right.
________________________________________
## 9. Inputs Explanation
A concise yet clear summary of inputs helps users understand and adjust:
1. General Settings
• Theme (Dark/Light): Choose background-appropriate colors for the indicator pane.
• Dashboard Size (Normal/Small/Tiny): Scales text size only; all dashboard elements remain visible.
2. Indicator Settings
• Enable EMA Cross: Toggle on/off basic EMA alignment check.
o Fast EMA Length and Slow EMA Length: Periods for EMAs.
• Enable VWMA Momentum: Toggle VWMA momentum check.
o VWMA Length: Period for VWMA.
o VWMA Momentum Lookback: Bars to compare VWMA to measure momentum.
• Enable Volume Spike: Toggle volume spike detection.
o Volume SMA Length: Period to compute average volume.
o Volume Spike Multiplier: How many times above average volume qualifies as spike.
o Min Price Move (%): Minimum percent change in price during spike to qualify as bullish or bearish.
• Enable ATR Breakout: Toggle ATR breakout detection.
o ATR Length: Period for ATR.
o Breakout Lookback: Bars to look back for recent highs/lows.
o ATR Multiplier: Multiplier for breakout threshold.
• Enable Higher Timeframe Trend: Toggle HTF EMA alignment.
o Higher Timeframe: E.g., “5” for 5-minute when on 1-minute chart, or “60” for 5 Min when on 15m, etc. Uses lookahead_off.
• Enable ADX Regime Filter: Toggles regime-based weighting.
o ADX Length: Period for manual ADX calculation.
o ADX Threshold: Value above which market considered trending.
o Ranging Weight Multiplier: Weight applied to trend components when ADX < threshold (e.g., 0.5).
• Scale VWMA Momentum: Toggle normalization of VWMA momentum magnitude.
o VWMA Mom Scale Lookback: Period for average absolute VWMA momentum.
• Scale ATR Breakout Strength: Toggle normalization of breakout distance by ATR.
o ATR Scale Cap: Maximum multiple of ATR used for breakout strength.
• Enable Price-RSI Divergence: Toggle divergence detection.
o RSI Length for Divergence: Period for RSI.
o Pivot Lookback for Divergence: Bars on each side to identify pivot high/low.
o Divergence Penalty: Amount to subtract/add to score when divergence detected (e.g., 0.5).
3. Score Settings
• Smooth Score: Toggle EMA smoothing of normalized score.
• Score Smoothing Length: Period for smoothing EMA.
• Weak Threshold: Absolute score value under which trend is considered weak or neutral.
• Medium Threshold: Score above Weak but below Medium is moderate.
• Strong Threshold: Score above this indicates strong trend.
4. Visualization Settings
• Show Δ Score Histogram: Toggle display of the bar-to-bar change in score as a histogram. Default true.
• Show Divergence Fill: Toggle background fill highlighting confirmed divergences. Default true.
Each input has a tooltip in the code.
________________________________________
## 10. Limitations, Repaint Notes, and Disclaimers
10.1. Repaint & Lag Considerations
• Pivot-Based Divergence Lag: The divergence detection uses ta.pivothigh / ta.pivotlow with a specified lookback. By design, a pivot is only confirmed after the lookback number of bars. As a result:
o Divergence labels or fills appear with a delay equal to the pivot lookback.
o Once the pivot is confirmed and the divergence is detected, the fill/label does not repaint thereafter, but you must understand and accept this lag.
o Users should not treat divergence highlights as predictive signals without additional confirmation, because they appear after the pivot has fully formed.
• Higher-Timeframe EMA Alignment: Uses request.security(..., lookahead=barmerge.lookahead_off), so no future data from the higher timeframe is used. This avoids lookahead bias and ensures signals are based only on completed higher-timeframe bars.
• No Future Data: All calculations are designed to avoid using future information. For example, manual ADX uses RMA on past data; security calls use lookahead_off.
10.2. Market & Noise Considerations
• In very choppy or low-liquidity markets, some components (e.g., volume spikes or VWMA momentum) may be noisy. Users can disable or adjust those components’ parameters.
• On extremely low timeframes, noise may dominate; consider smoothing lengths or disabling certain features.
• On very high timeframes, pivots and breakouts occur less frequently; adjust lookbacks accordingly to avoid sparse signals.
10.3. Not a Standalone Trading System
• This is an indicator, not a complete trading strategy. It provides signals and context but does not manage entries, exits, position sizing, or risk management.
• Users must combine it with their own analysis, money management, and confirmations (e.g., price patterns, support/resistance, fundamental context).
• No guarantees: past behavior does not guarantee future performance.
10.4. Disclaimers
• Educational Purposes Only: The script is provided as-is for educational and informational purposes. It does not constitute financial, investment, or trading advice.
• Use at Your Own Risk: Trading involves risk of loss. Users should thoroughly test and use proper risk management.
• No Guarantees: The author is not responsible for trading outcomes based on this indicator.
• License: Published under Mozilla Public License 2.0; code is open for viewing and modification under MPL terms.
________________________________________
## 11. Alerts
• The indicator defines three alert conditions:
1. Bullish Trend: when the aggregated score crosses above the Weak threshold.
2. Bearish Trend: when the score crosses below the negative Weak threshold.
3. Neutral Trend: when the score returns within ±Weak after being outside.
Good luck
– BullByte

Trend Strength & Direction📌 Assumptions of the "Trend Strength & Direction" Model
This model is designed to measure both trend strength and trend direction, using a modified version of the ADX (Average Directional Index) while also identifying ranging markets. Below is a detailed breakdown of all key assumptions.
1️⃣ Using ADX as the Basis for Trend Strength
Why ADX?
The ADX (Average Directional Index) is one of the most commonly used indicators for measuring trend strength, regardless of direction.
How is it calculated?
ATR (Average True Range) is used to normalize volatility.
Directional movement (+DM and -DM) is smoothed with an Exponential Moving Average (EMA) to obtain the +DI (Positive Directional Indicator) and -DI (Negative Directional Indicator).
Trend strength is derived by normalizing the absolute difference between +DI and -DI, divided by the sum of both.
🔹 Assumption: A high ADX means the trend is strong (whether bullish or bearish).
2️⃣ 50-Period Moving Average for Trend Strength
Why add a moving average?
ADX can be very volatile in the short term.
A 50-period SMA (Simple Moving Average) is used to smooth out trend strength and identify sustained trends.
🔹 Assumption: The SMA reduces false signals caused by short-term ADX spikes.
3️⃣ Identifying a Ranging Market (ADX Below 35)
How is a ranging market defined?
If the trend strength (ADX) is below 35, the market is considered "ranging".
The 35-level threshold is chosen empirically since ADX values below this level often indicate a lack of strong price direction.
When the market is ranging, the background color turns yellow.
🔹 Assumption: ADX < 35 indicates a sideways market, so the indicator colors the background yellow.
4️⃣ Determining Trend Direction Using +DI and -DI
How is direction determined?
If +DI > -DI, the trend is bullish (green).
If -DI > +DI, the trend is bearish (red).
If ADX is below 35, the market is ranging and turns yellow.
🔹 Assumption: Trend direction is determined by the relationship between +DI and -DI, not ADX values.
5️⃣ Background Color to Highlight Market Conditions
Yellow background if ADX < 35 → Ranging market.
Green background if ADX ≥ 35 and bullish.
Red background if ADX ≥ 35 and bearish.
🔹 Assumption: The background color visually differentiates trending vs. ranging phases.
6️⃣ Reference Levels for ADX
Lateral Threshold (35) → Below this, the trend is weak or ranging.
Neutral Threshold (50) → Intermediate level indicating moderate trend strength.
Strong Trend Threshold (75) → Above this, the trend is very strong and possibly overextended.
🔹 Assumption: ADX above 75 indicates a very strong trend, potentially near exhaustion.
🔹 Summary of Key Assumptions
1️⃣ ADX is the core strength metric → Strong trends when ADX > 35, weak below 35.
2️⃣ The 50-period SMA smooths out volatility → Prevents false signals.
3️⃣ Ranging markets are defined as ADX < 35 → Yellow background color.
4️⃣ Trend direction is based on +DI vs. -DI → Green = bullish, Red = bearish.
5️⃣ Background colors enhance readability → Helps distinguish different market phases.
6️⃣ ADX reference levels (35, 50, 75) indicate increasing trend strength.
Conclusion
This model combines ADX with a moving average and color-based logic to highlight trend strength, trend direction, and sideways markets. It helps traders quickly identify the best conditions for entering or exiting trades. 🚀

Strength Measurement -HTThe Strength Measurement -HT indicator is a tool designed to measure the strength and trend of a security using the Average Directional Index (ADX) across multiple time frames. This script averages the ADX values from five different time frames to provide a comprehensive view of the trend's strength, helping traders make more informed decisions.
Key Features:
Multi-Time Frame Analysis: The indicator calculates ADX values from five different time frames (5 minutes, 15 minutes, 30 minutes, 1 hour, and 4 hours) to offer a more holistic view of the market trend.
Trend Strength Visualization: The average ADX value is plotted as a histogram, with colors indicating the trend strength and direction, making it easy to visualize and interpret.
Reference Levels: The script includes horizontal lines at ADX levels 25, 50, and 75 to signify weak, strong, and very strong trends, respectively.
How It Works
Directional Movement Calculation: The script calculates the positive and negative directional movements (DI+) and (DI-) using the true range over a specified period (default is 14 periods).
ADX Calculation: The ADX value is derived from the smoothed moving average of the absolute difference between DI+ and DI-, normalized by their sum.
Multi-Time Frame ADX: ADX values are computed for the 5-minute, 15-minute, 30-minute, 1-hour, and 4-hour time frames.
Average ADX: The script averages the ADX values from the different time frames to generate a single, comprehensive ADX value.
Trend Visualization: The average ADX value is plotted as a histogram with colors indicating:
Gray for weak trends (ADX < 25)
Green for strengthening trends (25 ≤ ADX < 50)
Dark Green for strong trends (ADX ≥ 50)
Light Red for weakening trends (ADX < 25)
Red for strong trends turning weak (ADX ≥ 25)
Usage
Trend Detection: Use the color-coded histogram to quickly identify the trend strength and direction. Green indicates a strengthening trend, while red signifies a weakening trend.
Reference Levels: Utilize the horizontal lines at ADX levels 25, 50, and 75 as reference points to gauge the trend's strength.
ADX < 25 suggests a weak trend.
ADX between 25 and 50 indicates a moderate to strong trend.
ADX > 50 points to a very strong trend.
Multi-Time Frame Insight: Leverage the averaged ADX value to gain insights from multiple time frames, helping you make more informed trading decisions based on a broader market perspective.
Feel free to explore and integrate this indicator into your trading strategy to enhance your market analysis and decision-making process. Happy trading!

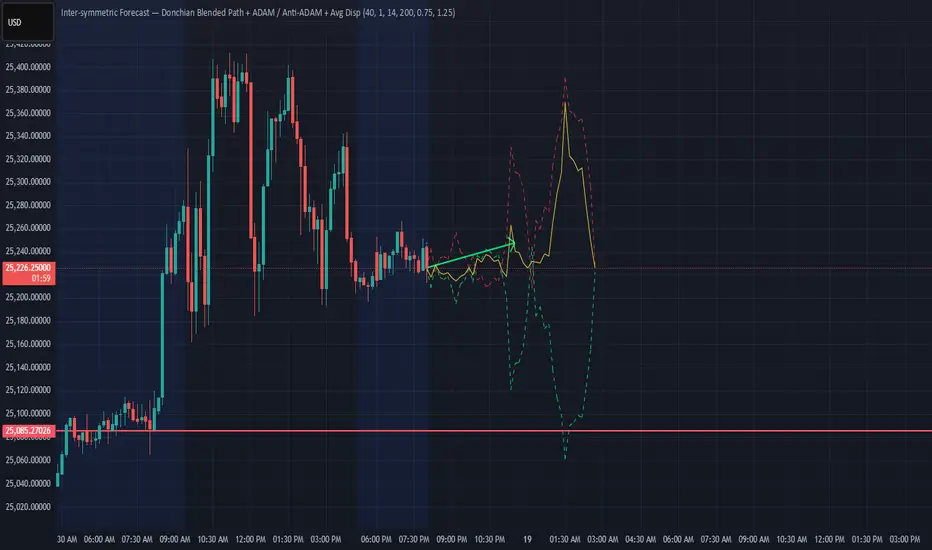
Donchian ForecastDonchian Forecast – multi-timeframe Donchian/ATR bias with ADX regime blending
Donchian Forecast is a multi-timeframe bias tool that turns classic Donchian channels into a normalized trend/mean-reversion “forecast” and a single bias value in .
It projects a short polyline path from the current price and shows how that path adapts when the market shifts from ranging to trending (via ADX).
---
Concept
1. Donchian position → direction
For each timeframe, the script measures where price sits inside its Donchian channel:
-1 = near channel low
0 = middle
+1 = near channel high
This Donchian position is multiplied by ATR to create a **price delta** (how far the forecast moves from current price).
2. Local behavior: trend vs mean-reversion around Donchian
The indicator treats the edges vs middle of the Donchian channel differently:
* By default, edges behave more “trend-like”, middle more “mean-reverting”.
* If you enable the reversed option, this logic flips (edges = mean-reverting, middle = trend-
like).
* This “local” behavior is controlled smoothly by the absolute Donchian position |pos| (not by hard zone switches).
3. Global ADX modulation (regime aware)
ADX is mapped from your chosen low → high thresholds into a signed factor in :
* ADX ≤ low → -1 (fully reversed behavior, more range/mean-reversion oriented)
* ADX ≥ high → +1 (fully normal behavior, more trend oriented)
* Values in between create a **smooth transition**.
* This global factor can:
* Keep the local behavior as is (trending regime),
* Flip it (range regime), or
* Neutralize it (indecisive regime).
4. Multi-timeframe aggregation (1x–12x chart timeframe)
* The script repeats the same logic across 12 horizons:
* 1x = chart timeframe
* 2x..12x = multiples of the chart timeframe (e.g., 5m → 10m, 15m, …; 1h → 2h, 3h, …).
* For each horizon it builds:
* Donchian position
* ATR-scaled delta (in price units)
* Locally + globally blended delta (after Donchian + ADX logic).
* These blended deltas are ATR-weighted and summed into a single bias in , which is then shown as Bias % in the on-chart table.
---
### What you see on the chart
* Forecast polyline
* Starting at the current close, the indicator draws a short chain of **up to 12 segments**:
* Segment 1: from current price → 1x projection
* Segment 2: 1x → 2x projection
* … up to 12x.
* Each segment is:
* Green when its blended delta is ≥ 0 (upward bias)
* Red when its blended delta is < 0 (downward bias)
* This is not future price, but a synthetic path showing how the Donchian/ATR/ADX model “expects” price to drift across multiple horizons.
* Bias table (top-center)
* `Bias: X.Y%`
* > 0% (green) → net upward bias across horizons
* < 0% (red) → net downward bias
* Magnitude (e.g., ±70–100%) ≈ strength of the directional skew.
* `ADX:` current ADX value (from your DMI settings).
* `ADXBlend:` the signed ADX factor in :
* +1 ≈ fully “trend-interpretation” of Donchian behavior
* 0 ≈ neutral / mixed regime
* -1 ≈ fully “reversed/mean-reversion interpretation”
---
Inputs & settings
Core Donchian / ATR
* Donchian Length – lookback for Donchian high/low on each horizon.
* Price Source – input series used for position inside the Donchian channel (default: close).
* ATR Length – ATR lookback for all horizons.
* ATR Multiplier – scales the size of each forecast step in price units (higher = longer segments / more aggressive forecast).
*Local behavior at high ADX
* Reversed local blend at high ADX?
* Off (default) – edges behave more trend-like, middle more mean-reverting.
* On – flips that logic (edges more mean-reverting, middle more trend-like).
* The actual effect is always modulated by the global ADX factor, so you can experiment with how the regime logic feels in different markets.
Global ADX blending
* DMI DI Length – period for the DI+ and DI- components.
* ADX Smoothing – smoothing length for ADX.
* ADX low (mean-rev zone) – below this level, the global factor pushes behavior toward reversal/range logic .
* ADX high (trend zone) – above this level, the global factor pushes behavior toward **trend logic**.
* Values between low and high create a smooth blend rather than a hard on/off switch.
---
How to use it (examples)
* Directional bias dashboard
* Use the Bias % as a compact summary of multi-horizon Donchian/ATR/ADX conditions:
* Consider only trades aligned with the sign of Bias (e.g., longs only when Bias > 0).
* Use the magnitude to filter for **strong vs weak** directional contexts.
* Regime-aware context
* Watch ADX and ADXBlend:
* High ADX & ADXBlend ≈ +1 → favor trend-continuation ideas.
* Low ADX & ADXBlend ≈ -1 → favor range/mean-reversion ideas.
* Around 0 → mixed/transition regimes; forecasts will be more muted.
* Visual sanity check for systems
* Overlay Donchian Forecast on your usual entries/exits to see:
* When your system trades **with** the multi-TF Donchian bias.
* When it trades **against** it (possible fade setups or no-trade zones).
This script does not generate entry or exit signals by itself. It is a contextual/forecast tool meant to sit on top of your own trading logic.
---
Notes
* Works on most symbols and timeframes; higher-timeframe multiples are built from the chart timeframe.
* The forecast line is a model-based projection, not a prediction or guarantee of future price.
* Always combine this with your own risk management, testing, and judgement. This is for educational and analytical purposes only and is not financial advice.
BB Breakout-Momentum + Reversion Strategies# BB Breakout-Momentum + Reversion Strategies
## Overview
This indicator combines two complementary Bollinger Band trading strategies that automatically adapt to market conditions. Strategy 1 capitalizes on trending markets with breakout-pullback-momentum setups, while Strategy 2 exploits mean reversion in ranging markets. Advanced filtering using ADX and BB Width ensures each strategy only fires in its optimal market environment.
---
## Strategy 1: Breakout → Pullback → Renewed Momentum (Long B / Short B)
### Best Market Conditions
- **Trending Markets**: ADX ≥ 25
- **High Volatility**: BB Width ≥ 1.0× average
- Directional price action with sustained momentum
### Entry Logic
**Long B (Bullish Breakout):**
1. **Initial Breakout**: Price breaks above upper Bollinger Band with strong momentum
2. **Controlled Pullback**: Price pulls back 1-12 bars but holds above lower band (stays in trend)
3. **Defended Zone**: Pullback creates a support zone based on swing lows (validated by multiple touches)
4. **Renewed Momentum**: Price reclaims with green candle, volume confirmation, bullish MACD
5. **Position Check**: Entry must have cushion below upper band and room to reach targets
**Short B (Bearish Breakdown):**
- Mirror logic for downtrends: breakdown below lower band, pullback stays below upper band, renewed selling pressure
### Risk Management
- **Stop Loss**: Lower of (zone floor/previous low) OR (1.5 × ATR from entry)
- **Targets**:
- T1: Entry + 0.85R (0.85 × 1.5 ATR)
- T2: Entry + 1.40R (1.40 × 1.5 ATR)
- T3: Entry + 2.50R (2.50 × 1.5 ATR)
- T4: Entry + 4.50R (4.50 × 1.5 ATR)
- Risk is calculated using ATR (ATRX = 1.5 ATR), stop uses tighter of structural level (ATRL) or ATRX
---
## Strategy 2: Bollinger Band Mean Reversion (Long R / Short R)
### Best Market Conditions
- **Ranging Markets**: ADX ≤ 20
- **Low Volatility**: BB Width ≤ 0.8× average
- Price oscillating around the mean without sustained trend
### Entry Logic
**Long R (Long Reversion):**
1. **Overextension**: Price breaks below lower Bollinger Band (2 consecutive closes)
2. **Snap Back**: Price crosses back above lower band (re-enters the range)
3. **Entry Window**: Within 2 candles of re-entry, look for:
- **Green candle** (close > open) confirming bullish strength
- Close above previous candle (close > close )
4. **Trigger**: First qualifying candle within 2-bar window executes the trade
**Short R (Short Reversion):**
1. **Overextension**: Price breaks above upper Bollinger Band (2 consecutive closes)
2. **Snap Back**: Price crosses back below upper band (re-enters the range)
3. **Entry Window**: Within 2 candles of re-entry, look for:
- **Red candle** (close < open) confirming bearish pressure
- Close below previous candle (close < close )
4. **Trigger**: First qualifying candle within 2-bar window executes the trade
### Risk Management
- **Stop Loss**: Lower of (previous high/low) OR (1.5 × ATR from entry)
- **Targets**: Same as Strategy 1 (0.85R, 1.4R, 2.5R, 4.5R based on 1.5 ATR)
- Betting on return to Bollinger Band basis (mean)
---
## Advanced Filtering System
### ADX Filter (Average Directional Index)
- **Purpose**: Measures trend strength vs choppy/ranging conditions
- **Trending**: ADX ≥ 25 → Enables Strategy 1 (Breakout)
- **Ranging**: ADX ≤ 20 → Enables Strategy 2 (Reversion)
- **Neutral**: ADX 20-25 → No signals (indecisive market)
### BB Width Filter
- **Purpose**: Confirms volatility expansion/contraction
- **Wide Bands**: Current width ≥ 1.0× 50-bar average → Trending environment
- **Narrow Bands**: Current width ≤ 0.8× 50-bar average → Ranging environment
- **Logic**: Both ADX and BB Width must agree on market state before signaling
### Combined Logic
- **Strategy 1 fires**: When BOTH ADX shows trending AND bands are wide
- **Strategy 2 fires**: When BOTH ADX shows ranging AND bands are narrow
- **Visual Display**: Table at bottom-right shows ADX value, BB Width ratio, and current market state
---
## Visual Elements
### Bollinger Bands
- **Gray line**: 20-period SMA (basis/mean)
- **Green line**: Upper band (basis + 2 standard deviations)
- **Red line**: Lower band (basis - 2 standard deviations)
### Strategy 1 Markers
- **Long B**: Green triangle below bar with "Long B" text
- **Short B**: Orange triangle above bar with "Short B" text
- **Defended Zones**: Green/red boxes showing pullback support/resistance areas
- **Targets**: Green/orange crosses showing T1-T4 and stop loss levels
### Strategy 2 Markers
- **Long R**: Blue label below bar with "Long R" text
- **Short R**: Purple label above bar with "Short R" text
- **Trade Levels**: Horizontal lines extending 50 bars forward
- Blue solid = Entry price
- Red dashed = Stop loss
- Green/Orange dotted = Targets (T1-T4)
### Market State Table
- **ADX**: Current value with color coding (green=trending, orange=ranging, gray=neutral)
- **BB Width**: Ratio vs 50-bar average (e.g., "1.15x" = 15% wider than average)
- **State**: TREND / RANGE / NEUTRAL classification
---
## Settings & Customization
### Bollinger Bands
- **BB Length**: 20 (default) - period for moving average
- **BB Std Dev**: 2.0 (default) - standard deviation multiplier
### ATR & Risk
- **ATR Length**: 14 (default) - period for Average True Range calculation
- All stop losses and targets are derived from 1.5 × ATR
### Trend/Range Filters
- **ADX Length**: 14 (default)
- **ADX Trending Threshold**: 25 (higher = stronger trend required)
- **ADX Ranging Threshold**: 20 (lower = tighter ranging condition)
- **BB Width Average Length**: 50 (period for comparing current width)
- **BB Width Trend Multiplier**: 1.0 (width must be ≥ this × average)
- **BB Width Range Multiplier**: 0.8 (width must be ≤ this × average)
- **Use ADX Filter**: Toggle on/off
- **Use BB Width Filter**: Toggle on/off
### Strategy 1 (Breakout-Momentum)
- **Breakout Lookback**: 15 bars (how far back to search for initial breakout)
- **Min Pullback Bars**: 1 (minimum consolidation period)
- **Max Pullback Bars**: 12 (maximum consolidation period)
- **Show Defended Zone**: Display support/resistance boxes
- **Show Signals**: Display Long B / Short B markers
- **Show Targets**: Display stop loss and target levels
### Strategy 2 (Reversion)
- **Show Signals**: Display Long R / Short R markers
- **Show Trade Levels**: Display entry, stop, and target lines
---
## How to Use This Indicator
### Step 1: Identify Market State
- Check the table in bottom-right corner
- **TREND**: Look for Strategy 1 signals (Long B / Short B)
- **RANGE**: Look for Strategy 2 signals (Long R / Short R)
- **NEUTRAL**: Wait for clearer conditions
### Step 2: Wait for Signal
- Signals only fire when ALL conditions are met (structural + momentum + filters + room-to-target)
- Signals are relatively rare but high-probability
### Step 3: Execute Trade
- **Entry**: Close of signal candle
- **Stop Loss**: Shown as red cross (Strategy 1) or red dashed line (Strategy 2)
- **Targets**: Scale out at T1, T2, T3, T4 or hold for maximum R:R
### Step 4: Management
- Consider moving stop to breakeven after T1
- Trail stop using swing lows/highs in Strategy 1
- Exit full position at T2-T3 in Strategy 2 (mean reversion has limited upside)
---
## Key Principles
### Why This Works
1. **Market Adaptation**: Uses right strategy for right conditions (trend vs range)
2. **Confluence**: Multiple confirmations required (structure + momentum + volatility + room)
3. **Risk-Defined**: Every trade has pre-calculated stop and targets based on ATR
4. **Probability**: Filters reduce noise and increase win rate by waiting for ideal setups
### Common Pitfalls to Avoid
- ❌ Taking signals in NEUTRAL market state (indicators disagree)
- ❌ Overriding the stop loss (it's calculated for a reason)
- ❌ Expecting signals on every swing (quality over quantity)
- ❌ Using Strategy 1 in ranging markets or Strategy 2 in trending markets
- ❌ Ignoring the room-to-target check (signal won't fire if targets are blocked)
### Complementary Analysis
This indicator works best when combined with:
- Higher timeframe trend analysis
- Key support/resistance levels
- Volume analysis
- Market structure (swing highs/lows)
- Risk management rules (position sizing, max daily loss, etc.)
---
## Technical Details
### Indicators Used
- **Bollinger Bands**: 20-period SMA ± 2 standard deviations
- **ATR**: 14-period Average True Range for volatility measurement
- **ADX**: 14-period Average Directional Index for trend strength
- **EMA**: 10 and 20-period exponential moving averages (Strategy 1 filter)
- **MACD**: 12/26/9 settings (Strategy 1 momentum confirmation)
- **Volume**: Compared to 15-bar average (Strategy 1 confirmation)
### Calculation Methodology
- **ATRL** (Structural Risk): Previous swing high/low or defended zone boundary
- **ATRX** (ATR Risk): 1.5 × 14-period ATR from entry price
- **Stop Loss**: Minimum of ATRL and ATRX (tightest protection)
- **Targets**: Always calculated from ATRX (consistent R-multiples)
- **BB Width Ratio**: Current BB width ÷ 50-period SMA of BB width
---
## Performance Notes
### Strengths
- Adapts to changing market conditions automatically
- Clear, objective entry and exit criteria
- Pre-defined risk on every trade
- Filters reduce false signals significantly
- Works across multiple timeframes and instruments
### Limitations
- Signals are infrequent (by design - quality over quantity)
- Requires patience to wait for all conditions to align
- May miss explosive moves if pullback doesn't form properly (Strategy 1)
- Ranging markets can transition to trending (Strategy 2 risk)
- Filters may delay entry in fast-moving markets
### Best Timeframes
- **Strategy 1**: 1H, 4H, Daily (needs time for proper pullback structure)
- **Strategy 2**: 15M, 30M, 1H (mean reversion works best intraday)
- Both strategies can work on any timeframe if market conditions are right
### Best Instruments
- **Liquid markets**: Major stocks, indices, forex pairs, liquid crypto
- **Sufficient volatility**: ATR should be meaningful relative to price
- **Clear trend/range cycles**: Markets that respect technical levels
---
## IMPORTANT DISCLAIMER
### Risk Warning
**TRADING INVOLVES SUBSTANTIAL RISK OF LOSS AND IS NOT SUITABLE FOR ALL INVESTORS.**
This indicator is provided for **educational and informational purposes only**. It does not constitute financial advice, investment advice, trading advice, or any other sort of advice. You should not treat any of the indicator's content as such.
### No Guarantee of Profit
Past performance is not indicative of future results. No trading strategy, including this indicator, can guarantee profits or protect against losses. The market is inherently unpredictable and all trading involves risk.
### User Responsibility
- **Do Your Own Research**: Always conduct your own analysis before making trading decisions
- **Test First**: Backtest and paper trade this strategy before risking real capital
- **Risk Management**: Never risk more than you can afford to lose
- **Position Sizing**: Use appropriate position sizes relative to your account
- **Stop Losses**: Always use stop losses and respect them
- **Market Conditions**: Understand that market conditions change and past behavior may not repeat
### No Liability
The creator of this indicator accepts no liability for any financial losses incurred through the use of this tool. All trading decisions are made at your own risk. You are solely responsible for evaluating the merits and risks associated with the use of any trading systems, signals, or content provided.
### Not Financial Advice
This indicator does not take into account your personal financial situation, investment objectives, risk tolerance, or specific needs. You should consult with a licensed financial advisor before making any investment decisions.
### Technical Limitations
- Indicators can repaint or lag in real-time
- Past signals may look different than real-time signals
- Code bugs or errors may exist despite testing
- TradingView platform limitations may affect functionality
### Market Risks
- Markets can gap, causing stops to be executed at worse prices
- Slippage and commissions can significantly impact results
- High volatility can cause unexpected losses
- Counterparty risk exists in all leveraged products
---
## Version History
- **v1.0**: Initial release combining breakout-momentum and mean reversion strategies
- Includes ADX and BB Width filtering
- ATRL/ATRX risk calculation system
- 2-candle entry window for reversion trades
---
## Credits & License
This indicator combines concepts from classical technical analysis including Bollinger Bands (John Bollinger), ATR (Welles Wilder), and ADX (Welles Wilder). The specific implementation and combination of filters is original work.
**Use at your own risk. Trade responsibly.**
---
*For questions, suggestions, or to report bugs, please comment below or contact the author.*
**Remember: The best indicator is the one between your ears. Use this tool as part of a comprehensive trading plan, not as a standalone solution.**

Meta-LR ForecastThis indicator builds a forward-looking projection from the current bar by combining twelve time-compressed “mini forecasts.” Each forecast is a linear-regression-based outlook whose contribution is adaptively scaled by trend strength (via ADX) and normalized to each timeframe’s own volatility (via that timeframe’s ATR). The result is a 12-segment polyline that starts at the current price and extends one bar at a time into the future (1× through 12× the chart’s timeframe). Alongside the plotted path, the script computes two summary measures:
* Per-TF Bias% — a directional efficiency × R² score for each micro-forecast, expressed as a percent.
* Meta Bias% — the same score, but applied to the final, accumulated 12-step path. It summarizes how coherent and directional the combined projection is.
This tool is an indicator, not a strategy. It does not place orders. Nothing here is trade advice; it is a visual, quantitative framework to help you assess directional bias and trend context across a ladder of timeframe multiples.
The core engine fits a simple least-squares line on a normalized price series for each small forecast horizon and extrapolates one bar forward. That “trend” forecast is paired with its mirror, an “anti-trend” forecast, constructed around the current normalized price. The model then blends between these two wings according to current trend strength as measured by ADX.
ADX is transformed into a weight (w) in using an adaptive band centered on the rolling mean (μ) with width derived from the standard deviation (σ) of ADX over a configurable lookback. When ADX is deeply below the lower band, the weight approaches -1, favoring anti-trend behavior. Inside the flat band, the weight is near zero, producing neutral behavior. Clearly above the upper band, the weight approaches +1, favoring a trend-following stance. The transitions between these regions are linear so the regime shift is smooth rather than abrupt.
You can shape how quickly the model commits to either wing using two exponents. One exponent controls how aggressively positive weights lean into the trend forecast; the other controls how aggressively negative weights lean into the anti-trend forecast. Raising these exponents makes the response more gradual; lowering them makes the shift more decisive. An optional switch can force full anti-trend behavior when ADX registers a deep-low condition far below the lower tail, if you prefer a categorical stance in very flat markets.
A key design choice is volatility normalization. Every micro-forecast is computed in ATR units of its own timeframe. The script fetches that timeframe’s ATR inside each security call and converts normalized outputs back to price with that exact ATR. This avoids scaling higher-timeframe effects by the chart ATR or by square-root time approximations. Using “ATR-true” for each timeframe keeps the cross-timeframe accumulation consistent and dimensionally correct.
Bias% is defined as directional efficiency multiplied by R², expressed as a percent. Directional efficiency captures how much net progress occurred relative to the total path length; R² captures how well the path aligns with a straight line. If price meanders without net progress, efficiency drops; if the variation is well-explained by a line, R² rises. Multiplying the two penalizes choppy, low-signal paths and rewards sustained, coherent motion.
The forward path is built by converting each per-timeframe Bias% into a small ATR-sized delta, then cumulatively adding those deltas to form a 12-step projection. This produces a polyline anchored at the current close and stepping forward one bar per timeframe multiple. Segment color flips by slope, allowing a quick read of the path’s direction and inflection.
Inputs you can tune include:
* Max Regression Length. Upper bound for each micro-forecast’s regression window. Larger values smooth the trend estimate at the cost of responsiveness; smaller values react faster but can add noise.
* Price Source. The price series analyzed (for example, close or typical price).
* ADX Length. Period used for the DMI/ADX calculation.
* ATR Length (normalization). Window used for ATR; this is applied per timeframe inside each security call.
* Band Lookback (for μ, σ). Lookback used to compute the adaptive ADX band statistics. Larger values stabilize the band; smaller values react more quickly.
* Flat half-width (σ). Width of the neutral band on both sides of μ. Wider flats spend more time neutral; narrower flats switch regimes more readily.
* Tail width beyond flat (σ). Distance from the flat band edge to the extreme trend/anti-trend zone. Larger tails create a longer ramp; smaller tails reach extremes sooner.
* Polyline Width. Visual thickness of the plotted segments.
* Negative Wing Aggression (anti-trend). Exponent shaping for negative weights; higher values soften the tilt into mean reversion.
* Positive Wing Aggression (trend). Exponent shaping for positive weights; lower values make trend commitment stronger and sooner.
* Force FULL Anti-Trend at Deep-Low ADX. Optional hard switch for extremely low ADX conditions.
On the chart you will see:
* A 12-segment forward polyline starting from the current close to bar\_index + 1 … +12, with green segments for up-steps and red for down-steps.
* A small label at the latest bar showing Meta Bias% when available, or “n/a” when insufficient data exists.
Interpreting the readouts:
* Trend-following contexts are characterized by ADX above the adaptive upper band, pushing w toward +1. The blended forecast leans toward the regression extrapolation. A strongly positive Meta Bias% in this environment suggests directional alignment across the ladder of timeframes.
* Mean-reversion contexts occur when ADX is well below the lower tail, pushing w toward -1 (or forcing anti-trend if enabled). After a sharp advance, a negative Meta Bias% may indicate the model projects pullback tendencies.
* Neutral contexts occur when ADX sits inside the flat band; w is near zero, the blended forecast remains close to current price, and Meta Bias% tends to hover near zero.
These are analytical cues, not rules. Always corroborate with your broader process, including market structure, time-of-day behavior, liquidity conditions, and risk limits.
Practical usage patterns include:
* Momentum confirmation. Combine a rising Meta Bias% with higher-timeframe structure (such as higher highs and higher lows) to validate continuation setups. Treat the 12th step’s distance as a coarse sense of potential room rather than as a target.
* Fade filtering. If you prefer fading extremes, require ADX to be near or below the lower ramp before acting on counter-moves, and avoid fades when ADX is decisively above the upper band.
* Position planning. Because per-step deltas are ATR-scaled, the path’s vertical extent can be mentally mapped to typical noise for the instrument, informing stop distance choices. The script itself does not compute orders or size.
* Multi-timeframe alignment. Each step corresponds to a clean multiple of your chart timeframe, so the polyline visualizes how successively larger windows bias price, all referenced to the current bar.
House-rules and repainting disclosures:
* Indicator, not strategy. The script does not execute, manage, or suggest orders. It displays computed paths and bias scores for analysis only.
* No performance claims. Past behavior of any measure, including Meta Bias%, does not guarantee future results. There are no assurances of profitability.
* Higher-timeframe updates. Values obtained via security for higher-timeframe series can update intrabar until the higher-timeframe bar closes. The forward path and Meta Bias% may change during formation of a higher-timeframe candle. If you need confirmed higher-timeframe inputs, consider reading the prior higher-timeframe value or acting only after the higher-timeframe close.
* Data sufficiency. The model requires enough history to compute ATR, ADX statistics, and regression windows. On very young charts or illiquid symbols, parts of the readout can be unavailable until sufficient data accumulates.
* Volatility regimes. ATR normalization helps compare across timeframes, but unusual volatility regimes can make the path look deceptively flat or exaggerated. Judge the vertical scale relative to your instrument’s typical ATR.
Tuning tips:
* Stability versus responsiveness. Increase Max Regression Length to steady the micro-forecasts but accept slower response. If you lower it, consider slightly increasing Band Lookback so regime boundaries are not too jumpy.
* Regime bands. Widen the flat half-width to spend more time neutral, which can reduce over-trading tendencies in chop. Shrink the tail width if you want the model to commit to extremes sooner, at the cost of more false swings.
* Wing shaping. If anti-trend behavior feels too abrupt at low ADX, raise the negative wing exponent. If you want trend bias to kick in more decisively at high ADX, lower the positive wing exponent. Small changes have large effects.
* Forced anti-trend. Enable the deep-low option only if you explicitly want a categorical “markets are flat, fade moves” policy. Many users prefer leaving it off to keep regime decisions continuous.
Troubleshooting:
* Nothing plots or the label shows “n/a.” Ensure the chart has enough history for the ADX band statistics, ATR, and the regression windows. Exotic or illiquid symbols with missing data may starve the higher-timeframe computations. Try a more liquid market or a higher timeframe.
* Path flickers or shifts during the bar. This is expected when any higher-timeframe input is still forming. Wait for the higher-timeframe close for fully confirmed behavior, or modify the code to read prior values from the higher timeframe.
* Polyline looks too flat or too steep. Check the chart’s vertical scale and recent ATR regime. Adjust Max Regression Length, the wing exponents, or the band widths to suit the instrument.
Integration ideas for manual workflows:
* Confluence checklist. Use Meta Bias% as one of several independent checks, alongside structure, session context, and event risk. Act only when multiple cues align.
* Stop and target thinking. Because deltas are ATR-scaled at each timeframe, benchmark your proposed stops and targets against the forward steps’ magnitude. Stops that are much tighter than the prevailing ATR often sit inside normal noise.
* Session context. Consider session hours and microstructure. The same ADX value can imply different tradeability in different sessions, particularly in index futures and FX.
This indicator deliberately avoids:
* Fixed thresholds for buy or sell decisions. Markets vary and fixed numbers invite overfitting. Decide what constitutes “high enough” Meta Bias% for your market and timeframe.
* Automatic risk sizing. Proper sizing depends on account parameters, instrument specifications, and personal risk tolerance. Keep that decision in your risk plan, not in a visual bias tool.
* Claims of edge. These measures summarize path geometry and trend context; they do not ensure a tradable edge on their own.
Summary of how to think about the output:
* The script builds a 12-step forward path by stacking linear-regression micro-forecasts across increasing multiples of the chart timeframe.
* Each micro-forecast is blended between trend and anti-trend using an adaptive ADX band with separate aggression controls for positive and negative regimes.
* All computations are done in ATR-true units for each timeframe before reconversion to price, ensuring dimensional consistency when accumulating steps.
* Bias% (per-timeframe and Meta) condenses directional efficiency and trend fidelity into a compact score.
* The output is designed to serve as an analytical overlay that helps assess whether conditions look trend-friendly, fade-friendly, or neutral, while acknowledging higher-timeframe update behavior and avoiding prescriptive trade rules.
Use this tool as one component within a disciplined process that includes independent confirmation, event awareness, and robust risk management.

Ruckard TradingLatinoThis strategy tries to mimic TradingLatino strategy.
The current implementation is beta.
Si hablas castellano o espanyol por favor consulta MENSAJE EN CASTELLANO más abajo.
It's aimed at BTCUSDT pair and 4h timeframe.
STRATEGY DEFAULT SETTINGS EXPLANATION
max_bars_back=5000 : This is a random number of bars so that the strategy test lasts for one or two years
calc_on_order_fills=false : To wait for the 4h closing is too much. Try to check if it's worth entering a position after closing one. I finally decided not to recheck if it's worth entering after an order is closed. So it is false.
calc_on_every_tick=false
pyramiding=0 : We only want one entry allowed in the same direction. And we don't want the order to scale by error.
initial_capital=1000 : These are 1000 USDT. By using 1% maximum loss per trade and 7% as a default stop loss by using 1000 USDT at 12000 USDT per BTC price you would entry with around 142 USDT which are converted into: 0.010 BTC . The maximum number of decimal for contracts on this BTCUSDT market is 3 decimals. E.g. the minimum might be: 0.001 BTC . So, this minimal 1000 amount ensures us not to entry with less than 0.001 entries which might have happened when using 100 USDT as an initial capital.
slippage=1 : Binance BTCUSDT mintick is: 0.01. Binance slippage: 0.1 % (Let's assume). TV has an integer slippage. It does not have a percentage based slippage. If we assume a 1000 initial capital, the recommended equity is 142 which at 11996 USDT per BTC price means: 0.011 BTC. The 0.1% slippage of: 0.011 BTC would be: 0.000011 . This is way smaller than the mintick. So our slippage is going to be 1. E.g. 1 (slippage) * 0.01 (mintick)
commission_type=strategy.commission.percent and commission_value=0.1 : According to: binance . com / en / fee / schedule in VIP 0 level both maker and taker fees are: 0.1 %.
BACKGROUND
Jaime Merino is a well known Youtuber focused on crypto trading
His channel TradingLatino
features monday to friday videos where he explains his strategy.
JAIME MERINO STANCE ON BOTS
Jaime Merino stance on bots (taken from memory out of a 2020 June video from him):
'~
You know. They can program you a bot and it might work.
But, there are some special situations that the bot would not be able to handle.
And, I, as a human, I would handle it. And the bot wouldn't do it.
~'
My long term target with this strategy script is add as many
special situations as I can to the script
so that it can match Jaime Merino behaviour even in non normal circumstances.
My alternate target is learn Pine script
and enjoy programming with it.
WARNING
This script might be bigger than other TradingView scripts.
However, please, do not be confused because the current status is beta.
This script has not been tested with real money.
This is NOT an official strategy from Jaime Merino.
This is NOT an official strategy from TradingLatino . net .
HOW IT WORKS
It basically uses ADX slope and LazyBear's Squeeze Momentum Indicator
to make its buy and sell decisions.
Fast paced EMA being bigger than slow paced EMA
(on higher timeframe) advices going long.
Fast paced EMA being smaller than slow paced EMA
(on higher timeframe) advices going short.
It finally add many substrats that TradingLatino uses.
SETTINGS
__ SETTINGS - Basics
____ SETTINGS - Basics - ADX
(ADX) Smoothing {14}
(ADX) DI Length {14}
(ADX) key level {23}
____ SETTINGS - Basics - LazyBear Squeeze Momentum
(SQZMOM) BB Length {20}
(SQZMOM) BB MultFactor {2.0}
(SQZMOM) KC Length {20}
(SQZMOM) KC MultFactor {1.5}
(SQZMOM) Use TrueRange (KC) {True}
____ SETTINGS - Basics - EMAs
(EMAS) EMA10 - Length {10}
(EMAS) EMA10 - Source {close}
(EMAS) EMA55 - Length {55}
(EMAS) EMA55 - Source {close}
____ SETTINGS - Volume Profile
Lowest and highest VPoC from last three days
is used to know if an entry has a support
VPVR of last 100 4h bars
is also taken into account
(VP) Use number of bars (not VP timeframe): Uses 'Number of bars {100}' setting instead of 'Volume Profile timeframe' setting for calculating session VPoC
(VP) Show tick difference from current price {False}: BETA . Might be useful for actions some day.
(VP) Number of bars {100}: If 'Use number of bars (not VP timeframe)' is turned on this setting is used to calculate session VPoC.
(VP) Volume Profile timeframe {1 day}: If 'Use number of bars (not VP timeframe)' is turned off this setting is used to calculate session VPoC.
(VP) Row width multiplier {0.6}: Adjust how the extra Volume Profile bars are shown in the chart.
(VP) Resistances prices number of decimal digits : Round Volume Profile bars label numbers so that they don't have so many decimals.
(VP) Number of bars for bottom VPOC {18}: 18 bars equals 3 days in suggested timeframe of 4 hours. It's used to calculate lowest session VPoC from previous three days. It's also used as a top VPOC for sells.
(VP) Ignore VPOC bottom advice on long {False}: If turned on it ignores bottom VPOC (or top VPOC on sells) when evaluating if a buy entry is worth it.
(VP) Number of bars for VPVR VPOC {100}: Number of bars to calculate the VPVR VPoC. We use 100 as Jaime once used. When the price bounces back to the EMA55 it might just bounce to this VPVR VPoC if its price it's lower than the EMA55 (Sells have inverse algorithm).
____ SETTINGS - ADX Slope
ADX Slope
help us to understand if ADX
has a positive slope, negative slope
or it is rather still.
(ADXSLOPE) ADX cut {23}: If ADX value is greater than this cut (23) then ADX has strength
(ADXSLOPE) ADX minimum steepness entry {45}: ADX slope needs to be 45 degrees to be considered as a positive one.
(ADXSLOPE) ADX minimum steepness exit {45}: ADX slope needs to be -45 degrees to be considered as a negative one.
(ADXSLOPE) ADX steepness periods {3}: In order to avoid false detection the slope is calculated along 3 periods.
____ SETTINGS - Next to EMA55
(NEXTEMA55) EMA10 to EMA55 bounce back percentage {80}: EMA10 might bounce back to EMA55 or maybe to 80% of its complete way to EMA55
(NEXTEMA55) Next to EMA55 percentage {15}: How much next to the EMA55 you need to be to consider it's going to bounce back upwards again.
____ SETTINGS - Stop Loss and Take Profit
You can set a default stop loss or a default take profit.
(STOPTAKE) Stop Loss % {7.0}
(STOPTAKE) Take Profit % {2.0}
____ SETTINGS - Trailing Take Profit
You can customize the default trailing take profit values
(TRAILING) Trailing Take Profit (%) {1.0}: Trailing take profit offset in percentage
(TRAILING) Trailing Take Profit Trigger (%) {2.0}: When 2.0% of benefit is reached then activate the trailing take profit.
____ SETTINGS - MAIN TURN ON/OFF OPTIONS
(EMAS) Ignore advice based on emas {false}.
(EMAS) Ignore advice based on emas (On closing long signal) {False}: Ignore advice based on emas but only when deciding to close a buy entry.
(SQZMOM) Ignore advice based on SQZMOM {false}: Ignores advice based on SQZMOM indicator.
(ADXSLOPE) Ignore advice based on ADX positive slope {false}
(ADXSLOPE) Ignore advice based on ADX cut (23) {true}
(STOPTAKE) Take Profit? {false}: Enables simple Take Profit.
(STOPTAKE) Stop Loss? {True}: Enables simple Stop Loss.
(TRAILING) Enable Trailing Take Profit (%) {True}: Enables Trailing Take Profit.
____ SETTINGS - Strategy mode
(STRAT) Type Strategy: 'Long and Short', 'Long Only' or 'Short Only'. Default: 'Long and Short'.
____ SETTINGS - Risk Management
(RISKM) Risk Management Type: 'Safe', 'Somewhat safe compound' or 'Unsafe compound'. ' Safe ': Calculations are always done with the initial capital (1000) in mind. The maximum losses per trade/day/week/month are taken into account. ' Somewhat safe compound ': Calculations are done with initial capital (1000) or a higher capital if it increases. The maximum losses per trade/day/week/month are taken into account. ' Unsafe compound ': In each order all the current capital is gambled and only the default stop loss per order is taken into account. That means that the maximum losses per trade/day/week/month are not taken into account. Default : 'Somewhat safe compound'.
(RISKM) Maximum loss per trade % {1.0}.
(RISKM) Maximum loss per day % {6.0}.
(RISKM) Maximum loss per week % {8.0}.
(RISKM) Maximum loss per month % {10.0}.
____ SETTINGS - Decimals
(DECIMAL) Maximum number of decimal for contracts {3}: How small (3 decimals means 0.001) an entry position might be in your exchange.
EXTRA 1 - PRICE IS IN RANGE indicator
(PRANGE) Print price is in range {False}: Enable a bottom label that indicates if the price is in range or not.
(PRANGE) Price range periods {5}: How many previous periods are used to calculate the medians
(PRANGE) Price range maximum desviation (%) {0.6} ( > 0 ): Maximum positive desviation for range detection
(PRANGE) Price range minimum desviation (%) {0.6} ( > 0 ): Mininum negative desviation for range detection
EXTRA 2 - SQUEEZE MOMENTUM Desviation indicator
(SQZDIVER) Show degrees {False}: Show degrees of each Squeeze Momentum Divergence lines to the x-axis.
(SQZDIVER) Show desviation labels {False}: Whether to show or not desviation labels for the Squeeze Momentum Divergences.
(SQZDIVER) Show desviation lines {False}: Whether to show or not desviation lines for the Squeeze Momentum Divergences.
EXTRA 3 - VOLUME PROFILE indicator
WARNING: This indicator works not on current bar but on previous bar. So in the worst case it might be VP from 4 hours ago. Don't worry, inside the strategy calculus the correct values are used. It's just that I cannot show the most recent one in the chart.
(VP) Print recent profile {False}: Show Volume Profile indicator
(VP) Avoid label price overlaps {False}: Avoid label prices to overlap on the chart.
EXTRA 4 - ZIGNALY SUPPORT
(ZIG) Zignaly Alert Type {Email}: 'Email', 'Webhook'. ' Email ': Prepare alert_message variable content to be compatible with zignaly expected email content format. ' Webhook ': Prepare alert_message variable content to be compatible with zignaly expected json content format.
EXTRA 5 - DEBUG
(DEBUG) Enable debug on order comments {False}: If set to true it prepares the order message to match the alert_message variable. It makes easier to debug what would have been sent by email or webhook on each of the times an order is triggered.
HOW TO USE THIS STRATEGY
BOT MODE: This is the default setting.
PROPER VOLUME PROFILE VIEWING: Click on this strategy settings. Properties tab. Make sure Recalculate 'each time the order was run' is turned off.
NEWBIE USER: (Check PROPER VOLUME PROFILE VIEWING above!) You might want to turn on the 'Print recent profile {False}' setting. Alternatively you can use my alternate realtime study: 'Resistances and supports based on simplified Volume Profile' but, be aware, it might consume one indicator.
ADVANCED USER 1: Turn on the 'Print price is in range {False}' setting and help us to debug this subindicator. Also help us to figure out how to include this value in the strategy.
ADVANCED USER 2: Turn on the all the (SQZDIVER) settings and help us to figure out how to include this value in the strategy.
ADVANCED USER 3: (Check PROPER VOLUME PROFILE VIEWING above!) Turn on the 'Print recent profile {False}' setting and report any problem with it.
JAIME MERINO: Just use the indicator as it comes by default. It should only show BUY signals, SELL signals and their associated closing signals. From time to time you might want to check 'ADVANCED USER 2' instructions to check that there's actually a divergence. Check also 'ADVANCED USER 1' instructions for your amusement.
EXTRA ADVICE
It's advised that you use this strategy in addition to these two other indicators:
* Squeeze Momentum Indicator
* ADX
so that your chart matches as close as possible to TradingLatino chart.
ZIGNALY INTEGRATION
This strategy supports Zignaly email integration by default. It also supports Zignaly Webhook integration.
ZIGNALY INTEGRATION - Email integration example
What you would write in your alert message:
||{{strategy.order.alert_message}}||key=MYSECRETKEY||
ZIGNALY INTEGRATION - Webhook integration example
What you would write in your alert message:
{ {{strategy.order.alert_message}} , "key" : "MYSECRETKEY" }
CREDITS
I have reused and adapted some code from
'Directional Movement Index + ADX & Keylevel Support' study
which it's from TradingView console user.
I have reused and adapted some code from
'3ema' study
which it's from TradingView hunganhnguyen1193 user.
I have reused and adapted some code from
'Squeeze Momentum Indicator ' study
which it's from TradingView LazyBear user.
I have reused and adapted some code from
'Strategy Tester EMA-SMA-RSI-MACD' study
which it's from TradingView fikira user.
I have reused and adapted some code from
'Support Resistance MTF' study
which it's from TradingView LonesomeTheBlue user.
I have reused and adapted some code from
'TF Segmented Linear Regression' study
which it's from TradingView alexgrover user.
I have reused and adapted some code from
"Poor man's volume profile" study
which it's from TradingView IldarAkhmetgaleev user.
FEEDBACK
Please check the strategy source code for more detailed information
where, among others, I explain all of the substrats
and if they are implemented or not.
Q1. Did I understand wrong any of the Jaime substrats (which I have implemented)?
Q2. The strategy yields quite profit when we should long (EMA10 from 1d timeframe is higher than EMA55 from 1d timeframe.
Why the strategy yields much less profit when we should short (EMA10 from 1d timeframe is lower than EMA55 from 1d timeframe)?
Any idea if you need to do something else rather than just reverse what Jaime does when longing?
FREQUENTLY ASKED QUESTIONS
FAQ1. Why are you giving this strategy for free?
TradingLatino and his fellow enthusiasts taught me this strategy. Now I'm giving back to them.
FAQ2. Seriously! Why are you giving this strategy for free?
I'm confident his strategy might be improved a lot. By keeping it to myself I would avoid other people contributions to improve it.
Now that everyone can contribute this is a win-win.
FAQ3. How can I connect this strategy to my Exchange account?
It seems that you can attach alerts to strategies.
You might want to combine it with a paying account which enable Webhook URLs to work.
I don't know how all of this works right now so I cannot give you advice on it.
You will have to do your own research on this subject. But, be careful. Automating trades, if not done properly,
might end on you automating losses.
FAQ4. I have just found that this strategy by default gives more than 3.97% of 'maximum series of losses'. That's unacceptable according to my risk management policy.
You might want to reduce default stop loss setting from 7% to something like 5% till you are ok with the 'maximum series of losses'.
FAQ5. Where can I learn more about your work on this strategy?
Check the source code. You might find unused strategies. Either because there's not a substantial increases on earnings. Or maybe because they have not been implemented yet.
FAQ6. How much leverage is applied in this strategy?
No leverage.
FAQ7. Any difference with original Jaime Merino strategy?
Most of the times Jaime defines an stop loss at the price entry. That's not the case here. The default stop loss is 7% (but, don't be confused it only means losing 1% of your investment thanks to risk management). There's also a trailing take profit that triggers at 2% profit with a 1% trailing.
FAQ8. Why this strategy return is so small?
The strategy should be improved a lot. And, well, backtesting in this platform is not guaranteed to return theoric results comparable to real-life returns. That's why I'm personally forward testing this strategy to verify it.
MENSAJE EN CASTELLANO
En primer lugar se agradece feedback para mejorar la estrategia.
Si eres un usuario avanzado y quieres colaborar en mejorar el script no dudes en comentar abajo.
Ten en cuenta que aunque toda esta descripción tenga que estar en inglés no es obligatorio que el comentario esté en inglés.
CHISTE - CASTELLANO
¡Pero Jaime!
¡400.000!
¡Tu da mun!

Average Directional Index with MACombining the Average Directional Index (ADX) with a 14-period Exponential Moving Average (EMA) can provide traders with a comprehensive approach to identify both the strength of a trend (through ADX) and the trend's direction (using EMA). Let's break down each component and then discuss how they can be combined:
Average Directional Index (ADX):
The ADX is a technical indicator that measures the strength or momentum of a trend, regardless of its direction. The ADX is derived from two other indicators:
Positive Directional Index (+DI): Measures the strength of upward price movement.
Negative Directional Index (-DI): Measures the strength of downward price movement.
14-period Exponential Moving Average (EMA):
The 14-period EMA is a trend-following indicator that gives more weight to recent price data compared to simple moving averages (SMAs). The EMA is calculated by taking the average of the last 14 closing prices, giving more importance to the most recent prices.
Combining ADX and EMA:
When combining ADX with a 14-period EMA:
ADX as a Filter:
Traders might use the ADX to filter out trades when the trend's strength is weak (e.g., ADX below 25) to avoid trading in sideways or choppy markets.
EMA for Trend Direction:
Traders can use the 14-period EMA to determine the trend direction.
A price above the 14-period EMA might indicate an uptrend, while a price below the EMA might suggest a downtrend.
Example Strategy:
Here's a simplified trading strategy combining ADX and EMA:
Trend Identification:
Buy when the price is above the 14-period EMA and the ADX indicates a strong uptrend (e.g., ADX > 25).
Sell or go short when the price is below the 14-period EMA and the ADX indicates a strong downtrend (e.g., ADX > 25).
Avoid Choppy Markets:
Avoid trading when the ADX is below a certain threshold (e.g., ADX < 25) to filter out sideways or range-bound markets.
Combining ADX and a 14-period EMA can provide traders with a balanced approach to identify both the strength and direction of a trend. However, it's essential to remember that no indicator or strategy can guarantee profits, and it's crucial to use risk management techniques and other tools to make informed trading decisions. Consider back testing this strategy on historical data and adjusting the parameters based on their trading style and risk tolerance.
