Cumulative Delta Difference HistogramINTRODUCTION:
This "Cumulative Delta Difference Histogram" is a volume-based indicator that calculates the difference (delta) between aggressive buying volume and selling volume for each candle and then builds a cumulative momentum histogram with the following behavior:
Momentum Tracking: The indicator accumulates the delta values when the delta is positive and increasing, producing green bars whose height visually represents growing buying pressure momentum.
Negative Momentum Detection: When the delta becomes negative or starts to decline, the histogram bars turn red and the accumulation decreases, effectively showing increasing selling pressure momentum.
Directional Reset: On each change from positive to negative delta momentum or vice versa, the accumulator resets to zero, providing a clear and sharp visualization of shifts without persistence from previous trends.
Zero Reference Line: A horizontal zero line serves as a visual baseline to distinguish positive from negative momentum easily.
HOW TO USE:
To trade effectively using the "Cumulative Delta Difference Histogram," you compare the price action chart with the indicator to confirm momentum and detect potential reversals or continuations. Here's how to do it in practice:
Confirming Trends:
When the price is rising, look for the histogram bars to be green and increasing, indicating strong and growing buying pressure supporting the uptrend. If price rises but the histogram shows diminishing green bars or shifts to red, it could signal weakening momentum and a potential reversal.
Identifying Divergences:
Compare price highs/lows with histogram peaks. If price makes a new high but the histogram fails to make a corresponding new high (bearish divergence), it warns of a possible trend reversal. Conversely, if price makes a new low but histogram shows higher lows (bullish divergence), it signals potential bullish reversal.
Volume Confirmation:
The histogram reflects real-time volume aggression behind price moves. Confirmation of price breakouts or breakdowns by corresponding strong histogram colors and bar height increases adds reliability to signals.
By aligning price patterns and levels with the cumulative delta histogram's signals, traders gain a deeper understanding of market strength and better timing for trades.
This combined approach improves the accuracy of entries and exits beyond relying on price alone, especially in markets sensitive to order flow and volume dynamics.
Use this indicator with a default volume or with my other indicator "Agression Histogram" for a better reading.
Cari skrip untuk "accumulation"

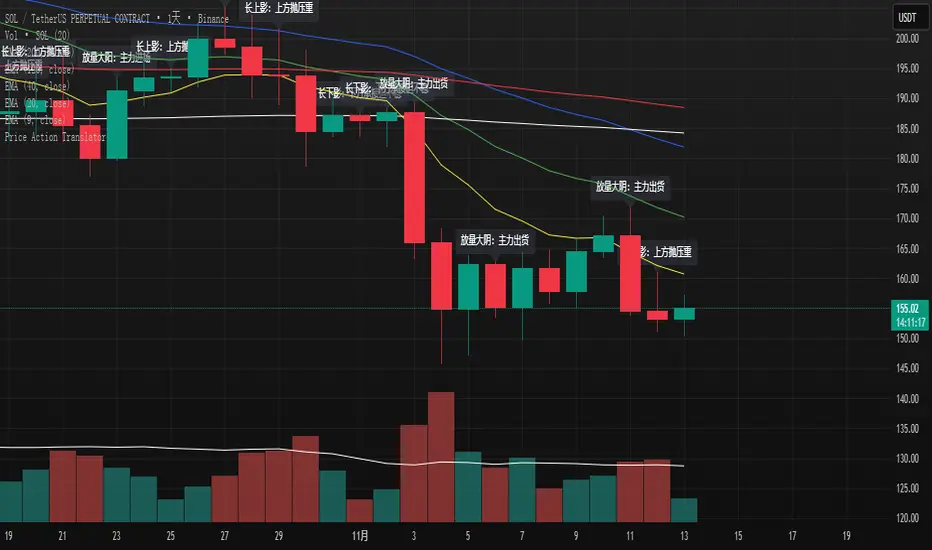
K线语言·国师版 — Price Action TranslatorUnderstand what the market is really saying.
This script automatically translates candlestick and volume behavior into clear, human-readable messages directly on your chart.
Instead of guessing what each bar means, you can hear the market speak.
📈 Green bar with volume → Buyers are in control
📉 Red bar with volume → Sellers are dumping positions
⚖️ Doji → Indecision between buyers and sellers
💡 Long upper wick → Selling pressure from above / Long lower wick → Buyers absorbing below
🧠 Core Concept
Most indicators tell you what happened.
Price Action tells you why it happened.
This script bridges that gap by letting the candles explain the psychology behind every move.
It helps traders:
Visualize market sentiment through candlestick language.
Identify institutional accumulation or distribution.
Build confidence by understanding the story behind price.
⚙️ Main Features
✅ Automatically detects strong volume bars, Doji, long wicks, and reversal patterns.
✅ Displays short contextual messages above or below each bar.
✅ Works on all time frames (Daily / 4H / 1H).
✅ Clean and non-intrusive visual design.
📈 Best For
Traders learning Price Action logic.
Multi-time-frame trend analysts.
Active traders who want to reduce emotional decisions.
🚀 Usage Tips
1️⃣ Use it with your EMA trend system for confirmation.
2️⃣ Watch for volume surges to confirm real momentum.
3️⃣ Do not chase small Doji bars — wait for confirmation candles.
💬 Author’s Note
“Price Action is the language of the market.
Once you understand its voice, you don’t need to guess anymore.”
— Master Edition · Price Action Translator
Trading Range Aggression Histogram
This indicator is a histogram that accumulates the net volume of aggressive buying and selling per candle, representing the dominant market pressure within defined time-frame.
The indicator works by continuously summing volumes as long as the aggression remains in the same direction, resetting and reversing the accumulation when the pressure changes sides.
This creates visual waves that facilitate the perception of phases dominated by buyers and sellers over time. The tool is useful to identify moments of strength, weakness, and potential reversals in a dynamic market, especially in short-term trading.

Range breaking indicatorDescription
Bull/Bear Area Ratio (last N candles) helps identify potential end-of-range situations by analyzing the relative strength of bullish vs bearish candles over a rolling window of N bars.
Instead of simply counting up or down candles, this script measures the "area" of each candle — the absolute distance between open and close, optionally weighted by volume.
By summing these areas over the last N bars, it calculates the percentage of bullish and bearish energy within that period.
When both sides become balanced (near 50/50), it often signals range exhaustion or possible trend transition.
How it works
Calculates the bullish and bearish area of each candle (abs(close - open), optionally × volume).
Maintains rolling buffers of the last N bars to compute running totals.
Plots both Bullish % (green) and Bearish % (red).
Highlights possible range-ending zones when the bullish ratio nears 50% ± threshold.
Displays a label showing the current balance.
Includes an alert condition when equilibrium is detected.
Inputs
Number of candles (N) – Rolling window length.
Use volume weighting – Multiplies each candle’s area by its volume.
Balance threshold (%) – Sensitivity for detecting equilibrium (default: 10%).
Best use
Combine with volume or volatility indicators to confirm market compression or expansion.
Use on higher timeframes (H1, H4, D1) to detect early signs of accumulation or distribution.
Works across all asset types: crypto, forex, stocks, indices, etc.
Alerts
An alert is triggered when:
“The range of the last N candles is balanced (possible end of range).”

Market Profile Dominance Analyzer# Market Profile Dominance Analyzer
## 📊 OVERVIEW
**Market Profile Dominance Analyzer** is an advanced multi-factor indicator that combines Market Profile methodology with composite dominance scoring to identify buyer and seller strength across higher timeframes. Unlike traditional volume profile indicators that only show volume distribution, or simple buyer/seller indicators that only compare candle colors, this script integrates six distinct analytical components into a unified dominance measurement system.
This indicator helps traders understand **WHO controls the market** by analyzing price position relative to Market Profile key levels (POC, Value Area) combined with volume distribution, momentum, and trend characteristics.
## 🎯 WHAT MAKES THIS ORIGINAL
### **Hybrid Analytical Approach**
This indicator uniquely combines two separate methodologies that are typically analyzed independently:
1. **Market Profile Analysis** - Calculates Point of Control (POC) and Value Area (VA) using volume distribution across price channels on higher timeframes
2. **Multi-Factor Dominance Scoring** - Weights six independent factors to produce a composite dominance index
### **Six-Factor Composite Analysis**
The dominance score integrates:
- Price position relative to POC (equilibrium assessment)
- Price position relative to Value Area boundaries (acceptance/rejection zones)
- Volume imbalance within Value Area (institutional bias detection)
- Price momentum (directional strength)
- Volume trend comparison (participation analysis)
- Normalized Value Area position (precise location within fair value zone)
### **Adaptive Higher Timeframe Integration**
The script features an intelligent auto-selection system that automatically chooses appropriate higher timeframes based on the current chart period, ensuring optimal Market Profile structure regardless of the trading timeframe being analyzed.
## 💡 HOW IT WORKS
### **Market Profile Construction**
The indicator builds a Market Profile structure on a higher timeframe by:
1. **Session Identification** - Detects new higher timeframe sessions using `request.security()` to ensure accurate period boundaries
2. **Data Accumulation** - Stores high, low, and volume data for all bars within the current higher timeframe session
3. **Channel Distribution** - Divides the session's price range into configurable channels (default: 20 rows)
4. **Volume Mapping** - Distributes each bar's volume proportionally across all price channels it touched
### **Key Level Calculation**
**Point of Control (POC)**
- Identifies the price channel with the highest accumulated volume
- Represents the price level where the most trading activity occurred
- Serves as a magnetic level where price often returns
**Value Area (VA)**
- Starts at POC and expands both upward and downward
- Includes channels until reaching the specified percentage of total volume (default: 70%)
- Expansion algorithm compares adjacent volumes and prioritizes the direction with higher activity
- Defines the "fair value" zone where most market participants agreed to trade
### **Dominance Score Formula**
```
Dominance Score = (price_vs_poc × 10) +
(price_vs_va × 5) +
(volume_imbalance × 0.5) +
(price_momentum × 100) +
(volume_trend × 5) +
(va_position × 15)
```
**Component Breakdown:**
- **price_vs_poc**: +1 if above POC, -1 if below (shows which side of equilibrium)
- **price_vs_va**: +2 if above VAH, -2 if below VAL, 0 if inside VA
- **volume_imbalance**: Percentage difference between upper and lower VA volumes
- **price_momentum**: 5-period SMA of price change (directional acceleration)
- **volume_trend**: Compares 5-period vs 20-period volume averages
- **va_position**: Normalized position within Value Area (-1 to +1)
The composite score is then smoothed using EMA with configurable sensitivity to reduce noise while maintaining responsiveness.
### **Market State Determination**
- **BUYERS Dominant**: Smooth dominance > +10 (bullish control)
- **SELLERS Dominant**: Smooth dominance < -10 (bearish control)
- **NEUTRAL**: Between -10 and +10 (balanced market)
## 📈 HOW TO USE THIS INDICATOR
### **Trend Identification**
- **Green background** indicates buyers are in control - look for long opportunities
- **Red background** indicates sellers are in control - look for short opportunities
- **Gray background** indicates neutral market - consider range-bound strategies
### **Signal Interpretation**
**Buy Signals** (green triangle) appear when:
- Dominance crosses above -10 from oversold conditions
- Previous state was not already bullish
- Suggests shift from seller to buyer control
**Sell Signals** (red triangle) appear when:
- Dominance crosses below +10 from overbought conditions
- Previous state was not already bearish
- Suggests shift from buyer to seller control
### **Value Area Context**
Monitor the information table (top-right) to understand market structure:
- **Price vs POC**: Shows if trading above/below equilibrium
- **Volume Imbalance**: Positive values favor buyers, negative favors sellers
- **Market State**: Current dominant force (BUYERS/SELLERS/NEUTRAL)
### **Multi-Timeframe Strategy**
The auto-timeframe feature analyzes higher timeframe structure:
- On 1-minute charts → analyzes 2-hour structure
- On 5-minute charts → analyzes Daily structure
- On 15-minute charts → analyzes Weekly structure
- On Daily charts → analyzes Yearly structure
This higher timeframe context helps avoid counter-trend trades against the dominant force.
### **Confluence Trading**
Strongest signals occur when multiple factors align:
1. Price above VAH + positive volume imbalance + buyers dominant = Strong bullish setup
2. Price below VAL + negative volume imbalance + sellers dominant = Strong bearish setup
3. Price at POC + neutral state = Potential breakout/breakdown pivot
## ⚙️ INPUT PARAMETERS
- **Higher Time Frame**: Select specific HTF or use 'Auto' for intelligent selection
- **Value Area %**: Percentage of volume contained in VA (default: 70%)
- **Show Buy/Sell Signals**: Toggle signal triangles visibility
- **Show Dominance Histogram**: Toggle histogram display
- **Signal Sensitivity**: EMA period for dominance smoothing (1-20, default: 5)
- **Number of Channels**: Market Profile resolution (10-50, default: 20)
- **Color Settings**: Customize buyer, seller, and neutral colors
## 🎨 VISUAL ELEMENTS
- **Histogram**: Shows smoothed dominance score (green = buyers, red = sellers)
- **Zero Line**: Neutral equilibrium reference
- **Overbought/Oversold Lines**: ±50 levels marking extreme dominance
- **Background Color**: Highlights current market state
- **Information Table**: Displays key metrics (state, dominance, POC relationship, volume imbalance, timeframe, bars in session, total volume)
- **Signal Shapes**: Triangle markers for buy/sell signals
## 🔔 ALERTS
The indicator includes three alert conditions:
1. **Buyers Dominate** - Fires on buy signal crossovers
2. **Sellers Dominate** - Fires on sell signal crossovers
3. **Dominance Shift** - Fires when dominance crosses zero line
## 📊 BEST PRACTICES
### **Timeframe Selection**
- **Scalping (1-5min)**: Focus on 2H-4H dominance shifts
- **Day Trading (15-60min)**: Monitor Daily and Weekly structure
- **Swing Trading (4H-Daily)**: Track Weekly and Monthly dominance
### **Confirmation Strategies**
1. **Trend Following**: Enter in direction of dominance above/below ±20
2. **Reversal Trading**: Fade extreme readings beyond ±50 when diverging with price
3. **Breakout Trading**: Look for dominance expansion beyond ±30 with increasing volume
### **Risk Management**
- Avoid trading during NEUTRAL states (dominance between -10 and +10)
- Use POC levels as logical stop-loss placement
- Consider VAH/VAL as profit targets for mean reversion
## ⚠️ LIMITATIONS & WARNINGS
**Data Requirements**
- Requires sufficient historical data on current chart (minimum 100 bars recommended)
- Lower timeframes may show fewer bars per HTF session initially
- More accurate results after several complete HTF sessions have formed
**Not a Standalone System**
- This indicator analyzes market structure and participant control
- Should be combined with price action, support/resistance, and risk management
- Does not guarantee profitable trades - past dominance does not predict future results
**Repainting Characteristics**
- Higher timeframe levels (POC, VAH, VAL) update as new bars form within the session
- Dominance score recalculates with each new bar
- Historical signals remain fixed, but current session data is developing
**Volume Limitations**
- Uses exchange-provided volume data which varies by instrument type
- Forex and some CFDs use tick volume (not actual transaction volume)
- Most accurate on instruments with reliable volume data (stocks, futures, crypto)
## 🔍 TECHNICAL NOTES
**Performance Optimization**
- Uses `max_bars_back=5000` for extended historical analysis
- Efficient array management prevents memory issues
- Automatic cleanup of session data on new period
**Calculation Method**
- Market Profile uses actual volume distribution, not TPO (Time Price Opportunity)
- Value Area expansion follows traditional Market Profile auction theory
- All calculations occur on the chart's current symbol and timeframe
## 📚 EDUCATIONAL VALUE
This indicator helps traders understand:
- How institutional traders use Market Profile to identify fair value
- The relationship between price, volume, and market acceptance
- Multi-factor analysis techniques for assessing market conditions
- The importance of higher timeframe structure in trade planning
## 🎓 RECOMMENDED READING
To better understand the concepts behind this indicator:
- "Mind Over Markets" by James Dalton (Market Profile foundations)
- "Markets in Profile" by James Dalton (Value Area analysis)
- Volume Profile analysis in institutional trading
## 💬 USAGE TERMS
This indicator is provided as an educational and analytical tool. It does not constitute financial advice, investment recommendations, or trading signals. Users are responsible for their own trading decisions and should conduct their own research and due diligence.
Trading involves substantial risk of loss. Past performance does not guarantee future results. Always use proper risk management and never risk more than you can afford to lose.

VWAP – Pivot Pairs (SECONDS‑BASED RESET)VWAP – Pivot Pairs (SECONDS-BASED RESET) is a Pine Script v6 indicator for TradingView that combines pivot-based breakout detection with resettable VWAP (Volume Weighted Average Price) calculations over user-defined rolling time periods in seconds.It identifies high and low swing pivots via breakout logic, then calculates two VWAP lines per anchor:One using high/low as the price source,
One using close as the price source.
These form "pivot pairs" that reset automatically at the start of each custom-duration period (e.g., every 300 seconds), starting from a user-defined UTC time of day (default: 09:30 UTC).Visuals include:Colored VWAP lines (high pair: red, low pair: green),
Semi-transparent fill zones between each pair,
Optional toggles to show/hide high or low pairs.
Use CasesUse Case
Description
Intraday Scalping (1–15 min charts)
Use 60–300 second resets to capture micro-trends within larger sessions. VWAP pairs act as dynamic support/resistance after breakouts.
High-Frequency / Algo Validation
Backtest strategies on tick/second charts where traditional session resets fail. Align resets with exchange micro-sessions or volatility windows.
Opening Range Breakout (ORB) Enhancement
Set period_seconds = 1800 (30 min) and start time = 09:30 UTC → VWAP builds only on first 30 mins post-open, then floats. Pairs show deviation from ORB mean.
Range-Bound Market Analysis
In choppy markets, VWAP pairs converge near fair value. Divergence signals potential breakout. Fill color intensity shows conviction.
Multi-Timeframe Confluence
Overlay on 1-second chart with 300s reset → matches 5-minute structure. Use close-based VWAP for entries, high/low-based for stops.
Key Features SummaryFeature
Function
period_seconds
Rolling window length in seconds (e.g., 300 = 5 min)
period_start_time
UTC time-of-day anchor (default: 09:30)
new_period logic
Triggers full reset of pivots + VWAP on exact second boundary
breakingHigher / breakingLower
Detects confirmed breakouts (not just close above high)
Dual VWAP per anchor
ta.vwap(high) and ta.vwap(close) for range-aware mean
Fill zones
Visual value area between high/close VWAPs
Toggle visibility
Independently show/hide high or low pivot pairs
How It Works – Step-by-StepTime Engine Converts user inputs → milliseconds
Calculates current period start time using integer division from epoch
Detects exact bar when new period begins (new_period = true)
On New Period Resets both high/low anchors to current bar’s h and l
Forces VWAP recalculation from this bar forward
Breakout Detection Only triggers on strong candles (rising/falling, non-doji)
Requires open/close beyond prior pivot → avoids wicks-only breaks
VWAP Accumulation ta.vwap(source, reset_condition) restarts when anchor resets
Two sources per side → shows where volume clustered (at highs vs closes)
Plotting Four lines + two fills
Clean, customizable, overlay-friendly
Pro TipsUse on Heikin Ashi for smoother breakout signals.
Combine with volume profile to validate VWAP clusters.
For crypto, set period_start_time = 0 (00:00 UTC) for clean 4-hour resets.
Add alerts on new_period or breakingHigher for automation.
In short: This is a precision VWAP tool for time-boxed, pivot-driven mean reversion and breakout trading, ideal for scalpers, day traders, and algo developers needing sub-session granularity.

🧠 Quantum Regime Shift Detector v4.0 — Enhanced Edition🧠 Quantum Regime Shift Detector v4.0 — Enhanced Edition
Overview:
A cutting-edge, AI-weighted market-regime detector that dynamically tracks volatility, trend, and momentum to pinpoint transitions 🟥, stability 🟩, and uncertainty 🟨 in real time.
📊 Dashboard Interpretation
🟩 Stable: Low volatility — range or accumulation phase → great for steady entries or breakouts.
🟥 Transition: High volatility — regime shift → trend changes / explosive moves likely.
🟨 Uncertain: Neutral zone → patience and tight risk control advised.
💡 Key Features
⚙️ Probability Gauge → quantifies shift likelihood (> 70 % = high confidence)
📈 Flow Bias → shows bullish / bearish directional pressure
🔄 Divergence Alerts → Bull / Bear signals anticipate reversals
🧭 S/R Zones → adaptive pivot-based support & resistance
⏫ MTF Analysis → confirm alignment with higher timeframes
🎯 Trading Applications
✅ Enter during 🟩 stable regimes with confirmed bias direction.
⚠️ Trim or hedge when 🟥 transition appears.
🔃 Use divergence alerts for reversal timing and confirmation.
🧩 Customization
🔧 Tune Feature Weights (volatility / trend / momentum)
🧮 Enable Auto Thresholds for adaptive sensitivity
⏱️ Set Confirmation Bars to filter noise
🌐 Toggle MTF Mode for multi-timeframe synergy
📘 Best Practice:
Use on liquid assets (≥ 15 min TF). Combine with price action, VWAP, and volume profiling for the clearest market DNA signals.
✨ Character count: ≈ 1,470 (TradingView limit safe)

Volume HeatMap Divergence [BigBeluga]🔵 OVERVIEW
The Volume HeatMap Divergence is a smart volume visualization tool that overlays normalized volume data directly on the chart. Using a color heatmap from aqua to red, it transforms raw volume into an intuitive scale — highlighting areas of weak to intense market participation. Additionally, it detects volume-based divergences from price to signal potential reversals or exhaustion zones. Combined with clear visual labeling, this tool empowers traders with actionable volume insights.
🔵 CONCEPTS
Normalized Volume Heatmap : Volume is normalized to a 0–100% scale and visually represented as candles below the chart.
float vol = volume / ta.percentile_nearest_rank(volume, 1000, 100) * 100
Bar Coloring : Price candles are dynamically colored based on volume intensity.
Volume Divergence Logic :
Bullish Divergence : Price forms a lower low, but volume forms a higher low.
Bearish Divergence : Price forms a higher high, but volume forms a lower high.
Dynamic Detection Range : Customizable range ensures divergence signals are meaningful and not random.
Volume Labels : Additional info on divergence bars shows both the actual volume and its normalized % score.
🔵 FEATURES
Volume Heatmap Plot : Normalized volume values colored using a smooth gradient from aqua (low) to red (high).
Price Bar Coloring : Candlesticks on the main chart adopt the same heatmap color based on volume.
Divergence Detection :
Bullish divergence with label and low marker
Bearish divergence with label and high marker
Dual Divergence Labels :
On the volume plot : Direction (Bull/Bear), raw volume, and normalized %
On the price chart : Shape labels showing "Bull" or "Bear" at local highs/lows
Custom Inputs :
Divergence range (min & max), pivot detection distance (left/right)
Toggle to show/hide divergence labels, volume, and % text
Clear Bull/Bear Coloring : Fully customizable label and line colors for both bullish and bearish signals.
🔵 HOW TO USE
Use the indicator as an overlay to monitor real-time volume strength using the heatmap color.
Watch for divergence markers:
Bullish divergence: Candle shows higher volume while price makes a new low
Bearish divergence: Candle shows lower volume while price makes a new high
Use the volume info labels to verify the context of divergence:
Actual volume at divergence candle
Normalized % of that volume compared to past 1000 bars
Adjust pivot sensitivity using "Pivot Left" and "Pivot Right" to tune signal frequency and lag with a right pivot length.
Use divergence zones as early warnings for potential reversals or trend shifts.
Disable or customize labels in settings depending on your charting preferences.
🔵 CONCLUSION
Volume HeatMap Divergence merges heatmap-style volume visualization with intelligent divergence detection — giving traders a clean yet powerful edge. By revealing hidden disconnections between price and participation, it helps users spot exhaustion moves or hidden accumulation zones before the market reacts. Whether you’re a scalper, swing trader, or intraday strategist, this tool offers real-time clarity on who’s in control behind the candles.

Major exchages total Open interest & Long/Short OI trends📊 Indicator: Major Exchanges Total OI & Long/Short Trends
This Pine Script™ indicator is designed to provide a comprehensive analysis of Open Interest (OI) and Long/Short position trends across major cryptocurrency exchanges (Binance, Bybit, OKX, Bitget, HTX, Deribit). It serves as a powerful tool for traders seeking to understand market liquidity, participant positioning, and overall market sentiment.
🔑 Key Features and Functionalities
Aggregated Multi-Exchange Open Interest (OI):
Consolidates real-time Open Interest data from user-selected major cryptocurrency exchanges.
Provides a unified view of the total OI, offering insights into the collective market liquidity and the aggregate size of participants' open positions.
Visualized Combined OI Candles:
Presents the aggregated total OI data in a candlestick chart format.
Displays the Open, High, Low, and Close of the combined OI, with color variations indicating increases or decreases from the previous period. This enables intuitive visualization of OI trend shifts.
Estimated Long/Short OI and Visualization:
Calculates and visualizes estimated Long and Short position Open Interest based on the total aggregated OI data.
Estimation Logic:
Employs a sophisticated logic that considers both price changes and OI fluctuations to infer the balance between Long and Short positions. For instance, an increase in both price and OI may suggest an accumulation of Long positions, while a price decrease coupled with an OI increase might indicate growing Short positions.
Initial 50:50 Ratio:
The estimation for Long/Short OI begins with an assumption of a 50:50 ratio at the initial data point available for the selected timeframe. This establishes a neutral baseline, from which subsequent price and OI changes drive the divergence and evolution of the estimated Long/Short balance.
Flexible Visualization Options:
Allows users to display Long/Short OI data in either line or candlestick styles, with customizable color schemes. This flexibility aids in clearly discerning bullish or bearish positioning trends.
💡 Development Background
The development of this indicator stems from the critical importance of Open Interest data in the cryptocurrency derivatives market. Recognizing the limitations of analyzing individual exchange OI in isolation, the primary objective was to integrate data from leading exchanges to offer a holistic perspective on market sentiment and overall positioning dynamics.
The inclusion of the Long/Short position estimation feature is crucial for deciphering the specific directional biases of market participants, which is often not evident from raw OI data alone. This enables a deeper understanding of how positions are being accumulated or liquidated, moving beyond simple OI change analysis.
Furthermore, a key design consideration was to leverage the characteristic where the indicator's data start point dynamically adjusts with the chart's timeframe selection. This allows for the analysis of short-term Long/Short trends on shorter timeframes and long-term trends on longer timeframes. This inherent flexibility empowers traders to conduct analyses across various time scales, aligning with their diverse trading strategies.
🚀 Trading Applications
Leveraging Combined Open Interest (OI):
Trend Confirmation: A sustained increase in total OI signifies growing market interest and capital inflow, potentially confirming the strength of an existing trend. Conversely, decreasing OI may suggest diminishing participant interest or widespread position liquidation.
Validation of Price Extremes: If price forms a new high but OI fails to increase or declines, it could signal a potential trend reversal (divergence). Conversely, a sharp increase in OI during a price decline might indicate a surge in short positions or renewed selling pressure.
Identifying Volatility Triggers: Monitoring rapid shifts in OI during significant news events or market catalysts can help assess immediate market reactions and liquidity changes.
📈Utilizing Long/Short OI Trends
Assessing Market Bias: A sustained dominance or rapid increase in Long OI suggests a prevalent bullish sentiment, which could inform decisions to enter or maintain long positions. The inverse scenario indicates bearish sentiment and potential short entry opportunities.
Anticipating Squeezes: The indicator can help identify scenarios conducive to short or long squeezes. Excessive short positioning followed by a price uptick can trigger a short squeeze, leading to rapid price appreciation. Conversely, an oversupply of long positions preceding a price drop can result in a long squeeze and sharp declines.
Divergence Analysis: Divergences between price action and Long/Short OI estimates can signal potential trend reversals. For example, if price is rising but the increase in Long OI slows down or Short OI begins to grow, it may suggest weakening buying pressure.
🕔Timeframe-Specific Trend Analysis:
Shorter Timeframes (e.g., 1m, 5m, 15m): Ideal for identifying short-term shifts in participant positioning, beneficial for day trading and scalping strategies. Provides insights into immediate market reactions to price movements.
Longer Timeframes (e.g., 1h, 4h, Daily): Valuable for evaluating broader positioning trends and the sustainability or potential reversal of medium-to-long-term trends. Offers a macro perspective on Long/Short dynamics, suitable for swing trading or long-term investment strategies.
This indicator integrates complex market data, provides nuanced Long/Short position estimations, and offers multi-timeframe analytical capabilities, empowering traders to make more informed and strategic decisions.

Force DashboardScalping Dashboard - Complete User Guide
Overview
This scalping system consists of two complementary TradingView indicators designed for intraday trading with no overnight holds:
Force Dashboard - Single-row table showing real-time market bias and entry signals
Large Order Detection - Visual diamonds showing institutional order flow
Together, they provide a complete at-a-glance view of market conditions optimized for quick entries and exits.
Recommended Timeframes
Primary Scalping Timeframes
1-minute chart: Ultra-fast scalps (30 seconds - 3 minutes hold time)
2-minute chart: Quick scalps (2-5 minutes hold time)
5-minute chart: Standard scalps (5-15 minutes hold time)
Best Practices
Use 1-2 minute for highly liquid instruments (ES, NQ, major forex pairs)
Use 5-minute for less liquid markets or if you prefer fewer signals
Never hold past the last hour of trading to avoid overnight risk
Set hard stop times (e.g., exit all positions by 3:45 PM EST)
Dashboard Components Explained
Core Indicators (Circles ●)
MACD (5/13/5)
Green ● = Bullish momentum (MACD histogram positive)
Red ● = Bearish momentum (MACD histogram negative)
Gray ● = No clear momentum
Use: Confirms trend direction and momentum shifts
EMA (9/20/50)
Green ● = Price > EMA9 > EMA20 (uptrend)
Red ● = Price < EMA9 < EMA20 (downtrend)
Gray ● = Choppy/sideways
Use: Identifies the immediate micro-trend
Stoch (5-period Stochastic)
Green ● = Oversold (<20) - potential reversal up
Red ● = Overbought (>80) - potential reversal down
Gray ● = Neutral zone (20-80)
Use: Spots reversal opportunities at extremes
RSI (7-period)
Green ● = Oversold (<30)
Red ● = Overbought (>70)
Gray ● = Neutral
Use: Confirms overbought/oversold conditions
CVD (Cumulative Volume Delta)
Green ● = CVD above its moving average (buying pressure)
Red ● = CVD below its moving average (selling pressure)
Gray ● = Neutral
Use: Shows overall buying vs selling pressure
ΔCVD (Delta CVD - Rate of Change)
Green ● = CVD accelerating upward (buying acceleration)
Red ● = CVD accelerating downward (selling acceleration)
Gray ● = No acceleration
Use: Detects momentum shifts in order flow
Imbal (Order Flow Imbalance)
Green ● = Buy pressure >2x sell pressure
Red ● = Sell pressure >2x buy pressure
Gray ● = Balanced
Use: Identifies extreme one-sided order flow
Vol (Volume Strength)
Green ● = Volume >1.5x average (strong interest)
Red ● = Volume <0.7x average (low interest)
Gray ● = Normal volume
Yellow background = Volume surge (>2x average) - BIG MOVE ALERT
Use: Confirms conviction behind price moves
Tape (Tape Speed)
Green ● = Fast order flow (>1.3x normal)
Red ● = Slow order flow (<0.7x normal)
Gray ● = Normal speed
Yellow background = Very fast tape (>1.5x) - RAPID EXECUTION ALERT
Use: Measures urgency and speed of orders
Key Levels
Support (Supp)
Shows the nearest high-volume support level below current price
Bright Green background = Price is AT support (within 0.3%) - BOUNCE ZONE
Green background = Price above support (healthy)
Red background = Price below support (broken support, now resistance)
Resistance (Res)
Shows the nearest high-volume resistance level above current price
Bright Orange background = Price is AT resistance (within 0.3%) - REJECTION ZONE
Red background = Price below resistance (facing overhead supply)
Green background = Price above resistance (breakout)
These levels update automatically every 3 bars based on volume profile
Entry Signal Components
Score
Displays format: "6L" (6 long indicators) or "4S" (4 short indicators)
Bright Green = 6-7 indicators aligned for long
Light Green = 5 indicators aligned for long
Yellow = 4 indicators aligned (weaker setup)
Gray = No alignment
Red/Orange colors = Same scale for short setups
Score of 5+ indicates high-probability setup
SCALP (Main Entry Signal)
BRIGHT GREEN "LONG" = High-quality long scalp (Score 5+)
Green "LONG" = Decent long scalp (Score 4)
BRIGHT ORANGE "SHORT" = High-quality short scalp (Score 5+)
Red "SHORT" = Decent short scalp (Score 4)
Gray "WAIT" = No clear setup - STAY OUT
Entry Strategies
Strategy 1: High-Probability Scalps (Conservative)
When to Enter:
SCALP column shows BRIGHT GREEN "LONG" or BRIGHT ORANGE "SHORT"
Score is 5 or higher
Vol or Tape has yellow background (volume surge)
Example Long Setup:
SCALP = BRIGHT GREEN "LONG"
Score = 6L
Vol = Yellow background
Price AT Support (bright green Supp cell)
EMA, MACD, CVD, ΔCVD, Imbal all green
Entry: Enter immediately on next candle
Target: 0.5-1% move or resistance level
Stop: Below support or -0.3%
Hold Time: 2-10 minutes
Strategy 2: Momentum Scalps (Aggressive)
When to Enter:
Tape has yellow background (fast tape)
Vol has yellow background (volume surge)
ΔCVD is green (for longs) or red (for shorts)
Imbal shows strong imbalance in your direction
Score is 4+
Example Short Setup:
Tape & Vol = Yellow backgrounds
ΔCVD = Red, Imbal = Red
Price AT Resistance (bright orange)
Score = 5S
Entry: Enter immediately
Target: Quick 0.3-0.7% move
Stop: Tight -0.2%
Hold Time: 1-5 minutes
Strategy 3: Reversal Scalps (Mean Reversion)
When to Enter:
Stoch shows oversold (green) or overbought (red)
RSI confirms the extreme
Price is AT Support (for longs) or AT Resistance (for shorts)
ΔCVD and Imbal start reversing direction
Score is 4+
Example Long Setup:
Stoch = Green (oversold)
RSI = Green (oversold)
Supp = Bright green (at support)
ΔCVD turns green
Imbal turns green
Score = 4L or 5L
Entry: Wait for confirmation candle
Target: Move back to EMA9 or mid-range
Stop: Below the low
Hold Time: 3-8 minutes
Large Order Detection Usage
Diamond Signals
Green diamonds below bar = Large buy orders (institutional buying)
Red diamonds above bar = Large sell orders (institutional selling)
Size matters: Larger diamonds = larger order flow
How to Use with Dashboard
Confirmation Entries
Dashboard shows "LONG" signal
Green diamond appears
Enter immediately - institutions are buying
Divergence Alerts (CAUTION)
Dashboard shows "LONG" signal
RED diamond appears (institutions selling)
DO NOT ENTER - conflicting order flow
Cluster Patterns
Multiple green diamonds in row = Strong accumulation, stay long
Multiple red diamonds in row = Strong distribution, stay short
Alternating colors = Chop, avoid trading
Risk Management Rules
Position Sizing
Risk 0.5-1% of account per scalp
Maximum 3 concurrent positions
Reduce size after 2 consecutive losses
Stop Loss Guidelines
Tight stops: 0.2-0.3% for 1-2 min charts
Standard stops: 0.3-0.5% for 5 min charts
Always use stop loss - no exceptions
Place stops below support (longs) or above resistance (shorts)
Take Profit Targets
Target 1: 0.3-0.5% (take 50% off)
Target 2: 0.7-1% (take remaining 50%)
Move stop to breakeven after Target 1 hit
Trail stop if Score remains high
Time-Based Exits
Exit immediately if:
SCALP changes from LONG/SHORT to WAIT
Score drops below 3
Large diamond appears in opposite direction
Maximum hold time: 15 minutes (even if profitable)
Hard exit time: 30 minutes before market close
Trading Sessions
Best Times to Scalp
High-Liquidity Sessions
9:30-11:00 AM EST (Market open, highest volume)
2:00-3:30 PM EST (Afternoon session, good moves)
Avoid
11:30 AM-1:30 PM EST (Lunch, low volume)
Last 30 minutes (unpredictable, don't initiate new trades)
News releases (wait 5 minutes for volatility to settle)
Common Patterns & Setups
The Perfect Storm (Highest Probability)
Score = 6L or 7L
SCALP = BRIGHT GREEN
Vol + Tape = Yellow backgrounds
Green diamond appears
Price AT Support
Win rate: ~70-80%
The Fade Setup (Counter-Trend)
Price hits resistance (bright orange)
Stoch + RSI overbought (red)
Red diamond appears
CVD starts turning red
SCALP shows "SHORT"
Win rate: ~60-70%
The Breakout Continuation
Price breaks resistance (Res turns green)
EMA, MACD green
Vol surge (yellow)
Multiple green diamonds
SCALP = "LONG"
Win rate: ~65-75%
Warning Signs - DO NOT TRADE
Red Flags
❌ SCALP shows "WAIT"
❌ Score below 3
❌ Vol and Tape both gray (no volume)
❌ Conflicting signals (dashboard says LONG but red diamonds appearing)
❌ Alternating green/red circles (choppy market)
❌ Support and Resistance very close together (tight range)
Market Conditions to Avoid
Low volume periods
Major news releases (first 5 minutes after)
First 2 minutes after market open
Wide spreads
Consecutive losing trades (take a break after 2 losses)
Quick Reference Checklist
Before Taking ANY Trade:
☑ SCALP shows LONG or SHORT (not WAIT)
☑ Score is 4 or higher
☑ Vol or Tape shows activity
☑ No conflicting diamond signals
☑ Stop loss level identified
☑ Target profit level identified
☑ Not in restricted time periods
After Entering:
☑ Set stop loss immediately
☑ Set profit targets
☑ Watch SCALP column - exit if changes to WAIT
☑ Watch for opposite-colored diamonds
☑ Move stop to breakeven after first target
☑ Exit all by market close
Advanced Tips
Scalping Psychology
Be patient: Wait for Score 5+ setups
Be decisive: When signal appears, act immediately
Be disciplined: Follow your stop loss always
Be flexible: Exit quickly if dashboard reverses
Optimization
Backtest on your specific instrument
Adjust RSI/Stoch levels for your market
Fine-tune volume thresholds
Keep a trade journal to track which setups work best
Multi-Timeframe Confirmation
Use 5-min dashboard as "trend filter"
Take 1-min trades only in direction of 5-min SCALP signal
Increases win rate by ~10-15%
Troubleshooting
Q: Dashboard shows WAIT most of the time
Normal - scalping is about patience. Quality > Quantity
3-8 good setups per day is excellent
Q: Too many false signals
Increase minimum Score requirement to 5 or 6
Only trade with volume surge (yellow backgrounds)
Add large order detection confirmation
Q: Signals too slow
You may be on too high a timeframe
Try 1-minute chart for faster signals
Ensure real-time data feed is active
Q: Support/Resistance not updating
Normal - updates every 3 bars
If completely stuck, remove and re-add indicator
Summary
This scalping system works best when:
✅ Multiple indicators align (Score 5+)
✅ Volume and tape speed confirm the move
✅ Order flow (diamonds) confirms direction
✅ Price is at key levels (support/resistance)
✅ You manage risk strictly
✅ You exit before market close
The golden rule: When SCALP says WAIT, you WAIT. Discipline beats frequency.

Smart VWAP FVG SystemSmart VWAP FVG System - Professional Multi-Filter Trading Indicator
📊 OVERVIEW
The Smart VWAP FVG System is an advanced multi-layered trading indicator that combines institutional volume analysis, multi-timeframe VWAP trend confirmation, and Fair Value Gap detection to identify high-probability trade entries. This indicator uses a sophisticated filtering mechanism where signals appear only when multiple independent confirmation criteria align simultaneously.
Recommended Timeframe: 5-minute (M5) or higher. The indicator works best on M5, M15, and M30 charts for intraday trading.
🎯 ORIGINALITY & PURPOSE
This indicator is original because it combines three distinct analytical methods into a unified decision-making system:
Market Profile Volume Analysis - Identifies institutional accumulation/distribution zones
Dual VWAP Filtering - Confirms trend direction using two independent VWAP calculations
Fair Value Gap Detection - Validates institutional interest through price inefficiency zones
The key innovation is the directional filter system: the primary Market Profile generates BUY-ONLY or SELL-ONLY states based on higher timeframe value area reversals, which then controls which signals from the main system are displayed. This creates a multi-timeframe confluence that significantly reduces false signals.
Unlike simple indicator mashups, each component serves a specific purpose:
Market Profile → Direction bias (trend filter)
Primary VWAP (Session) → Short-term trend confirmation
Secondary VWAP (Week) → Medium-term trend confirmation
FVG Detection → Institutional activity validation
🔧 HOW IT WORKS
1. Primary Market Profile Filter (Higher Timeframe)
The indicator calculates Market Profile on a higher timeframe (default: 1 hour) to determine the overall market structure:
Value Area High (VAH): Top 70% of volume distribution
Value Area Low (VAL): Bottom 70% of volume distribution
Point of Control (POC): Price level with highest volume
When price reaches VAH and reverses down → SELL-ONLY mode activated
When price reaches VAL and reverses up → BUY-ONLY mode activated
This higher timeframe filter ensures you're trading in the direction of institutional flow.
2. Dual VWAP System
Two independent VWAP calculations provide multi-timeframe trend confirmation:
Primary VWAP (Session-based): Resets daily, tracks intraday momentum
Secondary VWAP (Week-based): Resets weekly, confirms longer-term trend
Filter Logic:
BUY signals require: Price > Primary VWAP AND Price > Secondary VWAP
SELL signals require: Price < Primary VWAP AND Price < Secondary VWAP
This dual confirmation prevents counter-trend trades during ranging conditions.
3. Fair Value Gap (FVG) Detection
FVG zones identify price inefficiencies where institutional orders were executed rapidly:
Bullish FVG: Gap between candle .high and candle .low (upward imbalance)
Bearish FVG: Gap between candle .high and candle .low (downward imbalance)
The indicator monitors recent FVG formation (lookback: 50 bars) and requires:
Bullish FVG present for BUY signals
Bearish FVG present for SELL signals
FVG zones are displayed as colored boxes and automatically marked as "mitigated" when price fills the gap.
4. Main Trading Signal Logic
The secondary Market Profile (default: 1 hour) generates the actual trading signals:
BUY Signal Conditions:
Price reaches Value Area Low
Reversal pattern confirmed (minimum 1 bar)
Price > Primary VWAP
Price > Secondary VWAP (if filter enabled)
Recent Bullish FVG detected (if filter enabled)
Primary MP Filter = BUY-ONLY or NEUTRAL
SELL Signal Conditions:
Price reaches Value Area High
Reversal pattern confirmed (minimum 1 bar)
Price < Primary VWAP
Price < Secondary VWAP (if filter enabled)
Recent Bearish FVG detected (if filter enabled)
Primary MP Filter = SELL-ONLY or NEUTRAL
All conditions must be TRUE simultaneously for a signal to appear.
📈 VISUAL ELEMENTS
On Chart:
🟢 Green Triangle (▲) = BUY Signal
🔴 Red Triangle (▼) = SELL Signal
🟦 Blue horizontal lines = Value Area zones
🟡 Yellow line = Point of Control (POC)
🟩 Green boxes = Bullish FVG zones
🟥 Red boxes = Bearish FVG zones
🔵 Blue line = Primary VWAP (Session)
⚪ White line = Secondary VWAP (Week)
Info Panel (Top Right):
Real-time status display showing:
Filter Direction (BUY ONLY / SELL ONLY / NEUTRAL)
Active timeframes for both MP filters
FVG filter status and count
VWAP positions (ABOVE/BELOW)
Signal enablement status
Alert status
⚙️ KEY SETTINGS
MP/TPO Filter Settings (Primary Indicator)
MP Filter Time Frame: 60 minutes (controls directional bias)
Filter Value Area %: 70% (standard Market Profile calculation)
Filter Alert Distance: 1 bar
Filter Min Bars for Reversal: 1 bar
Filter Alert Zone Margin: 0.01 (1%)
FVG Filter Settings
Use FVG Filter: Enabled (toggle on/off)
FVG Timeframe: 60 minutes (1 hour)
FVG Filter Mode: Both (require bullish FVG for BUY, bearish for SELL)
FVG Lookback Period: 50 bars (how far back to search)
Show FVG Formation Signals: Optional visual markers
Max FVG on Chart: 50 zones
Show Mitigated FVG: Display filled gaps
Market Profile Settings
Higher Time Frame: 60 minutes (for main signals)
Percent for Value Area: 70%
Show POC Line: Enabled
Keep Old MPs: Enabled (maintain historical profiles)
Primary VWAP Filter
Use Primary VWAP Filter: Enabled
Primary VWAP Anchor Period: Session (resets daily)
Primary VWAP Source: HLC3 (typical price)
Secondary VWAP Filter
Use Secondary VWAP Filter: Enabled
Secondary VWAP Anchor Period: Week (resets weekly)
Secondary VWAP Filter Mode: Both
Secondary VWAP Line Color: White
Trading Signals
Show Trading Signals on Chart: Enabled
Show SELL Signals: Enabled
Show BUY Signals: Enabled
Alert Distance: 1 bar
Min Bars for Reversal: 1 bar
Alert Zone Margin: 0.01 (1%)
Retest Search Period: 20 bars
Min Bars Between Retests: 5 bars
Show Only Retests: Disabled
Alert Settings
Enable Trading Notifications: Enabled
VAH Reversal Alert: Enabled (SELL signals)
VAL Reversal Alert: Enabled (BUY signals)
Time Filter Settings
Filter Alerts By Time: Optional (exclude specific hours)
⚠️ IMPORTANT WARNINGS & LIMITATIONS
1. Repainting Behavior
CRITICAL: This indicator uses lookahead=barmerge.lookahead_on to access higher timeframe data immediately for FVG detection. This is necessary to provide real-time FVG zone visualization but has the following implications:
FVG zones may shift slightly until the higher timeframe candle closes
FVG detection signals are preliminary until HTF bar confirmation
The main trading signals (triangles) appear on confirmed bars and do not repaint
Best Practice: Always wait for the current timeframe bar to close before acting on signals. The filter status and FVG zones are informational but may adjust as new data arrives.
2. Minimum Timeframe
Do NOT use on timeframes below 5 minutes (M5)
Recommended: M5, M15, M30 for intraday trading
Higher timeframes (H1, H4) can also be used but will generate fewer signals
3. Multiple Filters Can Block Signals
By design, this indicator is conservative. When all filters are enabled:
Signals appear ONLY when all conditions align
You may see extended periods with no signals
This is intentional to reduce false positives
If you see no signals:
Check the Info Panel to see which filters are failing
Consider adjusting FVG lookback period
Temporarily disable FVG filter to test
Verify VWAP filters match current market trend
4. Market Profile Limitations
Market Profile requires sufficient volume data
Low-volume instruments may produce unreliable profiles
Value Areas update only on higher timeframe bar close
Works best on liquid markets (major forex pairs, indices, crypto)
📖 HOW TO USE
Step 1: Add to Chart
Apply indicator to M5 or higher timeframe chart
Ensure chart shows volume data
Use standard candles (NOT Heikin Ashi, Renko, etc.)
Step 2: Configure Settings
Primary MP Filter TF: Set to 60 (1 hour) minimum, or 240 (4 hour) for swing trading
Main MP TF: Set to 60 (1 hour) for intraday signals
FVG Timeframe: Match or exceed main MP timeframe
Leave other settings at default initially
Step 3: Understand the Info Panel
Monitor the top-right panel:
FILTER STATUS: Shows current directional bias
NEUTRAL = Both signals allowed
BUY ONLY = Only green triangles will appear
SELL ONLY = Only red triangles will appear
FVG Filter: Shows if bullish/bearish gaps detected recently
VWAP positions: Confirms trend alignment
Step 4: Take Signals
For BUY Signal (Green Triangle ▲):
Wait for green triangle to appear
Check Info Panel shows ✓ for BUY signals
Confirm current bar has closed
Enter long position
Stop loss: Below recent VAL or swing low
Target: Previous Value Area High or 1.5-2× risk
For SELL Signal (Red Triangle ▼):
Wait for red triangle to appear
Check Info Panel shows ✓ for SELL signals
Confirm current bar has closed
Enter short position
Stop loss: Above recent VAH or swing high
Target: Previous Value Area Low or 1.5-2× risk
Step 5: Risk Management
Risk per trade: Maximum 1-2% of account equity
Position sizing: Adjust based on stop loss distance
Avoid trading: During major news events or time filter periods
Multiple confirmations: Look for confluence with price action (support/resistance, trendlines)
🎓 UNDERLYING CONCEPTS
Market Profile Theory
Developed by J. Peter Steidlmayer in the 1980s, Market Profile organizes price and volume data to identify:
Value Areas: Where 70% of trading activity occurred
POC: Price level with highest acceptance (most volume)
Imbalances: When price moves away from value quickly
This indicator uses TPO (Time Price Opportunity) calculation method to build the volume profile distribution.
VWAP (Volume Weighted Average Price)
VWAP represents the average price weighted by volume, showing where institutional traders are positioned:
Price above VWAP = Bullish (institutions accumulated lower)
Price below VWAP = Bearish (institutions distributed higher)
Using dual VWAP (Session + Week) creates multi-timeframe trend alignment.
Fair Value Gaps (FVG)
Also known as "imbalance" or "inefficiency," FVG occurs when:
Price moves so rapidly that a gap forms in the candlestick structure
Indicates institutional order flow (large market orders)
Price often returns to "fill" these gaps (rebalance)
The 3-candle FVG pattern (gap between candle and candle ) is widely used in ICT (Inner Circle Trader) methodology and Smart Money Concepts.
🔍 CREDITS & CODE ATTRIBUTION
This indicator builds upon established technical analysis concepts and combines multiple methodologies:
1. Market Profile / TPO Calculation
Concept Origin: J. Peter Steidlmayer (Chicago Board of Trade, 1980s)
Code Inspiration: TradingView's public domain Market Profile examples
Modifications: Custom filtering logic for directional bias, dual timeframe implementation
2. VWAP Calculation
Concept Origin: Standard financial instrument (widely used since 1980s)
Code Base: TradingView built-in ta.vwap() function (public domain)
Modifications: Dual VWAP system with independent anchor periods, custom filtering modes
3. Fair Value Gap Detection
Concept Origin: Inner Circle Trader (ICT) / Smart Money Concepts methodology
Code Implementation: Original implementation based on 3-candle gap pattern
Features: Multi-timeframe detection, automatic mitigation tracking, visual zone display
4. Pine Script Framework
Language: Pine Script v6 (TradingView)
Built-in Functions Used:
ta.vwap() - Volume weighted average price
request.security() - Higher timeframe data access
ta.change() - Period detection
ta.cum() - Cumulative volume
time() - Timestamp functions
Note: All code is original implementation. While concepts are based on established trading methodologies, the combination, filtering logic, and execution are unique to this indicator.
📊 RECOMMENDED INSTRUMENTS
Best Performance:
Major Forex Pairs (EURUSD, GBPUSD, USDJPY)
Stock Indices (ES, NQ, SPX, DAX)
Major Cryptocurrencies (BTCUSD, ETHUSD)
Liquid Stocks (high daily volume)
Avoid:
Low-volume altcoins
Illiquid stocks
Exotic forex pairs with wide spreads
⚡ PERFORMANCE TIPS
Start Conservative: Enable all filters initially
Reduce Filters Gradually: If too few signals, disable Secondary VWAP filter first
Match Timeframes: Keep MP Filter TF and FVG TF at same value
Backtest First: Review historical performance on your preferred instrument/timeframe
Combine with Price Action: Look for support/resistance confluence
Use Time Filter: Avoid low-liquidity hours (optional setting)
🚫 WHAT THIS INDICATOR DOES NOT DO
Does not guarantee profits - No trading system is 100% accurate
Does not predict the future - Based on historical patterns
Does not replace risk management - Always use stop losses
Does not work on all instruments - Requires volume data and liquidity
Does not provide exact entry/exit prices - Signals are zones, not precise levels
Does not account for fundamentals - Purely technical analysis
📜 DISCLAIMER
This indicator is provided for educational and informational purposes only. It is not financial advice, and past performance does not guarantee future results.
Trading Risk Warning:
All trading involves risk of loss
You can lose more than your initial investment (leverage products)
Only trade with capital you can afford to lose
Always use appropriate position sizing and risk management
Consider seeking advice from a licensed financial advisor
Technical Limitations:
Indicator may repaint FVG zones until HTF bar closes
Signals are based on historical patterns that may not repeat
Market conditions change and no system works in all environments
Volume data quality varies by exchange/broker
By using this indicator, you acknowledge these risks and agree that the author bears no responsibility for trading losses.
📞 SUPPORT & UPDATES
Questions? Comment on this publication
Issues? Describe the problem with chart screenshot
Feature Requests? Suggest improvements in comments
Updates: Will be published as new versions using TradingView's update feature
📝 VERSION HISTORY
Version 1.0 (Current)
Initial public release
Multi-filter system: MP + Dual VWAP + FVG
Directional bias filter
Real-time info panel
Comprehensive alert system
Time-based filtering
Thank you for using Smart VWAP FVG System!
Happy Trading! 📈

VWAP Trend
**Overview**
The VWAP Trend indicator is a volume-weighted price analysis tool that visualizes the relationship between price and the anchored Volume Weighted Average Price (VWAP) over different timeframes. This script is designed to reveal when the market is trending above or below its volume-weighted equilibrium point, providing a clear framework for identifying directional bias, trend strength, and potential reversals.
By combining an anchored VWAP with exponential smoothing and a secondary trend EMA, the indicator helps traders distinguish between short-term price fluctuations and genuine volume-supported directional moves.
**Core Concept**
VWAP (Volume Weighted Average Price) represents the average price of an asset weighted by traded volume. It reflects where the majority of trading activity has taken place within a chosen period, serving as a critical reference level for institutions and professional traders.
This indicator extends the traditional VWAP concept by:
1. Allowing users to **anchor VWAP to different timeframes** (Daily, Weekly, or Monthly).
2. Applying **smoothing** to create a stable reference curve less prone to noise.
3. Overlaying a **trend EMA** to identify whether current price momentum aligns with or diverges from VWAP equilibrium.
The combination of these elements produces a visual representation of price’s relationship to its fair value across time, helping to identify accumulation and distribution phases.
**Calculation Methodology**
1. **Anchored VWAP Calculation:**
The script resets cumulative volume and cumulative volume–price data at the start of each new VWAP session (based on the selected anchor timeframe). It continuously accumulates the product of price and volume, dividing this by total volume to compute the current VWAP value.
2. **Smoothing Process:**
The raw VWAP line is smoothed using an Exponential Moving Average (EMA) of user-defined length, producing a cleaner, more stable trend curve that minimizes intraperiod noise.
3. **Trend Determination:**
An additional EMA is calculated on the closing price. By comparing the position of this EMA to the smoothed VWAP, the indicator determines the prevailing market bias:
* When the trend EMA is above the smoothed VWAP, the market is considered to be in an **uptrend**.
* When the trend EMA is below the smoothed VWAP, the market is classified as a **downtrend**.
**Visual Structure**
The indicator uses color dynamics and chart overlays to make interpretation intuitive:
* **Smoothed VWAP Line:** The main trend reference, colored blue during bullish conditions and orange during bearish conditions.
* **Price Fill Region:** The area between the smoothed VWAP and price is filled with a translucent color matching the current trend, visually representing whether price is trading above or below equilibrium.
* **Trend EMA (implicit):** Although not separately plotted, it drives the color state of the VWAP, ensuring seamless visual transitions between bullish and bearish conditions.
**Inputs and Parameters**
* **VWAP Timeframe:** Choose between Daily, Weekly, or Monthly anchoring. This determines the reset frequency for cumulative volume and price data.
* **VWAP Smoothing Length:** Defines how many periods are used to smooth the VWAP line. Shorter values produce a more reactive line; longer values create smoother, steadier signals.
* **Trend EMA Length:** Sets the period for the trend detection EMA applied to price. Adjust this to calibrate how quickly the indicator reacts to directional changes.
**Interpretation and Use Cases**
* **Trend Confirmation:** When price and the trend EMA both remain above the smoothed VWAP, the market is showing strong bullish control. Conversely, consistent price action below the VWAP suggests sustained bearish sentiment.
* **Fair Value Assessment:** VWAP serves as a dynamic equilibrium level. Price repeatedly reverting to this line indicates consolidation or fair value zones, while strong directional moves away from VWAP highlight momentum phases.
* **Institutional Benchmarking:** Because large market participants often benchmark entries and exits relative to VWAP, this indicator helps align retail analysis with institutional logic.
* **Reversal Detection:** Sudden crossovers of the trend EMA relative to the VWAP can signal potential reversals or shifts in momentum strength.
**Trading Applications**
* **Trend Following:** Use VWAP’s direction and color state to determine trade bias. Long entries are favored when the VWAP turns blue, while short entries align with orange phases.
* **Mean Reversion:** In ranging conditions, traders may look for price deviations far above or below VWAP as potential reversion opportunities.
* **Multi-Timeframe Confluence:** Combine the Daily VWAP Trend with higher anchor periods (e.g., Weekly or Monthly) to confirm larger trend structure.
* **Support and Resistance Mapping:** VWAP often acts as a strong intraday or session-level support/resistance zone. The smoothed version refines this behavior into a cleaner, more reliable reference.
**Originality and Innovation**
The VWAP Trend indicator stands apart from conventional VWAP scripts through several original features:
1. **Anchor Flexibility:** Most VWAP indicators fix the anchor to a specific session (like daily). This version allows switching between Daily, Weekly, and Monthly anchors dynamically, adapting to various trading styles and time horizons.
2. **Volume-Weighted Smoothing:** The use of an EMA smoothing layer over the raw VWAP provides enhanced stability without compromising responsiveness, delivering a more analytically consistent signal.
3. **EMA-Based Trend Comparison:** By introducing a second trend EMA, the indicator creates a comparative framework that merges volume-weighted price analysis with classical momentum tracking — a rare and powerful combination.
4. **Adaptive Visual System:** The color-shifting and shaded fill between VWAP and price are integrated into a single, lightweight structure, giving traders immediate insight into market bias without the clutter of multiple overlapping indicators.
**Advantages**
* Adaptable to any market, timeframe, or trading style.
* Provides both equilibrium (VWAP) and momentum (EMA) perspectives.
* Smooths out noise while retaining the integrity of volume-based price dynamics.
* Enhances situational awareness through intuitive color-coded visualization.
* Ideal for professional, swing, and intraday traders seeking context-driven market direction.
**Summary**
The VWAP Trend indicator is a modern enhancement of the classical VWAP methodology. By merging anchored volume-weighted analysis with smoothed trend detection and visual state feedback, it provides a comprehensive perspective on market equilibrium and directional strength. It is built for traders who seek more than static price references — offering an adaptive, volume-aware framework for identifying market trends, reversals, and fair-value zones with precision and clarity.

Current State: Overbought/Oversold + Trend KAPIL GOYALThis Pine Script calculates the RSI (Relative Strength Index) and compares it against preset thresholds to classify the market as Deep/Moderate/Mild Oversold or Deep/Moderate/Mild Overbought. It also checks whether the current price is above or below the 50-day moving average to define the trend as Uptrend or Downtrend. The script then combines both signals into one clean, real-time text output—like “Moderate Oversold + Uptrend”—displayed in a small table at the chart corner. It’s designed to give a quick, clutter-free snapshot of the current market state without plotting multiple indicators.
How to use:
Apply this indicator to any chart (e.g., Tesla on TradingView). It will show one line of text describing the current condition based on RSI and trend. Use it for quick decision cues:
“Oversold + Uptrend” suggests potential accumulation or rebound zones.
“Overbought + Downtrend” warns of exhaustion or profit-taking zones.
Combine it with your entry/exit strategy—like your 30DMA/50DMA rule or momentum filters—to confirm timing rather than act alone.

RSI(14) CrossUp >= 60 📈 RSI14 CrossUp ≥ 60 (Daily, Live) + BB Width Screener
Author: Rayan Selim / Torpedo Labs
Version: 1.0
Category: Momentum + Volatility Visualization
🧠 Overview
This indicator combines RSI-based momentum confirmation with Bollinger Band Width (BBW) expansion tracking — designed for traders who want to visually and quantitatively detect daily strength shifts and volatility expansions across multiple symbols.
It highlights candles when the daily RSI(14) crosses above 60, signaling bullish continuation, and displays daily Bollinger Band Width data to assess volatility expansion or contraction.
You can also use the built-in Screener plots as custom columns in TradingView’s Watchlist or Stock Screener for quick scanning of multiple symbols.
⚙️ Core Features
✅ Daily RSI(14) Cross-Up Highlight
Automatically colors candles when RSI crosses above 60 (updates live, no need to wait for daily close).
✅ Bollinger Band Width (BBW) Display
Shows BBW values for the highlighted and previous candles.
✅ Dynamic Label Coloring
Expanding BBW → Green label, Contracting → Red label (toggleable).
✅ Grouped Input Panels
Organized configuration panels for clarity:
Graphic / Highlight
BBW Labels (Global / Green / Red / Fonts)
Screener Outputs
✅ Screener-Compatible Output Plots
Adds hidden plots for Watchlist columns:
RSI Prev (D)
RSI Today (D)
BBW Prev (D)
BBW Today (D)
CrossUp≥60 (0/1)
BBW Expanding (0/1)
✅ Live & Non-Repainting
Uses lookahead_on for live RSI updates while maintaining daily context.
📊 Use Case Examples
Detect momentum confirmation (RSI crossing 60) with simultaneous volatility expansion.
Screen for tickers where daily BBW is widening while RSI shows strength.
Build Watchlist columns to sort stocks by RSI conditions and BBW expansion.
Identify early breakout conditions during accumulation phases.
⚡ Technical Notes
All calculations use daily data, even on lower timeframes.
RSI cross-up events include the current (in-progress) daily candle.
Screener columns are hidden by default but can be toggled visible for debugging.
The indicator is non-repainting, as it reads daily RSI and BBW in real time.
📢 Alerts
Built-in alert for “RSI(14) Crossed Above 60 (Live)” so you never miss a setup.

Stablecoin to BTC Market Cap RatioThis indicator calculates the ratio of the combined market capitalization of USDT and USDC stablecoins to the market capitalization of BTC. Data is updated daily from TradingView's CRYPTOCAP sources. It is displayed as a line in a separate panel, allowing analysis of stablecoin liquidity dynamics relative to BTC.
How to Use
Add the indicator to any asset chart in TradingView. It is useful for assessing the potential buying power of stablecoins in the cryptocurrency market. High ratio values may signal accumulation of liquidity in stablecoins, often preceding growth in BTC or altcoins (bullish signal). Low values indicate a decrease in the role of stablecoins, which may be bearish. It is recommended to combine with other indicators, such as RSI or volumes, to confirm trends.

Enhanced Roman Order Block v2Enhanced Roman Order Block Indicator v2
This indicator identifies and visualizes Order Blocks (OBs) on your chart, which are key price zones where institutional traders likely placed significant orders, often acting as support/resistance. It's an enhanced version inspired by standard OB detection scripts (like "Crystal Order Block"), but combines and improves upon them with practical features for better trading utility—avoiding a simple mashup by integrating complementary tools that work synergistically.
Originality and Enhancements:
Builds on basic candle-pattern OB detection but adds ATR-based minimum size filtering to ignore noise (e.g., small, insignificant blocks).
Includes optional Higher Timeframe (HTF) confirmation to validate OBs against larger trends, using confirmed data only (no lookahead bias—requests are offset for historical accuracy).
Customizable mitigation (wick or close-based) to detect when an OB is "touched" and potentially invalidated.
Adjustable lookback for pattern flexibility, box extensions, price lines, max displayed OBs (to declutter charts), and alerts for formation/mitigation.
These features merge to create a more reliable, user-configurable tool: e.g., HTF checks + ATR filters reduce false positives, while alerts + lines help in live trading without overwhelming the chart.
How It Works:
Detection Logic: Scans recent candles (default lookback=3) for bullish OBs (e.g., a low that's lower than prior but higher than subsequent swings, indicating accumulation) or bearish OBs (opposite for distribution). Formulas: Bullish = (B_low < A_low) AND (C_low > B_low) AND ((C_low > B_high) OR (D_low > B_high)); similar for bearish.
Filters: OBs must exceed ATR * minOBSizeATR (default 0.5) for validity. If HTF enabled, confirms the OB aligns with HTF lows/highs.
Mitigation: Tracks OBs and shortens boxes/lines when price wicks/closes into the mitigation level (top for bullish, bottom for bearish).
Display: Draws semi-transparent boxes (extendable), optional dashed lines, and labels. Limits to maxOBs, removing oldest.
Alerts: Triggers on new OBs or mitigations for timely notifications.
Underlying concept: OBs stem from Smart Money Concepts (SMC), where big players leave "footprints" in price structure— this script automates detection with risk-aware tweaks.
How to Use:
Add to chart (works on any timeframe/symbol, e.g., crypto like ETHUSD).
Inputs:
Order Block Settings: Toggle bullish/bearish/mitigated visibility; choose mitigation type; set min size/lookback.
Display: Adjust extensions, enable lines, limit max OBs.
Alerts: Enable for OB events.
Multi-Timeframe: Input a higher TF (e.g., "D" for daily) for confirmation—ensures OBs respect bigger-picture levels.
Williams AD + MA“I’ve added an MA to the Williams Accumulation/Distribution (AD) indicator. You can use it to infer potential trend inflection points and to assess the persistence of the trend.”

Breakout Boxes [ChartPrime]⯁ OVERVIEW
The Breakout Boxes indicator identifies key structural levels by detecting and aligning two consecutive pivots — forming confirmation zones where potential breakouts are most likely to occur. Once two pivots align within a defined ATR range, the indicator constructs a Breakout Box around that area, tracking volume distribution and breakout strength. When price breaks above or below these boxes, breakout labels (⯁ BreakUp / BreakDn) are displayed to confirm trend continuation.
⯁ KEY FEATURES
Pivot-Based Detection: Uses a customizable pivot length to identify market swing highs and lows.
Two-Pivot Alignment Logic: A breakout box is only created when two pivot highs or lows form near the same level, confirming structural alignment and increasing breakout reliability.
Dynamic Box Generation: Builds upper and lower boxes once pivot alignment is confirmed, adapting automatically to new structures.
Volume Distribution Analysis: Each box measures total traded volume and separates it into bullish and bearish components, showing buy/sell percentages inside the range.
The volume data is calculated in real time as long as the box remains active and unbroken, allowing traders to monitor live accumulation or distribution before a breakout occurs.
Breakout Confirmation Signals: Labels appear when price decisively breaks above the upper box (⯁ BreakUp) or below the lower one (⯁ BreakDn).
Adaptive ATR Scaling: Box size dynamically adjusts to volatility, maintaining consistent proportions across assets and timeframes.
Color-Coded Visualization: Upper (bearish) boxes use pink tones; lower (bullish) boxes use green, both with transparent fill for volume clarity.
Automatic Box Resetting: Previous boxes close when a new pivot pair forms, ensuring only the most relevant structure is active.
⯁ USAGE
Watch for Two Pivot Alignments — the indicator only activates when structural confluence exists, reducing false breakout signals.
Upper Boxes represent resistance formed by two aligned swing highs; a breakout above indicates potential bullish continuation.
Lower Boxes represent support formed by two aligned swing lows; a breakdown below indicates bearish continuation.
Analyze the Volume Ratio inside each box — higher buy volume in upper boxes supports bullish breakouts, while higher sell volume in lower boxes supports bearish moves.
Use this tool alongside trend indicators or higher timeframe context to confirm the direction of breakouts.
⯁ CONCLUSION
The Breakout Boxes indicator refines breakout analysis by requiring two aligned pivots to validate structural zones. By combining pivot confluence with volume distribution and adaptive ATR scaling, it provides a precise, data-backed visualization of breakout strength and direction — a powerful tool for structure-based trading confirmation.

Volume Cluster Support and Resistance Levels [QuantAlgo]🟢 Overview
This indicator identifies statistically significant support and resistance levels through volume cluster analysis, isolating price zones characterized by elevated trading activity and institutional participation. By quantifying areas where volume concentration exceeded historical norms, it reveals price levels with demonstrated supply-demand imbalances that exhibit persistent influence on subsequent price action. The methodology is asset-agnostic and timeframe-independent, applicable across equities, cryptocurrencies, forex, and commodities from intraday to weekly intervals.
🟢 Key Features
1. Support and Resistance Levels
The indicator scans historical price data to identify bars where volume exceeds a user-defined threshold multiplier relative to the rolling average. For each qualifying bar, a representative price is calculated using the average of high, low, and close. Proximate price levels within a specified percentage range are then aggregated into discrete clusters using volume-weighted averaging, eliminating redundant signals. Clusters are ranked by cumulative volume to determine statistical significance. Finally, the indicator plots horizontal levels at each cluster price: support levels (green) below current price indicate zones where historical buying pressure exceeded selling pressure, while resistance levels (red) above current price mark zones where sellers historically dominated. These levels represent areas of established liquidity and price discovery, where institutional order flow previously concentrated.
The Touch Count (T) metric quantifies historical price interaction frequency, while Total Volume (TV) measures aggregate trading activity at each level, providing objective criteria for assessing level strength and trade execution decisions.
2. Volume Histogram
A histogram appears below the price chart, displaying relative volume for each bar within the lookback period, with bar height scaled to the maximum volume observed. Green bars represent up-periods (close > open) indicating buying pressure, while red bars show down-periods (close < open) indicating selling pressure. This visualization helps you confirm the validity of support/resistance levels by seeing where volume actually spiked, identify accumulation/distribution patterns, and validate breakouts by checking if they occur on above-average volume.
3. Built-in Alerts
Automated alerts trigger when price crosses below support levels or breaks above resistance levels, allowing you to monitor multiple assets without constant chart-watching.
4. Customizable Color Schemes
The indicator provides four preset color configurations (Classic, Aqua, Cosmic, Custom) optimized for visual clarity across different charting environments. Each scheme maintains consistent color mapping for support and resistance zones across both level lines and volume histogram components. The Custom configuration permits full color specification to accommodate individual charting setups, ensuring optimal visual contrast for extended analysis sessions.
Classic:
Aqua:
Cosmic:
Custom:
🟢 Pro Tips
→ Trade entry optimization: Execute long positions at support levels with high touch counts or upon confirmed resistance breakouts accompanied by above-average volume
→ Risk parameter definition: Position stop-loss orders near identified support/resistance zones with statistical significance to minimize premature exits
→ Breakout validation: Require volume confirmation exceeding historical average when price penetrates resistance to filter false breakouts
→ Level strength assessment: Prioritize levels with higher touch counts and total volume metrics for enhanced probability trade setups
→ Multi-timeframe confluence: Synthesize support/resistance levels across multiple timeframes to identify high-conviction zones where daily support aligns with 4-hour resistance structures

Simulated Fear & Greed (CNN-calibrated v2)🧭 Fear & Greed Index — TradingView Version (Simulated CNN Model)
🔍 Purpose
The Fear & Greed Index is a sentiment indicator that quantifies market emotion on a scale from 0 to 100, where:
0 represents Extreme Fear (capitulation, oversold conditions), and
100 represents Extreme Greed (euphoria, overbought conditions).
It helps traders assess whether the market is driven by fear (risk aversion) or greed (risk appetite) — giving a high-level view of potential turning points in market sentiment.
⚙️ How It Works in TradingView
Because TradingView cannot directly access CNN’s or alternative external sentiment feeds, this indicator simulates the Fear & Greed Index by analyzing in-chart technical data that reflect investor psychology.
It uses a multi-factor model, converting price and volume signals into a composite sentiment score.
🧩 Components Used (Simulated Metrics)
Category Metric Emotional Interpretation
Volatility ATR (Average True Range) High ATR = Fear, Low ATR = Greed
Momentum RSI + MACD Histogram Rising momentum = Greed, Falling = Fear
Volume Activity Volume Z-Score High positive deviation = Greed, Low = Fear
Trend Context SMA Regime Bias (50/200) Downtrend adds Fear penalty, Uptrend supports Greed
These elements are normalized into a 0–100 scale using percentile ranks (like statistical scoring) and then combined using user-adjustable weights.
⚖️ CNN-Style Calibration
The script follows CNN’s five sentiment bands for clarity:
Range Zone Colour Description
0–25 Extreme Fear 🔴 Red Panic, forced selling, capitulation risk
25–45 Fear 🟠 Orange Uncertainty, hesitation, early accumulation phase
45–55 Neutral ⚪ Gray Balanced sentiment, indecision
55–75 Greed 🟢 Light Green Optimism, trend continuation
75–100 Extreme Greed 💚 Bright Green Euphoria, risk of reversal
This structure aligns visually with CNN’s public gauge, making it easy to interpret.

Ethereum Sleepy Wallets – 6-Month DormancyWhat This Indicator Does
It measures how many Ethereum addresses have been completely inactive for at least 6 months (≥ 180 days) — using official Glassnode and CryptoQuant on-chain metrics.
This reveals deep conviction among long-term ETH holders
Core Concept: Direct 6-Month Dormancy
The indicator uses two precise on-chain signals:
Total Unique ETH Addresses
From GLASSNODE:ETH_ADDRESSES or CRYPTOQUANT:ETH_TOTAL_ADDRESSES
Counts every address ever used on Ethereum
Addresses Inactive ≥ 180 Days
From GLASSNODE:ETH_ADDRESSES_GREATER_THAN_180_DAYS
Counts every address that has not sent or received ETH in 6+ months
Sleepy ETH = Dormant ≥ 180 Days
Sleepy Ratio % = (Sleepy / Total) × 100
This is not an estimate — it’s direct, real dormancy.
Why 6-Month Dormancy Matters
Short-term activity (7-day) = noise from DeFi, NFTs, trading
180-day inactivity = true HODLing — coins untouched through entire market cycles
Historically:
Rising dormancy → supply drying up → bullish pressure
Falling dormancy → long-term holders selling → bearish warning
How It Works (Step-by-Step)
Fetches daily data from Glassnode (Pro+) or CryptoQuant (free)
Selects real data if available; otherwise uses robust fallback
Calculates raw sleepy wallets = addresses inactive ≥ 180 days
Smooths the signal with a 21-day simple moving average (SMA) to filter noise
Computes Sleepy Ratio % for instant conviction reading
Displays live info table with exact values on every bar
How to Use It
Signal
Interpretation
Suggested Action
Sleepy Ratio > 75% and rising
Extreme long-term HODLing
Strong accumulation — buy/hold
Smooth Sleepy trending up
Dormancy growing over 21 days
Bullish supply shock forming
Sleepy Ratio < 68% and falling
Long-term coins re-entering circulation
Caution — possible distribution
Smooth Sleepy dropping fast
HODLers breaking after 6+ months
Bearish warning — consider exits
Use on Daily (D) or Weekly (W) charts for clean, reliable signals.
Pro+ vs Free Mode
Mode
Data Source
Accuracy
Pro+ (Glassnode ON)
Real 180-day dormancy metric
100% precise
Free (Glassnode OFF)
CryptoQuant + price-scaled estimate
~80% historical correlation
Toggle in settings: Use Glassnode Data
What Makes This Indicator Original
First open-source script to directly plot Ethereum’s 6-month dormancy using official ADDRESSES_GREATER_THAN_180_DAYS
No fake math — uses true inactivity, not active address subtraction
Dual-source logic ensures usability on any TradingView plan
Dual output: raw sleepy count + 21-day SMA for precision and trend
Live info table shows real-time values and data source

Flow Control Oscillator (FCO)Flow Control Oscillator (FCO)
The Flow Control Oscillator (FCO) is a momentum-based indicator that combines volume analysis and money flow to determine who is in control of the market—buyers or sellers—and how strong that control is. Unlike pure price-based oscillators, FCO integrates both price action and volume distribution to provide a more complete picture of market dynamics.
How It Works
Core Components:
Money Flow Index (MFI) -
Scaled to -1 to +1 range
Measures the flow of money into and out of an asset
Identifies buying and selling pressure based on price and volume
Chaikin Money Flow (CMF) -
Already in -1 to +1 range
Measures the accumulation/distribution of volume
Shows whether volume is accumulating (buying) or distributing (selling)
Combined Flow Control Line (FCO Line) -
Equal-weighted composite of MFI and CMF
Smoothed with SMA (default: 3 periods)
Values above 0 = Buyers in control
Values below 0 = Sellers in control
Signal Line -
WMA of the FCO line (default: 6 periods)
Used for timing entries and confirming momentum shifts
Momentum Histogram-
Shows the rate of change in buyer/seller control
Weighted by ADX (Average Directional Index) when enabled
Larger bars = stronger momentum
ADX weighting filters out choppy, unreliable signals
Key Zones
Neutral Zone (-0.3 to +0.3): Balanced market, low conviction
Healthy Trend Zone (±0.3 to ±0.7): Clear control without exhaustion
Warning Zone (±0.7 to ±1.0): Extended, approaching exhaustion
Extreme Zone (beyond ±1.0): Overbought/oversold, reversal likely
What To Look For
Reversal Setups:
FCO in extreme zone (beyond ±1.0)
FCO crosses Signal line in opposite direction
Momentum histogram shrinking (weakening pressure)
Interpretation: Buyers or sellers are exhausted and losing control
Trend Strength Setups:
FCO crosses zero line (control shift)
Momentum histogram growing in the same direction
ADX confirms strong trend (no orange background)
Signal line moving in same direction as FCO
Interpretation: New control being established with building momentum
Divergences:
Price makes new high/low but FCO doesn't confirm
Indicates weakening momentum despite price movement
Early warning of potential reversal
Choppy Market Warning:
Orange background (ADX < 20)
Small momentum bars regardless of FCO position
Interpretation: Weak trend, avoid trading or use tight stops
Best Practices:
Use with context: Combine with support/resistance levels (like VWAP) for confluence
Multi-timeframe confirmation: Check higher timeframe FCO for overall bias
Wait for confirmation: Let signals develop rather than predicting turns
Respect extreme zones: Best reversal opportunities occur when FCO is beyond ±1.0
Filter with ADX: Pay attention to background coloring—avoid choppy conditions
The indicator includes comprehensive alert conditions for:
Reversal setups (extreme + cross + weakening momentum)
Trend strength signals (zero cross + growing momentum + strong ADX)
FCO/Signal crossovers
Extreme overbought/oversold conditions
Control shifts (buyers/sellers taking control)

💸 DCA Accumulation Strategy (USD‑Based Scaling)Buy when blue arrow appears, if the next arrow is lower than the last increase your position. This will pull your average cost down slowly over time.
