Wyckoff Schematic - Accumulation [TrendX_]Wyckoff Schematic 1 - Accumulation is an advanced Wyckoff method tool on TradingView, designed to automate the identification of critical phases and price structures within the Wyckoff Accumulation Schematic. By detecting key events such as SC (Selling Climax), AR (Automatic Rally), Spring, and SOS (Sign of Strength), this tool helps traders visualize institutional accumulation patterns, anticipate trend reversals, and identify potential entry points aligned with the Wyckoff model—all without requiring hours of manual monitoring. The indicator dynamically labels key points, draws accumulation zones, and triggers alerts upon phase confirmations, reducing manual analysis and emotional bias.
💎 FEATURES
▶ Phase A: Bottom Identification
Auto-detects Selling Climax (SC), Automatic Rally (AR), and Secondary Test (ST).
Customizable initial trend detection: FTD (Follow-Through Day), Market Structure Shift, Triple MA Crossover, or Ichimoku Cloud.
▶ Phase B: Accumulation Range Formation
Identifies SOS(b) and ST(b) in Phase B
Customizable sweep levels for ST detection: previous SC / ST(a) / Fibonacci retracement levels of AR & SC.
▶ Phase C: Accumulation Confirmation
Flags Spring (false breakdown) and Test (confirmation of false breakdown).
▶ Phase D: Breakout Preparation
Detects SOS and BU/LPS for breakout confirmation.
▶ Visual Tools
Auto-draws accumulation range SC, AR, SOS(b) with real-time extensions.
Labels all critical events (SC, AR, ST, SOS, Spring, LPS) with text and markers.
Draws colored boxes for confirmed phases A, B and C, and triggers alerts for start of Markup with SOS and BU/LPS.
🔎 BREAKOUT
Phase A: Halting the Downtrend
▶ Key Events: SC, AR, ST(a).
▶ Functions:
SC: Marks panic selling, often with high volume.
AR: Sharp rebound after SC, reflecting short-term demand.
ST(a): Retest of SC lows to confirm weakening supply.
▶ Importance:
Phase A signals the end of a downtrend. The SC shows exhaustion, while the AR and ST confirm that sellers are losing control. Customizable trend detection (e.g., Ichimoku Cloud or FTD) ensures alignment with broader market context or your preference.
Phase B: Building the Accumulation Range
▶ Key events: SOS (Pha B), ST (Pha B).
▶ Functions:
SOS(b): A rally breaking above the AR, indicating strong demand.
ST(b): Retests of SC / ST(a) / Fib level to sweep liquidity (trap late sellers).
▶ Importance:
Phase B confirms the sideways range. SOS reflects institutional buying, while ST(b) traps sellers. Sweeping SC / ST(a) / Fib level would help identify false breakdowns.
Phase C: Spring & Test
▶ Key events: Spring (false breakdown), Test (confirmation).
▶ Functions:
Spring: A deliberate drop below Phase B support to eliminate weak traders.
Test: Retest of the Spring low to confirm sustained demand.
▶ Importance:
Phase C is the final "shakeout" to confirm accumulation. The Spring traps weak hands, while the Test validates support, confirming the institution has bought enough, signaling readiness for Markup.
Phase D: Breakout / Start of Markup
▶ Key events: SOS, BU/LPS.
▶ Functions:
SOS: A strong rally breaking above the accumulation range.
BU/LPS: Pullback after SOS to retest the breakout level.
▶ Importance:
Phase D confirms the start of a Markup. SOS shows demand overpowering supply, while BU/LPS offers low-risk entry points.
Accumulation Range & Visual Tools
▶ Accumulation Range: Drawn between SC (low) and AR (high), reflecting institutional buying activity.
▶ Labels/Boxes: Clear labels (SC, AR, ST, SOS, Spring, …) track each phase.
▶ Alerts: Notifies users when SOS or BU/LPS appears.
🛠️ USAGE
▶ Configuration
Phase A: Select trend detection method based on your preference and trading style (FTD, Market Structure, Triple MA, Mây Ichimoku).
Phase B: Adjust sweep levels (SC, ST(a), Fibonacci 61.8% của AR & SC).
▶ Interpretation
Bullish Trend: Confirmed Phase C (Spring + Test) followed by SOS in Phase D.
▶ Trading Strategy
Enter long positions at BU/LPS (Phase D) with volume or momentum confirmation.
Uses other Break-out strategy after SOS appear for Long Entry.
DISCLAIMER
This indicator is not financial advice, it can only help traders make better decisions. There are many factors and uncertainties that can affect the outcome of any endeavor, and no one can guarantee or predict with certainty what will occur. Therefore, one should always exercise caution and judgment when making decisions based on past performance.
Cari skrip untuk "Wyckoff"

Wyckoff Smart Money Pro [MTF]Wyckoff Smart Money Pro detects trading ranges, phases, and events from the Wyckoff method and confirms them with VSA (Volume Spread Analysis), divergence checks, and a composite “smart money” strength index. It generates optional buy/sell signals only when multiple conditions align (phase, VSA, CO strength, effort vs. result, time/volume filters). The dashboard, POC/Value Area, and MTF backdrop help you manage context and risk in real time.
What this indicator does
Wyckoff Smart Money Pro is a multi-timeframe Wyckoff tool that:
⦁ Finds accumulation/distribution ranges and tracks Phases A–E.
⦁ Labels Wyckoff events (PS, SC, AR, ST, Spring/Test, SOS, LPS, UTAD, SOW, LPSY, TS…) and VSA patterns (No Demand/Supply, Stopping Volume, Upthrust, etc.).
⦁ Computes a Composite Operator (CO) Strength score from price/volume behavior to approximate “smart money” bias.
⦁ Adds divergence, effort vs. result, and a volume profile (POC & 70% value area) inside the detected range.
⦁ Provides buy/sell signals only when a configurable confluence is present (events + VSA + CO + EVR + phase + filters).
⦁ Supports MTF context (with a safe HTF resolver and fallbacks) and an Info Dashboard to summarize the current state.
It is designed to make the Wyckoff workflow visual and rules-based without promising results or automating decisions.
How it works (methods & calculations)
1) Range & Phase model
⦁ A sliding lookback searches for a valid range (recent highest high/lowest low), requiring width within 2–10× ATR(14) and a minimum bar count inside the bounds.
⦁ Once a range is active, the script derives Creek/Ice/Mid/Quartiles and classifies bars into Wyckoff Phases A–E using event recency (barssince) and where price sits relative to the range.
⦁ The background color reflects the current Phase; optional MTF events (from the chosen HTF) tint the background lightly for higher-timeframe context.
2) Wyckoff & VSA event engine
⦁ Events include PS, SC, AR, ST, Spring, Test, SOS, LPS, PSY, BC, UTAD, SOW, LPSY, TS, plus minor/multiple variants and Creek/Ice jumps.
⦁ VSA patterns detect No Demand/No Supply, Stopping Volume, Buying/Selling Climax, Upthrust/Pseudo Upthrust, Bag Holding, Shake-Out, Volume Dry-Up, etc., from spread vs. average spread and volume vs. average volume with tunable thresholds.
3) Smart-money (CO) Strength
⦁ CO Strength (0–100) blends: relative volume on up/down bars, professional accumulation/distribution, no-supply/no-demand, stopping volume, Springs/UTADs and Tests, SOS/SOW, price’s position inside the range, and volume-delta vs. its MA.
⦁ Persistent accumCount / distCount counters smooth temporary noise.
4) Divergence & Effort-vs-Result
⦁ Price vs. cum volume-delta divergence highlights weakening pushes.
⦁ EVR flags “High effort / no result” and potential Bullish/Bearish reversals, or “Low effort / high result” moves that are often unsustainable.
5) Volume Profile (inside range)
⦁ A 50-bin profile accumulates volume across the detected range to derive POC, VAH/VAL (70% value area). Lines update as the active range evolves.
6) Multi-Timeframe (MTF) safety
⦁ getHTF() converts your multiplier to a valid Pine timeframe string (e.g., 60, 240, 2D, 1W), and the script falls back to current timeframe values if an HTF request returns na.
⦁ If you enter a Custom HTF, it must be strictly higher than the chart’s timeframe (validated at runtime).
7) Signals & risk model
⦁ Signals are not tied to any single pattern. A buy may require Spring/Test/Shake-out/Creek Jump or SOS plus confirmation (VSA, CO>60, Phase C/D, divergence/EVR context).
⦁ Sell is symmetrical (UTAD/Failed Spring/SOW/Ice Jump + VSA + CO<40 + Phase C/D).
⦁ Minimum confidence is configurable; SL/TP and R:R lines are drawn from range edges or recent bar extremes.
⦁ Filters: trading hours, weekend avoidance, and a minimum volume threshold (relative to average) are available to suppress low-quality contexts.
⦁ Alerts include all major events, divergences, structure/phase changes, and the gated Buy/Sell signals (with a cooldown to reduce alert spam).
Inputs (key ones you’ll actually use)
⦁ Display Settings: toggle ranges, phases, events, VSA, signals, dashboard.
⦁ MTF: Enable HTF, set Multiplier or a Custom HTF (must be higher than current).
⦁ Range Detection: period / min bars / pivot strength.
⦁ VSA: volume sensitivity & climax multiplier.
⦁ Signal Settings: minimum confidence, risk/reward labels.
⦁ Advanced Filters: trading hours, weekend avoidance, and Min Volume Filter (× avg).
⦁ Colors: phase backgrounds, structure colors, and line styling.
How to use (practical flow)
1. Choose a symbol & timeframe you normally analyze (e.g., 5–60m for entries, 4H/D for context).
2. If using MTF, pick a multiplier (e.g., 5×) or a Custom HTF (e.g., 240/4H).
3. Wait for a range to form; watch Phase and CO Strength on the Dashboard.
4. When events (e.g., Spring/Test in Phase C or UTAD in distribution) appear with favorable VSA, CO, EVR, and volume/time filters, consider the signal and review R:R lines.
5. Use POC/VA and Creek/Ice/Mid as structure references; manage risk around the range edge that generated the setup.
On-chart legend (what the letters mean)
Wyckoff events (labels)
⦁ PS Preliminary Support, SC Selling Climax, AR Automatic Rally, ST Secondary Test
⦁ Spring Spring; Test Test of Spring
⦁ SOS Sign of Strength; LPS Last Point of Support
⦁ PSY Preliminary Supply, BC Buying Climax
⦁ UTAD Upthrust After Distribution; SOW Sign of Weakness; LPSY Last Point of Supply
⦁ TS Terminal Shakeout; MS Multiple Spring
⦁ CJ Creek Jump; IJ Ice Jump
⦁ mSOS / mSOW Minor Sign of Strength/Weakness
VSA patterns (tiny labels)
⦁ ND No Demand, NS No Supply, SV Stopping Volume, BC/SC Buying/Selling Climax
⦁ PA/PD Professional Accumulation/Distribution, BH Bag Holding, DU Volume Dry-Up
⦁ SO Shake-Out, TS Test for Supply (VSA test), UT Upthrust, PUT Pseudo Upthrust
Other visuals
⦁ Range box with Creek (upper third), Ice (lower third), Mid, Quartiles
⦁ POC/VAH/VAL: yellow solid (POC), purple dotted (value area)
⦁ VWAP and Dynamic S/R (stepline)
⦁ Green/Red triangles: gated Buy/Sell signals (only if min confidence & filters are met)
⦁ Risk label near the triangle: confidence /10 and R:R
Alerts included
⦁ Core events (Spring/Test/UTAD/SOS/SOW/TS), secondary events (SC/AR/BC/LPS/LPSY), VSA patterns, EVR states, Hidden Accumulation/Distribution, HTF events, Divergences, Phase/Structure changes, and the constrained Buy/Sell signals with a cooldown.
Notes, limits & best practices
⦁ This is not a buy/sell system; it’s a context & confirmation tool. Combine with your plan, risk limits, and execution criteria.
⦁ Long, illiquid, or news-driven bars can distort volume/spread logic; filters help but cannot eliminate this.
⦁ For MTF, if an exchange doesn’t support a specific HTF, the script falls back safely to current TF values to avoid na-propagation.
⦁ Dashboard rows/size/position are user-configurable to keep charts uncluttered.
Changelog (what’s new in this version)
⦁ MTF safety & validation (Custom HTF must be above current; graceful fallbacks for request.security() na results).
⦁ Performance caching for close position & up/down bar flags; drawing cleanup to stay under label/line limits.
⦁ Volume Profile upgraded to 50 bins; VA algorithm adjusted accordingly.
⦁ Signal gating with time/day/volume filters and alert cooldown to reduce noise.
⦁ Bug guards for parameter conflicts (e.g., rangeMinBars cannot exceed rangePeriod).
Disclaimer
This script is for educational and research purposes only and does not constitute financial advice or a recommendation to buy or sell any asset. Market risk is real; always test on a demo and trade at your own discretion.

Wyckoff Trading RangeWyckoff Trading Range Indicator - an indispensable tool for the astute trader. Uniquely capable of identifying and charting Wyckoff trading ranges, this indicator not only accurately pinpoints accumulation and distribution phases but also marks key events, ensuring you never miss significant trading opportunities. Moreover, with the ability to calculate target profits through the Point and Figure (PNF) method, this indicator becomes a powerful assistant, enabling you to make informed, calculated trading decisions. Let the Wyckoff Trading Range Indicator unlock the door to success in your trading world.
⭐️ Wyckoff Price Cycle
According to Wyckoff, the market can be understood and anticipated through detailed analysis of supply and demand, which can be ascertained from studying price action, volume and time. As a broker, he was in a position to observe the activities of highly successful individuals and groups who dominated specific issues; consequently, he was able to decipher, via the use of what he called vertical (bar) and figure (Point and Figure) charts, the future intentions of those large interests. An idealized schematic of how he conceptualized the large interests' preparation for and execution of bull and bear markets is depicted in the figure below. The time to enter long orders is towards the end of the preparation for a price markup or bull market (accumulation of large lines of stock), while the time to initiate short positions is at the end of the preparation for price markdown.
⭐️ FEATURES
- Supply and Demand Zones:
- Wyckoff Schematics and Events.
- Point and Figure (PNF) Target.
* View with PNF chart
⭐️ USAGE S
When it comes to trading using the Wyckoff method, there are five key points to consider for entering trades, as illustrated below
Point #1: Trade in the direction of the previous trend (Phase B)
Point #2: Trade against the previous trend. (Phase B)
Point #3: Identify the point of strength that forms a new trend. (Phase C)
Point #4: Confirm the new trend. (Phase D)
Point #5: Ensure that prices move in the correct direction and do not revert within the Trading Range (dont break LPS/LPSY). (Phase E)
⭐️ NOTES :
- Use the 1 minute or 5 minute timeframe to view the bias dashboard. Using a timeframe longer than 5 minute may provide an inaccurate bias view.
- The alert new TR function will give you alert 6 timeframe on dashboard with only one setup. The best timeframe to set up an alert is 2 hours.

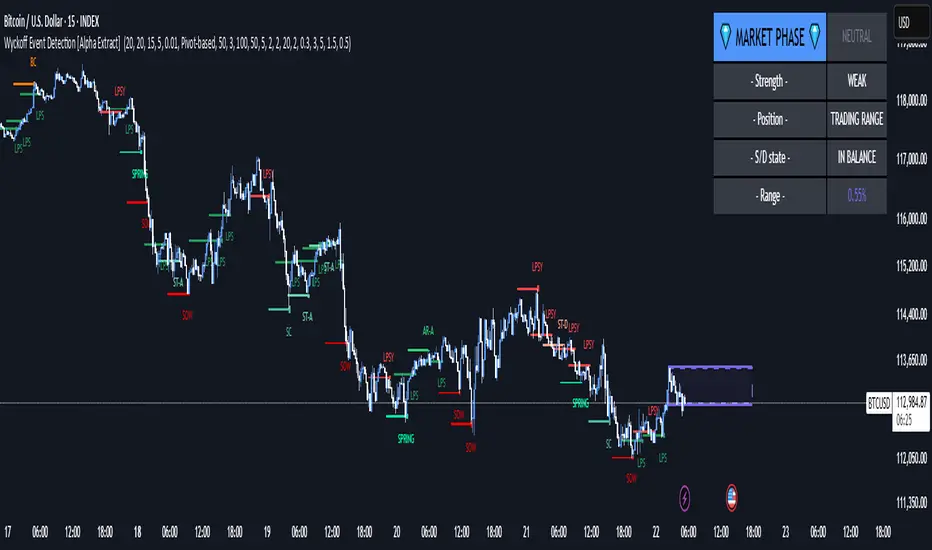
Wyckoff Event Detection [Alpha Extract]Wyckoff Event Detection
A powerful and intelligent indicator designed to detect key Wyckoff events in real time, helping traders analyze market structure and anticipate potential trend shifts. Using volume and price action, this script automatically identifies distribution and accumulation phases, providing traders with valuable insights into market behavior.
🔶 Phase-Based Detection
Utilizes a phase detection algorithm that evaluates price and volume conditions to identify accumulation (bullish) and distribution (bearish) events. This method ensures the script effectively captures major market turning points and avoids noise.
🔶 Multi-Factor Event Recognition
Incorporates multiple event conditions, including upthrusts, selling climaxes, and springs, to detect high-probability entry and exit points. Each event is filtered through customizable sensitivity settings, ensuring precise detection aligned with different trading styles.
🔶 Customizable Parameters
Fine-tune event detection with adjustable thresholds for volume, price movement, trend strength, and event spacing. These inputs allow traders to personalize the script to match their strategy and risk tolerance.
// === USER INPUTS ===
i_volLen = input.int(20, "Volume MA Length", minval=1)
i_priceLookback = input.int(20, "Price Pattern Lookback", minval=5)
i_lineLength = input.int(15, "Line Length", minval=5)
i_labelSpacing = input.int(5, "Minimum Label Spacing (bars)", minval=1, maxval=20)
❓How It Works
🔶 Event Identification
The script scans for key Wyckoff events by analyzing volume spikes, price deviations, and trend shifts within a user-defined lookback period. It categorizes events into bullish (accumulation) or bearish (distribution) structures and plots them directly on the chart.
// === EVENT DETECTION ===
volMA = ta.sma(volume, i_volLen)
highestHigh = ta.highest(high, i_priceLookback)
lowestLow = ta.lowest(low, i_priceLookback)
🔶 Automatic Filtering & Cleanup
Unconfirmed or weak signals are filtered out using customizable strength multipliers and volume thresholds. Events that do not meet the minimum conditions are discarded to keep the chart clean and informative.
🔶 Phase Strength Analysis
The script continuously tracks bullish and bearish event counts to determine whether the market is currently in an accumulation, distribution, or neutral phase. This allows traders to align their strategies accordingly.
🔶 Visual Alerts & Labels
Detects and labels key Wyckoff events directly on the chart, providing immediate insights into market conditions:
- PSY (Preliminary Supply) and UT (Upthrust) for distribution phases.
- PS (Preliminary Support) and SC (Selling Climax) for accumulation phases.
- Labels adjust dynamically to avoid chart clutter and improve readability.
🔶 Entry & Exit Optimization
By highlighting supply and demand imbalances, the script assists traders in identifying optimal entry and exit points. Wyckoff concepts such as springs and upthrusts provide clear trade signals based on market structure.
🔶 Trend Confirmation & Risk Management
Observing how price reacts to detected events helps confirm trend direction and potential reversals. Traders can place stop-loss and take-profit levels based on Wyckoff phase analysis, ensuring strategic trade execution.
🔶 Table-Based Market Analysis (Table)
A built-in table summarizes:
- Market Phase: Accumulation, Distribution, or Neutral.
- Strength of Phase: Weak, Moderate, or Strong.
- Price Positioning: Whether price is near support, resistance, or in a trading range.
- Supply/Demand State: Identifies whether the market is supply or demand dominant.
🔶 Why Choose Wyckoff Market Phases - Alpha Extract?
This indicator offers a systematic approach to understanding market mechanics through the lens of Wyckoff's time-tested principles. By providing clear and actionable insights into market phases, it empowers traders to make informed decisions, enhancing both confidence and performance in various trading environments.
Wyckoff Volume, Wyckoff Trend Tracking Trading SystemWyckoff Volume by Wyckoff Trend Tracking Trading System

Wyckoff Volume on Price, Wyckoff Trend Tracking Trading SystemWyckoff Volume on Price by Wyckoff Trend Tracking Trading System

Wyckoff Trend Following, Wyckoff Trend Tracking Trading SystemWyckoff Trend Following by Wyckoff Trend Tracking Trading System

Wyckoff Trend Following, Wyckoff Trend Tracking Trading SystemWyckoff Trend Following by Wyckoff Trend Tracking Trading System

Wyckoff Volume, Wyckoff Trend Tracking Trading SystemWyckoff Volume by Wyckoff Trend Tracking Trading System

Wyckoff Volume on Price, Wyckoff Trend Tracking Trading SystemWyckoff Volume on Price by Wyckoff Trend Tracking Trading System

Wyckoff Springs [QuantVue]The Wyckoff Springs indicator is designed to identify potential bullish reversal patterns known as "springs" in the Wyckoff Method. A Wyckoff spring occurs when the price temporarily dips below a support level, then quickly rebounds, suggesting a false breakdown and a
potential buying opportunity.
How it works:
Pivot detection:
The indicator identifies pivot lows based on the specified pivot length.
These pivot points are stored and analyzed for potential spring patterns.
Volume and Range Checks:
If volume confirmation is enabled, the indicator checks if the current volume exceeds a threshold based on the average volume over the specified period.
The indicator ensures that the price undercuts the defined trading range before confirming a spring pattern.
Spring Identification
The indicator checks for price conditions indicative of a Wyckoff spring: a temporary dip below a pivot low followed by a close above it. The recovery must take place within 3 bars.
If these conditions are met, a spring label is placed below the bar.
Features:
Pivot Length:
The user can set the pivot length to match any style of trading.
Volume Confirmation:
An optional feature where the user can specify if volume confirmation is required for a spring signal.
Volume threshold can be set to determine what constitutes significant volume compared to the average volume over a specified period. By default it is set to 1.5
How to Trade a Spring:
Give this indicator a BOOST and COMMENT your thoughts below!
We hope you enjoy.
Cheers!

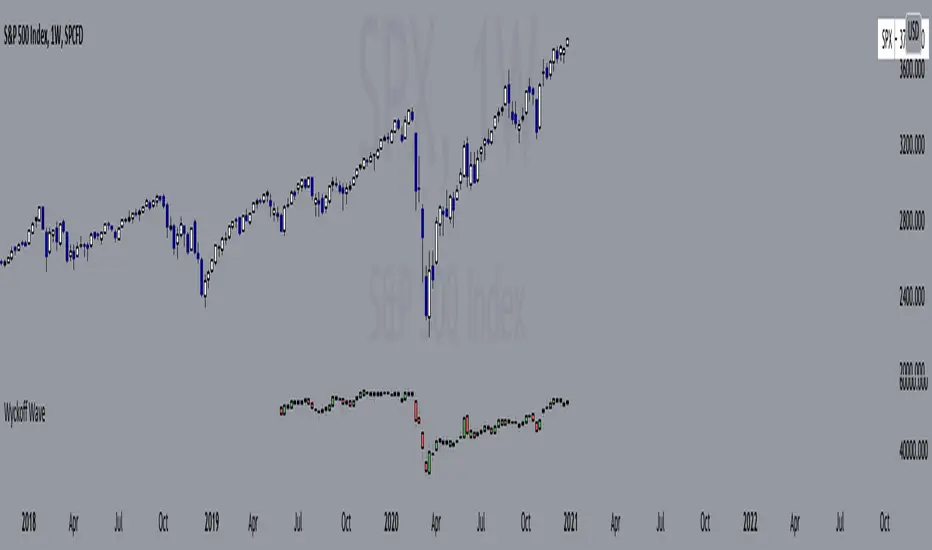
Wyckoff Wave"The Wyckoff Wave is a weighted index consisting of 12 stocks that are leaders in their perspective industries. It was introduced by the Stock Market Institute in 1931.
Made up of leaders in the important stock groups, the Wyckoff Wave represents the core of the American industrial complex.
The Wyckoff Wave has been a market indicator for Wyckoff students for over 50 years. While the stocks comprising the Wyckoff Wave have changed over time, it continues to be a sensitive leading market indicator. The Wyckoff Wave has consistently identified market trends.
The Wyckoff Wave is extremely helpful in predicting the stock market’s timing and the direction of the next market move.
The Wyckoff Wave is analyzed in five minute intervals and individual up and down iintra-day waves are created.
These individual waves, which include the price action and volume during those brief up and down market swings, also provide the data for other important Wyckoff Stock Market Institute indicators, including the Optimism-Pessimism volume index and the Trend Barometer.
These 12 stocks that make up the Wyckoff Wave. They are listed, along with their multipliers, below."
Wave Stock / Multiplier
AT&T / 79
Bank of America / 50
Boeing / 39
Bristol Myers / 119
Caterpillar / 35
DowDuPont / 72
Exxon Mobile / 32
IBM / 21
General Electric / 90
Ford / 25
Union Pacific / 60
WalMart / 43
In 2019, DowDuPont split into three companies: Dow, DuPont, and Corteva. Because TV limits the number of securities in a script to 40, only Dow and DuPont are factored into the Wave calculation (higher market caps than Corteva) with a multiplier of 36 each.
Wyckoff Effort vs. Result📌 Wyckoff Effort vs. Result (E/R) – Visualizing Supply & Demand Imbalance with Volume Confirmation
📖 Overview
The Wyckoff Effort vs. Result (E/R) indicator is designed to help traders interpret market behavior through the lens of volume vs. price movement — a foundational concept in Richard Wyckoff’s methodology.
This tool aims to highlight moments where the “effort” (volume) is not in proportion to the “result” (price movement) — giving insight into potential accumulation or distribution events.
By detecting high-volume candles and classifying them based on their price direction, the indicator visualizes zones where smart money might be active .
⚙️ How It Works
1. Effort Accumulation (High Volume Down Bar):
• When a candle closes lower than it opens (down bar) and has above-average volume , it’s marked as potential absorption of selling pressure (effort to push down met by buying).
• These candles are colored red and the open level is plotted, acting as a potential support or re-test zone.
2. Effort Distribution (High Volume Up Bar):
• When a candle closes higher than it opens (up bar) and has above-average volume , it’s marked as potential distribution (effort to push up absorbed by sellers).
• These candles are colored green and the open level is plotted , acting as a potential resistance or rejection zone.
3. Average Volume Calculation:
• The script calculates a simple moving average (SMA) of volume over a user-defined lookback period.
• If current volume exceeds the average multiplied by a set threshold, it’s treated as a high-effort bar .
🧪 Inputs
Input Description
Average Volume Lookback - Number of bars used to calculate the volume average
High Volume Multiplier. - Multiplier to define what qualifies as “high volume”
🖥️ Visual Output
• 🔴 Red candles = High volume on a down bar → possible accumulation
• 🟢 Green candles = High volume on an up bar → possible distribution
• 📉 Horizontal lines at bar open price mark the potential zones where effort occurred
These zones can serve as:
• Areas of support/resistance
• Trap zones where smart money absorbs liquidity
• Entry/exit filters when combined with price action
🧠 How to Use
• Use in combination with price structure, support/resistance, and volume profile tools
• Watch how price reacts when it revisits the plotted lines
• Look for effort bars that fail to lead to continuation, signaling potential reversal
• Can be used in scalping, swing trading, or Wyckoff-style phase analysis
🔒 Technical Notes
• ✅ Does not repaint
• ✅ Built with Pine Script v6
• ✅ Lightweight and customizable
• ❌ Does not generate buy/sell signals — it provides context, not predictions

Wyckoff Historical VolatilityHi all this is a Historical volatility script that someone on youtube posted, his channel is Trade With Trend he is a very good trader, this script is mainly designed to work with the wyckoff method, im unsure if it works for any other trading style, this was designed mainly for swing trading if you do work with wyckoff method you should try it and check his video on his channel called: How To Use Wyckoff Trading Method For Price Action Trading - Swing Trading Strategies 🔥🔥
---i only compiled this--- for people that had no clue how to find it or how to do it just like i had a few hours ago i don't think anyone will use this but if you are searching for it feel free to use it.

Wyckoff Phases OscillatorThe "Wyckoff Phases Oscillator" is a script designed for the TradingView platform. It's an indicator that provides traders with an oscillator-based visual representation of the Wyckoff Market Cycle. The oscillator doesn't overlay the price chart but instead appears in a separate panel beneath it.
How it works:
The script operates based on two input parameters: length and timeFrame. The length parameter, set by default to 21, determines the period used for various calculations within the script. On the other hand, timeFrame, set by default to "1", specifies the timeframe for which the script will gather and analyze data.
The script requests security information such as closing prices (higherClose), volume (higherVolume), highest prices (higherHigh), and lowest prices (higherLow) from the ticker symbol (syminfo.tickerid) within the defined timeframe.
Two exponential moving averages (ema1 and ema2) are calculated based on the closing prices, with lengths of 5 and 9 respectively.
A Rate of Change (ROC) is calculated based on the closing prices and the defined length.
An average volume (avgVolume) is calculated using a simple moving average (SMA) based on the volume and the defined length.
The script defines conditions for institutional buying and selling.
Institutional buying is determined when the closing price is greater than the lowest price and the volume is greater than the average volume.
Institutional selling is determined when the closing price is less than the highest price and the volume is greater than the average volume.
The script also defines conditions for the four phases of the Wyckoff Market Cycle: Accumulation, Markup, Distribution, and Markdown. Each phase has specific conditions based on the closing prices, EMA values, ROC, and institutional buying or selling conditions.
The script then assigns oscillator values based on the Wyckoff phase:
Accumulation is assigned a value of 1
Markup is assigned a value of 2
Distribution is assigned a value of 3
Markdown is assigned a value of 4
These oscillator values are plotted as colored circles, with different colors representing different phases. The color values are specified in RGB format.
Finally, the script plots horizontal lines as references for each of the four phases using the hline function. These lines are labeled and color-coded to match the corresponding oscillator circles. The lines have a linewidth of 1 and are solid in style.
If the oscillator moves from level 1 (Accumulation) to level 2 (Markup), this could indicate a potential bullish trend, as the market moves from a phase of accumulation to a phase of increasing prices.
Conversely, if the oscillator moves from level 3 (Distribution) to level 4 (Markdown), this could signal a potential bearish trend, signaling that the market has moved from a phase of distribution to a phase of declining prices.
While the Wyckoff Phases Oscillator can provide valuable insights on its own, it can also be used in conjunction with other technical analysis tools and indicators. For example, you might use it alongside a volume indicator to confirm signals, or with support and resistance levels to identify potential entry and exit points.


[AlbaTherium] Wabi-Sabi Wyckoff Flow Structure Map MTF[1.0.42] Wabi-Sabi Wyckoff Flow Structure Map
Master the Hidden Geometry of Market Campaigns – Accumulation, Distribution, and the Laws That Govern Them
Introduction
The Wabi-Sabi Wyckoff Flow Structure Map is a software-engineered analytical framework that visualizes the flow of institutional market behavior through the lens of the Wyckoff Method. This tool automates the detection of trading ranges, maps the phases of accumulation/distribution, and extrapolates price objectives .
The Wabi-Sabi Wyckoff Flow Structure Map is a meticulous implementation of the principles of Richard D. Wyckoff , interpreted through the lens of market structure and volume dynamics. This tool aims to identify, contextualize, and map out accumulation and distribution zones by interpreting the composite operator's intended path in financial markets.
It is not merely an indicator-it is a structural compass, guiding you through the architecture of smart money campaigns.
Chapter 1: The Architecture of Market Campaigns
1.1 From Noise to Narrative
Markets do not move randomly. They are orchestrated campaigns-methodically executed by informed operators. The identifies these campaigns as they unfold across:
Accumulation
Markup
Distribution
Markdown
Each is grounded in Wyckoff’s structural logic and revealed in real time.
1.2 Who Is the Composite Operator, Composite Man?
The Composite Operator (CO), Composite Man (CM) represents dominant market participants-institutions with the capacity to engineer price movement. By dissecting trading ranges, the script deciphers their behavior through:
Event-based mapping (SC, ST, Spring, AR, UTAD, etc.)
Phase progression (Phase A to E)
PnF-based directional forecasting
The CO leaves footprints. This script reads them.
Chapter 2: Wyckoff’s Core Laws, Brought to Life
2.1 The Law of Supply and Demand
Every price bar reflects this law. The tool highlights where supply is absorbed and demand emerges, revealing the true balance of power behind the chart.
2.2 The Law of Cause and Effect
Accumulation and distribution ranges are not noise-they are preparation. By measuring their width, the script calculates PnF-based targets for the post-breakout phase, offering traders quantified projections rooted in structure.
2.3 The Law of Effort vs. Result
Effort = volume.
Result = price movement.
Discrepancies between the two-expose market turning points.
This script captures those moments within Wyckoff's structural context, not isolated volume spikes.
Chapter 3: Real-Time Interpretation of Trading Ranges
3.1 Automatic Schematic Mapping
The tool auto-generates Wyckoff structures:
Detects and maps Trading Ranges dynamically
Labels Wyckoff events (SC, ST, AR, Spring, UT, LPS, etc.)
Identifies current phase (Phase B, C, D, E) via real-time bias detection
3.1.1.Core Components
a. Structural Framing
The script autonomously detects the boundaries of a trading range (TR), guided by pivot highs and lows derived from Volume Spread Analysis (VSA) dynamics and price behavior.
b. Automatic Rally (AR) & Selling Climax (SC)
These foundational events are systematically computed and highlighted using volume-weighted price interaction. The Selling Climax defines the lower bound of the TR, while the Automatic Rally sets the resistance zone.
c. Secondary Tests (ST)
The algorithm traces the STs to validate demand/supply balance and the structural integrity of the TR. These are tagged with precision to avoid false positives.
d. Spring / Upthrust Actions
Wyckoffian springs and upthrusts are flagged using deviations below support (spring) or above resistance (upthrust) coupled with volume exhaustion or climax events.
e. Creek & Ice Visualization
Inspired by Wyckoff’s narrative metaphor, the script maps the 'Creek' (High of the Range flow) and 'Ice' (Low of the Range flow), guiding the observer through breakout or breakdown conditions.
f. Sign of Strength (SOS) / Sign of Weakness (SOW)
These turning points are confirmed via expansion in spread and volume. SOS is a bullish confirmation of accumulation resolution, while SOW indicates bearish continuation.
g. LPS & LPSY
The Last Point of Support (LPS) and Last Point of Supply (LPSY) are precisely mapped post-confirmation of breakout or breakdown. Their presence strengthens the bias of the ongoing structural phase.
h. Phase Annotation
Each zone within the TR is annotated based on Wyckoff’s five-phase logic (A to E). This includes climactic action in Phase A, testing in Phase B, spring/UTAD in Phase C, confirmation in Phase D, and exit in Phase E.
3.2 Multi-Timeframe Tracking
Observe the interplay of nested structures across several timeframes. Whether you’re tracking a micro accumulation on 1-min or macro distribution on the 1H, the script integrates both for a full-spectrum view.
3.3 Point-and-Figure Price Targeting
Using Wyckoff’s Law of Cause and Effect, the tool projects price targets based on the range width. Outputs are displayed directly on the chart, aiding in:
Profit-taking zones
Invalidations
R/R planning with structure-based confidence
Chapter 4: Applying Like a Wyckoffian
4.1 Configuration Best Practices
Timeframes: 1–5min for tactical intraday, 15min–4H for swing campaigns
Detection Radius: Control how deep the script searches for structural pivots
Modes: Choose between Delta (volume shifts) and Normal (price formations)
4.2 Dashboard & Event Tracker
The Bias Dashboard displays:
The current dominant phase (e.g. “Phase C Test” or “Late Phase D”)
Key events (AR, ST, Spring, LPS)
Whether current price action supports a continuation or Climax
4.3 Alerts and Customization
Configure alerts to monitor:
New TR detection across up to 6 timeframes
Key structural events like Spring, UTAD, or SOS
Completion of cause zones with target projection triggered
Chapter 5: Use Cases and Strategic Implementation
5.1 Spotting Reversals Before the Breakout
Use the script to:
Enter near Springs (accumulation) or UTADs (distribution)
Identify retests as Last Points of Support/Resistance
Confirm or invalidate breakout attempts using the schematic context
5.2 Confirming Institutional Engagement
Recognize institutional footprints through:
Multiple STs (Testing for supply)
Strong SOS, SOW / LPS combinations
Absence of follow-through = Absorption
The Flow Map helps distinguish retail chase from professional intent.
Conclusion
The Wabi-Sabi Wyckoff Flow Structure Map is an elite market structure decoder for traders who operate on logic, not emotion. Grounded in Wyckoff’s time-tested methodology and enhanced with modern automation, it transforms the invisible structure of price action into a readable, tradeable roadmap.
“Structure precedes movement. Those who read structure, anticipate motion. Those who chase motion, miss the meaning .
”
- A Wyckoffian Principle
This tool is for traders who understand that preparation is where profits are born-not during the move, but before it."

J1 - Wyckoff SchematicsMy approach to Wyckoff In A Box
The main idea of this script is purely an overlay of the Wyckoff schematics (Accumulation/Distribution) on top of your chart, which can help you to analyse trends or potential future market structures.
Setup
The Setup is quite easy. Once you open the script for the first time it will ask you to click on the specific side to create your box that will plot your schematic inside, Make sure you read them to avoid confusion .
Once you have your Measurement Box is created, click on the bar located at the Right side of the measurement box, this will allow you to extend or contract the overlay. You can change all of the settings after this.
* You can adjust each section (left, right and center) of each phase to your liking.
* You can adjust the styling
* This is not an indicator/oscillator for Buy/Sell signals
Notes of first release:
* I have left the empty spaces for the next schematics (it takes time and patience).
* Still working on a healthier way to resize the overlay
Ideas and suggestions more than welcome :)

Auto Wyckoff Schematic [by DanielM]This indicator is designed to automatically detect essential components of Wyckoff schematics. This tool aims to capture the critical phases of liquidity transfer from weak to strong hands, occurring before a trend reversal. While the Wyckoff method is a comprehensive and a very nuanced approach, every Wyckoff schematic is unique, making it impractical to implement all its components without undermining the detection of the pattern. Consequently, this script focuses on the essential elements critical to identifying these schematics effectively.
Key Features:
Swing Detection Sensitivity:
The sensitivity of swing detection is adjustable through the input parameter. This parameter controls the number of past bars analyzed to determine swing highs and lows, allowing users to fine-tune detection based on market volatility and timeframes.
Pattern Detection Logic:
Accumulation Schematic:
Detects consecutive lower swing lows, representing phases like Selling Climax (SC) and Spring, which often precede a trend reversal upward. After the final low is identified, a higher high is detected to confirm the upward trend initiation.
Labeled Key Points:
SC: Selling Climax, marking the beginning of the accumulation zone.
ST: Secondary Test during the schematic.
ST(b): Secondary Test in phase B.
Spring: The lowest point in the schematic, signaling a final liquidity grab.
SOS: Sign of Strength, confirming a bullish breakout.
The schematic is outlined visually with a rectangle to highlight the price range.
Distribution Schematic:
Detects consecutive higher swing highs, which indicate phases such as Buying Climax (BC) and UTAD, often leading to a bearish reversal. After the final high, a lower low is detected to confirm the downward trend initiation.
Labeled Key Points:
BC: Buying Climax, marking the beginning of the distribution zone.
ST: Secondary Test during the schematic.
UT: Upthrust.
UTAD: Upthrust After Distribution, signaling the final upward liquidity grab before a bearish trend.
SOW: Sign of Weakness, confirming a bearish breakout.
The schematic is visually outlined with a rectangle to highlight the price range.
Notes:
Simplification for Practicality: Due to the inherent complexity and variability of Wyckoff schematics, the indicator focuses only on the most essential features—liquidity transfer and key reversal signals.
Limitations: The tool does not account for all components of Wyckoff's method (e.g., minor phases or nuanced volume analysis) to maintain clarity and usability.
Unique Behavior: Every Wyckoff schematic is different, and this tool is designed to provide a simplified, generalized approach to detecting these unique patterns.

NY 4H Wyckoff State Machine [CHE] NY 4H Wyckoff State Machine — Full (Re-Entry, Breakout, Wick, Re-Accum/Distrib, Dynamic Table) — One-Candle Wyckoff Re-Entry (OCWR)
Summary
OCWR operationalizes a one-candle session workflow: mark the first four-hour New York candle, fix its high and low as the session range when the window closes, and drive entries through a Wyckoff-style state machine on intraday bars. The script adds an ATR-scaled buffer around the range and requires multi-bar acceptance before treating breaks or re-entries as valid. Optional wick-cluster evidence, a proximity retest, and simple volume or RSI gates increase selectivity. Background tints expose regimes, shapes mark events, a dynamic table explains the current state, and hidden plots supply alert payloads. The design reduces random flips and makes state transitions auditable without higher-timeframe calls.
Origin and name
Method name: One-Candle Wyckoff Re-Entry (OCWR)
Transcript origin: The source idea is a “stupid simple one-candle scalping” routine: mark the first New York four-hour candle (commonly between one and five in the morning New York time), drop to five minutes, observe accumulation inside, wait for a manipulation move outside, then trade the re-entry back inside. Stops go beyond the excursion extreme; targets are either a fixed reward multiple or the opposite side of the range. Preference is given to several manipulation candles. This indicator codifies that workflow with explicit states, acceptance counters, buffers, and optional quality filters. Any external performance claims are not part of the code.
Motivation: Why this design?
Session levels are widely respected, yet single-bar breaches around them are noisy. OCWR separates range discovery from trade logic. It locks the range at the end of the window, applies an ATR-scaled buffer to ignore marginal oversteps, and requires acceptance over several bars for breaks and re-entries. Wick evidence and optional retest proximity help confirm that an excursion likely cleared liquidity rather than launched a trend. This yields cleaner transitions from test to commitment.
What’s different vs. standard approaches?
Baseline: Static session lines or one-shot Wyckoff tags without process control.
Architecture: Dual long and short state machines; ATR-buffered edges; multi-bar acceptance for breaks and re-entries; optional wick dominance and cluster checks; optional retest tolerance; direct and opposite breakout paths; cooldown after fires; distribution timeout; dynamic table with highlighted row.
Practical effect: Fewer single-bar head-fakes, clearer hand-offs, and on-chart explanations of the machine’s view.
Wyckoff structure by example — OCWR on five minutes
One-candle setup:
On the four-hour chart, mark the first New York candle’s high and low, then switch to five minutes. Solid lines show the fixed range; dashed lines show ATR-buffered edges.
Long path (verbal mapping):
Phase A, Stopping Action: Price stabilizes inside the range.
Phase B, Consolidation: Sustained balance while the window is closed and after the range is fixed.
Phase C, Test (Spring): Excursion below the buffered low with preference for several outside bars and dominant lower wicks, then a return inside.
Re-entry acceptance: A required run of inside bars validates the test.
Phase D, Breakout to Markup: Long signal fires; stop beyond the excursion extreme; objective is the opposite range or a fixed reward multiple.
Phase E, Trend (Markup) and Re-Accumulation: Advance continues until target, stop, confirmation back against the box, or timeout. A pause inside trend may register as re-accumulation.
Short path mirrors the above: A UTAD-style move forms above the buffered high, then re-entry leads to Markdown and possible re-distribution.
Variant map (verbal):
Accumulation after a downtrend: with Spring and Test, or without Spring; both proceed to Markup and may pause in Re-Accumulation.
Distribution after an uptrend: with UTAD and Test, or without UTAD; both proceed to Markdown and may pause in Re-Distribution.
Note: Phases A through E occur within each variant and are not separate variants.
How it works (technical)
Session window: A configurable four-hour New York window records its high and low. At window end, the bounds are fixed for the session.
ATR buffer: A margin above and below the fixed range discourages triggers from tiny oversteps.
Inside and outside: Users choose close-based or wick-based detection. Overshoot requirements are expressed verbally as a fraction of the range with an optional absolute minimum.
Manipulation tracking: The machine counts bars spent outside and records the side extreme.
Re-entry acceptance: After a return inside, a specified number of inside bars must print before acceptance.
Direct and opposite breakouts: Direct breakouts from accumulation and opposite breakouts after manipulation are supported, subject to acceptance and optional filters.
Targets and exits: Choose the opposite boundary or a fixed reward multiple. Distribution ends on target, stop, confirmation back against the range, or timeout.
Context filters (optional): Volume above a scaled SMA, RSI thresholds, and a trend SMA for simple regime context.
Diagnostics: Background tints for regimes; arrows for re-entries; triangles for breakouts; table with row highlights; hidden plots for alert values.
Central table (Wyckoff console)
The table sits top-right and explains the machine’s stance. Columns: Structure label, plain-English description, active state pair for long and short, and human phase tags. Rows: Start and range building; accumulation branch with Spring and Test as well as direct breakout; Markup and re-accumulation; distribution branch with UTAD and Test as well as direct short breakout; Markdown and re-distribution. Only the active state cell is rewritten each last bar, for example “L_ACCUM slash S_ACCUM”. Row highlighting is context-aware: accumulation, Spring or UTAD, breakout, Markup or Markdown, and re-accumulation or re-distribution checks can highlight independently so users see simultaneous conditions. The table is created once, updated only on the last bar for efficiency, and functions as a read-only console to audit why a signal fired and where the path currently sits.
Parameter Guide
Session window and time zone: First four hours of New York by default; time zone “America/New_York”.
ATR length and buffer factor: Control buffer size; larger reduces sensitivity, smaller reacts faster.
Minimum overshoot (fraction and absolute): Demand meaningful extension beyond the buffer.
Break mode: Close-based is stricter; wick-based is more reactive.
Acceptance counts: Separate counts for break, re-entry, and opposite breakout; higher values reduce noise.
Minimum bars outside: Ensures manipulation is not a single spike.
Wick detection and clusters (optional): Dominance thresholds and cluster size within a short window.
Retest required and tolerance (optional): Gate re-entry by proximity to the buffered edge.
Volume and RSI filters (optional): Simple gates on activity and momentum.
TP mode and reward multiple: Opposite range or fixed multiple.
Cooldown and distribution timeout: Rate-limit signals and prevent endless distribution.
Visualization toggles: Background phases, labels, table, and helper lines.
Reading & Interpretation
Solid lines are the fixed session bounds; dashed lines are buffers. Backgrounds tint accumulation, manipulation, and distribution. Arrows show accepted re-entries; triangles show direct or opposite breakouts. Labels can summarize entry, stop, target, and risk. The table highlights the active row and the current state pair.
Practical Workflows & Combinations
OCWR baseline: Each morning, mark the New York four-hour candle, move to five minutes, prefer multi-bar manipulation outside, then wait for a qualified re-entry inside. Stop beyond the excursion extreme. Target the opposite range for conservative management or a fixed multiple for uniform sizing.
Trend following: Favor direct breakouts with trend alignment and no contradictory wick evidence.
Quality control: When noise rises, increase acceptance, raise the buffer factor, enable retest, and require wick clusters.
Discretionary confluences: Fair-value gaps and trend lines can be added by the user; they are not computed by this script.
Behavior, Constraints & Performance
Closed-bar confirmation is recommended when you require finality; live-bar conditions can change until close. The script does not call higher-timeframe data. It uses arrays, lines, labels, boxes, and a table; maximum bars back is five thousand; table updates are last-bar only. Known limits include compressed buffers in quiet sessions, unreliable wick evidence in thin markets, and session misalignment if the platform time zone is not New York.
Sensible Defaults & Quick Tuning
Start with ATR length fourteen, buffer factor near zero point fifteen, overshoot fraction near zero point ten, acceptance counts of two, minimum outside duration three, retest required on.
Too many flips: increase acceptance, raise buffer, enable retest, and tighten wick thresholds.
Too slow: reduce acceptance, lower buffer, switch to wick-based breaks, disable retest.
Noisy wicks: increase minimum wick ratio and cluster size, or disable wick detection.
What this indicator is—and isn’t
A session-anchored visualization and signal layer that formalizes a Wyckoff-style re-entry and breakout workflow derived from a single four-hour New York candle. It is not predictive and not a complete trading system. Use with structure analysis, risk controls, and position management.
Disclaimer
The content provided, including all code and materials, is strictly for educational and informational purposes only. It is not intended as, and should not be interpreted as, financial advice, a recommendation to buy or sell any financial instrument, or an offer of any financial product or service. All strategies, tools, and examples discussed are provided for illustrative purposes to demonstrate coding techniques and the functionality of Pine Script within a trading context.
Any results from strategies or tools provided are hypothetical, and past performance is not indicative of future results. Trading and investing involve high risk, including the potential loss of principal, and may not be suitable for all individuals. Before making any trading decisions, please consult with a qualified financial professional to understand the risks involved.
By using this script, you acknowledge and agree that any trading decisions are made solely at your discretion and risk.
Do not use this indicator on Heikin-Ashi, Renko, Kagi, Point-and-Figure, or Range charts, as these chart types can produce unrealistic results for signal markers and alerts.
Best regards and happy trading
Chervolino

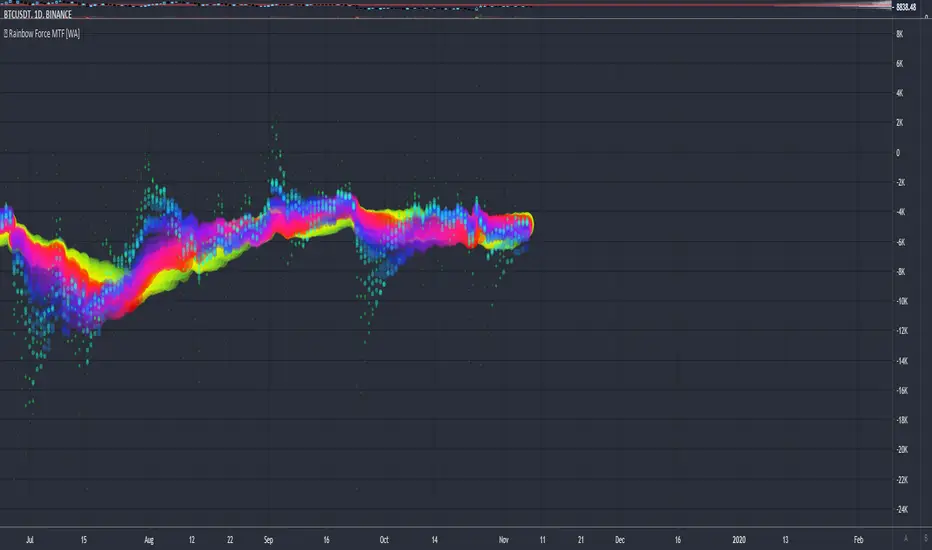
Rainbow Force - Multi Timeframe [WYCKOFF ARSENAL]🌈 Rainbow Force - Multi Timeframe WYCKOFF ARSENAL
The purpose of the Force is to provide an indication of the pressure being applied to push the market lower or the pull being applied to the market to pull it higher.
The Rainbow Force can be used on any available timeframes and assets with volume data .
It is a combination of Force instances of different lengths that are plotted on the same chart.
The confluence zones can hint at a price reversal and help estimate the trend strength.
The Rainbow Force can be combined with other technical analysis tools as a trend-following indicator.
When the trend is strong and the other indicators used to determine entry points send a bullish or a bearish signal, a position can be opened.
When the trend is weak, opening new positions should not be to consider.
The Rainbow Force can also be used on its own. The angles of the Rainbow will hint at the trend strength.
The steeper the curve, the stronger the trend. The flatter the curve, the weaker the trend.
A Buy position can be opened in the beginning of a strong positive trend .
A Sell position can be opened in the beginning of a strong negative trend .
During a strong trend, short-lived retracements can be found, and it is possible to enter a position in the direction of the general trend against the retracement.
The Rainbow mode can be experienced with the Multi RSI indicator as well.
Related tools :
▪ Optimism Pessimism
▪ Force
- 🌈 Rainbow Force ◄
▪ Technometer
- 🌈 Rainbow Technometer
▪ Momentum
- 🌈 Rainbow Momentum
▪ Market Screener
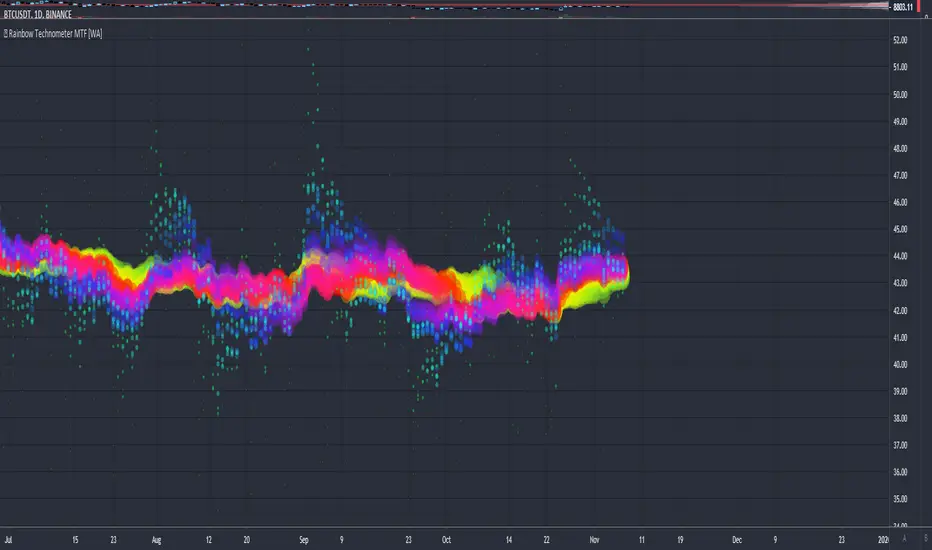
Rainbow Technometer - Multi Timeframe [WYCKOFF ARSENAL]🌈 Rainbow Technometer - Multi Timeframe WYCKOFF ARSENAL
The purpose of the Technometer is to provide a mathematical indication of the degree to which the market is overbought or oversold .
The value of the Technometer could be as high as 100 or as low as 0. The other possible values would represent degrees of overbought or oversold.
In Rainbow form, the Technometer could also be used as a trend-following indicator.
The Rainbow Technometer can be used on any available timeframes and assets with volume data .
It is a combination of Technometer instances of different lengths that are plotted on the same chart.
The confluence zones can hint at a price reversal and help estimate the trend strength.
The Rainbow Technometer can be combined with other technical analysis tools as a trend-following indicator.
When the trend is strong and the other indicators used to determine entry points send a bullish or a bearish signal, a position can be opened.
When the trend is weak, opening new positions should not be to consider.
The Rainbow Technometer can also be used on its own. The angles of the Rainbow will hint at the trend strength.
The steeper the curve, the stronger the trend. The flatter the curve, the weaker the trend.
A Buy position can be opened in the beginning of a strong positive trend .
A Sell position can be opened in the beginning of a strong negative trend .
During a strong trend, short-lived retracements can be found, and it is possible to enter a position in the direction of the general trend against the retracement.
The Rainbow mode can be experienced with the Multi RSI indicator as well.
Related tools :
▪ Optimism Pessimism
▪ Force
- 🌈 Rainbow Force
▪ Technometer
- 🌈 Rainbow Technometer ◄
▪ Momentum
- 🌈 Rainbow Momentum
▪ Market Screener
Rainbow Momentum - Multi Timeframe [WYCKOFF ARSENAL]🌈 Rainbow Momentum - Multi Timeframe WYCKOFF ARSENAL
The purpose of the Momentum is to provide a measure of the speculative interest in the market.
In Rainbow form, the Momentum could also be used as a trend-following indicator.
The Rainbow Momentum can be used on any available timeframes and assets with volume data .
It is a combination of Momentum instances of different lengths that are plotted on the same chart.
The confluence zones can hint at a price reversal and help estimate the trend strength.
The Rainbow Momentum can be combined with other technical analysis tools as a trend-following indicator.
When the trend is strong and the other indicators used to determine entry points send a bullish or a bearish signal, a position can be opened.
When the trend is weak, opening new positions should not be to consider.
The Rainbow Momentum can also be used on its own. The angles of the Rainbow will hint at the trend strength.
The steeper the curve, the stronger the trend. The flatter the curve, the weaker the trend.
A Buy position can be opened in the beginning of a strong positive trend .
A Sell position can be opened in the beginning of a strong negative trend .
During a strong trend, short-lived retracements can be found, and it is possible to enter a position in the direction of the general trend against the retracement.
The Rainbow mode can be experienced with the Multi RSI indicator as well.
Related tools :
▪ Optimism Pessimism
▪ Force
- 🌈 Rainbow Force
▪ Technometer
- 🌈 Rainbow Technometer
▪ Momentum
- 🌈 Rainbow Momentum ◄
▪ Market Screener
