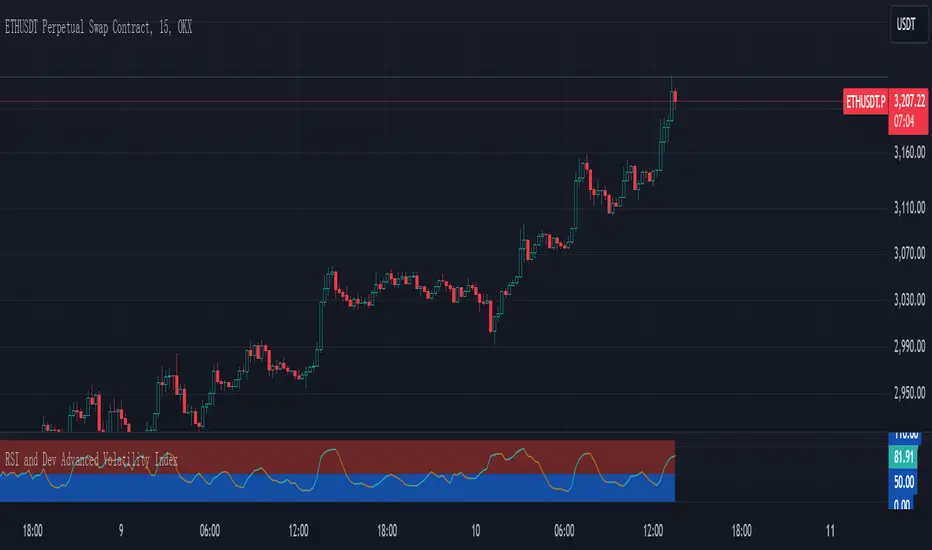
RSI and Dev Advanced Volatility IndexEnglish Explanation of the "RSI and Dev Advanced Volatility Index" Pine Script Code
Understanding the Code
Purpose:
This Pine Script code creates a custom indicator that combines the Relative Strength Index (RSI) and Deviation (DEV) to provide insights into market volatility.
Key Components:
* Deviation (DEV): Calculates the difference between the closing price and the 10-period simple moving average. This measures the extent to which the price deviates from its recent average, indicating volatility.
* RSI: The traditional RSI is then applied to the calculated deviations. This helps to smooth the data and identify overbought or oversold conditions in terms of volatility.
Calculation Steps:
* Deviation Calculation: The difference between the closing price and its 10-period simple moving average is calculated.
* RSI Calculation: The RSI is calculated on the deviations, providing a measure of the speed and change of volatility relative to recent volatility changes.
* Plotting:
* The RSI of the deviations is plotted on the chart.
* Horizontal lines are plotted at 50, 0, and 110 to visually represent different volatility zones.
* The area between the lines is filled with color to highlight low and high volatility regions.
Interpretation and Usage
* Volatility Analysis:
* High Volatility: When the RSI is above 50, it indicates high volatility, suggesting the market might be in a consolidation or trend reversal phase.
* Low Volatility: When the RSI is below 50, it indicates low volatility, suggesting a relatively calm market.
* Trading Signals:
* Buy Signal: When the RSI crosses above 50 from below, it might signal increasing volatility, which could be a buying opportunity.
* Sell Signal: When the RSI crosses below 50 from above, it might signal decreasing volatility, which could be a selling opportunity.
* Risk Management:
* By monitoring volatility, traders can better manage their risk. During periods of high volatility, traders might reduce their position size or adopt more conservative strategies.
Advantages
* Comprehensive: Combines RSI and DEV for a more holistic view of volatility.
* Sensitivity: Quickly responds to changes in market volatility.
* Visual Clarity: Color-coded zones provide a clear visual representation of different volatility levels.
Limitations
* Parameter Sensitivity: The indicator's performance is sensitive to parameter changes, such as the lookback period for the moving average.
* Lag: Like most technical indicators, it has some lag and might not capture every market movement.
* Not Predictive: It can only indicate current and past volatility, not future movements.
Summary
This custom indicator offers a valuable tool for analyzing market volatility. By combining RSI and DEV, it provides a more nuanced perspective on price fluctuations. However, it should be used in conjunction with other technical indicators and fundamental analysis for more robust trading decisions.
Key points to remember:
* Higher RSI values indicate higher volatility.
* Lower RSI values indicate lower volatility.
* Crossovers of the RSI line above or below 50 can provide potential trading signals.
* The indicator should be used in conjunction with other analysis tools for a more complete picture of the market.
Cari skrip untuk "Volatility"
Uber VQ - Volatility Quality Index [UTS]Name: Uber VQI - Volatility Quality Index
Created: 2022/11/22
Copyright: © UberTradingSystems
Description:
The volatility quality index was first introduced by Thomas Stridsman in Technical Analysis of Stocks and Commodities magazine in the August 2002 edition.
This powerful indicator points out the difference between bad and good volatility in order to identify better trade opportunities in the market.
It is suggested to use this indicator as a confirmation signal together with the other indicators in your system.
General Usage
Stridsman suggested buying (or "to go long") when VQ has increased in the previous 10 bars and selling (or "to go short") when it has decreased in the previous 10 bars.
This indicator has been updated to reflect its modern iterations. One of the following signals are choosable trading signal generator:
VQ Sum
Short MA
Long MA
All three signal triggering conditions can selectively be drawn on the indicator for study and reference purposes.
In addition, generated buy and sell signals can be drawn on the indicator and are modifiable too.
Alerts
To allow alert notifications, generated signals are connected as selectable "Long Signal" and "Short Signal" to the indicator alerts.
The conditions can be found on the alert sections of the indicator.
In the menu right to the indicator name, press the three dots and select "Add alert on ...".
Under condition options select one of the following:
Long Signal
Short Signal
It is advised to select "Once per bar close" as alert execution option.
Moving Averages
To fine-tune the "Short MA" and "Long MA" calculation, 16 different Moving Averages are available to choose from:
ALMA (Arnaud Legoux Moving Average)
DEMA (Double Exponential Moving Average)
EMA (Exponential Moving Average)
FRAMA (Fractal Adaptive Moving Average)
HMA (Hull Moving Average)
JURIK (Jurik Moving Average)
KAMA (Kaufman Adaptive Moving Average)
Kijun (Kijun-sen / Tenkan-sen of Ichimoku)
LSMA (Least Square Moving Average)
RMA (Running Moving Average)
SMA (Simple Moving Average)
SuperSmoothed (Super Smoothed Moving Average)
TEMA (Triple Exponential Moving Average)
VWMA (Volume Weighted Moving Average)
WMA (Weighted Moving Average)
ZLEMA (Zero Lag Moving Average)
A freely determinable length allows for sensitivity adjustments that fit your own requirements.

Volume Weighted Volatility RegimeThe Volume-Weighted Volatility Regime (VWVR) is a market analysis tool that dissects total volatility to classify the current market 'character' or 'regime'. Using a Linear Regression model, it decomposes volatility into Trend, Residual (mean-reversion), and Within-Bar (noise) components.
Key Features:
Seven-Stage Regime Classification: The indicator's primary output is a regime value from -3 to +3, identifying the market state:
+3 (Strong Bull Trend): High directional, upward volatility.
+2 (Choppy Bull): Moderate upward trend with noise.
+1 (Quiet Bull): Low volatility, slight upward drift.
0 (Neutral): No clear directional bias.
-1 (Quiet Bear): Low volatility, slight downward drift.
-2 (Choppy Bear): Moderate downward trend with noise.
-3 (Strong Bear Trend): High directional, downward volatility.
Advanced Volatility Decomposition: The regime is derived from a three-component volatility model that separates price action into Trend (momentum), Residual (mean-reversion), and Within-Bar (noise) variance. The classification is determined by comparing the 'Trend' ratio against the user-defined 'Trend Threshold' and 'Quiet Threshold'.
Dual-Level Analysis: The indicator analyzes market character on two levels simultaneously:
Inter-Bar Regime (Background Color): Based on the main StdDev Length, showing the overall market character.
Intra-Bar Regime (Column Color): Based on a high-resolution analysis within each single bar ('Intra-Bar Timeframe'), showing the micro-structural character.
Calculation Options:
Statistical Model: The 'Estimate Bar Statistics' option (enabled by default) uses a statistical model ('Estimator') to perform the decomposition. (Assumption: In this mode, the Source input is ignored, and an estimated mean for each bar is used instead).
Normalization: An optional 'Normalize Volatility' setting calculates an Exponential Regression Curve (log-space).
Volume Weighting: An option (Volume weighted) applies volume weighting to all volatility calculations.
Multi-Timeframe (MTF) Capability: The entire dual-level analysis can be run on a higher timeframe (using the Timeframe input), with standard options to handle gaps (Fill Gaps) and prevent repainting (Wait for...).
Integrated Alerts: Includes 22 comprehensive alerts that trigger whenever the 'Inter-Bar Regime' or the 'Intra-Bar Regime' crosses one of the key thresholds (e.g., 'Regime crosses above Neutral Line'), or when the 'Intra-Bar Dominance' crosses the 50% mark.
Caution: Real-Time Data Behavior (Intra-Bar Repainting) This indicator uses high-resolution intra-bar data. As a result, the values on the current, unclosed bar (the real-time bar) will update dynamically as new intra-bar data arrives. This behavior is normal and necessary for this type of analysis. Signals should only be considered final after the main chart bar has closed.
DISCLAIMER
For Informational/Educational Use Only: This indicator is provided for informational and educational purposes only. It does not constitute financial, investment, or trading advice, nor is it a recommendation to buy or sell any asset.
Use at Your Own Risk: All trading decisions you make based on the information or signals generated by this indicator are made solely at your own risk.
No Guarantee of Performance: Past performance is not an indicator of future results. The author makes no guarantee regarding the accuracy of the signals or future profitability.
No Liability: The author shall not be held liable for any financial losses or damages incurred directly or indirectly from the use of this indicator.
Signals Are Not Recommendations: The alerts and visual signals (e.g., crossovers) generated by this tool are not direct recommendations to buy or sell. They are technical observations for your own analysis and consideration.

Options Oscillator [PRO] IVRank, IVx, Call/Put Volatility Skew𝗧𝗵𝗲 𝗳𝗶𝗿𝘀𝘁 𝗧𝗿𝗮𝗱𝗶𝗻𝗴𝗩𝗶𝗲𝘄 𝗶𝗻𝗱𝗶𝗰𝗮𝘁𝗼𝗿 𝘁𝗵𝗮𝘁 𝗽𝗿𝗼𝘃𝗶𝗱𝗲𝘀 𝗥𝗘𝗔𝗟 𝗜𝗩𝗥𝗮𝗻𝗸, 𝗜𝗩𝘅, 𝗮𝗻𝗱 𝗖𝗔𝗟𝗟/𝗣𝗨𝗧 𝘀𝗸𝗲𝘄 𝗱𝗮𝘁𝗮 𝗯𝗮𝘀𝗲𝗱 𝗼𝗻 𝗥𝗘𝗔𝗟 𝗼𝗽𝘁𝗶𝗼𝗻 𝗰𝗵𝗮𝗶𝗻 𝗳𝗼𝗿 𝗼𝘃𝗲𝗿 𝟭𝟲𝟱+ 𝗺𝗼𝘀𝘁 𝗹𝗶𝗾𝘂𝗶𝗱 𝗨.𝗦. 𝗺𝗮𝗿𝗸𝗲𝘁 𝘀𝘆𝗺𝗯𝗼𝗹𝘀
🔃 Auto-Updating Option Metrics without refresh!
🍒 Developed and maintained by option traders for option traders.
📈 Specifically designed for TradingView users who trade options.
🔶 Ticker Information:
This indicator is currently only available for over 165+ most liquid U.S. market symbols (eg. SP:SPX AMEX:SPY NASDAQ:QQQ NASDAQ:TLT NASDAQ:NVDA , etc.. ), and we are continuously expanding the compatible watchlist here: www.tradingview.com
🔶 How does the indicator work and why is it unique?
This Pine Script indicator is a complex tool designed to provide various option metrics and visualization tools for options market traders. The indicator extracts raw options data from an external data provider (ORATS), processes and refines the delayed data package using pineseed, and sends it to TradingView, visualizing the data using specific formulas (see detailed below) or interpolated values (e.g., delta distances). This method of incorporating options data into a visualization framework is unique and entirely innovative on TradingView.
The indicator aims to offer a comprehensive view of the current state of options for the implemented instruments, including implied volatility (IV), IV rank (IVR), options skew, and expected market movements, which are objectively measured as detailed below.
The options metrics we display may be familiar to options traders from various major brokerage platforms such as TastyTrade, IBKR, TOS, Tradier, TD Ameritrade, Schwab, etc.
🟨 The following data is displayed in the oscillator 🟨
We use Tastytrade formulas, so our numbers mostly align with theirs!
🔶 𝗜𝗩𝗥𝗮𝗻𝗸
The Implied Volatility Rank (IVR) helps options traders assess the current level of implied volatility (IV) in comparison to the past 52 weeks. IVR is a useful metric to determine whether options are relatively cheap or expensive. This can guide traders on whether to buy or sell options.
IV Rank formula = (current IV - 52 week IV low) / (52 week IV high - 52 week IV low)
IVRank is default blue and you can adjust their settings:
🔶 𝗜𝗩𝘅 𝗮𝘃𝗴
The implied volatility (IVx) shown in the option chain is calculated like the VIX. The Cboe uses standard and weekly SPX options to measure expected S&P 500 volatility. A similar method is used for calculating IVx for each expiration cycle.
We aggregate the IVx values for the 35-70 day monthly expiration cycle, and use that value in the oscillator and info panel.
We always display which expiration the IVx values are averaged for when you hover over the IVx cell.
IVx main color is purple, but you can change the settings:
🔹 IVx 5 days change %
We are also displaying the five-day change of the IV Index (IVx value). The IV Index 5-Day Change column provides quick insight into recent expansions or decreases in implied volatility over the last five trading days.
Traders who expect the value of options to decrease might view a decrease in IVX as a positive signal. Strategies such as Strangle and Ratio Spread can benefit from this decrease.
On the other hand, traders anticipating further increases in IVX will focus on the rising IVX values. Strategies like Calendar Spread or Diagonal Spread can take advantage of increasing implied volatility.
This indicator helps traders quickly assess changes in implied volatility, enabling them to make informed decisions based on their trading strategies and market expectations.
Important Note:
The IVx value alone does not provide sufficient context. There are stocks that inherently exhibit high IVx values. Therefore, it is crucial to consider IVx in conjunction with the Implied Volatility Rank (IVR), which measures the IVx relative to its own historical values. This combined view helps in accurately assessing the significance of the IVx in relation to the specific stock's typical volatility behavior.
This indicator offers traders a comprehensive view of implied volatility, assisting them in making informed decisions by highlighting both the absolute and relative volatility measures.
🔶 𝗖𝗔𝗟𝗟/𝗣𝗨𝗧 𝗣𝗿𝗶𝗰𝗶𝗻𝗴 𝗦𝗸𝗲𝘄 𝗵𝗶𝘀𝘁𝗼𝗴𝗿𝗮𝗺
At TanukiTrade, Vertical Pricing Skew refers to the difference in pricing between put and call options with the same expiration date at the same distance (at tastytrade binary expected move). We analyze this skew to understand market sentiment. This is the same formula used by TastyTrade for calculations.
We calculate the interpolated strike price based on the expected move, taking into account the neighboring option prices and their distances. This allows us to accurately determine whether the CALL or PUT options are more expensive.
🔹 What Causes Pricing Skew? The Theory Behind It
The asymmetric pricing of PUT and CALL options is driven by the natural dynamics of the market. The theory is that when CALL options are more expensive than PUT options at the same distance from the current spot price, market participants are buying CALLs and selling PUTs, expecting a faster upward movement compared to a downward one .
In the case of PUT skew, it's the opposite: participants are buying PUTs and selling CALLs , as they expect a potential downward move to happen more quickly than an upward one.
An options trader can take advantage of this phenomenon by leveraging PUT pricing skew. For example, if they have a bullish outlook and both IVR and IVx are high and IV started decreasing, they can capitalize on this PUT skew with strategies like a jade lizard, broken wing butterfly, or short put.
🔴 PUT Skew 🔴
Put options are more expensive than call options, indicating the market expects a faster downward move (▽). This alone doesn't indicate which way the market will move (because nobody knows that), but the options chain pricing suggests that if the market moves downward, it could do so faster in velocity compared to a potential upward movement.
🔹 SPY PUT SKEW example:
If AMEX:SPY PUT option prices are 46% higher than CALLs at the same distance for the optimal next monthly expiry (DTE). This alone doesn't indicate which way the market will move (because nobody knows that), but the options chain pricing suggests that if the market moves downward, it could do so 46% faster in velocity compared to a potential upward movement
🟢 CALL Skew 🟢
Call options are more expensive than put options, indicating the market expects a faster upward move (△). This alone doesn't indicate which way the market will move (because nobody knows that), but the options chain pricing suggests that if the market moves upward, it could do so faster in velocity compared to a potential downward movement.
🔹 INTC CALL SKEW example:
If NASDAQ:INTC CALL option prices are 49% higher than PUTs at the same distance for the optimal next monthly expiry (DTE). This alone doesn't indicate which way the market will move (because nobody knows that), but the options chain pricing suggests that if the market moves upward, it could do so 49% faster in velocity compared to a potential downward movement .
🔶 USAGE example:
The script is compatible with our other options indicators.
For example: Since the main metrics are already available in this Options Oscillator, you can hide the main IVR panel of our Options Overlay indicator, freeing up more space on the chart. The following image shows this:
🔶 ADDITIONAL IMPORTANT COMMENTS
🔹 Historical Data:
Yes, we only using historical internal metrics dating back to 2024-07-01, when the TanukiTrade options brand launched. For now, we're using these, but we may expand the historical data in the future.
🔹 What distance does the indicator use to measure the call/put pricing skew?:
It is important to highlight that this oscillator displays the call/put pricing skew changes for the next optimal monthly expiration on a histogram.
The Binary Expected Move distance is calculated using the TastyTrade method for the next optimal monthly expiration: Formula = (ATM straddle price x 0.6) + (1st OTM strangle price x 0.3) + (2nd OTM strangle price x 0.1)
We interpolate the exact difference based on the neighboring strikes at the binary expected move distance using the TastyTrade method, and compare the interpolated call and put prices at this specific point.
🔹 - Why is there a slight difference between the displayed data and my live brokerage data?
There are two reasons for this, and one is beyond our control.
◎ Option-data update frequency:
According to TradingView's regulations and guidelines, we can update external data a maximum of 5 times per day. We strive to use these updates in the most optimal way:
(1st update) 15 minutes after U.S. market open
(2nd, 3rd, 4th updates) 1.5–3 hours during U.S. market open hours
(5th update) 10 minutes before U.S. market close.
You don’t need to refresh your window, our last refreshed data-pack is always automatically applied to your indicator, and you can see the time elapsed since the last update at the bottom of the corner on daily TF.
◎ Brokerage Calculation Differences:
Every brokerage has slight differences in how they calculate metrics like IV and IVx. If you open three windows for TOS, TastyTrade, and IBKR side by side, you will notice that the values are minimally different. We had to choose a standard, so we use the formulas and mathematical models described by TastyTrade when analyzing the options chain and drawing conclusions.
🔹 - EOD data:
The indicator always displays end-of-day (EOD) data for IVR, IV, and CALL/PUT pricing skew. During trading hours, it shows the current values for the ongoing day with each update, and at market close, these values become final. From that point on, the data is considered EOD, provided the day confirms as a closed daily candle.
🔹 - U.S. market only:
Since we only deal with liquid option chains: this option indicator only works for the USA options market and do not include future contracts; we have implemented each selected symbol individually.
Disclaimer:
Our option indicator uses approximately 15min-3 hour delayed option market snapshot data to calculate the main option metrics. Exact realtime option contract prices are never displayed; only derived metrics and interpolated delta are shown to ensure accurate and consistent visualization. Due to the above, this indicator can only be used for decision support; exclusive decisions cannot be made based on this indicator. We reserve the right to make errors.This indicator is designed for options traders who understand what they are doing. It assumes that they are familiar with options and can make well-informed, independent decisions. We work with public data and are not a data provider; therefore, we do not bear any financial or other liability.

Implied volatility indicator - Bouhmidi-Bands Volatility trading with the Bouhmidi-Bands
Most known indicators such as Bollinger Bands or Keltner Channel focus only on historical volatility. Bouhmidi bands follow a different approach, namely an indicator based on implied volatility.
Style tags: Implied Volatility, Volatility Trading, Trend Analysis
Asset class: Equities, Futures, Commodities
Dataset: Minutes / Hours
Description
The most famous volatility indicators such as Bollinger Bands , Keltner Channel , Donchian Channels , etc. all use the historical volatility of the underlying asset. However, volatility is determined not only by historical volatility but also by implied volatility. The additional analysis of implied volatility sharpens the view and improves trading.
The Bouhmidi Bands ® were developed by myself and are based on implied volatility. They calculate an expected daily bandwidth under the assumption of normally distributed returns. The bandwidth is based on 1σ or 2σ. This means that an underlying closes with a probability of 68% or 95% within the expected Bouhmidi bandwidth at the end of the day. Check the historical development. The track record over the past 20 years shows a strong robustness of the indicator.
Benefits using Bouhmidi bands
- The Bouhmidi bands can be used to identify and filter "invisible" resistance and support that cannot be detected with simple chart analysis.
- The Bouhmidi bands can be used for different trading approaches. For example, they are suitable for mean reversion and volatility breakouts.
- If you combine the Bouhmidi bands with e.g. Keltner channel or Bollinger bands, you have the historical and implied volatility in one view in your tradingview chart.
Which underlyings can I trade with the Bouhmidi bands?
To determine the Bouhmidi bands, we need the underlying and the corresponding implied volatility index:
- S&P 500 - VIX
- DAX - VDAX-NEW
- Dow Jones - VXD
- Nasdaq 100 - VXN
- Gold - GVZ
- WTI - OVX
- Apple - VXAPL
- Amazon - VXAZN
- Google - VXGOG
- IBM - VXIBM

L&S Volatility Index Refurbished█ Introduction
This is my second version of the L&S Volatility Index, hence the name "Refurbished".
The first version can be found at this link:
The reason I released a separate version is because I rewrote the source code from scratch with the aim of both improving the indicator and staying as close as possible to the original concept.
I feel that the first version was somewhat exotic and polluted in relation to the indicator originally described by the authors.
In short, the main idea remains the same, however, the way of presenting the result has been changed, reiterating what was said.
█ CONCEPTS
The L&S Volatility Index measures the volatility of price in relation to a moving average.
The indicator was originally described by Brazilian traders Alexandre Wolwacz (Stormer) and Fábio Figueiredo (Vlad) from L&S Educação Financeira.
Basically, this indicator can be used in two ways:
1. In a mean reversion strategy, when there is an unusual distance from it;
2. In a trend following strategy, when the price is in an acceptable region.
As an indicator of volatility, the greatest utility is shown in first case.
This is because it allows identifying abnormal prices, extremely stretched in relation to an average, including market crashes.
How the calculation is done:
First, the distance of the price from a given average in percentage terms is measured.
Then, the historical average volatility is obtained.
Finally the indicator is calculated through the ratio between the distance and the historical volatility.
According to the description proposed by the creators, when the L&S Volatility Index is above 30 it means that the price is "stretched".
The closer to 100 the more stretched.
When it reaches 0, it means the price is on average.
█ What to look for
Basically, you should look at non-standard prices.
How to identify it?
When the oscillator is outside the Dynamic Zone and/or the Fixed Zone (above 30), it is because the price is stretched.
Nothing on the market is guaranteed.
As with the RSI, it is not because the RSI is overbought or oversold that the price will necessarily go down or up.
It is critical to know when NOT to buy, NOT to sell or NOT to do anything.
It is always important to consider the context.
█ Improvements
The following improvements have been implemented.
It should be noted that these improvements can be disabled, thus using the indicator in the "purest" version, the same as the one conceived by the creators.
Resources:
1. Customization of limits and zones:
2. Customization of the timeframe, which can be different from the current one.
3. Repaint option (prints the indicator in real time even if the bar has not yet closed. This produces more signals).
4. Customization of price inputs. This affects the calculation.
5. Customization of the reference moving average (the moving average used to calculate the price distance).
6. Customization of the historical volatility calculation strategy.
- Accumulated ATR: calculates the historical volatility based on the accumulated ATR.
- Returns: calculates the historical volatility based on the returns of the source.
Both forms of volatility calculation have their specific utilities and applications.
Therefore, it is worthwhile to have both approaches available, and one should not necessarily replace the other.
Each method has its advantages and may be more appropriate in different contexts.
The first approach, using the accumulated ATR, can be useful when you want to take into account the implied volatility of prices over time,
reflecting broader price movements and higher impact events. It can be especially relevant in scenarios where unexpected events can drastically affect prices.
The second approach, using the standard deviation of returns, is more common and traditionally used to measure historical volatility.
It considers the variability of prices relative to their average, providing a more general measure of market volatility.
Therefore, both forms of calculation have their merits and can be useful depending on the context and specific analysis needs.
Having both options available gives users flexibility in choosing the most appropriate volatility measure for the situation at hand.
* When choosing "Accumulated ATR", if the indicator becomes difficult to see, there are 3 possibilities:
a) manually adjust the Fixed Zone value;
b) disable the Fixed Zone and use only the Dynamic Zone;
c) normalize the indicator.
7. Signal line (a moving average of the oscillator).
8. Option to normalize the indicator or not.
9. Colors to facilitate direction interpretation.
Since the L&S is a volatility indicator, it does not show whether the price is rising or falling.
This can sometimes confuse the user.
That said, the idea here is to show certain colors where the price is relative to the average, making it easier to analyze.
10. Alert messages for automations.

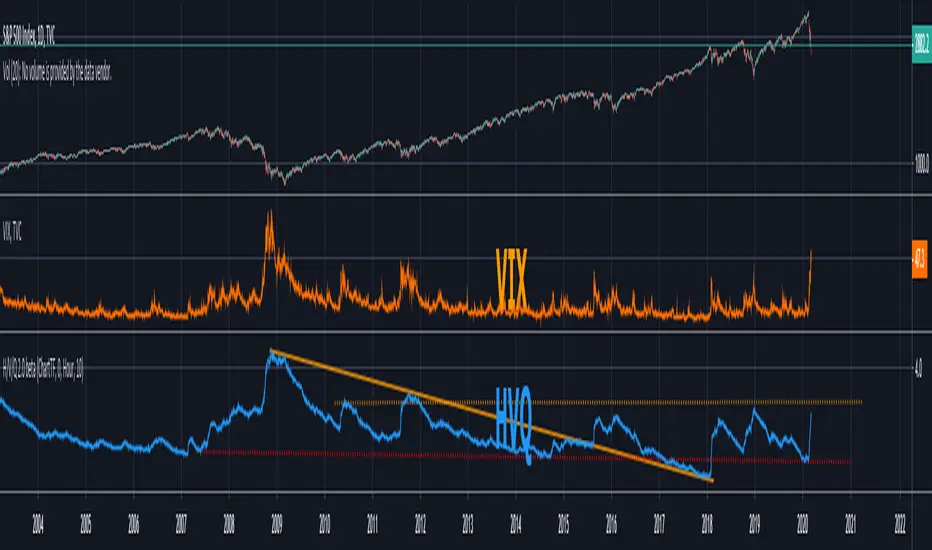
H/V/Q Volatility Index v2.0This is a standalone version of the volatility calculation used in QuantRsi. It is a relatively complex volatility-specific filtering calculation designed to give deeper insight into volatility trends for any asset class.
Use with Log scaling on the indicator's value scalar.
This tool offers an alternative model for volatility calculation. Experience using this tool proves that it extends the efficacy of volatility prediction techniques, and allows deeper technical analysis within volatility moves.
Use alongside conventional volatility indices to find opportunities within option chains to long or short volatility when HVQ provides evidence for volatility reversal that other options value models have not priced in.
Use as part of a predictive based risk management strategy.
Use alongside QuantRsi and HeffaeClouds as a complete trading suite, sans volume analysis, and gain insight not offered by any other indicator set.
SETTINGS:
TimeFrame settings:
Chart/Custom timeframe inputs are carried over from HeffaeClouds and QuantRsi indicators. Allows you to assign any non-chart timeframe to the indicator:
"ChartTF" follows your chart's selected resolution / TimeFrame
"Non-Chart TimeFrame" is an integer for your custom TimeFrame, the setting below:
"Non-Chart TimeFrame" selects "Minutes, Hours, Days" that corresponds to the above setting for a custom TimeFrame.
More Settings:
"Invert Output switch" will invert the volatility chart scale. Useful for visualizing some trends on assets that regularly correlate large volatility spikes with disorderly selloffs.
"Show High/Low Volt range" switch (experimental) shows the high/low extremes of alternate volatility window calculations. There is insight to be gained from large differences v.s. all ranges trending near the same values.
"Relative value switch" (experimental) divides the HVQ values by the hl2 candle price, per candle. This is a unique way to filter the output, visualize the volatility value per asset value.
"Range Multiplier" adjusts the average window length HVQ uses for calculations. This has been finely tuned so that the value of "10" corresponds to the best average fitting of all assets and timeframes. In most situations TimeFrame should be used to alter the real window periods and this should be left at default. Instead you can change this to find better fitting if you'd like.
If there is a feature you would like, question answered, or a bug to report, visit the TradingView SNOW_CITY public chat-room; link in my signature
Use the pastebin link below for indicator access information and pricing
Options Volatility Strategy Analyzer [TradeDots]The Options Volatility Strategy Analyzer is a specialized tool designed to help traders assess market conditions through a detailed examination of historical volatility, market benchmarks, and percentile-based thresholds. By integrating multiple volatility metrics (including VIX and VIX9D) with color-coded regime detection, the script provides users with clear, actionable insights for selecting appropriate options strategies.
📝 HOW IT WORKS
1. Historical Volatility & Percentile Calculations
Annualized Historical Volatility (HV): The script automatically computes the asset’s historical volatility using log returns over a user-defined period. It then annualizes these values based on the chart’s timeframe, helping you understand the asset’s typical volatility profile.
Dynamic Percentile Ranks: To gauge where the current volatility level stands relative to past behavior, historical volatility values are compared against short, medium, and long lookback periods. Tracking these percentile ranks allows you to quickly see if volatility is high or low compared to historical norms.
2. Multi-Market Benchmark Comparison
VIX and VIX9D Integration: The script tracks market volatility through the VIX and VIX9D indices, comparing them to the asset’s historical volatility. This reveals whether the asset’s volatility is outpacing, lagging, or remaining in sync with broader market volatility conditions.
Market Context Analysis: A built-in term-structure check can detect market stress or relative calm by measuring how VIX compares to shorter-dated volatility (VIX9D). This helps you decide if the present environment is risk-prone or relatively stable.
3. Volatility Regime Detection
Color-Coded Background: The analyzer assigns a volatility regime (e.g., “High Asset Vol,” “Low Asset Vol,” “Outpacing Market,” etc.) based on current historical volatility percentile levels and asset vs. market ratios. A color-coded background highlights the regime, enabling traders to quickly interpret the market’s mood.
Alerts on Regime Changes & Spikes: Automated alerts warn you about any significant expansions or contractions in volatility, allowing you to react swiftly in changing conditions.
4. Strategy Forecast Table
Real-Time Strategy Suggestions: At the close of each bar, an on-chart table generates suggested options strategies (e.g., selling premium in high volatility or buying premium in low volatility). These suggestions provide a quick summary of potential tactics suited to the current regime.
Contextual Market Data: The table also displays key statistics, such as VIX levels, asset historical volatility percentile, or ratio comparisons, helping you confirm whether volatility conditions warrant more conservative or more aggressive strategies.
🛠️ HOW TO USE
1. Select Your Timeframe: The script supports multiple timeframes. For short-term trading, intraday charts often reveal faster shifts in volatility. For swing or position trading, daily or weekly charts may be more stable and produce fewer false signals.
2. Check the Volatility Regime: Observe the background color and on-chart labels to identify the current regime (e.g., “HIGH ASSET VOL,” “LOW VOL + LAGGING,” etc.).
3. Review the Forecast Table: The table suggests strategy ideas (e.g., iron condors, long straddles, ratio spreads) depending on whether volatility is elevated, subdued, or spiking. Use these as a starting point for designing trades that match your risk tolerance.
4. Combine with Additional Analysis: For optimal results, confirm signals with your broader trading plan, technical tools (moving averages, price action), and fundamental research. This script is most effective when viewed as one component in a comprehensive decision-making process.
❗️LIMITATIONS
Directional Neutrality: This indicator analyzes volatility environments but does not predict price direction (up/down). Traders must combine with directional analysis for complete strategy selection.
Late or Missed Signals: Since all calculations require a bar to close, sharp intrabar volatility moves may not appear in real-time.
False Positives in Choppy Markets: Rapid changes in percentile ranks or VIX movements can generate conflicting or premature regime shifts.
Data Sensitivity: Accuracy depends on the availability and stability of volatility data. Significant gaps or unusual market conditions may skew results.
Market Correlation Assumptions: The system assumes assets generally correlate with S&P 500 volatility patterns. May be less effective for:
Small-cap stocks with unique volatility drivers
International stocks with different market dynamics
Sector-specific events disconnected from broad market
Cryptocurrency-related assets with independent volatility patterns
RISK DISCLAIMER
Options trading involves substantial risk and is not suitable for all investors. Options strategies can result in significant losses, including the total loss of premium paid. The complexity of options strategies requires thorough understanding of the risks involved.
This indicator provides volatility analysis for educational and informational purposes only and should not be considered as investment advice. Past volatility patterns do not guarantee future performance. Market conditions can change rapidly, and volatility regimes may shift without warning.
No trading system can guarantee profits, and all trading involves the risk of loss. The indicator's regime classifications and strategy suggestions should be used as part of a comprehensive trading plan that includes proper risk management, directional analysis, and consideration of broader market conditions.

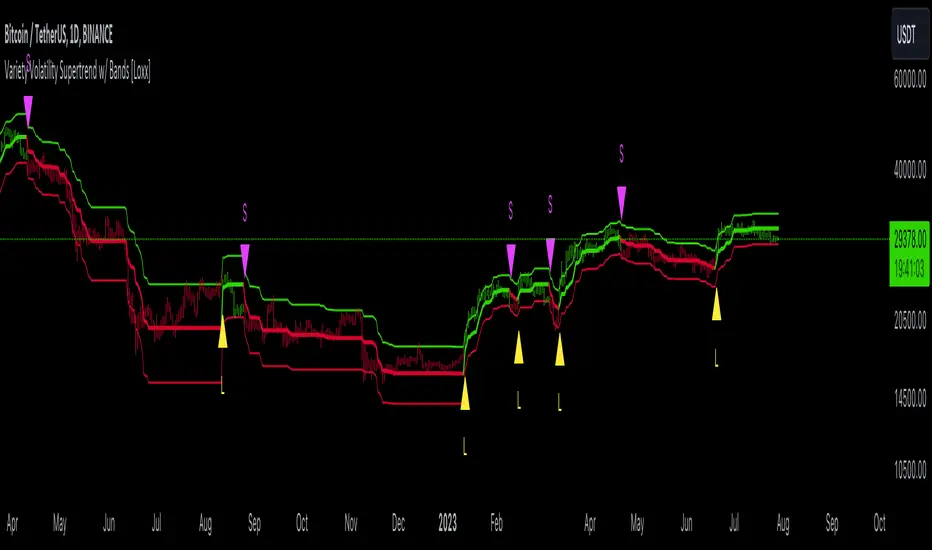
Variety Volatility Supertrend w/ Bands [Loxx]Variety Volatility Supertrend w/ Bands indicator is a powerful and highly customizable tool for traders. Building upon the foundational concept of the classic Supertrend indicator, this variant adds a plethora of user-driven options and features that can cater to diverse trading styles and market scenarios.
The Supertrend indicator is traditionally used to identify market trends by overlaying a line on the price chart, which changes color and position in relation to the price based on the trend direction. The Variety Volatility Supertrend w/ Bands takes this a step further by offering various volatility calculations, visual enhancements, explicit trading signals, and alert conditions.
It provides five options for volatility calculations, enabling users to select the most suitable measure for their strategy. This indicator also allows users to control the display of the upper, lower, and mid bands, which can serve as dynamic support and resistance levels. Further, it can display explicit trading signals when the trend changes direction and set up alerts for these signals.
█ User Inputs
Source: Defines the source of the price data, typically the closing price.
Period: Defines the lookback period for the chosen volatility calculation.
Mid Price Period: Defines the number of periods for calculating the mid-price.
Multiplier: The factor by which the volatility measure (e.g., ATR) is multiplied.
Volatility Type: The user can choose one of five different calculations for the volatility measure: ATR, Standard Error, Standard Deviation, Custom Standard Deviation with Sample Correction, and Custom Standard Deviation without Sample Correction.
Classic Supertrend: Enables the classic version of the Supertrend indicator if set to true.
Show Upper Band, Show Lower Band, Show Mid: Determines whether the upper, lower, and middle bands of the Supertrend indicator are displayed.
Outer Line Width, Mid Line Width: Controls the line widths of the outer and middle lines.
Color Bars: Colors the price bars based on the direction of the trend if enabled.
Show signals: Displays trading signals on the chart if enabled.
Bull Color, Bear Color: Controls the colors of the Supertrend indicator during bullish and bearish market conditions.
█ Computations
The script begins by calculating the chosen volatility measure (ATR, Standard Error, Standard Deviation, etc.) and the mid-price, which is the average of the highest and lowest prices over the specified Mid Price Period. It then calculates the upper and lower bands by adding and subtracting the product of the Multiplier and the volatility measure from the mid-price.
The script then compares the current price with the previous upper and lower bands to determine the trend direction. If the current price is greater than the previous upper band, the trend is considered bullish. If it's less than the previous lower band, the trend is bearish.
█ Visualizations
The script plots the upper, lower, and mid bands on the chart based on the user's settings. If Color Bars is enabled, the script colors the price bars based on the trend direction. If Show signals is enabled, the script displays shapes on the chart to represent trading signals when the trend changes direction.
█ Alerts
Finally, the script sets up alert conditions for long and short trading signals. When these conditions are met, TradingView sends an alert to the user with a message indicating the indicator's name, the type of signal (long or short), and the symbol and closing price of the asset.
█ Visualization Modes
Classic Supertrend
The Classic Supertrend mode essentially transforms the "Variety Volatility Supertrend w/ Bands " indicator to behave more like the traditional Supertrend indicator.
In the traditional Supertrend indicator, there is a single line that shifts positions based on the trend direction. When the market is in an uptrend, the Supertrend line is plotted below the price, acting as a dynamic support level. Conversely, when the market is in a downtrend, the Supertrend line moves above the price, acting as a dynamic resistance level.
When you set Classic Supertrend to True in this script, it mimics this behavior. It will only display one line (the Supertrend line) instead of the upper and lower bands. The Supertrend line will switch between the calculated upper band and lower band based on the trend direction:
In an uptrend, it plots the lower band as the Supertrend line (acting as a dynamic support level).
In a downtrend, it plots the upper band as the Supertrend line (acting as a dynamic resistance level).
Thus, when Classic Supertrend is True, the display is similar to the regular Supertrend indicator, offering a more simplified, less cluttered view of the price trend.
See here for the Classic Supertrend
Supertrend Moving Average with Bands
When the Classic Supertrend option is turned off in the "Variety Volatility Supertrend w/ Bands " indicator, the indicator displays upper and lower bands along with the midline, depending on the user's settings. These bands can serve as dynamic support and resistance levels, and they move and adjust based on the market's volatility.
Support and resistance are key concepts in technical analysis. Support is a price level where the price tends to find a floor as it falls, indicating a greater amount of demand or buying interest that can prop up the prices. Resistance, on the other hand, is a price level where rising prices tend to stop rising, indicating a greater amount of supply or selling interest.
In the context of the "Variety Volatility Supertrend w/ Bands " indicator:
Upper Band: This can act as a dynamic resistance level in a downtrend. When prices are falling, they might struggle to rise above this band. If prices do break above the upper band, it could be a sign that the downtrend is reversing, and a new uptrend may be beginning.
Lower Band: Conversely, this can act as a dynamic support level in an uptrend. When prices are rising, they might bounce off this band and continue to rise. If prices break below the lower band, it could indicate that the uptrend is reversing, and a new downtrend may be beginning.
The benefit of these dynamic support and resistance levels is that they adjust automatically as market conditions change, potentially offering more relevant insights into price behavior compared to static support and resistance levels.
See here for the Supertrend Moving Average with Bands
█ Volatility Types
The "Variety Volatility Supertrend w/ Bands " indicator provides five options for the volatility calculation. Volatility is a statistical measure of the dispersion of returns for a given security or market index. In most cases, the higher the volatility, the riskier the security. Here's a quick summary of each option:
Average True Range (ATR): This is a common volatility measure in the world of trading, particularly for commodities and forex markets. It measures the average of true price ranges over a specified period. The true range considers the most recent period's high-low range, the previous close to the most recent high, and the previous close to the most recent low, taking the highest value.
Standard Error: This is a measure of the accuracy of predictions made with statistical techniques. In the context of trading, the standard error can give traders an idea of the quality of their volatility or price level estimates. It's calculated using the standard deviation of the price data, the square root of the number of data points.
Standard Deviation: This is a measure of the dispersion of a set of data from its mean. It's a commonly used volatility measure in finance. In trading, a higher standard deviation suggests greater price volatility.
Custom Standard Deviation - with Sample Correction: This is a variation of the standard deviation calculation, but it applies a correction for small sample sizes. It's calculated similarly to the standard deviation, but the sum of the squares is divided by (n-1) instead of n to provide a more accurate estimate when working with a small number of data points.
Custom Standard Deviation - without Sample Correction: This is another variation of the standard deviation calculation, but without the sample correction. This might be used when the number of data points is sufficiently large that the correction is not necessary.
The choice of volatility measure can have a significant impact on the sensitivity of the Supertrend indicator. Some measures may result in wider bands and fewer trend changes, while others may produce narrower bands and more frequent trend changes. The choice of volatility measure should align with the trader's strategy and risk tolerance.
█ Multiple Timeframe options
The "Variety Volatility Supertrend w/ Bands " indicator, like most indicators on the TradingView platform, can be applied to various timeframes, regardless of the chart's current timeframe. The timeframe of an indicator is determined by the timeframe of the price data it processes.
This indicator's flexibility with timeframes allows it to be used in different trading strategies. Day traders might use shorter timeframes like 1-minute or 15-minute charts, swing traders might use 1-hour or 4-hour charts, and long-term investors might use daily or weekly charts.
See here for the Supertrend Moving Average with Bands on 4-hour chart using Daily data
GKD-C Volatility Ratio Adaptive RSX [Loxx]Giga Kaleidoscope GKD-C Volatility Ratio Adaptive RSX is a Confirmation module included in Loxx's "Giga Kaleidoscope Modularized Trading System".
█ Giga Kaleidoscope Modularized Trading System
What is Loxx's "Giga Kaleidoscope Modularized Trading System"?
The Giga Kaleidoscope Modularized Trading System is a trading system built on the philosophy of the NNFX (No Nonsense Forex) algorithmic trading.
What is the NNFX algorithmic trading strategy?
The NNFX (No-Nonsense Forex) trading system is a comprehensive approach to Forex trading that is designed to simplify the process and remove the confusion and complexity that often surrounds trading. The system was developed by a Forex trader who goes by the pseudonym "VP" and has gained a significant following in the Forex community.
The NNFX trading system is based on a set of rules and guidelines that help traders make objective and informed decisions. These rules cover all aspects of trading, including market analysis, trade entry, stop loss placement, and trade management.
Here are the main components of the NNFX trading system:
1. Trading Philosophy: The NNFX trading system is based on the idea that successful trading requires a comprehensive understanding of the market, objective analysis, and strict risk management. The system aims to remove subjective elements from trading and focuses on objective rules and guidelines.
2. Technical Analysis: The NNFX trading system relies heavily on technical analysis and uses a range of indicators to identify high-probability trading opportunities. The system uses a combination of trend-following and mean-reverting strategies to identify trades.
3. Market Structure: The NNFX trading system emphasizes the importance of understanding the market structure, including price action, support and resistance levels, and market cycles. The system uses a range of tools to identify the market structure, including trend lines, channels, and moving averages.
4. Trade Entry: The NNFX trading system has strict rules for trade entry. The system uses a combination of technical indicators to identify high-probability trades, and traders must meet specific criteria to enter a trade.
5. Stop Loss Placement: The NNFX trading system places a significant emphasis on risk management and requires traders to place a stop loss order on every trade. The system uses a combination of technical analysis and market structure to determine the appropriate stop loss level.
6. Trade Management: The NNFX trading system has specific rules for managing open trades. The system aims to minimize risk and maximize profit by using a combination of trailing stops, take profit levels, and position sizing.
Overall, the NNFX trading system is designed to be a straightforward and easy-to-follow approach to Forex trading that can be applied by traders of all skill levels.
Core components of an NNFX algorithmic trading strategy
The NNFX algorithm is built on the principles of trend, momentum, and volatility. There are six core components in the NNFX trading algorithm:
1. Volatility - price volatility; e.g., Average True Range, True Range Double, Close-to-Close, etc.
2. Baseline - a moving average to identify price trend
3. Confirmation 1 - a technical indicator used to identify trends
4. Confirmation 2 - a technical indicator used to identify trends
5. Continuation - a technical indicator used to identify trends
6. Volatility/Volume - a technical indicator used to identify volatility/volume breakouts/breakdown
7. Exit - a technical indicator used to determine when a trend is exhausted
What is Volatility in the NNFX trading system?
In the NNFX (No Nonsense Forex) trading system, ATR (Average True Range) is typically used to measure the volatility of an asset. It is used as a part of the system to help determine the appropriate stop loss and take profit levels for a trade. ATR is calculated by taking the average of the true range values over a specified period.
True range is calculated as the maximum of the following values:
-Current high minus the current low
-Absolute value of the current high minus the previous close
-Absolute value of the current low minus the previous close
ATR is a dynamic indicator that changes with changes in volatility. As volatility increases, the value of ATR increases, and as volatility decreases, the value of ATR decreases. By using ATR in NNFX system, traders can adjust their stop loss and take profit levels according to the volatility of the asset being traded. This helps to ensure that the trade is given enough room to move, while also minimizing potential losses.
Other types of volatility include True Range Double (TRD), Close-to-Close, and Garman-Klass
What is a Baseline indicator?
The baseline is essentially a moving average, and is used to determine the overall direction of the market.
The baseline in the NNFX system is used to filter out trades that are not in line with the long-term trend of the market. The baseline is plotted on the chart along with other indicators, such as the Moving Average (MA), the Relative Strength Index (RSI), and the Average True Range (ATR).
Trades are only taken when the price is in the same direction as the baseline. For example, if the baseline is sloping upwards, only long trades are taken, and if the baseline is sloping downwards, only short trades are taken. This approach helps to ensure that trades are in line with the overall trend of the market, and reduces the risk of entering trades that are likely to fail.
By using a baseline in the NNFX system, traders can have a clear reference point for determining the overall trend of the market, and can make more informed trading decisions. The baseline helps to filter out noise and false signals, and ensures that trades are taken in the direction of the long-term trend.
What is a Confirmation indicator?
Confirmation indicators are technical indicators that are used to confirm the signals generated by primary indicators. Primary indicators are the core indicators used in the NNFX system, such as the Average True Range (ATR), the Moving Average (MA), and the Relative Strength Index (RSI).
The purpose of the confirmation indicators is to reduce false signals and improve the accuracy of the trading system. They are designed to confirm the signals generated by the primary indicators by providing additional information about the strength and direction of the trend.
Some examples of confirmation indicators that may be used in the NNFX system include the Bollinger Bands, the MACD (Moving Average Convergence Divergence), and the MACD Oscillator. These indicators can provide information about the volatility, momentum, and trend strength of the market, and can be used to confirm the signals generated by the primary indicators.
In the NNFX system, confirmation indicators are used in combination with primary indicators and other filters to create a trading system that is robust and reliable. By using multiple indicators to confirm trading signals, the system aims to reduce the risk of false signals and improve the overall profitability of the trades.
What is a Continuation indicator?
In the NNFX (No Nonsense Forex) trading system, a continuation indicator is a technical indicator that is used to confirm a current trend and predict that the trend is likely to continue in the same direction. A continuation indicator is typically used in conjunction with other indicators in the system, such as a baseline indicator, to provide a comprehensive trading strategy.
What is a Volatility/Volume indicator?
Volume indicators, such as the On Balance Volume (OBV), the Chaikin Money Flow (CMF), or the Volume Price Trend (VPT), are used to measure the amount of buying and selling activity in a market. They are based on the trading volume of the market, and can provide information about the strength of the trend. In the NNFX system, volume indicators are used to confirm trading signals generated by the Moving Average and the Relative Strength Index. Volatility indicators include Average Direction Index, Waddah Attar, and Volatility Ratio. In the NNFX trading system, volatility is a proxy for volume and vice versa.
By using volume indicators as confirmation tools, the NNFX trading system aims to reduce the risk of false signals and improve the overall profitability of trades. These indicators can provide additional information about the market that is not captured by the primary indicators, and can help traders to make more informed trading decisions. In addition, volume indicators can be used to identify potential changes in market trends and to confirm the strength of price movements.
What is an Exit indicator?
The exit indicator is used in conjunction with other indicators in the system, such as the Moving Average (MA), the Relative Strength Index (RSI), and the Average True Range (ATR), to provide a comprehensive trading strategy.
The exit indicator in the NNFX system can be any technical indicator that is deemed effective at identifying optimal exit points. Examples of exit indicators that are commonly used include the Parabolic SAR, the Average Directional Index (ADX), and the Chandelier Exit.
The purpose of the exit indicator is to identify when a trend is likely to reverse or when the market conditions have changed, signaling the need to exit a trade. By using an exit indicator, traders can manage their risk and prevent significant losses.
In the NNFX system, the exit indicator is used in conjunction with a stop loss and a take profit order to maximize profits and minimize losses. The stop loss order is used to limit the amount of loss that can be incurred if the trade goes against the trader, while the take profit order is used to lock in profits when the trade is moving in the trader's favor.
Overall, the use of an exit indicator in the NNFX trading system is an important component of a comprehensive trading strategy. It allows traders to manage their risk effectively and improve the profitability of their trades by exiting at the right time.
How does Loxx's GKD (Giga Kaleidoscope Modularized Trading System) implement the NNFX algorithm outlined above?
Loxx's GKD v1.0 system has five types of modules (indicators/strategies). These modules are:
1. GKD-BT - Backtesting module (Volatility, Number 1 in the NNFX algorithm)
2. GKD-B - Baseline module (Baseline and Volatility/Volume, Numbers 1 and 2 in the NNFX algorithm)
3. GKD-C - Confirmation 1/2 and Continuation module (Confirmation 1/2 and Continuation, Numbers 3, 4, and 5 in the NNFX algorithm)
4. GKD-V - Volatility/Volume module (Confirmation 1/2, Number 6 in the NNFX algorithm)
5. GKD-E - Exit module (Exit, Number 7 in the NNFX algorithm)
(additional module types will added in future releases)
Each module interacts with every module by passing data between modules. Data is passed between each module as described below:
GKD-B => GKD-V => GKD-C(1) => GKD-C(2) => GKD-C(Continuation) => GKD-E => GKD-BT
That is, the Baseline indicator passes its data to Volatility/Volume. The Volatility/Volume indicator passes its values to the Confirmation 1 indicator. The Confirmation 1 indicator passes its values to the Confirmation 2 indicator. The Confirmation 2 indicator passes its values to the Continuation indicator. The Continuation indicator passes its values to the Exit indicator, and finally, the Exit indicator passes its values to the Backtest strategy.
This chaining of indicators requires that each module conform to Loxx's GKD protocol, therefore allowing for the testing of every possible combination of technical indicators that make up the six components of the NNFX algorithm.
What does the application of the GKD trading system look like?
Example trading system:
Backtest: Strategy with 1-3 take profits, trailing stop loss, multiple types of PnL volatility, and 2 backtesting styles
Baseline: Hull Moving Average
Volatility/Volume: Hurst Exponent
Confirmation 1: Volatility Ratio Adaptive RSX as shown on the chart above
Confirmation 2: Williams Percent Range
Continuation: Fisher Transform
Exit: Rex Oscillator
Each GKD indicator is denoted with a module identifier of either: GKD-BT, GKD-B, GKD-C, GKD-V, or GKD-E. This allows traders to understand to which module each indicator belongs and where each indicator fits into the GKD protocol chain.
Giga Kaleidoscope Modularized Trading System Signals (based on the NNFX algorithm)
Standard Entry
1. GKD-C Confirmation 1 Signal
2. GKD-B Baseline agrees
3. Price is within a range of 0.2x Volatility and 1.0x Volatility of the Goldie Locks Mean
4. GKD-C Confirmation 2 agrees
5. GKD-V Volatility/Volume agrees
Baseline Entry
1. GKD-B Baseline signal
2. GKD-C Confirmation 1 agrees
3. Price is within a range of 0.2x Volatility and 1.0x Volatility of the Goldie Locks Mean
4. GKD-C Confirmation 2 agrees
5. GKD-V Volatility/Volume agrees
6. GKD-C Confirmation 1 signal was less than 7 candles prior
Volatility/Volume Entry
1. GKD-V Volatility/Volume signal
2. GKD-C Confirmation 1 agrees
3. Price is within a range of 0.2x Volatility and 1.0x Volatility of the Goldie Locks Mean
4. GKD-C Confirmation 2 agrees
5. GKD-B Baseline agrees
6. GKD-C Confirmation 1 signal was less than 7 candles prior
Continuation Entry
1. Standard Entry, Baseline Entry, or Pullback; entry triggered previously
2. GKD-B Baseline hasn't crossed since entry signal trigger
3. GKD-C Confirmation Continuation Indicator signals
4. GKD-C Confirmation 1 agrees
5. GKD-B Baseline agrees
6. GKD-C Confirmation 2 agrees
1-Candle Rule Standard Entry
1. GKD-C Confirmation 1 signal
2. GKD-B Baseline agrees
3. Price is within a range of 0.2x Volatility and 1.0x Volatility of the Goldie Locks Mean
Next Candle:
1. Price retraced (Long: close < close or Short: close > close )
2. GKD-B Baseline agrees
3. GKD-C Confirmation 1 agrees
4. GKD-C Confirmation 2 agrees
5. GKD-V Volatility/Volume agrees
1-Candle Rule Baseline Entry
1. GKD-B Baseline signal
2. GKD-C Confirmation 1 agrees
3. Price is within a range of 0.2x Volatility and 1.0x Volatility of the Goldie Locks Mean
4. GKD-C Confirmation 1 signal was less than 7 candles prior
Next Candle:
1. Price retraced (Long: close < close or Short: close > close )
2. GKD-B Baseline agrees
3. GKD-C Confirmation 1 agrees
4. GKD-C Confirmation 2 agrees
5. GKD-V Volatility/Volume Agrees
1-Candle Rule Volatility/Volume Entry
1. GKD-V Volatility/Volume signal
2. GKD-C Confirmation 1 agrees
3. Price is within a range of 0.2x Volatility and 1.0x Volatility of the Goldie Locks Mean
4. GKD-C Confirmation 1 signal was less than 7 candles prior
Next Candle:
1. Price retraced (Long: close < close or Short: close > close)
2. GKD-B Volatility/Volume agrees
3. GKD-C Confirmation 1 agrees
4. GKD-C Confirmation 2 agrees
5. GKD-B Baseline agrees
PullBack Entry
1. GKD-B Baseline signal
2. GKD-C Confirmation 1 agrees
3. Price is beyond 1.0x Volatility of Baseline
Next Candle:
1. Price is within a range of 0.2x Volatility and 1.0x Volatility of the Goldie Locks Mean
2. GKD-C Confirmation 1 agrees
3. GKD-C Confirmation 2 agrees
4. GKD-V Volatility/Volume Agrees
]█ Setting up the GKD
The GKD system involves chaining indicators together. These are the steps to set this up.
Use a GKD-C indicator alone on a chart
1. Inside the GKD-C indicator, change the "Confirmation Type" setting to "Solo Confirmation Simple"
Use a GKD-V indicator alone on a chart
**nothing, it's already useable on the chart without any settings changes
Use a GKD-B indicator alone on a chart
**nothing, it's already useable on the chart without any settings changes
Baseline (Baseline, Backtest)
1. Import the GKD-B Baseline into the GKD-BT Backtest: "Input into Volatility/Volume or Backtest (Baseline testing)"
2. Inside the GKD-BT Backtest, change the setting "Backtest Special" to "Baseline"
Volatility/Volume (Volatility/Volume, Backte st)
1. Inside the GKD-V indicator, change the "Testing Type" setting to "Solo"
2. Inside the GKD-V indicator, change the "Signal Type" setting to "Crossing" (neither traditional nor both can be backtested)
3. Import the GKD-V indicator into the GKD-BT Backtest: "Input into C1 or Backtest"
4. Inside the GKD-BT Backtest, change the setting "Backtest Special" to "Volatility/Volume"
5. Inside the GKD-BT Backtest, a) change the setting "Backtest Type" to "Trading" if using a directional GKD-V indicator; or, b) change the setting "Backtest Type" to "Full" if using a directional or non-directional GKD-V indicator (non-directional GKD-V can only test Longs and Shorts separately)
6. If "Backtest Type" is set to "Full": Inside the GKD-BT Backtest, change the setting "Backtest Side" to "Long" or "Short
7. If "Backtest Type" is set to "Full": To allow the system to open multiple orders at one time so you test all Longs or Shorts, open the GKD-BT Backtest, click the tab "Properties" and then insert a value of something like 10 orders into the "Pyramiding" settings. This will allow 10 orders to be opened at one time which should be enough to catch all possible Longs or Shorts.
Solo Confirmation Simple (Confirmation, Backtest)
1. Inside the GKD-C indicator, change the "Confirmation Type" setting to "Solo Confirmation Simple"
1. Import the GKD-C indicator into the GKD-BT Backtest: "Input into Backtest"
2. Inside the GKD-BT Backtest, change the setting "Backtest Special" to "Solo Confirmation Simple"
Solo Confirmation Complex without Exits (Baseline, Volatility/Volume, Confirmation, Backtest)
1. Inside the GKD-V indicator, change the "Testing Type" setting to "Chained"
2. Import the GKD-B Baseline into the GKD-V indicator: "Input into Volatility/Volume or Backtest (Baseline testing)"
3. Inside the GKD-C indicator, change the "Confirmation Type" setting to "Solo Confirmation Complex"
4. Import the GKD-V indicator into the GKD-C indicator: "Input into C1 or Backtest"
5. Inside the GKD-BT Backtest, change the setting "Backtest Special" to "GKD Full wo/ Exits"
6. Import the GKD-C into the GKD-BT Backtest: "Input into Exit or Backtest"
Solo Confirmation Complex with Exits (Baseline, Volatility/Volume, Confirmation, Exit, Backtest)
1. Inside the GKD-V indicator, change the "Testing Type" setting to "Chained"
2. Import the GKD-B Baseline into the GKD-V indicator: "Input into Volatility/Volume or Backtest (Baseline testing)"
3. Inside the GKD-C indicator, change the "Confirmation Type" setting to "Solo Confirmation Complex"
4. Import the GKD-V indicator into the GKD-C indicator: "Input into C1 or Backtest"
5. Import the GKD-C indicator into the GKD-E indicator: "Input into Exit"
6. Inside the GKD-BT Backtest, change the setting "Backtest Special" to "GKD Full w/ Exits"
7. Import the GKD-E into the GKD-BT Backtest: "Input into Backtest"
Full GKD without Exits (Baseline, Volatility/Volume, Confirmation 1, Confirmation 2, Continuation, Backtest)
1. Inside the GKD-V indicator, change the "Testing Type" setting to "Chained"
2. Import the GKD-B Baseline into the GKD-V indicator: "Input into Volatility/Volume or Backtest (Baseline testing)"
3. Inside the GKD-C 1 indicator, change the "Confirmation Type" setting to "Confirmation 1"
4. Import the GKD-V indicator into the GKD-C 1 indicator: "Input into C1 or Backtest"
5. Inside the GKD-C 2 indicator, change the "Confirmation Type" setting to "Confirmation 2"
6. Import the GKD-C 1 indicator into the GKD-C 2 indicator: "Input into C2"
7. Inside the GKD-C Continuation indicator, change the "Confirmation Type" setting to "Continuation"
8. Inside the GKD-BT Backtest, change the setting "Backtest Special" to "GKD Full wo/ Exits"
9. Import the GKD-E into the GKD-BT Backtest: "Input into Exit or Backtest"
Full GKD with Exits (Baseline, Volatility/Volume, Confirmation 1, Confirmation 2, Continuation, Exit, Backtest)
1. Inside the GKD-V indicator, change the "Testing Type" setting to "Chained"
2. Import the GKD-B Baseline into the GKD-V indicator: "Input into Volatility/Volume or Backtest (Baseline testing)"
3. Inside the GKD-C 1 indicator, change the "Confirmation Type" setting to "Confirmation 1"
4. Import the GKD-V indicator into the GKD-C 1 indicator: "Input into C1 or Backtest"
5. Inside the GKD-C 2 indicator, change the "Confirmation Type" setting to "Confirmation 2"
6. Import the GKD-C 1 indicator into the GKD-C 2 indicator: "Input into C2"
7. Inside the GKD-C Continuation indicator, change the "Confirmation Type" setting to "Continuation"
8. Import the GKD-C Continuation indicator into the GKD-E indicator: "Input into Exit"
9. Inside the GKD-BT Backtest, change the setting "Backtest Special" to "GKD Full w/ Exits"
10. Import the GKD-E into the GKD-BT Backtest: "Input into Backtest"
Baseline + Volatility/Volume (Baseline, Volatility/Volume, Backtest)
1. Inside the GKD-V indicator, change the "Testing Type" setting to "Baseline + Volatility/Volume"
2. Inside the GKD-V indicator, make sure the "Signal Type" setting is set to "Traditional"
3. Import the GKD-B Baseline into the GKD-V indicator: "Input into Volatility/Volume or Backtest (Baseline testing)"
4. Inside the GKD-BT Backtest, change the setting "Backtest Special" to "Baseline + Volatility/Volume"
5. Import the GKD-V into the GKD-BT Backtest: "Input into C1 or Backtest"
6. Inside the GKD-BT Backtest, change the setting "Backtest Type" to "Full". For this backtest, you must test Longs and Shorts separately
7. To allow the system to open multiple orders at one time so you can test all Longs or Shorts, open the GKD-BT Backtest, click the tab "Properties" and then insert a value of something like 10 orders into the "Pyramiding" settings. This will allow 10 orders to be opened at one time which should be enough to catch all possible Longs or Shorts.
█ GKD-C Volatility Ratio Adaptive RSX
What is the RSX?
The Jurik RSX is a technical indicator developed by Mark Jurik to measure the momentum and strength of price movements in financial markets, such as stocks, commodities, and currencies. It is an advanced version of the traditional Relative Strength Index (RSI), designed to offer smoother and less lagging signals compared to the standard RSI.
The main advantage of the Jurik RSX is that it provides more accurate and timely signals for traders and analysts, thanks to its improved calculation methods that reduce noise and lag in the indicator's output. This enables better decision-making when analyzing market trends and potential trading opportunities.
What is the Voaltility Ratio?
The volatility ratio is a technical analysis indicator used by traders and investors to measure the relative volatility of a financial instrument, such as stocks, commodities, or forex. It is calculated by comparing the True Range (TR) of the instrument to its average range over a specified period, typically expressed as a percentage. The higher the volatility ratio, the more volatile the instrument is considered to be.
The formula for the volatility ratio is:
Volatility Ratio (VR) = (Today's True Range) / (Average True Range over a specified period)
Where:
Today's True Range is the highest value among:
Current High - Current Low
Current High - Previous Close
Current Low - Previous Close
Average True Range (ATR) is the average of the True Range values over a specified period, typically 14 days.
Traders and investors use the volatility ratio to gauge the risk associated with a particular instrument and to identify potential entry and exit points. A high volatility ratio can signal strong price movements, while a low ratio may indicate stability or stagnation in price. The volatility ratio can also be used in conjunction with other technical indicators to create a more comprehensive trading strategy.
What is Volatility Ratio Adaptive RSX?
For this indicator the calculation of volatility is changed to the following:
Volatility Ratio (VR) = (Standard Deviation of Price) / (Simple Moving Average of Standard Deviation over a specified period)
Where:
src: source data (typically closing prices) of the financial instrument.
per: the period over which the standard deviation and simple moving average are calculated.
This version of the Volatility Ratio helps identify periods of high or low price volatility relative to the historical average over the specified period. A value above 1 indicates higher than average volatility, while a value below 1 suggests lower than average volatility. Traders and investors can use this indicator to assess the risk of a particular instrument, determine market sentiment, or identify potential trading opportunities.
What this looks like inside:
This code defines two functions, rsx() and volatratio(), and then calculates the Volatility Ratio Adaptive RSX by combining their outputs.
1. rsx(src, len, speed): This function calculates the Adaptive RSX (Relative Strength Index) based on the input source data (src), the lookback period (len), and the speed factor (speed). The function computes a smoothed version of the price momentum (mom_out) and its absolute version (moa_out) using an iterative process. The final output, rsiout, is the Adaptive RSX oscillator value, which is calculated by normalizing the momentum ratio to the 0-100 range.
2. volatratio(src, per): This function calculates the Volatility Ratio using the input source data (src) and the lookback period (per). It computes the standard deviation (dev) and its simple moving average (devavg) over the specified period, and then calculates the Volatility Ratio by dividing the standard deviation by its average.
The main part of the code calculates the Volatility Ratio Adaptive RSX using the rsx() and volatratio() functions:
-volRatio = volatratio(src, inpPeriod): It calculates the Volatility Ratio using the input source data (src) and the lookback period (inpPeriod).
-rsxout = _rsx(src, int(inpPeriod/volRatio), inpSpeed): It calculates the Adaptive RSX using the input source data (src), the adjusted lookback period (which is the original period divided by the Volatility Ratio), and the speed factor (inpSpeed).
The final output, rsxout, represents the Volatility Ratio Adaptive RSX oscillator. Traders can use this oscillator to identify potential entry and exit points, confirm trends, or detect price reversals based on overbought or oversold conditions.
Requirements
Inputs
Confirmation 1: GKD-V Volatility / Volume indicator
Confirmation 2: GKD-C Confirmation indicator
Continuation: GKD-C Confirmation indicator
Solo Confirmation Simple: GKD-B Baseline
Solo Confirmation Complex: GKD-V Volatility / Volume indicator
Solo Confirmation Super Complex: GKD-V Volatility / Volume indicator
Stacked 1: None
Stacked 2+: GKD-C, GKD-V, or GKD-B Stacked 1
Outputs
Confirmation 1: GKD-C Confirmation 2 indicator
Confirmation 2: GKD-C Continuation indicator
Continuation: GKD-E Exit indicator
Solo Confirmation Simple: GKD-BT Backtest
Solo Confirmation Complex: GKD-BT Backtest or GKD-E Exit indicator
Solo Confirmation Super Complex: GKD-C Continuation indicator
Stacked 1: GKD-C, GKD-V, or GKD-B Stacked 2+
Stacked 2+: GKD-C, GKD-V, or GKD-B Stacked 2+ or GKD-BT Backtest
Additional features will be added in future releases.

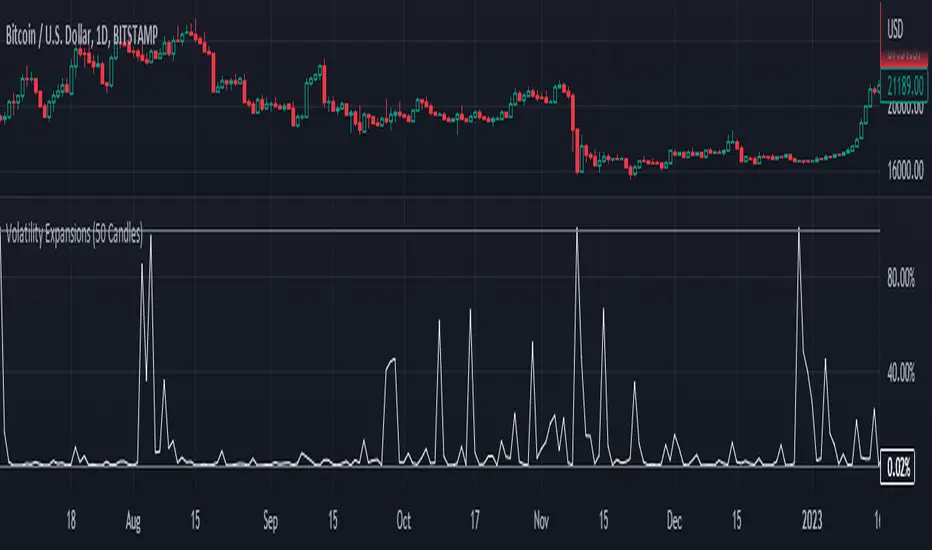
Fixed Volatility OscillatorA fixed volatility plotter set to a 0-100 range - Plots the current volatility % using the formula to calculate volatility and stdev (standard deviation) based on the candle lookback.
The indicator is Fixed, which means that regardless of the chart, the volatility will be plotted on a percentage of 0% - 100% with a 101% threshold set to indicate a volatility reset. While the volume of volatility will change depending on the chart, the volatility will ALWAYS stay within this range.
if a plot exceeds 100% it should be marked as volatility reset - not an expansion
and should also be noted that the volatility spikes are also very inconsistent in volume and vary greatly.
The candle lookbacks on standard are organized be from 10 candles to 100 candles. I found the best results using the 50 candles lookback, and therefore have set it as the default value. These different values can be used to pull the information from the # of candles on the selected option - and therefore the volatility will be calculated from the number of candles selected.
// note for other people versed in pinescript
While this indicator may be useful in trading or strategies, it is more meant to incorporated into other scripts or used as a basis that can be further expanded on. The visuals are not built at all - for that purpose.
This script has not been listed as a library for the fact that it can be used as an actual indicator within a strategy - hope you enjoy.
Implied Volatility Suite (TG Fork)Displays the Implied Volatility, which is usually calculated from options, but here is calculated indirectly from spot price directly, either using a model or model-free using the VIXfix.
The model-free VIXfix based approach can detect times of high volatility, which usually coincides with panic and hence lowest prices. Inversely, the model-based approach can detect times of highest greed.
Forked and updated by Tartigradia to fix some issues in the calculations, convert to pinescript v5 and reverse engineered to reproduce the "Implied Volatility Rank & Model Free IVR" indicator by the same author (but closed source) and allow to plot both model-based and model-free implied volatilities simultaneously.
If you like this indicator, please show the original author SegaRKO some love:
Implied Volatility SuiteThis is an updated, more robust, and open source version of my 2 previous scripts : "Implied Volatility Rank & Model-Free IVR" and "IV Rank & IV Percentile".
This specific script provides you with 4 different types of volatility data: 1)Implied volatility, 2) Implied Volatility Rank, 3)Implied Volatility Percentile, 4)Skew Index.
1) Implied Volatility is the market's forecast of a likely movement, usually 1 standard deviation, in a securities price.
2) Implied Volatility Rank, ranks IV in relation to its high and low over a certain period of time. For example if over the past year IV had a high of 20% and a low of 10% and is currently 15%; the IV rank would be 50%, as 15 is 50% of the way between 10 & 20. IV Rank is mean reverting, meaning when IV Rank is high (green) it is assumed that future volatility will decrease; while if IV rank is low (red) it is assumed that future volatility will increase.
3) Implied Volatility Percentile ranks IV in relation to how many previous IV data points are less than the current value. For example if over the last 5 periods Implied volatility was 10%,12%,13%,14%,20%; and the current implied volatility is 15%, the IV percentile would be 80% as 4 out of the 5 previous IV values are below the current IV of 15%. IV Percentile is mean reverting, meaning when IV Percentile is high (green) it is assumed that future volatility will decrease; while if IV percentile is low (red) it is assumed that future volatility will increase. IV Percentile is more robust than IV Rank because, unlike IV Rank which only looks at the previous highs and lows, IV Percentile looks at all data points over the specified time period.
4)The skew index is an index I made that looks at volatility skew. Volatility Skew compares implied volatility of options with downside strikes versus upside strikes. If downside strikes have higher IV than upside strikes there is negative volatility skew. If upside strikes have higher IV than downside strikes then there is positive volatility skew. Typically, markets have a negative volatility skew, this has been the case since Black Monday in 1987. All negative skew means is that projected option contract prices tend to go down over time regardless of market conditions.
Additionally, this script provides two ways to calculate the 4 data types above: a)Model-Based and b)VixFix.
a) The Model-Based version calculates the four data types based on a model that projects future volatility. The reason that you would use this version is because it is what is most commonly used to calculate IV, IV Rank, IV Percentile, and Skew; and is closest to real world IV values. This version is what is referred to when people normally refer to IV. Additionally, the model version of IV, Rank, Percentile, and Skew are directionless.
b) The VixFix version calculates the four data types based on the VixFix calculation. The reason that you would use this version is because it is based on past price data as opposed to a model, and as such is more sensitive to price action. Additionally, because the VixFix is meant to replicate the VIX Index (except it can be applied to any asset) it, just like the real VIX, does have a directional element to it. Because of this, VixFix IV, Rank, and Percentile tend to increase as markets move down, and decrease as markets move up. VixFix skew, on the other hand, is directionless.
How to use this suite of tools:
1st. Pick the way you want your data calculated: either Model-Based or VixFix.
2nd. Input the various length parameters according to their labels:
If you're using the model-based version and are trading options input your time til expiry, including weekends and holidays. You can do so in terms of days, hours, and minutes. If you're using the model-based version but aren't trading options you can just use the default input of 365 days.
If you're using the VixFix version, input how many periods of data you want included in the calculation, this is labeled as "VixFix length". The default value used in this script is 252.
3rd. Finally, pick which data you want displayed from the dropdown menu: Implied Volatility, IV Rank, IV Percentile, or Volatility Skew Index.

Market Flow Volatility Oscillator (AiBitcoinTrend)The Market Flow Volatility Oscillator (AiBitcoinTrend) is a cutting-edge technical analysis tool designed to evaluate and classify market volatility regimes. By leveraging Gaussian filtering and clustering techniques, this indicator provides traders with clear insights into periods of high and low volatility, helping them adapt their strategies to evolving market conditions. Built for precision and clarity, it combines advanced mathematical models with intuitive visual feedback to identify trends and volatility shifts effectively.
👽 How the Indicator Works
👾 Volatility Classification with Gaussian Filtering
The indicator detects volatility levels by applying Gaussian filters to the price series. Gaussian filters smooth out noise while preserving significant price movements. Traders can adjust the smoothing levels using sigma parameters, enabling greater flexibility:
Low Sigma: Emphasizes short-term volatility.
High Sigma: Captures broader trends with reduced sensitivity to small fluctuations.
👾 Clustering Algorithm for Regime Detection
The core of this indicator is its clustering model, which classifies market conditions into two distinct regimes:
Low Volatility Regime: Calm periods with reduced market activity.
High Volatility Regime: Intense periods with heightened price movements.
The clustering process works as follows:
A rolling window of data is analyzed to calculate the standard deviation of price returns.
Two cluster centers are initialized using the 25th and 75th percentiles of the data distribution.
Each price volatility value is assigned to the nearest cluster based on its distance to the centers.
The cluster centers are refined iteratively, providing an accurate and adaptive classification.
👾 Oscillator Generation with Slope R-Values
The indicator computes Gaussian filter slopes to generate oscillators that visualize trends:
Oscillator Low: Captures low-frequency market behavior.
Oscillator High: Tracks high-frequency, faster-changing trends.
The slope is measured using the R-value of the linear regression fit, scaled and adjusted for easier interpretation.
👽 Applications
👾 Trend Trading
When the oscillator rises above 0.5, it signals potential bullish momentum, while dips below 0.5 suggest bearish sentiment.
👾 Pullback Detection
When the oscillator peaks, especially in overbought or oversold zones, provide early warnings of potential reversals.
👽 Indicator Settings
👾 Oscillator Settings
Sigma Low/High: Controls the smoothness of the oscillators.
Smaller Values: React faster to price changes but introduce more noise.
Larger Values: Provide smoother signals with longer-term insights.
👾 Window Size and Refit Interval
Window Size: Defines the rolling period for cluster and volatility calculations.
Shorter windows: adapt faster to market changes.
Longer windows: produce stable, reliable classifications.
Disclaimer: This information is for entertainment purposes only and does not constitute financial advice. Please consult with a qualified financial advisor before making any investment decisions.
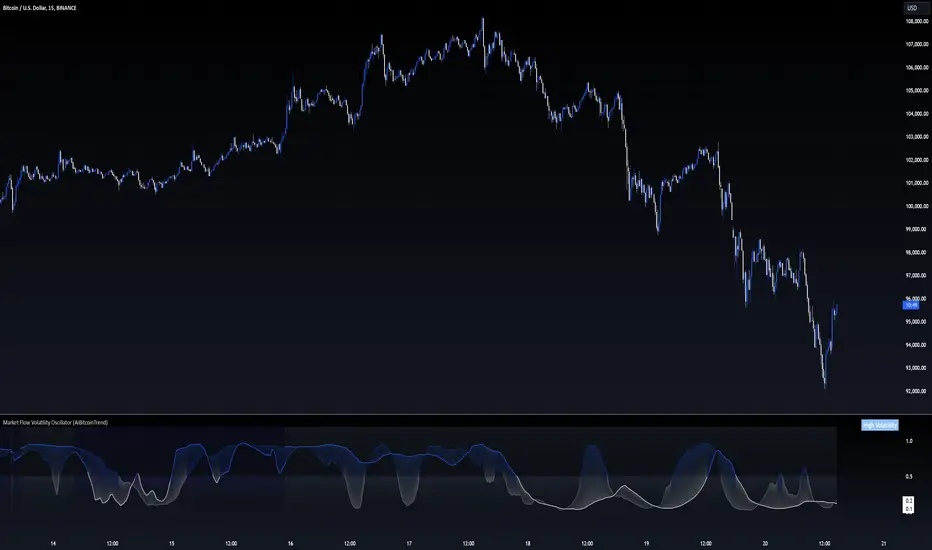
Bollinger Bands Adjusted for VolatilityDescription:
The Bollinger Bands Adjusted for Volatility is an advanced technical indicator designed to combine the precision of smoothed Bollinger Bands with the adaptability of linear regression for volatility analysis. This tool offers traders a dynamic way to visualize market trends while accounting for recent price movements and fluctuations in volatility.
Core Functionality:
Exponential Moving Average (EMA):
The indicator begins by calculating an Exponential Moving Average (EMA) over a user-defined period. This serves as the foundational trendline, smoothing out short-term fluctuations to highlight the overall trend.
Linear Regression Smoothing:
To account for price trends with greater precision, a Linear Regression line is calculated over a specified period.
The linear regression output is further smoothed using an EMA, ensuring a responsive yet stable representation of the price trend.
Standard Deviation and Volatility:
The indicator computes the standard deviation of the closing prices over the EMA period, dynamically capturing market volatility.
This measure of volatility is then integrated into the calculation of the upper and lower bands.
Smoothed Bollinger Bands:
The upper and lower bands are constructed by adjusting the smoothed linear regression line with the standard deviation, scaled by a user-defined multiplier.
This approach adapts to changing market conditions, offering a more nuanced view compared to traditional Bollinger Bands.
Visual Components:
EMA Line (Blue): A stable trendline that reflects the underlying market direction.
Upper Band (Red): Represents the upper boundary, adjusted for volatility and smoothed by linear regression.
Lower Band (Green): Marks the lower boundary, providing a measure of support based on volatility.
Band Fill (Shaded Area): A dynamic fill between the upper and lower bands for enhanced visualization of the price range.
Advanced Concepts:
Volatility-Responsive Bands:
By integrating the standard deviation into the bands and smoothing with linear regression, the indicator reacts effectively to market dynamics, widening during high volatility and contracting during low volatility.
Trend Adaptation:
The smoothed linear regression ensures that the bands align closely with the prevailing market trend, reducing noise and improving accuracy.
Applications:
Trend Identification:
Use the EMA and the central smoothed linear regression to identify the primary trend.
Observe price interaction with the upper and lower bands for potential trend continuations or reversals.
Volatility-Based Strategies:
Monitor band expansions and contractions to gauge shifts in market volatility.
Trade breakouts or reversals when the price breaches the bands under extreme conditions.
Support and Resistance:
The upper and lower bands act as dynamic support and resistance levels, adapting to the current market environment.
Disclaimer:
This indicator is provided for informational and educational purposes only. It does not constitute financial advice. Users should exercise caution and perform their own analysis when making trading decisions.

The Ultimate ATR-BBW Market Volatility Indicator"The ATR-BBW Market Volatility Indicator combines the Average True Range (ATR) and Bollinger Bands Width (BBW) to provide a measure of market volatility. This indicator does not indicate bullish or bearish trends, but rather the magnitude of price fluctuations.
* Usage: When the indicator moves upward, it suggests increasing market volatility, indicating that prices are moving within a wider range. Conversely, a downward movement implies decreasing volatility, signifying that prices are moving within a narrower range.
* Note: This sub-indicator solely reflects market volatility and does not provide buy or sell signals.
Investing involves risk. Please conduct thorough research before making any investment decisions.
ATR and BBW Explained:
* Average True Range (ATR): ATR is a technical analysis indicator used to measure market volatility. It calculates the average of a series of true ranges, where the true range is the greatest of the following:
* The current high minus the current low
* The absolute value of the current high minus the previous close
* The absolute value of the current low minus the previous close
* A higher ATR value indicates higher volatility, while a lower value suggests lower volatility.
* Bollinger Bands Width (BBW): Bollinger Bands are plotted two standard deviations above and below a simple moving average. BBW measures the distance between the upper and lower bands. A wider BBW indicates higher volatility, as prices are moving further away from the moving average. Conversely, a narrower BBW suggests lower volatility.
Combining ATR and BBW:
By combining ATR and BBW, the ATR-BBW indicator provides a more comprehensive view of market volatility. ATR captures the overall volatility of the market, while BBW measures the volatility relative to the moving average. Together, they provide a more robust indicator of market conditions and can be used to identify potential trading opportunities.
Why ATR and BBW are Effective for Measuring Volatility:
* ATR directly measures the actual price movement, regardless of the direction.
* BBW shows how much prices are deviating from their average, indicating the strength of the current trend.
* Combined: By combining these two measures, the ATR-BBW indicator provides a more comprehensive and accurate assessment of market volatility.
In essence, the ATR-BBW indicator helps traders understand the magnitude of price fluctuations, allowing them to make more informed trading decisions.

Implied Volatility WallsThe Implied Volatility Walls (IVW) indicator is a powerful and advanced trading tool designed to help traders identify key market zones where price may encounter significant resistance or support based on volatility. Using implied volatility, historical volatility, and machine learning models, IVW provides traders with a comprehensive understanding of market dynamics. This indicator is especially useful for those who wish to forecast volatility-driven price movements and adjust their trading strategies accordingly.
How the Implied Volatility Walls (IVW) Works:
The Implied Volatility Walls (IVW) indicator uses a combination of historical price data and advanced machine learning algorithms to calculate key volatility levels and forecast future market conditions. It tracks cumulative volatility, identifies support and resistance zones, and detects liquidation bubbles to highlight critical price areas.
The main concept behind this tool is that price tends to move most of the time by the same amount, making it possible to average the past maximum excursion in order to obtain a validated area where traders can be able to see clearly that the price is moving more than normal.
This indicator primarily focuses on:
1. Volatility Zones: Potential support and resistance levels based on implied and historical volatility.
2. Machine Learning Volatility Forecast: A machine learning model that predicts high, medium, or low volatility for future market conditions.
3. Liquidation Detection: Highlights key areas of potential forced liquidations, where market participants may be forced out of their positions, often leading to significant price movements.
4. Backtesting and Win Rate: The indicator continuously monitors how effective its volatility-based predictions are, offering insights into the performance of its predictions.
Key Features:
1. Volatility Tracking:
- The IVW indicator calculates cumulative volatility by analyzing the range between the high and low prices over time. It also tracks volatility percentiles and separates the market conditions into high, medium, or low volatility zones, enabling traders to gauge how volatile the market is.
2. Volatility Walls (Upper and Lower Zones):
- Upper Volatility Wall (Red Zones): Represent resistance levels where the price might encounter difficulty moving higher due to excess in volatility. This zone is calculated based on the chosen percentile in the settings.
- Lower Volatility Wall (Blue Zones): Represent support levels where price may find buying support.
- These walls help traders visualize potential zones where reversals or breakouts could occur based on volatility conditions.
3. Machine Learning Forecast:
- One of the standout features of the IVW indicator is its machine learning algorithm that estimates future volatility levels. It categorizes volatility into high, medium, and low based on recent data and provides forecasts on what the next market condition is likely to be.
- This forecast helps traders anticipate market conditions and adapt their strategies accordingly. It is displayed on the chart as "Exp. Vol", providing insight into the future expected volatility.
4. VIX Adjustments:
- The indicator can be adjusted using the well-known **VIX (Volatility Index)** to further refine its volatility predictions. This enables traders to incorporate market sentiment into their analysis, improving the accuracy of the predictions for different market conditions.
5. Liquidation Bubbles:
- The Liquidation Bubbles feature highlights areas where large forced selling or buying events may occur, which are usually accompanied by spikes in volatility and volume. These bubbles appear when price deviates significantly from moving averages with substantial volume increases, alerting traders to potential volatile moves.
- Red dots indicate likely forced liquidations on the upside, and blue dots indicate forced liquidations on the downside. These bubbles can help traders spot moments of market stress and potential price swings due to liquidations.
6. Dynamic Volatility Zones:
- IVW dynamically adjusts support and resistance levels as market conditions evolve. This allows traders to always have up-to-date and relevant information based on the latest volatility patterns.
7. Cumulative Volatility Histogram:
- At the bottom of the chart, the purple histogram represents cumulative volatility over time, giving traders a visual cue of whether volatility is building up or subsiding. This can provide early signals of market transitions from low to high volatility, aiding traders in timing their entries and exits more accurately.
8. Backtesting and Win Rate:
- The IVW indicator includes a backtesting function that monitors the success of its volatility predictions over a selected period. It shows a Win Rate (WR) percentage (with 33% meaning that the machine learning algorithm does not bring any edge), representing how often the indicator's predictions were correct. This metric is crucial for assessing the reliability of the model’s forecasts.
9. Opening Range:
- At the beginning of a new session, the indicator will plot two lines indicating the high and the low of the first candle of the new time frame chosen.
Chart Breakdown:
Below is a description of what users see when using the Implied Volatility Walls (IVW) indicator on the chart:
Volatility Walls:
- Red shaded zones at the top represent upper volatility walls (resistance zones), while blue shaded zones at the bottom represent lower volatility walls (support zones). These areas show where price is likely to react due to high or low volatility conditions.
Liquidation Bubbles:
- Red and blue dots plotted above and below the price represent **liquidation bubbles**, indicating moments of market stress where volatility and volume spikes may force market participants to exit positions.
Cumulative Volatility Histogram:
- The purple histogram at the bottom of the chart reflects the buildup of cumulative volatility over time. Higher bars suggest increased volatility, signaling the potential for large price movements, while smaller bars represent calmer market conditions.
Real-Time Support and Resistance Levels:
- Solid and dashed lines represent current and historical support and resistance levels, helping traders identify price zones that have historically acted as volatility-driven turning points.
Gradient Bar Colors:
- The price bars change color based on their proximity to the volatility walls, with different colors representing how close the price is to these key levels. This color gradient provides a quick visual cue of potential market turning points.
Data Tables Explained:
Table 1: **Volatility Information Table (Top Right Corner):
- EV: Expected Volatility (based on the VIX FIX calculation from Larry Williams).
- +V and -V: Represents the adjusted volatility for upward (+V) and downward (-V) movements.
- Exp. Vol: Shows the expected volatility condition for the next period (High, Medium, or Low) based on the machine learning algorithm.
- WR: The Win Rate based on the backtesting of previous volatility predictions (three outcomes, so base Win rate is 33%, and not 50%).
Table 2: Expected Cumulative Range (Top Right Corner of the separated pane):
- Exp. CR: Expected Cumulative Range based on a machine learning algorithm that calculate the most likely outcome (cumulative range) based on the past days and metrics.
How to Use the Indicator:
1. Identify Key Support and Resistance Levels:
- Use the upper (red) and lower (blue) volatility walls to identify zones where the price is likely to face resistance or support due to volatility dynamics.
2. Forecast Future Volatility:
- Pay attention to the Expected Vol field in the table to understand whether the machine learning model predicts high, medium, or low volatility for the next trading session.
3. Monitor Liquidation Bubbles:
- Watch for red and blue bubbles as they can signal significant market events where volatility and volume spikes may lead to sudden price reversals or continuations.
4. Use the Histogram to Gauge Market Conditions:
- The cumulative volatility histogram shows whether the market is entering a high or low volatility phase, helping you adjust your risk accordingly and making you able to identify the potential of the rest of the chosen session.
5. Backtesting Confidence:
- The Win Rate (WR) provides insight into how reliable the indicator’s predictions have been over the backtested period, giving you additional confidence in its future forecasts, remember that considering the 3 scenarios possible (high volatility, medium and low volatility), the standard win rate is 33%, and not 50%!.
Final Notes:
The Implied Volatility Walls (IVW) indicator is a powerful tool for volatility-based analysis, providing traders with real-time data on potential support and resistance levels, liquidation bubbles, and future market conditions. By leveraging a machine learning model for volatility forecasting, this tool helps traders stay ahead of the market’s volatility patterns and make informed decisions.
Disclaimer: This tool is for educational purposes only and should not be solely relied upon for trading decisions. Always perform your own research and risk management when trading.

Historical VolatilityThis script calculates the historical volatility of a given market using the standard deviation of its returns over a specified lookback period.
The indicator also includes a volatility Simple Moving Average (SMA), a VIX SMA, and the VIX index as reference market.
The script uses the inputs from the user to adjust the calculation, such as lookback period, volatility SMA period, and reference market.
The Historical Volatility indicator can be a useful tool for traders and investors who want to measure the degree of variation of a market's price over time, which can help them to better understand market trends and potential risks. This script is licensed under the Mozilla Public License 2.0, which means that it can be used, modified, and distributed under the terms of this license.
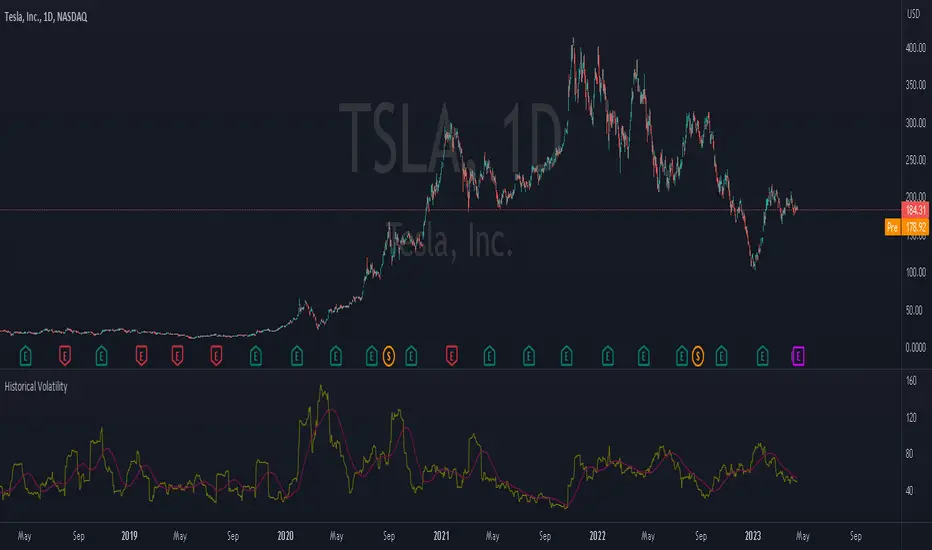
Integrated Volatility Intelligence System (IVIS)"Integrated Volatility Intelligence System (IVIS)", shorttitle="VolMind™: Adaptive Volatility Intelligence for Modern Markets"

Intraday Volatility BarsThis script produce a volatility histrogram by bar with the current volatility overlayed.
The histogram shows cumulative average volatility over n days.
And the dots are todays cumulative volatility.
In other words, it calculates the True Range of each bar and adds it to todays value.
This script is build for intraday timeframes between one and 1440 minutes only.
I use this to show me when volatility is above/below/equal to the average volatility.
When the dots are above the histogram then it is a more volatile day, and vice versa.
Recognizing a more volatile day as early as possible can be an advantage for daytrader.
Days that start with higher volatility seems to continue to increase relative to the past few days. Or when midday volatility rises it seems to continue as well.
Happy Trading!

Uptrick: Volatility Weighted CloudIntroduction
The Volatility Weighted Cloud (VWC) is a trend-tracking overlay that combines adaptive volatility-based bands with a multi-source smoothed price cloud to visualize market bias. It provides users with a dynamic structure that adapts to volatility conditions while maintaining a persistent visual record of trend direction. By incorporating configurable smoothing techniques, percentile-ranked volatility, and multi-line cloud construction, the indicator allows traders to interpret price context more effectively without relying on raw price movement alone.
Overview
The script builds a smoothed price basis using the open, and close prices independently, and uses these to construct a layered visual cloud. This cloud serves both as a reference for price structure and a potential area of dynamic support and resistance. Alongside this cloud, adaptive upper and lower bands are plotted using volatility that scales with percentile rank. When price closes above or below these bands, the script interprets that as a breakout and updates the trend bias accordingly.
Candle coloring is persistent and reflects the most recent confirmed signal. Labels can optionally be placed on the chart when the trend bias flips, giving traders additional visual reference points. The indicator is designed to be both flexible and visually compact, supporting different strategies and timeframes through its detailed configuration options.
Originality
This script introduces originality through its combined use of percentile-ranked volatility, adaptive envelope sizing, and multi-source cloud construction. Unlike static-band indicators, the Volatility Weighted Cloud adjusts its band width based on where current volatility ranks within a defined lookback range. This dynamic scaling allows for smoother signal behavior during low-volatility environments and more responsive behavior during high-volatility phases.
Additionally, instead of using a single basis line, the indicator computes two separate smoothed lines for open and close. These are rendered into a shaded visual cloud that reflects price structure more completely than traditional moving average overlays. The use of ALMA and MAD, both less commonly applied in volatility-band overlays, adds further control over smoothing behavior and volatility measurement, enhancing its adaptability across different market types.
Inputs
Group: Core
Basis Length (short-term): The number of bars used for calculating the primary basis line. Affects how quickly the basis responds to price changes.
Basis Type: Option to choose between EMA and ALMA. EMA provides a standard exponential average; ALMA offers a centered, Gaussian-weighted average with reduced lag.
ALMA Offset: Determines the balance point of the ALMA window. Only applies when ALMA is selected.
Sigma: Sets the width of the ALMA smoothing window, influencing how much smoothing is applied.
Basis Smoothing EMA: Adds additional EMA-based smoothing to the computed basis line for noise reduction.
Group: Volatility & Bands
Volatility: Choose between StDev (standard deviation) and MAD (median absolute deviation) for measuring price volatility.
Vol Length (short-term): Length of the window used for calculating volatility.
Vol Smoothing EMA: Smooths the raw volatility value to stabilize band behavior.
Min Multiplier: Minimum multiplier applied to volatility when forming the adaptive bands.
Max Multiplier: Maximum multiplier applied at high volatility percentile.
Volatility Rank Lookback: Number of bars used to calculate the percentile rank of current volatility.
Show Adaptive Bands: Enables or disables the display of upper and lower volatility bands on the chart.
Group: Trend Switch Labels
Show Trend Switch Labels: Toggles the appearance of labels when the trend direction changes.
Label Anchor: Defines whether the labels are anchored to recent highs/lows or to the main basis line.
ATR Length (offset): Length used for calculating ATR, which determines label offset distance.
ATR Offset (multiplier): Multiplies the ATR value to place labels away from price bars for better visibility.
Label Size: Allows selection of label size (tiny to huge) to suit different chart setups.
Features
Adaptive Volatility Bands: The indicator calculates volatility using either standard deviation or MAD. It then applies an EMA smoothing layer and scales the band width dynamically based on the percentile rank of volatility over a user-defined lookback window. This avoids fixed-width bands and allows the indicator to adapt to changing volatility regimes in real time.
Volatility Method Options: Users can switch between two volatility measurement methods:
➤ Standard Deviation (StDev): Captures overall price dispersion, but may be sensitive to spikes.
➤ Median Absolute Deviation (MAD): A more robust measure that reduces the effect of outliers, making the bands less jumpy during erratic price behavior.
Basis Type Options: The core price basis used for cloud and bands can be built from:
➤ Exponential Moving Average (EMA): Fast-reacting and widely used in trend systems.
➤ Arnaud Legoux Moving Average (ALMA): A smoother, more centered alternative that offers greater control through offset and sigma parameters.
Multi-Line Basis Cloud: The cloud is formed by plotting two individually smoothed basis lines from open and close prices. A filled area is created between the open and close basis lines. This cloud serves as a dynamic support or resistance zone, allowing users to identify possible reversal areas. Price moving through or rejecting from the cloud can be interpreted contextually, especially when combined with band-based signals.
Persistent Trend Bias Coloring: The indicator uses the last confirmed breakout (above upper band or below lower band) to determine bias. This bias is reflected in the color of every subsequent candle, offering a persistent visual cue until a new signal is triggered. It helps simplify trend recognition, especially in choppy or sideways markets.
Trend Switch Labels: When enabled, the script places labeled markers at the exact bar where the bias direction switches. Labels are anchored either to recent highs/lows or to the main basis line, and spaced vertically using an ATR-based offset. This allows the trader to quickly locate historical trend transitions.
Alert Conditions: Two built-in alert conditions are available:
➤ Long Signal: Triggered when the close crosses above the upper adaptive band.
➤ Short Signal: Triggered when the close crosses below the lower adaptive band.
These conditions can be used for custom alerts, automation, or external signaling tools.
Display Control and Flexibility: Users can disable the adaptive bands for a cleaner layout while keeping the basis cloud and candle coloring active. The indicator can be tuned for fast or slow response depending on the strategy in use, and is suitable for intraday, swing, or position trading.
Summary
The Volatility Weighted Cloud is a configurable trend-following overlay that uses adaptive volatility bands and a structured cloud system to help visualize market bias. By combining EMA or ALMA smoothing with percentile-ranked volatility and a four-line price structure, it provides a flexible and informative charting layer. Its key strengths lie in the use of dynamic envelopes, visually persistent trend indication, and clearly defined breakout zones that adapt to current volatility conditions.
Disclaimer
This indicator is for informational and educational purposes only. Trading involves risk and may not be suitable for all investors. Past performance does not guarantee future results.

TechniTrend: Average VolatilityTechniTrend: Average Volatility
Description:
The "Average Volatility" indicator provides a comprehensive measure of market volatility by offering three different types of volatility calculations: High to Low, Body, and Shadows. The indicator allows users to apply various types of moving averages (SMA, EMA, SMMA, WMA, and VWMA) on these volatility measures, enabling a more flexible approach to trend analysis and volatility tracking.
Key Features:
Customizable Volatility Types:
High to Low: Measures the range between the highest and lowest prices in the selected period.
Body: Measures the absolute difference between the opening and closing prices of each candle (just the body of the candle).
Shadows: Measures the difference between the wicks (shadows) of the candle.
Flexible Moving Averages:
Choose from five different types of moving averages to apply on the calculated volatility:
SMA (Simple Moving Average)
EMA (Exponential Moving Average)
SMMA (RMA) (Smoothed Moving Average)
WMA (Weighted Moving Average)
VWMA (Volume-Weighted Moving Average)
Custom Length:
Users can customize the period length for the moving averages through the Length input.
Visualization:
Three separate plots are displayed, each representing the average volatility of a different type:
Blue: High to Low volatility.
Green: Candle body volatility.
Red: Candle shadows volatility.
-------------------------------------------
This indicator offers a versatile and highly customizable tool for analyzing volatility across different components of price movement, and it can be adapted to different trading styles or market conditions.

CandelaCharts - OHLC Volatility Range Map 📝 Overview
Unlock the power of volatility analysis with the OHLC Volatility Range Map!
Volatility reveals the intensity and speed of price movements, often accompanied by manipulative wicks extending in the opposite direction of a candle’s close.
These sharp moves, common in volatile markets, are designed to mislead traders into taking positions against the prevailing trend. Such manipulation signals potential volatility spikes and offers key insights into market dynamics.
By analyzing these patterns, traders can anticipate the candle's distribution phase, where the price expands to new highs or lows during heightened volatility.
This phase provides crucial clues for spotting liquidity draws, retracement opportunities, and potential reversals, making the OHLC Volatility Range Map an indispensable tool for navigating fast-moving markets.
📦 Features
This tool offers a range of powerful features to enhance your trading analysis:
Real-time Data Feed : Stay updated with live candlestick stats, with each new candle updating OHLC data and performing ongoing historical calculations, even on sub-minute timeframes.
User-Friendly Interface : Designed for advanced traders, the intuitive interface allows easy navigation and customization of display settings, offering a personalized experience for data-driven analysis.
⚙️ Settings
Method: Sets the desired calculation algorithm.
Visualization: Controls the display modes.
Current volatility: Display the current-day volatility.
Use NY Midnight Open: Sets the day start
⚡️ Showcase
Here’s a visual showcase of the tool in action, highlighting its key features and capabilities:
Histogram
Barchart
📒 Usage
Here’s how you can use the OHLC Volatility Range Map to enhance your analysis:
Add OHLC Volatility Range Map to your Tradingview chart.
Watch at high-volatility zones that align with your analysis.
Combine this data with other models and insights to strengthen your trading strategy.
Example 1
By following these steps, you'll unlock powerful insights to refine and elevate your trading strategies.
🔹 Notes
Available calculation methods:
Mean
Median
🚨 Alerts
The indicator does not provide any alerts!
⚠️ Disclaimer
These tools are exclusively available on the TradingView platform.
Our charting tools are intended solely for informational and educational purposes and should not be regarded as financial, investment, or trading advice. They are not designed to predict market movements or offer specific recommendations. Users should be aware that past performance is not indicative of future results and should not rely on these tools for financial decisions. By using these charting tools, the purchaser agrees that the seller and creator hold no responsibility for any decisions made based on information provided by the tools. The purchaser assumes full responsibility and liability for any actions taken and their consequences, including potential financial losses or investment outcomes that may result from the use of these products.
By purchasing, the customer acknowledges and accepts that neither the seller nor the creator is liable for any undesired outcomes stemming from the development, sale, or use of these products. Additionally, the purchaser agrees to indemnify the seller from any liability. If invited through the Friends and Family Program, the purchaser understands that any provided discount code applies only to the initial purchase of Candela's subscription. The purchaser is responsible for canceling or requesting cancellation of their subscription if they choose not to continue at the full retail price. In the event the purchaser no longer wishes to use the products, they must unsubscribe from the membership service, if applicable.
We do not offer reimbursements, refunds, or chargebacks. Once these Terms are accepted at the time of purchase, no reimbursements, refunds, or chargebacks will be issued under any circumstances.
By continuing to use these charting tools, the user confirms their understanding and acceptance of these Terms as outlined in this disclaimer.
