Smart Money — Volume Panel + OBV Smart Money — Volume Panel + Scaled OBV
This indicator combines classic volume analysis with a scaled On-Balance Volume (OBV) line, helping spot smart money activity:
Volume bars – color changes dynamically:
🟢 green = high volume & OBV rising
🔴 red = high volume & OBV falling
🟠 orange = high volume but OBV neutral
⚪ gray = low volume
Yellow line – volume moving average (MA)
Purple line – high-volume threshold (MA × multiplier)
OBV line (green/red) – scaled OBV plotted in the same range as volume for easier comparison.
Cari skrip untuk "VOLUME BAR"

Volume Spike Analyzer(SMA10-Based)📊 **Volume Spike Analyzer (SMA10-Based)**
This indicator highlights abnormal volume activity by comparing current volume to the 10-period Simple Moving Average (SMA) of volume. It helps traders visually identify unusual activity that may precede breakouts, reversals, or news-driven moves.
---
🔧 **Features:**
• ✅ Colors volume bars:
• Green = Volume > SMA(10)
• Red = Volume ≤ SMA(10)
• ✅ Detects and labels spike levels:
• 🔶2x — Volume > 2x SMA(10)
• 🟢3x — Volume > 3x SMA(10)
• 🔴4x — Volume > 4x SMA(10)
• ✅ Built-in alerts for all 3 spike levels
---
📈 **Best Use Cases:**
• Confirm breakouts with strong volume
• Detect accumulation/distribution
• Filter low-volume setups
• Combine with VWAP/EMA for directional confirmation
---
⏱️ **Recommended Timeframes:**
• Intraday: 5m, 15m, 1h
• Also works on daily for swing trades
---
🧠 **Pro Tips:**
• Use with VWAP or EMA(20/50/200) for confluence
• Add SMA(Volume, 10) to your price chart for quick correlation
• Combine with candle pattern detection for signal validation
---

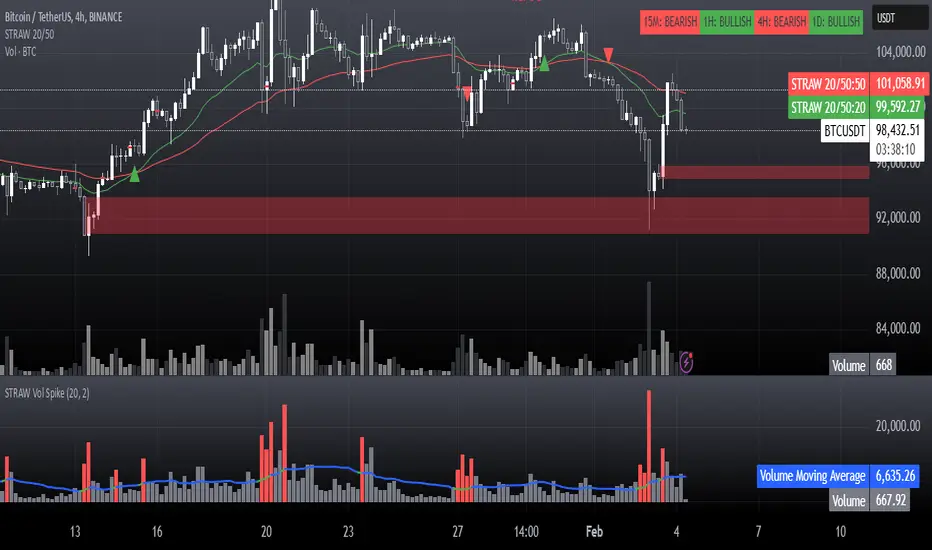
STRAW Volume Spike IndicatorThis is basically a:
High-Volume Impulse Detector
The High-Volume Impulse Detector is a refined tool designed to highlight key moments of explosive volume surges in the market, specifically calibrated for assets like Bitcoin on the 15-minute timeframe. Unlike generic volume-based indicators, this script doesn’t just flag high volume—it intelligently adapts to market dynamics by incorporating a custom-moving average baseline and highlighting instances where volume exceeds a significant threshold relative to the average.
Key Features
✅ Adaptive Volume Benchmark – Uses a dynamic moving average to filter out noise and pinpoint meaningful volume spikes.
✅ Impulse Confirmation – Only highlights volume bars that exceed the 50% threshold above the baseline, ensuring signals capture real liquidity shifts.
✅ Smart Color Coding – Differentiates high-impact bullish and bearish volume with distinct visual cues for easy market structure identification.
✅ Designed for Order Block Traders – Helps validate liquidity-driven price movements essential for refining order block and break-of-structure strategies.
Unlike conventional volume overlays, this tool helps traders connect volume surges to key structural shifts, making it an ideal companion for those navigating momentum shifts, market inefficiencies, and institutional footprints.
⚡ Best used on BTC 15m for tracking aggressive volume-driven moves in real-time.
Projected VolumeOverview
The indicator displays the expected volume up to the closing time of the session.
Calculations
The real volume is proportional to the projected volume, just as elapsed session time is proportional to entire trading session. Knowing the actual volume, the elapsed time of the session and the total time of the trading session, it is possible to find out the projected volume.
How It Works
On the last volume bar, the indicator shows the projected volume overlapped with the real volume.
How To Use
Assuming that any price movement is of little relevance if not confirmed with considerable volume, if a strong signal appears on the intraday chart but with low volume, we can overlook it as the projected volume on the daily chart is high and indicates that there is a high chance of directional movement for the day. In short, even if we have an entry signal with low volume on the intraday chart, it will still be viable to open a trade as long as on the daily chart the projected volume is high, i.e, above the moving average.
Inputs
Use 24 hours in Trading Hours input for nonstop markets, like crypto and forex, or set the specific trading hours for other market types like stocks. The projected volume will be displayed on all timeframes if the value is equal to 24. For other values it will be displayed on the 1-day chart only.

Trend Volume RSI AnalysisHOW'S THIS INDICATOR DIFFERENT ?
If you are familiar with my work, then you would know that I am into creating indicators with tons of parameters, almost all of which are left for you to configure. While this gives you an incredible level of customization, the feedback I received was that some of you felt a bit overwhelmed by them.
As such, I decided to create an incredibly simple, yet effective indicator that can give you a better overview of what's going on with the security you are trading/investing in without you needing to tweak a dozen parameters. So, the first and most obvious difference you will notice with Trend Volume RSI Analysis is that you have only 1 parameter to configure (length), one checkbox to tick (highlight buy/sell zones), and one dropdown menu to choose from (the type of analysis). All unnecessary features are stripped away and all calculations are done on the backend. Now let's see if this simplicity affects the efficiency of the indicator.
HOW DOES THE INDICATOR WORK?
1. Trend Analysis
The first type of analysis, selected by default, is the Trend. It shows the balance between bulls and bears and their respective strength. In order to filter out the noise and smooth out the graph, a moving average is applied twice - once from left to right, and once from right to left. Although this causes a minor delay, it is justified since the common moving averages lag is significantly reduced. The screenshot below shows an example of a small bull run on the 1h chart.
The indicator also performs very well in spotting divergences. Two divergences (bearish and bullish respectively) are illustrated in the screenshot below.
2. Volume Analysis
Volume Analysis doesn't just sum the standard volume of the trend. Rather, it calculates the effective volume - the one responsible for moving the price up or down and seeks the relationship between total volume and price movement. Thus, you get a smooth volume trendline that should prevent you from opening a position against the trend. As logic dictates, if the buying volume is growing, then the trendline will go up and it will be in green. If, however, the selling volume is growing, the trendline will decline and it will be in red. This analysis is better used on a bigger time frame, such as on a 4h chart.
Note: For those of you who have used my other indicator Multi Time Frame Effective Volume Profile, the formula used here is slightly different. The one used there is optimized for volume bars, while the modifications here deliver a slightly better trendline with less noise.
3. RSI Analysis
Contrary to the standard RSI which derives its results from price movement, this RSI is calculated based on the modified volume. So it's fair to say that it's a Volume RSI. This makes it a bit jerkier, almost something in between an RSI and Stochastics. However, it is much better in identifying divergences and will quickly indicate potential trends as it will start climbing up sooner. The screenshot below is on a 4h chart, but that's only because I want to show more examples. It works equally well on the 1h or even on a minute chart.
In the first example, the divergence is pretty obvious on all three indicators. However, in example 2 you would be able to spot it only on Trend Volume RSI Analysis and somewhat in Stochastics. RSI makes a double bottom there. Similar is the case with example 3, where this indicator is long gone on the way up in comparison to the other two. The difference in reaction comes from the supply and demand relationship, not just from the price movement. When bears are losing steam, the indicator detects this as a low supply level, thus printing the divergence or even climbing up to indicate the start of a new mini-trend.
I must note, however, that this part of the indicator must be used in accordance with the main trend (this is where the other two analyses come into play). You go long on a pullback when there's an established bull trend and you go short on a pullback when there's an established bear trend.
4. Additional Settings
I know, for an indicator with just one parameter this description is getting pretty long. There's only one thing left to cover - highlighting the buy/sell zones. It is fairly simple - when it's ON, the zones where bulls are stronger than bears will be highlighted in green. When the opposite is true, the background will be red. You can switch it OFF if it intervenes with your analysis, but I prefer having it as it shows a confluence of bull/bear force and the indicator itself. Here's an example below:
HOW MUCH DOES THIS INDICATOR COST ?
Although Trend Volume RSI Analysis may look like an incredibly simple indicator, I can assure you that a great deal of time, testing, and optimizing have gone into creating an indicator that does almost everything for you. The initial version was much more complex and a few dozen iterations were required to reach that level of simplicity and practicality. Furthermore, I will continue to update this indicator as well as introduce user-requested features if they will improve its overall performance. To find out more about how to gain access to this indicator, please use the provided information below or just message me . Thank you for your time.
Disclaimer: The purpose of all indicators is to indicate potential setups, which may lead to profitable results. No indicator is perfect and certainly, no indicator has a 100% success rate. They are subject to flaws, wrongful interpretation, bugs, etc. This indicator makes no exception. It must be used with a sound money management plan that puts the main emphasis on protecting your capital. Please, do not rely solely on any single indicator to make trading decisions instead of you. Indicators are storytellers, not fortune tellers. They help you see the bigger picture, not the future.

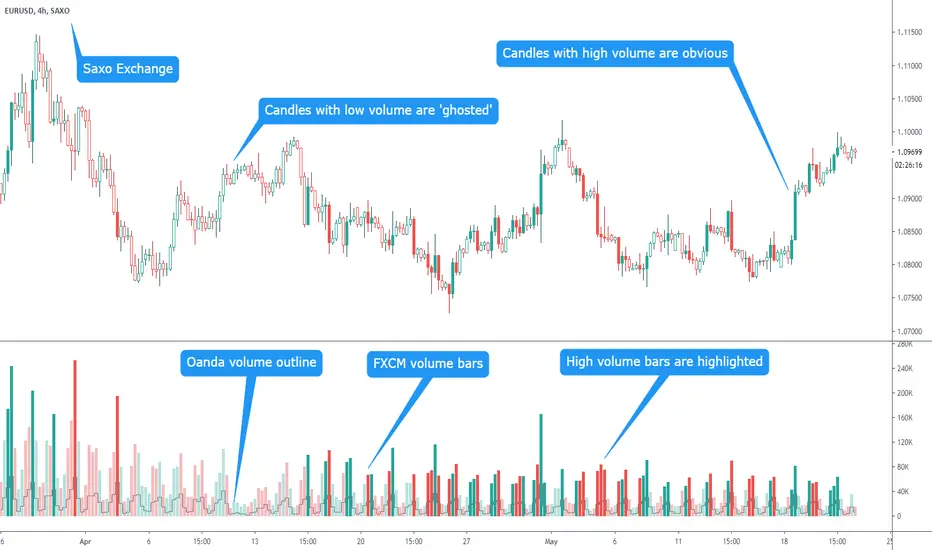
Multi-Exchange Volume w Candle HighlightI've been investigating the value of studying candle volume. I realised all the exchanges give different volume. So I've made an indicator that shows the volume from multiple exchanges.
You can choose a primary exchange for the main changes and a secondary exchange for a line chart in front. These exchanges are INDEPENDANT of the exchange you are looking at so if your broker does not show volume, you can use the volume supplied by another broker who does. For example, you might be looking at a chart from Saxo exchange (who I don't think supplies volume) but see volume from FXCM as the primary with pattern confirmation from Oanda as the secondary.
You'll can see the patterns are the same but FXCM has higher overall volume than Oanda
In addition you can choose to highlight the high volume bars and highlight the high volume candles.
I find it useful as I can look at a move and easily see whether there is volume behind it - if there is a move with low volume is it sustainable?
You have the option to switch all the extra features on and off so if you prefer you can just look at a classic volume chart whilst looking at a candle chart from an exchange that does not supply volume.
I'm honest as to whether I find my scripts useful in my trading (they are always technically correct) or not and I think this one is good.
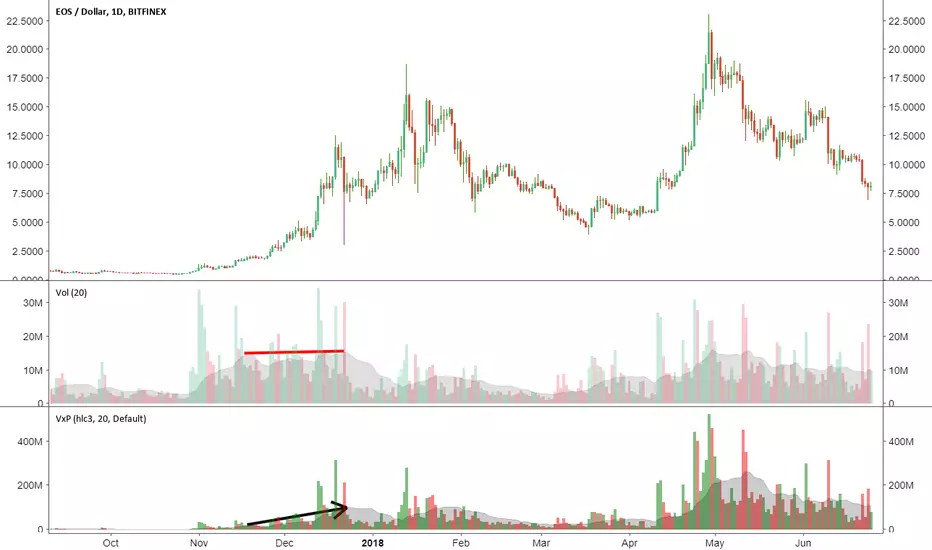
Volume x PriceThis is a simple indicator that calculates volume times price (money volume). Both asset volume and money volume are important indicators in TA. As you can see in the chart above, money volume (moving average) was increasing while the asset volume was not during late 2017. This could have led to wrong interpretations. Money volume becomes more important to consider when the difference in asset price is 'relatively' high.
Features:
- In addition to default options on volume indicator, it is possible to color volume bars based on "money flow multiplier" sign (close-(low+high)/2)
- Money factor can be disabled to show regular volume
Note: Most exchanges show asset volume but there are some like Bitmex that show money volume. Using this indicator on Bitmex type tickers should be avoided.
PS: I couldn't find any indicator for money volume so I had to develop this.
Your feedback is very welcome. If you know similar indicators, please let me know.
Hybrid Flow Master📊 Hybrid Flow Master - Professional Trading Indicator
Overview
Hybrid Flow Master is an advanced all-in-one trading indicator that combines Smart Money Concepts, institutional order flow analysis, and multi-timeframe confluence scoring to identify high-probability trade setups. Designed for both scalpers and swing traders across all markets (Forex, Crypto, Stocks, Indices).
🎯 Key Features
1. Intelligent Confluence System (0-100% Scoring) Proprietary scoring algorithm that weighs multiple factors Only signals when minimum confidence threshold is met
Real-time probability calculations for each setup Signal quality grading: A+, A, B, C ratings
2. Smart Money Concepts (SMC)
Automatic Order Block detection (bullish/bearish) Fair Value Gap (FVG) identification
Market structure analysis (Higher Highs, Lower Lows) Swing high/low tracking with visual markers
3. Multi-Timeframe Analysis
Higher timeframe trend filter for confluence Customizable HTF periods (1H, 4H, Daily, etc.)
Prevents counter-trend trades Aligns entries with major trends
4. Volume Flow Analysis
Volume spike detection with customizable thresholds Volume delta calculations (buying vs selling pressure) Institutional footprint identification Background highlighting for high-volume bars
5. Advanced Risk Management
ATR-based stop loss calculation Automatic take profit levels Customizable risk/reward ratios (1:1, 1:2, 1:3+) Visual SL/TP lines on chart Position sizing guidance
6. Professional Dashboard
Real-time HUD displaying:
Market bias (Bullish/Bearish/Neutral)
Higher timeframe trend status
Current confluence percentage
Volume status (Normal/High)
RSI reading with color coding
ATR volatility measure
Signal quality grade
7. Smart Alert System
Bullish confluence signals
Bearish confluence signals
Volume spike notifications
Customizable alert messages
Works with mobile app notifications
📈 What Makes It Unique?
✅ No Repainting - All signals are confirmed and final
✅ Probability-Based - Shows confidence level, not just binary signals
✅ Multi-Factor Confluence - Combines structure, volume, momentum, and HTF analysis
✅ Clean Interface - Toggle individual components on/off
✅ Works on All Timeframes - From 1-minute scalping to daily swing trading
✅ Universal Markets - Forex, Crypto, Stocks, Indices, Commodities
🎨 Customization Options
Adjustable swing detection length
Volume threshold settings
Minimum confluence score filter
Custom color schemes
Dashboard position (4 corners)
Show/hide individual components
Risk/reward ratio adjustment
ATR multiplier for stops
📊 Best Used For:
✔️ Scalping (1m - 15m charts)
✔️ Day Trading (15m - 1H charts)
✔️ Swing Trading (4H - Daily charts)
✔️ Trend Following
✔️ Reversal Trading
✔️ Breakout Trading
💡 How to Use:
Add indicator to chart - Works immediately with default settings Set your timeframe - Choose your trading style Wait for signals - Green BUY or Red SELL labels with confidence %
Check confluence score - Higher % = better quality setup Review dashboard - Confirm market bias and HTF trend Manage risk - Use provided SL/TP levels or adjust to your preference
Set alerts - Get notified of high-probability setups
⚙️ Recommended Settings:
For Scalping (1m-5m):
Swing Length: 5-7
Min Confluence: 70%
HTF: 15m or 1H
For Day Trading (15m-1H):
Swing Length: 10-15
Min Confluence: 60%
HTF: 4H or Daily
For Swing Trading (4H-Daily):
Swing Length: 15-20
Min Confluence: 50-60%
HTF: Weekly
📚 Indicator Components:
✦ Market Structure Detection
✦ Order Block Identification
✦ Fair Value Gaps (FVG)
✦ Volume Analysis
✦ RSI (14)
✦ MACD (12, 26, 9)
✦ ATR (14)
✦ Multi-Timeframe Trend
✦ Confluence Scoring Algorithm
🚀 Performance Notes:
Optimized for speed and efficiency Minimal CPU usage Clean chart presentation
Limited drawing objects (no chart clutter) Works on all TradingView plans
⚠️ Important Notes:
This indicator is a tool to assist trading decisions, not financial advice Always use proper risk management (1-2% per trade recommended) Backtest on your preferred market and timeframe
Combine with your own analysis and strategy Past performance does not guarantee future results
🔔 Alert Setup:
Right-click indicator name → "Add Alert" → Choose:
"Bullish Confluence Signal" for buy setups
"Bearish Confluence Signal" for sell setups
"Volume Spike Alert" for unusual activity
💬 Support:
For questions, suggestions, or custom modifications, feel free to message me directly through TradingView.

RSI Momentum ScalperOverview
The "RSI Momentum Scalper" is a Pine Script v5 strategy crafted for trading highly volatile markets, with a special focus on newly listed cryptocurrencies. This strategy harnesses the Relative Strength Index (RSI) alongside volume analysis and momentum thresholds to pinpoint short-term trading opportunities. It supports both long and short trades, managed with customizable take profit, stop loss, and trailing stop levels, which are visually plotted on the chart for easy tracking.
Why I Created This Strategy
I developed the "RSI Momentum Scalper" because I was seeking a reliable trading strategy tailored to newly listed, highly volatile cryptocurrencies. These assets often experience rapid price fluctuations, rendering traditional strategies less effective. I aimed to create a tool that could exploit momentum and volume spikes while managing risk through adaptable exit parameters. This strategy is designed to address that need, offering a flexible approach for traders in dynamic crypto markets.
How It Works
The strategy utilizes RSI to identify momentum shifts, combined with volume confirmation, to trigger long or short entries. Trades are controlled with take profit, stop loss, and trailing stop levels, which adjust dynamically as the price moves in your favor. The trailing stop helps lock in profits, while the plotted exit levels provide clear visual cues for trade management.
Customizable Settings
The script is highly customizable, allowing you to adjust it to various market conditions and trading styles. Here’s a brief overview of the key settings:
Trade Mode: Select "Both," "Long Only," or "Short Only" to determine the trade direction.
(Default: Both)
RSI Length: Sets the lookback period for the RSI calculation (2 to 30).
(Default: 8)
A shorter length increases RSI sensitivity, suitable for volatile assets.
RSI Overbought: Defines the upper RSI threshold (60 to 99) for short entries.
(Default: 90)
Higher values signal stronger overbought conditions.
RSI Oversold: Defines the lower RSI threshold (1 to 40) for long entries.
(Default: 10)
Lower values indicate stronger oversold conditions.
RSI Momentum Threshold: Sets the minimum RSI momentum change (1 to 15) to trigger entries.
(Default: 14)
Adjusts the sensitivity to price momentum.
Volume Multiplier: Multiplies the volume moving average to filter high-volume bars (1.0 to 3.0).
(Default: 1)
Higher values require stronger volume confirmation.
Volume MA Length: Sets the lookback period for the volume moving average (5 to 50).
(Default: 13)
Influences the volume trend sensitivity.
Take Profit %: Sets the profit target as a percentage of the entry price (0.1 to 10.0).
(Default: 4.15)
Determines when to close a winning trade.
Stop Loss %: Sets the loss limit as a percentage of the entry price (0.1 to 6.0).
(Default: 1.85)
Protects against significant losses.
Trailing Stop %: Sets the trailing stop distance as a percentage (0.1 to 4.0).
(Default: 2.55)
Locks in profits as the price moves favorably.
Visual Features
Exit Levels: Take profit (green), fixed stop loss (red), and trailing stop (orange) levels are plotted when in a position.
Performance Table: Displays win rate, total trades, and net profit in the top-right corner.
How to Use
Add the strategy to your chart in TradingView.
Adjust the input settings based on the cryptocurrency and timeframe you’re trading.
Monitor the plotted exit levels for trade management.
Use the performance table to assess the strategy’s performance over time.
Notes
Test the strategy on a demo account or with historical data before live trading.
The strategy is optimized for short-term scalping; adjust settings for longer timeframes if needed.

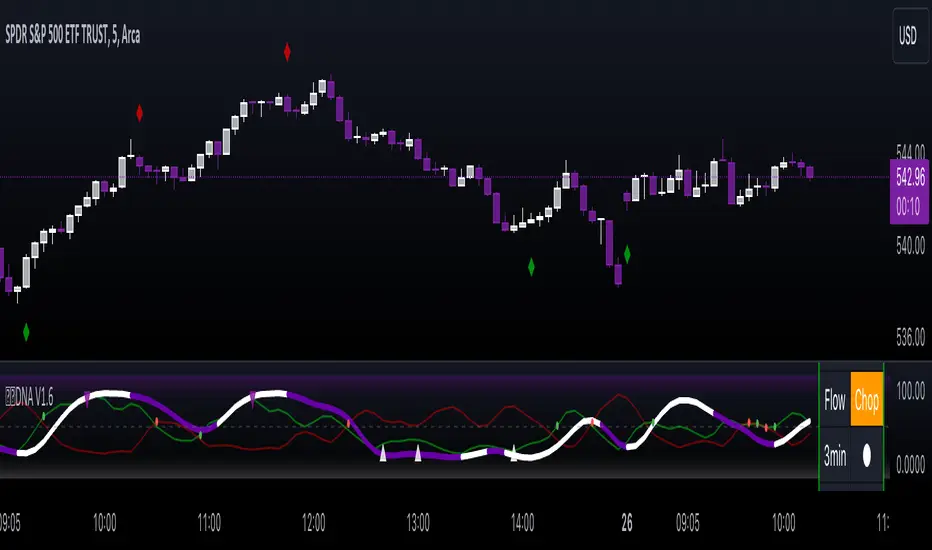
Gorb DNAIntroduction:
Gorb DNA is a versatile indicator using classic technical analysis components such as moving averages, stochastic oscillator, and histogram blending call/put flow analysis with our proprietary DNA algorithm. This indicator is designed to provide traders with useful market direction, volume, and momentum change visual cues.
Overview:
The Gorb DNA Indicator isn't just another momentum tool; it's a complex integration of innovative market analysis techniques.
By combining moving averages, stochastic oscillator, with proprietary algorithms, this indicator offers a multi-layered view of market trends, by merging call/put flow analysis with traditional market flow assessment.
This is designed for all kinds of traders, using a simple method to deliver visual changes in flow, volume, and momentum.
Core Features: Call/Put Flow & DNA
Call/Put Flow Analysis: This component examines the strength of market buying and selling pressures. It analyzes call (buying) and put (selling) flows using price range movements, providing insights smoothed over a defined period for analysis of market sentiment.
DNA Algorithm: A central feature of this indicator, the DNA algorithm utilizes a specialized moving average and oscillator technique to discern market trends. It presents an innovative approach, calculating the difference between bullish and bearish indicators to offer a detailed analysis of market momentum.
Visualization and Color Coding: The indicator employs a color-coded system for ease of interpretation, with distinct colors indicating different market conditions: white for upward/bullish movement and purple for downward/bearish movement. This feature translating complex data into a visual format that is simple to understand.
How Call/Put Flow Works:
Moving averages are used with volume and candlestick highs/lows over a specific range to help determine the overall flow. It then plots a colored line area that looks like a colored wave using just two colors to provide traders with a visual of the current market flow. This can help traders identify changes in sentiment with simple color cues.
How DNA Works:
A stochastic oscillator is used to measure the current price level relative to its price over a specific range period to analyze the momentum for the two DNA strands. Additionally moving averages are used to confirm trend and identify any divergences relative to the momentum. This is then plotted as two lines(DNA Strands) following the same color scheme as Call/Put Flow. When momentum is picking up in a specific direction, the lines will change colors and cross each other, this gives a visual of momentum now being fully on one side until it starts to change colors and flip that direction.
Custom Algorithm Elements:
Gorb DNA isn't just common tools combined into one indicator. It includes proprietary algorithmic elements tailored to enhance technical analysis and timing. These are the reasons what set this indicator apart from common momentum, sentiment, and volume methods.
We recommend experimenting with these features to choose what best suits your trading style.
Settings:
All skill-level friendly presets, easy to enable features with one-click
Call Flow: allows the user to plot a colored area that looks like waves showing increases/decreases in bullish volume (not to be followed blindly)
Put Flow: allows the user to plot a colored area that looks like waves showing increases/decreases in bearish volume (not to be followed blindly)
DNA Strand 1: allows the user to plot one of the algorithm lines to visualize momentum direction (not to be followed blindly)
DNA Strand 2: allows the user to plot one of the algorithm lines to visualize momentum direction (not to be followed blindly)
DNA Strength: allows the user to a histogram displaying momentum volume bars in the background
Flow Threshold: allows users to plot a dotted line to identify when call/put flow is now above average flow range
All colors are changeable for the user to customize to their liking
Call/Put Flow & DNA Demonstration
In the image below, we can see a basic illustration of how these core features function.
As stated above, call/put flow carefully monitors changes in moving averages, volume, and price action. If the market sentiment is shifting one direction, the call/put flow will plot those changes. If market is bullish, call flow should rise and put flow should decrease. The same goes for the opposite if the market is bearish.
As is the same for the DNA strands, if markets momentum is becoming bullish, the lines will change color and then cross to signify a change in momentum and the call flow in the background should match this change. This creates two layers of confluence in an easy understandable visual method.
Using Call/Put Flow
In the image below, we disabled everything but call flow to demonstrate usage.
On the left side of the image, you can see call flow matched price increase, then started to decline. This created a flow divergence, identifying a possible change in price action coming. This happened once flow crossed back below the threshold line and price then beginning to move lower. On the right side of the image, you can see call flow rising and price increasing. This is a good confluence showing there is bullish sentiment building in the market.
In this next image, we disabled everything but put flow to demonstrate usage.
The left side shows a put flow divergence. Put flow is slowly rising just like price is, this can help a trader identify a possible shift in sentiment coming. And on the right side, we have put flow rising above the threshold line and price beginning to decrease. Now we have confluence of bearish sentiment building in the market.
The image below shows only call & put flow enabled, to display what the above two images combined look like.
As you can see in the image above, these flow visuals help identify the underlying market sentiment. And when they cross, it leads to a change in price action in the direction of the sentiment over the threshold line.
Using DNA Strands
The image below has just DNA strands enabled to demonstrate usage.
On the left is a box highlighting bearish momentum cross. In the circles is the change in momentum shifting from bullish to bearish. The move gets stronger as the DNA strands get closer to cross over signifying strength in the move. On the right side is a box highlighting a bullish momentum cross. The circles again, show the change from bearish to bullish momentum. Like previously said, the move gets stronger as the DNA strands get closer to crossing over, signifying strength in that direction.
The next image shows call/put flow and DNA strands enabled for a full complete picture.
The circles labeled (1) are showing the change in momentum from bullish to bearish. Circle (2) shows call flow decreasing and put flow rising above calls. Finally the arrow points to the DNA strands crossing over and put flow rising above the threshold line. This is 3 levels of easy visual confluence showing a change in sentiment, volume, and momentum to the downside.
The next image will be showing the bullish side with call/put flow and DNA strands enabled.
The circles that are labeled (1), show the visual change in momentum on the DNA strands from bearish to bullish. Circle (2) is the crossing of call flow over put flow and the arrow points to the DNA strands crossing over and call flow above the threshold line. Three simple to use visual confluences to identify change in sentiment, volume, and momentum to the upside.
Conclusion:
Our goal is to provide a unique, yet simple approach to market sentiment & momentum analysis. It's a tool developed for traders seeking user-friendly and easy to use tools that provide easy visual insights of market dynamics. We believe in simplicity, effectiveness, and creating tools to support decision making for all traders.
How to get access:
You can see the Author's instructions to get access to this indicator
RISK DISCLAIMER
All content, tools, scripts & education provided by Gorb Algo are for informational & educational purposes only. Trading is risky and most lose their money, past performance does not guarantee future results.
PVSRA Volume Price - Some people say "Price Action is King". I say, we cannot know how the MMs (Market Makers) will move price next, period. But price tends to consolidate above key SR when MMs are filling short orders for SM (Smart Money) and long orders for DM (Dumb Money), and price tends to consolidate below key SR when MMs are filling long orders for SM and short orders for DM. The MMs are also "SM", and they tend to do the other SMs "one better"! This means that after the MMs fill the SM/DM orders, they might move price a bit further in an attempt to stop out some of those SM executed orders and sucker in more DM; both giving liquidity for the MMs to add to their own SM side position. Yes, the MMs are bastards. But the point is that could leave price not "nicely" above or below a SR anymore, yet more consolidation can occur.
Volume - Increases in activity denote increase in interest. But, is it long or short interest? Where is price in the bigger picture when this is happening? Is it at relative highs, or lows in the overall price action? And if a high volume bar is for a candle which you can examine by going to lower TF charts, you might see where in the spread of that candle the most volume occurred, high or low! Using volume is about taking note of relative increases in volume and what price is doing at the same time. Are the better volumes favoring the lower or the higher prices, as the MMs waffle price up and down? And do the volumes get particularly notable when the MMs take price above or below key SR?
S&R - Read all about S&R at "Baby Pips.com". What I want you to realize here is that the whole, half and quarter numbered price levels (hereinafter referred to as "Levels") are the most important SR of all in this market! Not because price stops, pauses, proceeds or reverses there, but because it is above or below these levels that important consolidation (MMs filling SM orders) takes place. Once SM long orders are filled, they become interested in placing orders to close them at higher prices, and hence the MMs will be moving price higher, eventually. Once SM short orders are filled, they become interested in placing orders to close them at lower prices, and hence the MMs will be moving price lower, eventually.
PVSRA - If we can spot consolidations above/below key SR, examine the overall price action on various TF charts, and take note of where the notable increases in volume have most recently occurred (did volume favor relative highs or lows), then we can build a consensus about what kind of orders the MMs have most recently been filling; buying to open longs or close shorts, or selling to open shorts or close longs. And we can get a better idea if things will next become bullish or bearish. And once PA confirms our bullish or bearish PVSRA results, by recognizing the importance of Levels we can look beyond current PA in the direction it is going and look to historic PA S&R (consolidation around key Levels) to come up with candidates for where the price might be headed. And bull or bear swings typically run in terms of 100+, 150+, 200+ pips, .....etc. And now you know why.
Okay. Now, if this is your first introduction to PVSRA, and having just read the above, you are likely scratching your head and still confused. That is normal. I will tell you a secret about the market and why you have a right to be confused. The secret is this. The market cannot be defined by mathematics nor by immutable logic. This is why the most advanced mathematicians over a century have never even come close to cracking the market. It cannot be done. Something else, other than math and immutable logic is the fundamental operand in the market. Have you ever watched a child attempt a jigsaw puzzle for the first time? And watched as that child grew and attempted more of them, and more complex ones? What is at work in the market I will elaborate on later, but for now trust me in this. We need to apply ourselves to learning how to do PVSRA just as a child attacks learning how to do jigsaw puzzles. And we must continue doing PVSRA, because in time our mind will "learn" when we have just picked up an important piece of the puzzle, and that we know where it goes! Developing the skill of PVSRA is an art form. We must not allow ourselves to feel badly if we miss clues. PVSRA is an art form that takes time to perfect. Over time our skill will grow and our "read" of the unpredictable market will improve. We must take to ongoing learning and application of PVSRA.
Introduction to How the Market Really Works
Does anybody remember the "lil' Abner" cartoons in the Sunday papers? Let me draw for you a mental picture of how the market really works.....
Imagine Daddy Yokum ferociously racing a buckboard wagon up and down the steep inclines and declines in the rough, rocky mountain road that has sharp turns and a sheer cliff on one side. The wagon wheels are spewing rocks off the side of the cliff! Even Daddy Yokum's shotgun is going off due to the jolting of the buckboard! Daddy Yokum has a demented look on his face, but he is smiling! The horse has a wild look in it's eyes and is frothing at the mouth. There are two passengers being tossed around in the back of the buckboard, terror stricken! Now, let's pan back from this cartoon picture and place the labels needed. On the side of the wagon is the sign "Market Pricing". The demented, smiling Daddy Yokum, is the Market Maker. The passengers being tossed around are the buyers and sellers.
.....Got it? Market prices are not determined by the buyers and sellers. They are determined by the Robber Bank Market Makers (MMs).
MMs are Market Manipulators of Price, and Thieves!
The "market" is the sole creation of the Robber Banks that "make the market". While it serves the world of commerce, they run it to make profits. And they opened the market up to foster prolific currency trading by others for the sole purpose of making more profits. They move prices up and down to "create liquidity" to fill the orders of SM (Smart Money) and DM (Dumb Money), for the commissions they make by filling the orders. When they have some orders above the current price and some below the current price, who do you think determines the sequence of direction and distance the price is going to move so these orders can be filled? And always - since they know how they are going to move price next - they take positions themselves to make additional profits.
They do this by:
1. Manipulating price to sucker into the market DM that is taking the wrong side position.
2. Manipulating price to sucker into the market SM that is taking the right side position, but too soon, and later manipulating price to hit their stops.
They have total control of pricing, and by these actions they effectively "steal" from others the money to fill their own "right side" positions before moving the price to the next area they have decided on for filling orders, and for taking profit on their positions built beforehand. Don't get me wrong. I do not object to the market volatility these thieving Robber Banks create. We need it. But we also need to understand what these people are like, the cloth they are cut from. They are crooks, and we have to be extra careful about trading in the market they operate. On some special days you can see them in their true colors. We should witness it. Take note of it. Speak of it. And remember it!

Volume Average Cross - VAC DefaultVolume Average Cross Default Indicator
This indicator plots signals from two different visual volume averages when they cross.
In does in addition to that show the default volume bars.
This is VAC Default. If you need to see the crosses on your chart and not on the volume bars please go to my VAC Chart Indicator.
Rules:
Fast Volume Period always has to be lower than the Slow Volume Period to trigger correct signals.
Inputs:
-> Fast Volume Average Period
-> Slow Volume Average Period
-> Option to enable/disable the cross-signals and to show/hide both volume averages.

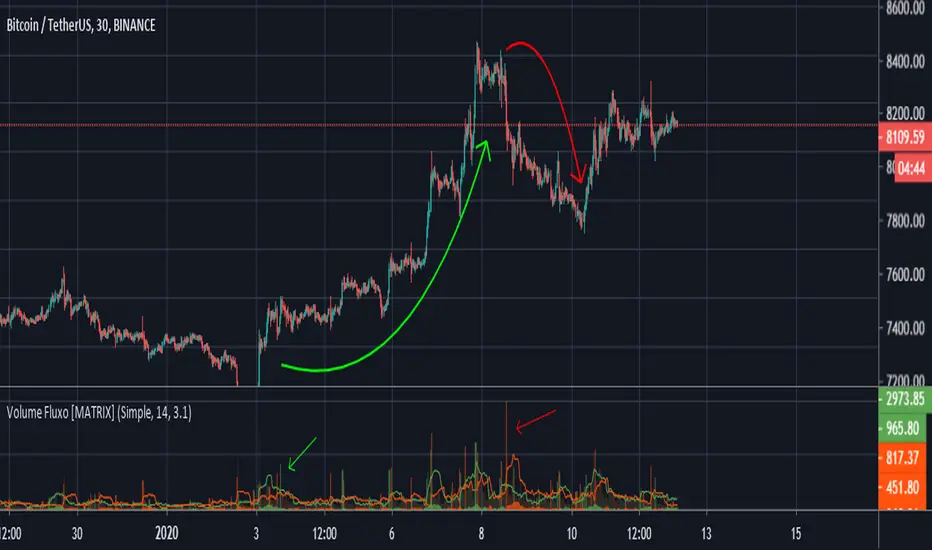
MATRIX Flow Chart V.3DepthHouse Volume Flow indicator is used to help determine trend direction strictly based on Negative and Positive volume data.
How to Read:
- Moving Average crossovers are used to help determine a possible trend change or retracement.
- The area cloud on the bottom is calculated by the difference of the moving averages. This could be used to help determine the trending volume strength.
- Bright colored volume bars are large volume spikes calculated by the x factor in the options.
Other changes:
- DepthHouse is going open source with numerous of its indicators. This is only one of many!
- Volume is now displayed without being altered for calculations.
O indicador de fluxo de volume DepthHouse é usado para ajudar a determinar a direção da tendência estritamente com base nos dados de volume negativo e positivo.
Como ler:
- Média móvel crossovers são usados para ajudar a determinar uma possível mudança ou retração de tendência.
- A nuvem da área na parte inferior é calculada pela diferença das médias móveis. Isso pode ser usado para ajudar a determinar a força do volume de tendências.
- Barras de volume coloridas brilhantes são grandes picos de volume calculados pelo fator x nas opções.
Colored Volume Bars All Markets: Combining Volume SourcesUsing volume in Forex is potentially misleading as we are only provided the broker volume or futures exchange volume for the currency or commodity in a decentralised market. This code combines the volumes from FXCM, Onanda and futures for the instrument being studied. The combination of the volumes could improve the reliability of the volume being considered. Using this approach other volume indicators can also be improved.

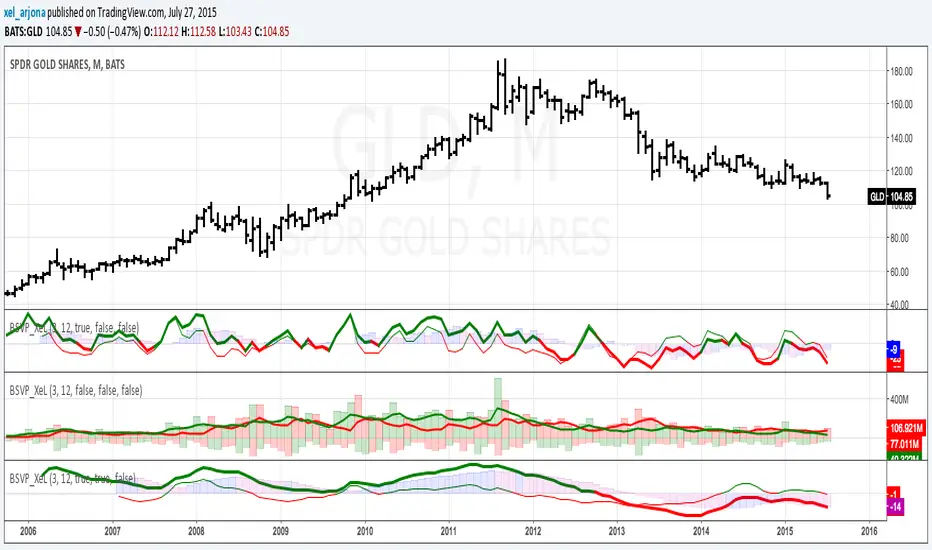
BUY & SELL VOLUME TO PRICE PRESSURE by @XeL_ArjonaBUY & SELL PRICE TO VOLUME PRESSURE
By Ricardo M Arjona @XeL_Arjona
DISCLAIMER:
The Following indicator/code IS NOT intended to be a formal investment advice or recommendation by the author, nor should be construed as such. Users will be fully responsible by their use regarding their own trading vehicles/assets.
The embedded code and ideas within this work are FREELY AND PUBLICLY available on the Web for NON LUCRATIVE ACTIVITIES and must remain as is.
Pine Script code MOD's and adaptations by @XeL_Arjona with special mention in regard of:
Buy (Bull) and Sell (Bear) "Power Balance Algorithm" by: Stocks & Commodities V. 21:10 (68-72): "Bull And Bear Balance Indicator by Vadim Gimelfarb"
Normalisation (Filter) from Karthik Marar's VSA work: karthikmarar.blogspot.mx
Buy to Sell Convergence / Divergence and Volume Pressure Counterforce Histogram Ideas by: @XeL_Arjona
WHAT IS THIS?
The following indicators try to acknowledge in a K-I-S-S approach to the eye (Keep-It-Simple-Stupid), the two most important aspects of nearly every trading vehicle: -- PRICE ACTION IN RELATION BY IT'S VOLUME --
Volume Pressure Histogram: Columns plotted in positive are considered the dominant Volume Force for the given period. All "negative" columns represents the counterforce Vol.Press against the dominant.
Buy to Sell Convergence / Divergence: It's a simple adaptation of the popular "Price Percentage Oscillator" or MACD but taking Buying Pressure against Selling Pressure Averages, so given a Positive oscillator reading (>0) represents Bullish dominant Trend and a Negative reading (<0) a Bearish dominant Trend. Histogram is the diff between RAW Volume Pressures Convergence/Divergence minus Normalised ones (Signal) which helps as a confirmation.
Volume bars are by default plotted from RAW Volume Pressure algorithms, but they can be as well filtered with Karthik Marar's approach against a "Total Volume Average" in favor to clean day to day noise like HFT.
ALL NEW IDEAS OR MODIFICATIONS to these indicators are Welcome in favor to deploy a better and more accurate readings. I will be very glad to be notified at Twitter: @XeL_Arjona
Any important addition to this work MUST REMAIN PUBLIC by means of CreativeCommons CC & TradingView. -- 2015
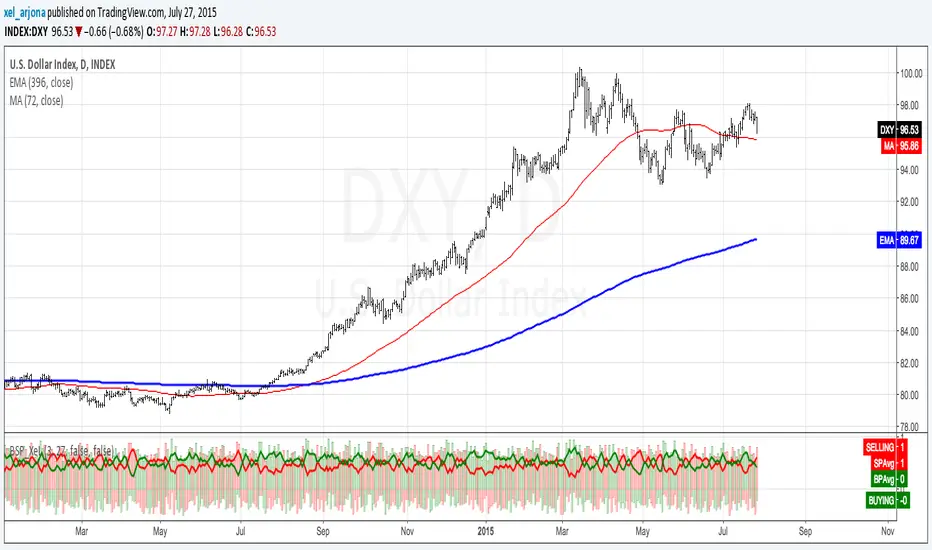

BUY & SELL VOLUME PRESSURE by @XeL_ArjonaBUY & SELL PRICE TO VOLUME PRESSURE
By Ricardo M Arjona @XeL_Arjona
DISCLAIMER:
The Following indicator/code IS NOT intended to be a formal investment advice or recommendation by the author, nor should be construed as such. Users will be fully responsible by their use regarding their own trading vehicles/assets.
The embedded code and ideas within this work are FREELY AND PUBLICLY available on the Web for NON LUCRATIVE ACTIVITIES and must remain as is.
Pine Script code MOD's and adaptations by @XeL_Arjona with special mention in regard of:
Buy (Bull) and Sell (Bear) "Power Balance Algorithm" by: Stocks & Commodities V. 21:10 (68-72): "Bull And Bear Balance Indicator by Vadim Gimelfarb"
Normalisation (Filter) from Karthik Marar's VSA work: karthikmarar.blogspot.mx
Buy to Sell Convergence / Divergence and Volume Pressure Counterforce Histogram Ideas by: @XeL_Arjona
WHAT IS THIS?
The following indicators try to acknowledge in a K-I-S-S approach to the eye (Keep-It-Simple-Stupid), the two most important aspects of nearly every trading vehicle: -- PRICE ACTION IN RELATION BY IT'S VOLUME --
Volume Pressure Histogram: Columns plotted in positive are considered the dominant Volume Force for the given period. All "negative" columns represents the counterforce Vol.Press against the dominant.
Buy to Sell Convergence / Divergence: It's a simple adaptation of the popular "Price Percentage Oscillator" or MACD but taking Buying Pressure against Selling Pressure Averages, so given a Positive oscillator reading (>0) represents Bullish dominant Trend and a Negative reading (<0) a Bearish dominant Trend. Histogram is the diff between RAW Volume Pressures Convergence/Divergence minus Normalised ones (Signal) which helps as a confirmation.
Volume bars are by default plotted from RAW Volume Pressure algorithms, but they can be as well filtered with Karthik Marar's approach against a "Total Volume Average" in favor to clean day to day noise like HFT.
ALL NEW IDEAS OR MODIFICATIONS to these indicators are Welcome in favor to deploy a better and more accurate readings. I will be very glad to be notified at Twitter: @XeL_Arjona
Any important addition to this work MUST REMAIN PUBLIC by means of CreativeCommons CC & TradingView. -- 2015
Custom Volume + Buyer & Price %Title: Custom Volume + Buyer & Price %
Description:
This indicator helps you see who is controlling the market — buyers or sellers — using volume and price action. It works even if your chart is on a small timeframe (like 5-min or 15-min), by showing Daily, Weekly, and Monthly information from the higher timeframe volume charts.
Key Features & How It Works:
Buyer % (B%):
Measures where the closing price is within the high-low range of a candle.
Calculation:
\text{Buyer %} = \frac{\text{Close} - \text{Low}}{\text{High} - \text{Low}} \times 100
Interpretation:
> 50% → Buyers are stronger
< 50% → Sellers are stronger
50% → Balanced
Volume Coloring:
Volume bars are colored based on Buyer %, not price movement:
Green → Buyers dominate
Red → Sellers dominate
Yellow → Balanced day
Higher Timeframe Insight:
Displays Daily, Weekly, and Monthly volume & Buyer % even if your chart is on a smaller timeframe.
Lets you understand long-term buying or selling pressure while trading intraday.
21-Day Average:
Shows average Buyer % and average volume over the past 21 days for trend context.
Why It’s Useful:
Quickly visualize whether the market is buyer-driven or seller-driven.
Identify strong accumulation or distribution days.
Works on any chart timeframe while giving higher timeframe perspective.
Ideal for traders who want easy, visual insight into market sentiment.

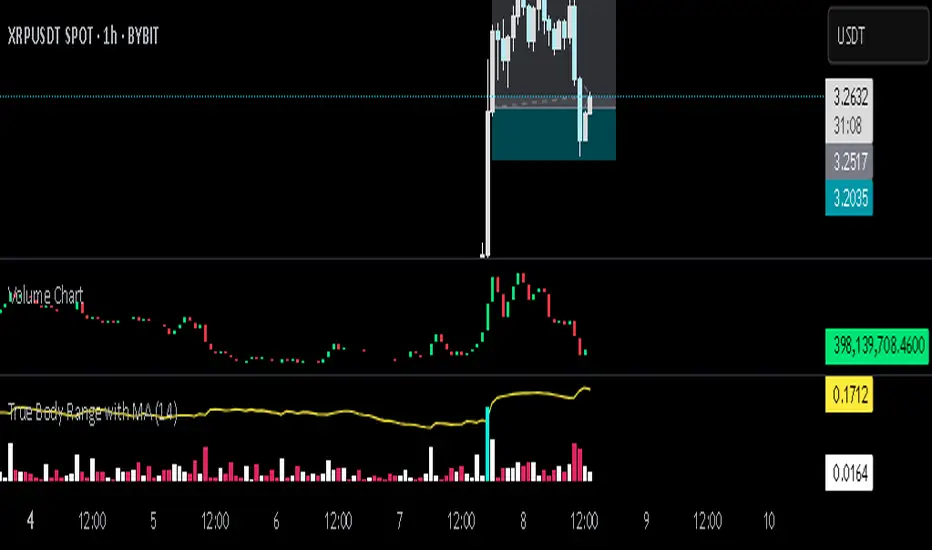
Volume ChartThis Pine Script indicator, written in TradingView’s version 6, visualizes trading volume as a custom candlestick chart instead of a standard histogram. Rather than plotting volume bars, it constructs synthetic candles where each candle’s "open" is set to the previous candle’s "close" (stored in prevClose). The "close" of the synthetic candle moves upward by the volume value if the actual price candle was bullish (close > open) and downward by the volume value if it was bearish, with the "high" and "low" both fixed to the open to create a flat candle body line. This transforms volume into a price-like cumulative visual flow, color-coded green for bullish and red for bearish periods, allowing traders to intuitively track whether volume pressure is accumulating upward or downward over time, as though volume itself were moving like a market price series.
TrueDelta Candles📖 Description:
TrueDelta Candles is a precision tool for traders who want deeper insight into market sentiment through real-time volume delta analysis. Rather than using traditional volume bars, this indicator colors each chart candle based on the net volume delta—the difference between buying and selling volume—fetched from a lower timeframe.
🚀 Key Features:
🎯 Real Candle Coloring: Colors actual price candles based on delta volume—green (buying pressure), red (selling pressure).
⏱️ Multi-Timeframe Volume Analysis: Automatically selects the appropriate lower timeframe for better delta approximation, or lets you set a custom one.
🔬 Order Flow Insight: Visualizes the tug-of-war between buyers and sellers within each candle.
⚡ Lightweight & Non-Intrusive: No clutter—just clean color overlays on your chart candles.
🔄 Live Updating: Responds instantly as new data arrives.
🧠 Ideal For:
Intraday and scalping strategies.
Momentum and breakout traders.
Order flow enthusiasts looking for a visual edge.
🛠️ How It Works:
Behind the scenes, the script uses ta.requestVolumeDelta() to retrieve granular buy/sell volume data from a lower timeframe. The net delta volume then determines whether the candle is colored green (positive delta) or red (negative delta). This makes it easy to spot when market pressure aligns or diverges from price action.
⚙️ Settings:
Use Custom Timeframe: Manually select the lower timeframe used for delta calculation (e.g., "1", "5").
Default Auto Mode: Automatically adapts to your current chart resolution for optimal data balance.
If you're serious about understanding the real dynamics behind every candle, TrueDelta Candles adds an essential layer of volume-based context that price alone can't offer.

Volume Trend Analysis ProKey Features of Volume Analysis Script
1. Volume Threshold Detection
Identifies significant volume spikes
Compares current volume against 20-period moving average
Configurable sensitivity for precise signal generation
2. Trend Confirmation Mechanisms
Uses short and long-term moving averages
Validates volume signals with price action
Reduces false positive trading signals
3. Advanced Visualization
Color-coded volume bars
Triangular buy/sell signal markers
Clear visual representation of volume dynamics
4. Risk Management Components
Customizable volume threshold
Deviation sensitivity adjustment
Built-in alert conditions for real-time monitoring

Iron Cortex: Volume AnalysisDescription:
This Volume Analysis indicator is designed to identify potential buying and selling pressures in the market by analysing volume and price changes in conjunction with dual Exponential Moving Averages (EMAs).
Signal Identification:
Buying Pressure: This signal is identified when:
i) Volume is rising and the price is increasing.
ii) The current volume is above both the fast and slow EMAs of the volume.
iii) The fast EMA is above the slow EMA.
Selling Pressure: This signal is identified when:
i) Volume is rising and the price is decreasing.
ii) The current volume is above both the fast and slow EMAs of the volume.
iii) The fast EMA is above the slow EMA.
Interpretation:
When the volume bars change to the specified colours, it indicates potential buying or selling pressure based on the underlying conditions. Teal is buying pressure, red is selling pressure.
Use this information in conjunction with other technical analysis tools to make informed trading decisions. As with all indicators, expect some false signals in choppy markets.
This indicator is useful for traders who want to incorporate volume analysis with price trends and EMA crossovers to identify strong market movements. Adjust the settings to fit your trading strategy and enhance your market analysis.

[Mad] Volume DeltaThis is a volume indicator that splits purchases and sales into 2 separate columns.
In addition, I added some POW factors to scale the volume to a more compact or expanded picture.
The SMA draws the red line indicating the volume of purchases and sales, also with POW factor customizable, so it is possible to scale it within the volume bars
what to do with this information: it is very easy to find rotation points when the selling volume and the buying volume are equal, this is where possible rotation phases occur
have fun
