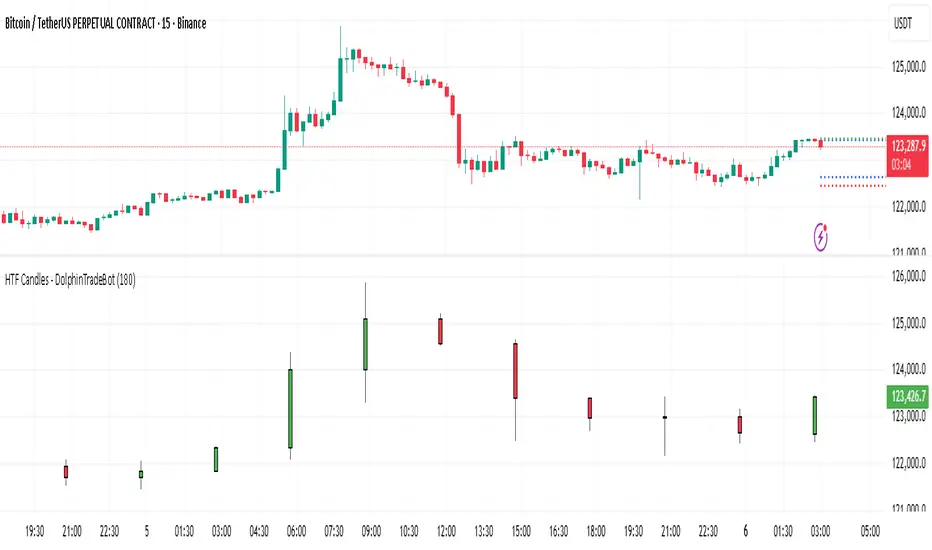
HTF Candles - DolphinTradeBot1️⃣ Overview
The "HTF Candles - DolphinTradeBot" indicator displays higher timeframe (HTF) candlesticks and their OHLC (Open, High, Low, Close) levels on any lower timeframe chart.
While staying on lower timeframes this helps confirm entries or reversals and visualize major market structure, trend bias, and key price zone
2️⃣ How to Use It ?
Use these levels to identify major support/resistance or trend structure.
Observe higher timeframe candle formations (e.g., engulfing, pin bar, doji)
3️⃣ ⚙️Settings
TimeFrame → Select the higher timeframe to display.
Show OHLC Levels → Toggle lines for Open, High, Low, Close.
Line Colors → Customize the color for each level.
Cari skrip untuk "OHLC"
Multi-TF 👀### Multi-Timeframe Analysis (MTF-Analysis)
**Overview**
The Multi-Timeframe Analysis indicator is a powerful visualization tool designed for traders who incorporate multi-timeframe (MTF) strategies into their decision-making process. It overlays compact, customizable candle representations from up to four higher timeframes directly on your chart, positioned to the right of the last bar for quick reference. This allows you to monitor price action, momentum via EMAs, and key levels like Fair Value Gaps (FVGs) across multiple resolutions without switching charts. Built with efficiency in mind, it supports automatic timeframe detection, real-time updates, and a clean, non-intrusive design that enhances your trading workflow.
Ideal for day traders, swing traders, and scalpers, this indicator helps identify alignments between timeframes, spot potential reversals or continuations, and validate entries/exits based on higher-timeframe context. It leverages Pine Script v6 for smooth performance, with optimizations to handle up to 5000 bars back and extensive drawing limits.
**Key Features**
- **Multi-Timeframe Candle Display**: Renders recent candles (configurable from 5 to 100 per timeframe) from selected higher timeframes (e.g., 5m, 15m, 1H, 4H) as compact bars with customizable width, spacing, and padding. Bullish and bearish candles are color-coded for instant recognition.
- **Automatic Timeframe Adaptation**: When enabled, the indicator intelligently selects complementary timeframes based on your chart's resolution (e.g., on a 1m chart, it might show 5m, 15m, and 1H). Manual overrides are available for full control.
- **EMA Overlays**: Plots EMA9, EMA21, and EMA50 on each MTF section using a user-defined source (e.g., OHLC/4, close). EMAs can be dashed for clarity and enabled/disabled per timeframe, helping to gauge momentum and trend strength.
- **Fair Value Gaps (FVGs)**: Detects bullish (+FVG) and bearish (-FVG) gaps with a configurable lookback length (5-50 bars). Gaps are visualized as dotted boxes extending from the candle, highlighting potential support/resistance zones or imbalances.
- **Time Labels and Debugging**: Displays timestamp labels under every fourth candle for chronological context. A debug mode expands spacing and adds detailed labels (e.g., OHLC, volume, EMA values) for testing and verification.
- **Customization Options**: Extensive inputs for colors (bodies, wicks, EMAs, FVGs), label sizes/styles, and layout ensure seamless integration with your chart theme. Supports futures symbols with a time offset adjustment.
- **Performance Optimizations**: Uses arrays for efficient data management, clears drawings on realtime updates or timeframe changes, and limits buffer sizes to prevent overload.
**How to Use**
1. Add the indicator to your chart via TradingView's "Indicators" menu.
2. Configure timeframes: Enable/disable up to four TFs and set the number of candles to display. Use "Auto Timeframe" for smart defaults.
3. Adjust EMAs: Select the source type and toggle per TF to focus on relevant momentum signals (e.g., EMA9 crossovers for short-term trades).
4. Enable FVGs: Activate per TF and tweak the length to suit your market (shorter for volatile assets, longer for trends).
5. Fine-tune appearance: Modify padding, candle width, and colors to avoid clutter. Use debug mode during setup.
6. Interpret: Align your chart's price action with MTF candles—look for confluence in trends, FVGs filling as support/resistance, or EMA alignments for high-probability setups.
**Input Settings**
- **General**: Hour offset for time adjustments (useful for futures).
- **Timeframes**: Enable TFs 1-4, select resolutions (e.g., "5m"), and set candle counts. Auto mode simplifies this.
- **FVG/iFVG**: Toggle per TF, customize colors and detection length.
- **EMA**: Enable per TF, choose source, colors, and dashed style.
- **Candle Appearance**: Bull/bear colors for bodies/wicks, width/spacing/padding, label size/color.
- **Debug**: Expands view for detailed inspection.
**Notes**
- This indicator is non-repainting and updates in realtime, but performance may vary on lower timeframes with many candles—reduce counts if needed.
- FVGs are calculated locally on recent bars for efficiency; historical gaps beyond the buffer aren't shown.
- Compatible with all symbols, but best on volatile markets like forex, crypto, or indices.
- Feedback welcome—updates may include more MA types or advanced FVG filters.
Enhance your edge with multi-timeframe insights—try MTF-Analysis today!

PumpC ATR Line LevelsPumpC ATR Line Levels
Overview
PumpC ATR Line Levels is a volatility-based indicator that projects potential expansion levels from the previous session’s close using the Average True Range (ATR). This tool builds upon the Previous OHLC framework created by Nephew_Sam_ by extending its session-handling logic and adding ATR-based levels, statistical tracking, and flexible visualization options.
How It Works
Calculates ATR from a user-selectable higher timeframe (default: Daily).
Projects levels above and below the previous session’s close (or current close when preview mode is enabled).
Supports up to 5 ATR multiples, each with independent toggles, colors, and labels.
Optionally displays only the most recent ATR session for clarity.
Includes a data table tracking how often ATR levels are reached or closed beyond.
Features
Configurable ATR timeframe and length (default: 21).
Default multiples: 0.30, 0.60, 0.90; optional: 1.236, 2.00.
Toggle for preview mode (using current close vs. locked prior session close).
Customizable line style, width, colors, and label placement.
Visibility filter to show only on chart TF ≤ 60 minutes.
Session statistics table with counts and percentages of level interactions.
Use Cases
Identify intraday expansion targets or stop placement zones based on volatility.
Evaluate historical tendencies of price respecting or breaking ATR bands.
Support volatility-adjusted trade planning with statistical validation.
Acknowledgment
This script was developed on top of the Previous OHLC indicator by Nephew_Sam_ , with major modifications to implement ATR-driven levels, extended statistics, and customizable table output.
Notes
This indicator does not generate buy/sell signals.
Best applied to intraday charts anchored to a higher-timeframe ATR.
Keep charts clean and avoid non-standard bar types when publishing.

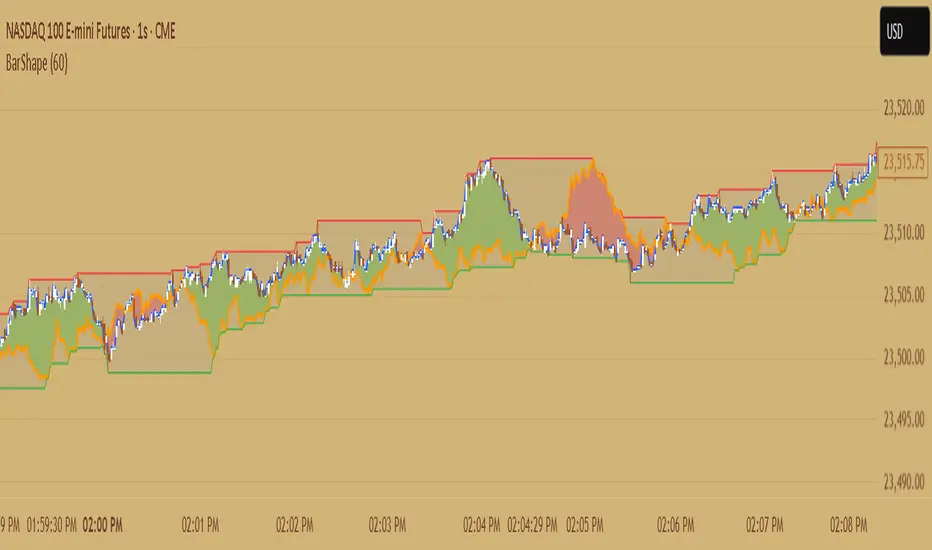
Candle ShapeCandle Shape
This indicator visualizes rolling candles that aggregate price action over a chosen lookback period, allowing you to see how OHLC dynamics evolve in real time.
Instead of waiting for a higher timeframe (HTF) bar to close, you can track its development directly from a lower timeframe chart.
For example, view how a 1-hour candle is forming on a 1-minute chart — complete with rolling open, high, low, and close levels, as well as colored body and wick areas.
---
🔹 How it works
- Lookback Period (n) → sets the bucket size, defining how many bars are merged into a “meta-candle.”
- The script continuously updates the meta-open, meta-high, meta-low, and meta-close.
- Body and wick areas are filled with color , making bullish/bearish transitions easy to follow.
---
🔹 Use cases
- Monitor the intra-development of higher timeframe candles.
- Analyze rolling OHLC structures to understand how price dynamics shift across different aggregation windows.
- Explore unique perspectives for strategy confirmation, breakout anticipation, and market structure analysis.
---
✨ Candle Shape bridges the gap between timeframes and uncovers new layers of price interaction.
Mutanabby_AI | ATR+ | Trend-Following StrategyThis document presents the Mutanabby_AI | ATR+ Pine Script strategy, a systematic approach designed for trend identification and risk-managed position entry in financial markets. The strategy is engineered for long-only positions and integrates volatility-adjusted components to enhance signal robustness and trade management.
Strategic Design and Methodological Basis
The Mutanabby_AI | ATR+ strategy is constructed upon a foundation of established technical analysis principles, with a focus on objective signal generation and realistic trade execution.
Heikin Ashi for Trend Filtering: The core price data is processed via Heikin Ashi (HA) methodology to mitigate transient market noise and accentuate underlying trend direction. The script offers three distinct HA calculation modes, allowing for comparative analysis and validation:
Manual Calculation: Provides a transparent and deterministic computation of HA values.
ticker.heikinashi(): Utilizes TradingView's built-in function, employing confirmed historical bars to prevent repainting artifacts.
Regular Candles: Allows for direct comparison with standard OHLC price action.
This multi-methodological approach to trend smoothing is critical for robust signal generation.
Adaptive ATR Trailing Stop: A key component is the Average True Range (ATR)-based trailing stop. ATR serves as a dynamic measure of market volatility. The strategy incorporates user-defined parameters (
Key Value and ATR Period) to calibrate the sensitivity of this trailing stop, enabling adaptation to varying market volatility regimes. This mechanism is designed to provide a dynamic exit point, preserving capital and locking in gains as a trend progresses.
EMA Crossover for Signal Generation: Entry and exit signals are derived from the interaction between the Heikin Ashi derived price source and an Exponential Moving Average (EMA). A crossover event between these two components is utilized to objectively identify shifts in momentum, signaling potential long entry or exit points.
Rigorous Stop Loss Implementation: A critical feature for risk mitigation, the strategy includes an optional stop loss. This stop loss can be configured as a percentage or fixed point deviation from the entry price. Importantly, stop loss execution is based on real market prices, not the synthetic Heikin Ashi values. This design choice ensures that risk management is grounded in actual market liquidity and price levels, providing a more accurate representation of potential drawdowns during backtesting and live operation.
Backtesting Protocol: The strategy is configured for realistic backtesting, employing fill_orders_on_standard_ohlc=true to simulate order execution at standard OHLC prices. A configurable Date Filter is included to define specific historical periods for performance evaluation.
Data Visualization and Metrics: The script provides on-chart visual overlays for buy/sell signals, the ATR trailing stop, and the stop loss level. An integrated information table displays real-time strategy parameters, current position status, trend direction, and key price levels, facilitating immediate quantitative assessment.
Applicability
The Mutanabby_AI | ATR+ strategy is particularly suited for:
Cryptocurrency Markets: The inherent volatility of assets such as #Bitcoin and #Ethereum makes the ATR-based trailing stop a relevant tool for dynamic risk management.
Systematic Trend Following: Individuals employing systematic methodologies for trend capture will find the objective signal generation and rule-based execution aligned with their approach.
Pine Script Developers and Quants: The transparent code structure and emphasis on realistic backtesting provide a valuable framework for further analysis, modification, and integration into broader quantitative models.
Automated Trading Systems: The clear, deterministic entry and exit conditions facilitate integration into automated trading environments.
Implementation and Evaluation
To evaluate the Mutanabby_AI | ATR+ strategy, apply the script to your chosen chart on TradingView. Adjust the input parameters (Key Value, ATR Period, Heikin Ashi Method, Stop Loss Settings) to observe performance across various asset classes and timeframes. Comprehensive backtesting is recommended to assess the strategy's historical performance characteristics, including profitability, drawdown, and risk-adjusted returns.
I'd love to hear your thoughts, feedback, and any optimizations you discover! Drop a comment below, give it a like if you find it useful, and share your results.

Chart-Only Scanner — Pro Table v2.5.1Chart-Only Scanner — Pro Table v2.5
User Manual (Pine Script v6)
What this tool does (in one line)
A compact, on-chart table that scores the current chart symbol (or an optional override) using momentum, volume, trend, volatility, and pattern checks—so you can quickly decide UP, DOWN, or WAIT.
Quick Start (90 seconds)
Add the indicator to any chart and timeframe (1m…1M).
Leave “Override chart symbol” = OFF to auto-use the chart’s symbol.
Choose your layout:
Row (wide horizontal strip), or Grid (title + labeled cells).
Pick a size preset (Micro, Small, Medium, Large, Mobile).
Optional: turn on “Use Higher TF (EMA 20/50)” and set HTF Multiplier (e.g., 4 ⇒ if chart is 15m, HTF is 60m).
Watch the table:
DIR (↑/↓/→), ROC%, MOM, VOL, EMA stack, HTF, REV, SCORE, ACT.
Add an alert if you want: the script fires when |SCORE| ≥ Action threshold.
What to expect
A small table appears on the chart corner you choose, updating each bar (or only at bar close if you keep default smart-update).
The ACT cell shows 🔥 (strong), 👀 (medium), or ⏳ (weak).
Panels & Settings (every option explained)
Core
Momentum Period: Lookback for rate-of-change (ROC%). Shorter = more reactive; longer = smoother.
ROC% Threshold: Minimum absolute ROC% to call direction UP (↑) or DOWN (↓); otherwise →.
Require Volume Confirmation: If ON and VOL ≤ 1.0, the SCORE is forced to 0 (prevents low-volume false positives).
Override chart symbol + Custom symbol: By default, the indicator uses the chart’s symbol. Turn this ON to lock to a specific ticker (e.g., a perpetual).
Higher TF
Use Higher TF (EMA 20/50): Compares EMA20 vs EMA50 on a higher timeframe.
HTF Multiplier: Higher TF = (chart TF × multiplier).
Example: on 3H chart with multiplier 2 ⇒ HTF = 6H.
Volatility & Oscillators
ATR Length: Used to show ATR% (ATR relative to price).
RSI Length: Standard RSI; colors: green ≤30 (oversold), red ≥70 (overbought).
Stoch %K Length: With %D = SMA(%K, 3).
MACD Fast/Slow/Signal: Standard MACD values; we display Line, Signal, Histogram (L/S/H).
ADX Length (Wilder): Wilder’s smoothing (internal derivation); also shows +DI / −DI if you enable the ADX column.
EMAs / Trend
EMA Fast/Mid/Slow: We compute EMA(20/50/200) by default (editable).
EMA Stack: Bull if Fast > Mid > Slow; Bear if Fast < Mid < Slow; Flat otherwise.
Benchmark (optional, OFF by default)
Show Relative Strength vs Benchmark: Displays RS% = ROC(symbol) − ROC(benchmark) over the Momentum Period.
Benchmark Symbol: Ticker used for comparison (e.g., BTCUSDT as a market proxy).
Columns (show/hide)
Toggle which fields appear in the table. Hiding unused fields keeps the layout clean (especially on mobile).
Display
Layout Mode:
Row = a single two-row strip; each column is a metric.
Grid = a title row plus labeled pairs (label/value) arranged in rows.
Size Preset: Micro, Small, Medium, Large, Mobile change text size and the grid density.
Table Corner: Where the panel sits (e.g., Top Right).
Opaque Table Background: ON = dark card; OFF = transparent(ish).
Update Every Bar: ON = update intra-bar; OFF = smart update (last bar / real-time / confirmed history).
Action threshold (|score|): The cutoff for 🔥 and alert firing (default 70).
How to read each field
CHART: The active symbol name (or your custom override).
DIR: ↑ (ROC% > threshold), ↓ (ROC% < −threshold), → otherwise.
ROC%: Rate of change over Momentum Period.
Formula: (Close − Close ) / Close × 100.
MOM: A scaled momentum score: min(100, |ROC%| × 10).
VOL: Volume ratio vs 20-bar SMA: Volume / SMA(Volume,20).
1.5 highlights as yellow (significant participation).
ATR%: (ATR / Close) × 100 (volatility relative to price).
RSI: Colored for extremes: ≤30 green, ≥70 red.
Stoch K/D: %K and %D numbers.
MACD L/S/H: Line, Signal, Histogram. Histogram color reflects sign (green > 0, red < 0).
ADX, +DI, −DI: Trend strength and directional components (Wilder). ADX ≥ 25 is highlighted.
EMA 20/50/200: Current EMA values (editable lengths).
STACK: Bull/Bear/Flat as defined above.
VWAP%: (Close − VWAP) / Close × 100 (premium/discount to VWAP).
HTF: ▲ if HTF EMA20 > EMA50; ▼ if <; · if flat/off.
RS%: Symbol’s ROC% − Benchmark ROC% (positive = outperforming).
REV (reversal):
🟢 Eng/Pin = bullish engulfing or bullish pin detected,
🔴 Eng/Pin = bearish engulfing or bearish pin,
· = none.
SCORE (absolute shown as a number; sign shown via DIR and ACT):
Components:
base = MOM × 0.4
volBonus = VOL > 1.5 ? 20 : VOL × 13.33
htfBonus = use_mtf ? (HTF == DIR ? 30 : HTF == 0 ? 15 : 0) : 0
trendBonus = (STACK == DIR) ? 10 : 0
macdBonus = 0 (placeholder for future versions)
scoreRaw = base + volBonus + htfBonus + trendBonus + macdBonus
SCORE = DIR ≥ 0 ? scoreRaw : −scoreRaw
If Require Volume Confirmation and VOL ≤ 1.0 ⇒ SCORE = 0.
ACT:
🔥 if |SCORE| ≥ threshold
👀 if 50 < |SCORE| < threshold
⏳ otherwise
Practical examples
Strong long (trend + participation)
DIR = ↑, ROC% = +3.2, MOM ≈ 32, VOL = 1.9, STACK = Bull, HTF = ▲, REV = 🟢
SCORE: base(12.8) + volBonus(20) + htfBonus(30) + trend(10) ≈ 73 → ACT = 🔥
Action idea: look for longs on pullbacks; confirm risk with ATR%.
Weak long (no volume)
DIR = ↑, ROC% = +1.0, but VOL = 0.8 and Require Volume Confirmation = ON
SCORE forced to 0 → ACT = ⏳
Action: wait for volume > 1.0 or turn off confirmation knowingly.
Bearish reversal warning
DIR = →, REV = 🔴 (bearish engulfing), RSI = 68, HTF = ▼
SCORE may be mid-range; ACT = 👀
Action: watch for breakdown and rising VOL.
Alerts (how to use)
The script calls alert() whenever |SCORE| ≥ Action threshold.
To receive pop-ups, sounds, or emails: click “⏰ Alerts” in TradingView, choose this indicator, and pick “Any alert() function call.”
The alert message includes: symbol, |SCORE|, DIR.
Layout, Size, and Corner tips
Row is best when you want a compact status ribbon across the top.
Grid is clearer on big screens or when you enable many columns.
Size:
Mobile = one pair per row (tall, readable)
Micro/Small = dense; good for many fields
Large = presentation/screenshots
Corner: If the table overlaps price, change the corner or set Opaque Background = OFF.
Repaint & timeframe behavior
Default smart update prefers stability (last bar / live / confirmed history).
For a stricter, “close-only” behavior (less repaint): turn Update Every Bar = OFF and avoid Heikin Ashi when you want raw market OHLC (HA modifies price inputs).
HTF logic is derived from a clean, integer multiple of your chart timeframe (via multiplier). It works with 3H/4H and any TF.
Performance notes
The script analyzes one symbol (chart or override) with multiple metrics using efficient tuple requests.
If you later want a multi-symbol grid, do it with pages (10–15 per page + rotate) to stay within platform limits (recommended future add-on).
Troubleshooting
No table visible
Ensure the indicator is added and not hidden.
Try toggling Opaque Background or switch Corner (it might be behind other drawings).
Keep Columns count reasonable for the chosen Size.
If you turned ON Override, verify the Custom symbol exists on your data provider.
Numbers look different on HA candles
Heikin Ashi modifies OHLC; switch to regular candles if you need raw price metrics.
3H/4H issues
Use integer HTF Multiplier (e.g., 2, 4). The tool builds the correct string internally; no manual timeframe strings needed.
Power user tips
Volume gating: keeping Require Volume Confirmation = ON filters most fake moves; if you’re a scalper, reduce strictness or turn it off.
Action threshold: 60–80 is typical. Higher = fewer but stronger signals.
Benchmark RS%: great for spotting leaders/laggards; positive RS% = outperformance vs benchmark.
Change policy & safety
This version doesn’t alter your historical logic you tested (no radical changes).
Any future “radical” change (score weights, HTF logic, UI hiding data) will ship with a toggle and an Impact Statement so you can keep old behavior if you prefer.
Glossary (quick)
ROC%: Percent change over N bars.
MOM: Scaled momentum (0–100).
VOL ratio: Volume vs 20-bar average.
ATR%: ATR as % of price.
ADX/DI: Trend strength / direction components (Wilder).
EMA stack: Relationship between EMAs (bullish/bearish/flat).
VWAP%: Premium/discount to VWAP.
RS%: Relative strength vs benchmark.

Volume Delta Pressure Tracker by GSK-VIZAG-AP-INDIA📢 Title:
Volume Delta Pressure Tracker by GSK-VIZAG-AP-INDIA
📝 Short Description (for script title box):
Real-time volume pressure tracker with estimated Buy/Sell volumes and Delta visualization in an Indian-friendly format (K, L, Cr).
📃 Full Description
🔍 Overview:
This indicator estimates buy and sell volumes using candle structure (OHLC) and displays a real-time delta table for the last N candles. It provides traders with a quick view of volume imbalance (pressure) — often indicating strength behind price moves.
📊 Features:
📈 Buy/Sell Volume Estimation using the candle’s OHLC and Volume.
⚖️ Delta Calculation (Buy Vol - Sell Vol) to detect pressure zones.
📅 Time-stamped Table displaying:
Time (HH:MM)
Buy Volume (Green)
Sell Volume (Red)
Delta (Color-coded)
🔢 Indian Number Format (K = Thousands, L = Lakhs, Cr = Crores).
🧠 Fully auto-calculated — no need for tick-by-tick bid/ask feed.
📍 Neatly placed bottom-right table, customizable number of rows.
🛠️ Inputs:
Show Table: Toggle the table on/off
Number of Bars to Show: Choose how many recent candles to include (5–50)
🎯 Use Cases:
Identify hidden buyer/seller strength
Detect volume absorption or exhaustion
✅ Compatibility:
Works on any timeframe
Ideal for intraday instruments like NIFTY, BANKNIFTY, etc.
Ideal for volume-based strategy confirmation.
🖋️ Developed by:
GSK-VIZAG-AP-INDIA

Blue Ocean BOATS 24/5 US Market DataThis script utilizes Blue Ocean's ATS (Alternative Trading System) and U.S. exchange market data to create a continuous candlestick chart. The continuous data has the option to be used as an indicator or strategy source.
Requirements
The main chart symbol (which can be unrelated to the user-input Ticker Symbol) needs to be a 24/7 chart. An example symbol is CRYPTO:BTCUSD. CME_MINI:ES1! and FX:SPX500 work too, but are not truly 24/5 and will miss ~4 hours of the total trading week from the extended U.S. session.
The main chart's timeframe needs to be intraday. Because the script's output is currently inconsistent on daily or higher timeframes, it will disable itself.
The Ticker Symbol chosen should be a ticker that is traded on U.S. exchanges. This will provide both U.S. extended session data and a BOATS equivalent.
Usage & configuration
This script visualizes the 24-hour Monday-Friday chart of a U.S. exchange ticker. Going a step further, it can be used to compare the performance indices or cryptocurrencies to stock constituents of indices, cryptocurrency treasury stocks or holding ETFs.
The script's output, candlesticks, can be overlaid on the main chart or used as is. A "Price Source" plot is used for indicators or strategies.
Ticker Symbol: The U.S. ticker you'd like to view extended session and Blue Ocean ATS session data for.
Price Source: Price source that can be used for indicators or strategies.
Highlight Sessions: Highlight the different trading sessions.
Last Price Line: Show a horizontal line at the last traded price.
Ticker Symbol Check: Plots a label that will display only if the selected Ticker Symbol is not detected as a U.S. exchange traded ticker.
Earnings Label: Creates a label at the time of past earnings of the chosen Ticker Symbol. The time that the earnings are plotted is approximate. Because of this, the label is meant as an explanation for price action.
What this script does and how it works
It creates OHLC candlesticks by merging Blue Ocean's ATS market data and U.S. exchange data. From the OHLC data of both, a single output can be used for indicators or strategies.
References and further information
www.tradingview.com
The Blue Ocean ATS allows trading from 20:00 to 4:00 Eastern Time, Sunday through Thursday. This critical timeframe bridges the eight-hour overnight gap when major U.S. exchanges are closed.
blueocean-tech.io
Blue Ocean ATS, LLC is a US broker dealer which operates the alternative trading system BOATS. Our trading platform offers electronic access, price discovery, compliant regulatory reporting requirements, and standard clearing and settlement processes.
www.nyse.com
Hours mentioned are in Eastern Time.
Overnight trading remains far less active than extended hours trading. The hour with the highest overnight volume is 9:00PM, which averages 2.94 million shares per day and coincides with several Asian market opens. This volume is a fraction of the last hour of extended hours trading, which averages 43.22 million shares. The first hour of pre-core reported volume averages 113.30 million shares per day.
Overnight executions, in addition to the peak in the 9:00PM hour, also exhibits a smaller peak at 3:00AM, of 2.35 million shares. This coincides with several Asian bourses’ end of their regular trading day.
Example of using the script in the main chart window and the difference in how RSI may be calculated.
Note: ATS is not the name of the 20:00 to 4:00 ET session itself, and the term refers to a broader definition of trading systems that include dark pools, which can be different.
24/5 Monday-Friday really means NY time Sunday night to Friday afternoon.

Simple Trend Indicator (Heikin-Ashi) | Lyro RSSimple Trend Indicator (Heikin-Ashi)
A momentum oscillator using Heikin-Ashi smoothed data to filter trend direction with zero-line crosses.
This indicator calculates the normalized deviation of Heikin-Ashi OHLC values from their Simple Moving Average (SMA), then averages these deviations into a single oscillator. It simplifies trend detection by:
Reducing noise via Heikin-Ashi smoothing.
Highlighting momentum shifts through a zero-line cross system (bullish/bearish).
Providing clear visual signals with color-coded plots and directional dots.
Originality:
Unlike standard momentum oscillators, this tool uniquely combines:
Heikin-Ashi normalization for cleaner trend analysis.
Multi-component averaging (high, open, low, close) to balance sensitivity.
Minimalist design for clutter-free charting.
How It Works:
Data Input: Fetches Heikin-Ashi OHLC values using request.security().
Momentum Calculation: For each Heikin-Ashi component:
Computes % deviation from its SMA: (value − SMA(value, length)) / SMA(value, length) * 100.
Oscillator: Averages deviations of all four components into one line (sum).
Signals:
Bullish: Oscillator > 0 (green).
Bearish: Oscillator < 0 (red).
Cross Confirmation: Dots (⦿) mark zero-line crosses.
Usage:
Trend Following: Enter long/short on sustained oscillator breaks above/below zero.
Reversal Watch: Zero-line crosses may hint at weakening momentum.
Filter: Combine with volume or support/resistance levels.
⚠️Disclaimer: This indicator is a tool for technical analysis and does not provide guaranteed results. It should be used in conjunction with other analysis methods and proper risk management practices. The creators of this indicator are not responsible for any financial decisions made based on its signals.

Better MACD📘 Better MACD – Adaptive Momentum & Divergence Suite
Better MACD is a comprehensive momentum-trend tool that evolves the traditional MACD into a multi-dimensional, divergence-aware oscillator. It leverages exponential smoothing across logarithmic rate-of-change of OHLC data, adaptive signal processing, and intelligent divergence detection logic to provide traders with earlier, smoother, and more reliable momentum signals.
This indicator is built for professional-level analysis, suitable for scalping, swing trading, and trend-following systems.
🧬 Core Concept
Unlike the classic MACD which subtracts two EMAs of price, Better MACD constructs a signal by:
Applying logarithmic transformation on the change between OHLC components (Close, High, Low, Open).
Using double EMA smoothing to filter noise and volatility, Triangular method. 1st to 2nd Smoothing.
Averaging and de-biasing the results through a custom linear regression model, 4th Smoothing.
Subtracting a fast SMA and slow SMA response to yield a dynamic MACD value, 3rd Smoothing.
The result is a smooth, adaptive, and high-resolution MACD-style oscillator that responds more naturally to trend conditions and price geometry.
🧠 Features Breakdown
1. 📈 Multi-Layer MACD Engine
Src1: Smoothed Log Rate-of-Change on Close
Src2: Smoothed Log Rate-of-Change on High
Src3: Smoothed Log Rate-of-Change on Low
Src4: Smoothed Log Rate-of-Change on Open
These are blended using highest high, lowest low, and average Close price over a configurable window for more complete trend detection. The open-based Src4 is subtracted using SMA.
2. 🧮 Signal Line
A fast EMA (signalLength) of the Better MACD value is used for crossover logic.
Crossovers of MACD and Signal line signal potential entries or exits.
3. 📊 MACD Histogram
Visualizes the difference between MACD and Signal line.
Dynamically color-coded:
Green/Light Green for bullish impulse
Red/Pink for bearish impulse
Width and color intensity reflect strength and momentum slope.
🎨 Visual Enhancements
Feature Description
✅ Ribbon Fill Optional fill between MACD and Signal line, colored by trend direction
✅ Zero-Line Background Background highlights above/below 0 to easily read bullish/bearish bias
✅ Crossover Highlights Tiny circles plotted when MACD crosses Signal line
🔍 Divergence Detection Suite
The script includes a full Divergence Engine to detect:
🔼 Bullish Regular Divergence (Price lower lows + Indicator higher lows)
🔽 Bearish Regular Divergence (Price higher highs + Indicator lower highs)
🟢 Bullish Hidden Divergence (Price higher lows + Indicator lower lows)
🔴 Bearish Hidden Divergence (Price lower highs + Indicator higher highs)
🧩 Divergence Modes:
Supports both Regular, Hidden, or Both simultaneously
Detects from either Close Price or Heikin Ashi-derived candles
Uses dynamic pivot tracking with configurable lookback and divergence sensitivity
Divergence lines are labeled, colored, and plotted in real-time
🔁 Styling & Customization:
Choose from Solid, Dashed, or Dotted line styles
Configure separate colors and widths for all divergence types
Control number of divergence lines visible or only show the most recent
Divergences update live without repainting
⚠️ Alerts
Alerts are built-in for real-time notification:
MACD Histogram reversals (rising → falling, or vice versa)
Divergence signals (all 4 types, grouped and individually)
Combines seamlessly with TradingView alerts for actionable triggers
🔧 Input Controls (Grouped by Purpose)
Better MACD Group
1st–4th Smoothing Lengths: Controls responsiveness of MACD core engine
Signal Length: Smoothness of signal line
Toggles for crossover highlights, zero cross fills, and ribbon fills
Divergence Settings
Enable/disable divergence lines
Choose divergence type (Regular, Hidden, Both)
Set confirmation requirements
Customize pivot detection and bar search depth
Styling Options
Colors, line widths, and line styles for each divergence type
Heikin Ashi Mode for smoother pivots and divergences
🧠 How to Use
✅ For Trend Traders:
Use MACD > Signal + Histogram > 0 → Bullish confirmation
MACD < Signal + Histogram < 0 → Bearish confirmation
Wait for pullbacks with hidden divergences to enter in trend direction
✅ For Reversal Traders:
Look for Regular Divergences at trend exhaustion points
Combine with price action (e.g., support/resistance or candle pattern)
✅ For Swing & Day Traders:
Enable Heikin Ashi Mode for smoother divergence pivots
Use zero line background + histogram color to time entries
📌 Summary
Feature Description
🚀 Advanced MACD Core Smoother, more reliable, multi-source-based MACD
🔍 Divergence Engine Detects 4 divergence types with pivot logic
🎯 Real-Time Alerts Alerts for histogram slope and divergences
🎛️ Deep Customization Full styling, smoothing, and detection controls
📉 Heikin Ashi Support Improved signal quality in trend-based markets

CDP - Counter-Directional-Pivot🎯 CDP - Counter-Directional-Pivot
📊 Overview
The Counter-Directional-Pivot (CDP) indicator calculates five critical price levels based on the previous day's OHLC data, specifically designed for multi-timeframe analysis. Unlike standard pivot points, CDP levels are calculated using a unique formula that identifies potential reversal zones where price action often changes direction.
⚡ What Makes This Script Original
This implementation solves several technical challenges that existing pivot indicators face:
🔄 Multi-Timeframe Consistency: Values remain identical across all timeframes (1m, 5m, 1h, daily) - a common problem with many pivot implementations
🔒 Intraday Stability: Uses advanced value-locking technology to prevent the "stepping" effect that occurs when pivot lines shift during the trading session
💪 Robust Data Handling: Optimized for both liquid and illiquid stocks with enhanced data synchronization
🧮 CDP Calculation Formula
The indicator calculates five key levels using the previous day's High (H), Low (L), and Close (C):
CDP = (H + L + C) ÷ 3 (Central Decision Point)
AH = 2×CDP + H – 2×L (Anchor High - Strong Resistance)
NH = 2×CDP – L (Near High - Moderate Resistance)
AL = 2×CDP – 2×H + L (Anchor Low - Strong Support)
NL = 2×CDP – H (Near Low - Moderate Support)
✨ Key Features
🎨 Visual Elements
📈 Five Distinct Price Levels: Each with customizable colors and line styles
🏷️ Smart Label System: Shows exact price values for each level
📋 Optional Value Table: Displays all levels in an organized table format
🎯 Clean Chart Display: Minimal visual clutter while maximizing information
⚙️ Technical Advantages
🔐 Session-Locked Values: Prices are locked at market open, preventing intraday shifts
🔄 Multi-Timeframe Sync: Perfect consistency between daily and intraday charts
✅ Data Validation: Built-in checks ensure reliable calculations
🚀 Performance Optimized: Efficient code structure for fast loading
💼 Trading Applications
🔄 Reversal Zones: AH and AL often act as strong turning points
💥 Breakout Confirmation: Price movement beyond these levels signals trend continuation
🛡️ Risk Management: Use levels for stop-loss and take-profit placement
🏗️ Market Structure: Understand daily ranges and potential price targets
📚 How to Use
🚀 Basic Setup
Add the indicator to your chart (works on any timeframe)
Customize colors for easy identification of support/resistance zones
Enable the value table for quick reference of exact price levels
📈 Trading Strategy Examples
🟢 Long Bias: Look for bounces at NL or AL levels
🔴 Short Bias: Watch for rejections at NH or AH levels
💥 Breakout Trading: Enter positions when price decisively breaks through anchor levels
↔️ Range Trading: Use CDP as the central reference point for range-bound markets
🎯 Advanced Strategy Combinations
RSI Integration for Enhanced Signals: 📊
📉 Oversold Bounces: Combine RSI below 30 with price touching AL/NL levels for high-probability long entries
📈 Overbought Rejections: Look for RSI above 70 with price rejecting AH/NH levels for short opportunities
🔍 Divergence Confirmation: When RSI shows bullish divergence at support levels (AL/NL) or bearish divergence at resistance levels (AH/NH), it often signals stronger reversal potential
⚡ Momentum Confluence: RSI crossing 50 while price breaks through CDP can confirm trend direction changes
⚙️ Configuration Options
🎨 Line Customization: Adjust width, style (solid/dashed/dotted), and colors
👁️ Display Preferences: Toggle individual levels, labels, and value table
📍 Table Position: Place the value table anywhere on your chart
🔔 Alert System: Get notifications when price crosses key levels
🔧 Technical Implementation Details
🎯 Data Reliability
The script uses request.security() with lookahead settings to ensure historical accuracy while maintaining real-time functionality. The value-locking mechanism prevents the common issue where pivot levels shift during the trading day.
🔄 Multi-Timeframe Logic
⏰ Intraday Charts: Display previous day's calculated levels as stable horizontal lines
📅 Daily Charts: Show current day's levels based on yesterday's OHLC
🔍 Consistency Check: All timeframes reference the same source data
🤔 Why CDP vs Standard Pivots?
Counter-Directional Pivots often provide more accurate reversal points than traditional pivot calculations because they incorporate the relationship between high/low ranges and closing prices more effectively. The formula creates levels that better reflect market psychology and institutional trading behaviors.
💡 Best Practices
💧 Use on liquid markets for most reliable results
📊 RSI Combination: Add RSI indicator for overbought/oversold confirmation and divergence analysis
📊 Combine with volume analysis for confirmation
🔍 Consider multiple timeframe analysis (daily levels on hourly charts)
📝 Test thoroughly in paper trading before live implementation
💪 Example Market Applications
NASDAQ:AAPL AAPL - Tech stock breakouts through AH levels
$NYSE:SPY SPY - Index trading with CDP range analysis
NASDAQ:TSLA TSLA - Volatile stock reversals at AL/NL levels
⚠️ This indicator is designed for educational and analytical purposes. Always combine with proper risk management and additional technical analysis tools.

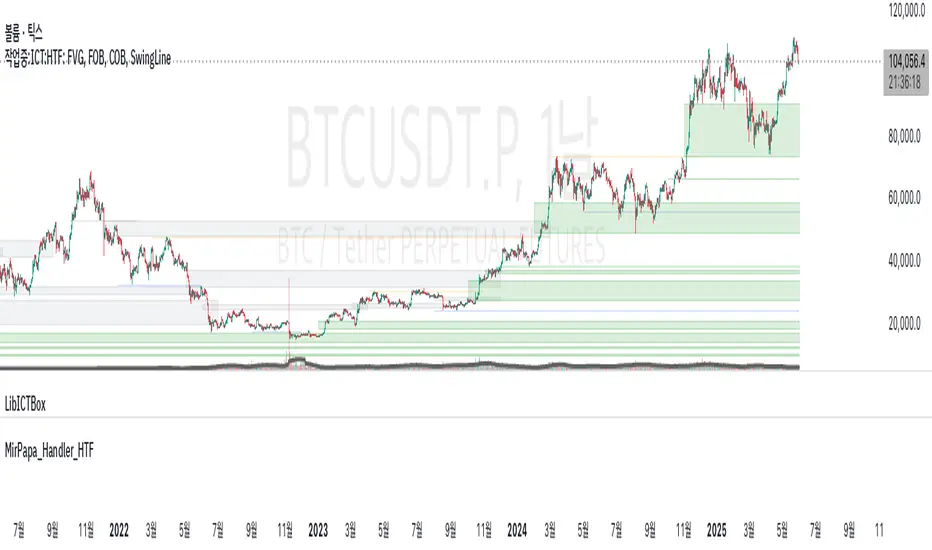
MirPapa_Handler_HTFLibrary "MirPapa_Handler_HTF"
High Time Frame Handler Library:
Provides utilities for working with High Time Frame (HTF) and chart (LTF) conversions and data retrieval.
IsChartTFcomparisonHTF(_chartTf, _htfTf)
IsChartTFcomparisonHTF
@description
Determine whether the given High Time Frame (HTF) is greater than or equal to the current chart timeframe.
Parameters:
_chartTf (string) : The current chart’s timeframe string (examples: "5", "15", "1D").
_htfTf (string) : The High Time Frame string to compare (examples: "60", "1D").
@return
Returns true if HTF minutes ≥ chart minutes, false otherwise or na if conversion fails.
GetHTFrevised(_tf, _case)
GetHTFrevised
@description
Retrieve a specific bar value from a Higher Time Frame (HTF) series.
Supports current and historical OHLC values, based on a case identifier.
Parameters:
_tf (string) : The target HTF string (examples: "60", "1D").
_case (string) : A case string determining which OHLC value and bar offset to request:
"b" → HTF bar_index
"o" → HTF open
"h" → HTF high
"l" → HTF low
"c" → HTF close
"o1" → HTF open one bar ago
"h1" → HTF high one bar ago
"l1" → HTF low one bar ago
"c1" → HTF close one bar ago
… up to "o5", "h5", "l5", "c5" for five bars ago.
@return
Returns the requested HTF value or na if _case does not match any condition.
GetHTFfromLabel(_label)
GetHTFfromLabel
@description
Convert a Korean HTF label into a Pine Script-recognizable timeframe string.
Examples:
"5분" → "5"
"1시간" → "60"
"일봉" → "1D"
"주봉" → "1W"
"월봉" → "1M"
"연봉" → "12M"
Parameters:
_label (string) : The Korean HTF label string (examples: "5분", "1시간", "일봉").
@return
Returns the Pine Script timeframe string corresponding to the label, or "1W" if no match is found.
GetHTFoffsetToLTFoffset(_offset, _chartTf, _htfTf)
GetHTFoffsetToLTFoffset
@description
Adjust an HTF bar index and offset so that it aligns with the current chart’s bar index.
Useful for retrieving historical HTF data on an LTF chart.
Parameters:
_offset (int) : The HTF bar offset (0 means current HTF bar, 1 means one bar ago, etc.).
_chartTf (string) : The current chart’s timeframe string (examples: "5", "15", "1D").
_htfTf (string) : The High Time Frame string to align (examples: "60", "1D").
@return
Returns the corresponding LTF bar index after applying HTF offset. If result is negative, returns 0.
X OROverview
Designed to plot hourly opening ranges (ORs) on an intraday chart. It primarily serves as a trading tool for assessing market direction and potential trading opportunities by analyzing price action relative to key OHLC (Open, High, Low, Close) levels within each hourly range.
The code provided is for each hour sessions from 2:00 AM to 3:00 PM for a complete session-based framework. In addition there is the RTH open range
Purpose
The core purpose of this indicator is to:
✅ Define each hourly range (based on the session’s opening bar) by recording the high and low of that range.
✅ Extend this range into the following bars for visual reference — serving as dynamic support and resistance zones.
✅ Monitor price action relative to each hourly OR, helping traders evaluate market direction and structure trades using concepts like:
Breakouts above/below the OR high/low.
Rejections or consolidations within the OR.
Continuation or reversal signals tied to each OR.
Key Features
The script marks the first bar of the session as the OR session start.
During this bar, it initializes:
Opening price
Session high
Session low
These levels form the initial range.
🔹 Dynamic Range Tracking
Throughout the one-minute OR session:
The highest and lowest prices are updated in real time, capturing intra-hour volatility.
A visual background box is drawn to highlight the OR range on the chart.
🔹 Range Extension
The script defines an extended session period after the initial OR (e.g., 2:00 AM-2:45 AM for the 2:00 AM session).
During this extension period:
The box persists on the chart, providing a contextual zone that traders can use as a dynamic support/resistance area.
🔹 Visual Representation
Transparent colored boxes highlight each session’s OR visually on the chart.
These boxes help traders easily identify whether price is trading:
Inside the OR
Breaking above the high (potential bullish continuation)
Breaking below the low (potential bearish continuation)
Application in Trading
🔍 Trading the Opening Range Breakout
Traders often use the OR high and low as breakout triggers. For example:
A price break above the OR high may signal bullish momentum.
A break below the OR low may signal bearish momentum.
⚖️ Support and Resistance
Even if breakouts fail, the OR can act as a pivot zone — offering areas for:
Stop placements
Target levels
Entry confirmations for fade trades or mean reversion strategies.
🕒 Session Awareness
By defining each hour’s OR individually (from 2:00 AM to 3:00 PM), traders can:
Analyze price behavior within each session.
Recognize when liquidity or volatility increases (e.g. around overlapping sessions like London open or New York open).
Summary
This Pine Script indicator provides a powerful framework for visualizing and trading hourly opening ranges. It enhances intraday analysis by:
Structuring price action within hourly boxes.
Highlighting key price levels relative to OHLC concepts.
Helping traders make more informed decisions by assessing price behavior around these critical ranges.

Moving Average Candles**Moving Average Candles — MA-Based Smoothed Candlestick Overlay**
This script replaces traditional price candles with smoothed versions calculated using various types of moving averages. Instead of plotting raw price data, each OHLC component (Open, High, Low, Close) is independently smoothed using your selected moving average method.
---
### 📌 Features:
- Choose from 13 MA types: `SMA`, `EMA`, `RMA`, `WMA`, `VWMA`, `HMA`, `T3`, `DEMA`, `TEMA`, `KAMA`, `ZLEMA`, `McGinley`, `EPMA`
- Fully configurable moving average length (1–1000)
- Color-coded candles based on smoothed Open vs Close
- Works directly on price charts as an overlay
---
### 🎯 Use Cases:
- Visualize smoothed market structure more clearly
- Reduce noise in price action for better trend analysis
- Combine with other indicators or strategies for confluence
---
> ⚠️ **Note:** Since all OHLC values are based on moving averages, these candles do **not** represent actual market trades. Use them for trend and structure analysis, not trade entries based on precise levels.
---
*Created to support traders seeking a cleaner visual representation of price dynamics.*

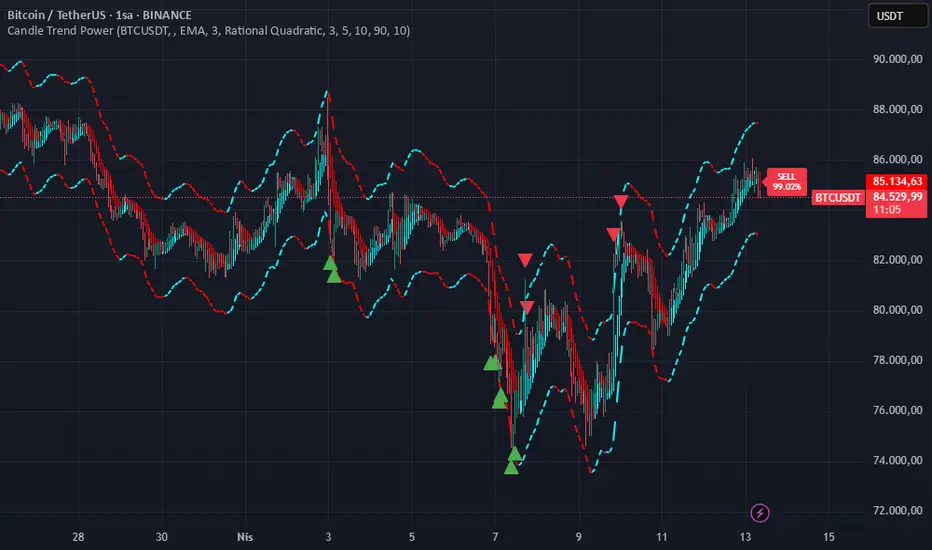
Candle Trend PowerThe Candle Trend Power is a custom technical indicator designed for advanced trend analysis and entry signal generation. It combines multiple smoothing methods, candle transformations, and volatility bands to visually and analytically enhance your trading decisions.
🔧 Main Features:
📉 Custom Candle Types
It transforms standard OHLC candles into one of several advanced types:
Normal Candles, Heikin-Ashi, Linear Regression, Rational Quadratic (via kernel filtering), McGinley Dynamic Candles
These transformations help traders better see trend continuations and reversals by smoothing out market noise.
🧮 Smoothing Method for Candle Data
Each OHLC value can be optionally smoothed using:
EMA, SMA, SMMA (RMA), WMA, VWMA, HMA, Mode (Statistical mode) Or no smoothing at all.
This flexibility is useful for customizing to different market conditions.
📊 Volatility Bands
Volatility-based upper and lower bands are calculated using:
Band = price ± (price% + ATR * multiplier)
They help identify overbought/oversold zones and potential reversal points.
📍 Candle Color Logic
Each candle is colored:
Cyan (#00ffff) if it's bullish and stronger than the previous candle
Red (#fd0000) if it's bearish and weaker
Alternating bar index coloring improves visual clarity.
📈 Trend Momentum Labels
The script includes a trend strength estimation using a smoothed RSI:
If the candle is bullish, it shows a BUY label with the overbought offset.
If bearish, it shows a SELL label with the oversold offset.
These labels are dynamic and placed next to the bar.
📍 Signal Markers
It also plots triangles when the price crosses the volatility bands:
Triangle up for potential long
Triangle down for potential short
✅ Use Case Summary
This script is mainly used for:
Visual trend confirmation with enhanced candles
Volatility-based entry signals
RSI-based trend momentum suggestions
Integrating different smoothing & transformation methods to fine-tune your strategy
It’s a flexible tool for both manual traders and automated system developers who want clear, adaptive signals across different market conditions.
💡 What's Different
🔄 Candle Type Transformations
⚙️ Custom Candle Smoothing
📉 Candle's Multi-level Volatility Bands
🔺 Dynamic Entry Signals (Buy/Sell Labels)
❗Important Note:
This script is provided for educational purposes and does not constitute financial advice. Traders and investors should conduct their research and analysis before making any trading decisions.
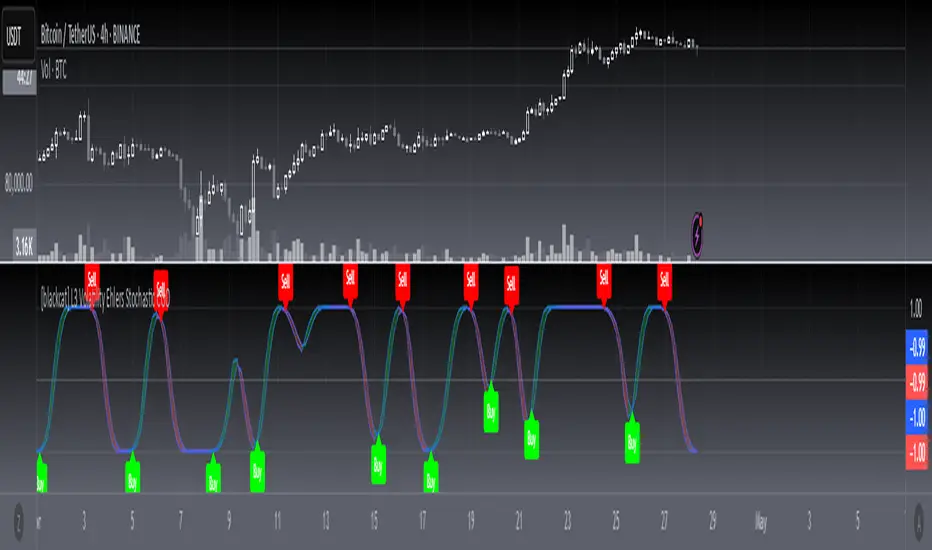
[blackcat] L3 Volatility Ehlers Stochastic CGOOVERVIEW
This advanced indicator integrates the Center of Gravity Oscillator (CGO) with an Ehlers-Stochastic framework and an Adaptive Local Minimum-Maximum Average (ALMA) smoothing algorithm. Designed for non-overlaid charts, it identifies market momentum shifts by analyzing price action through multi-layer volatility analysis.
FEATURES
• Dual-line system:
✓ Stochastic CGO: Core oscillating line derived from weighted OHLC price calculations
✓ ALMA Lagging Line: Smoothing component using customizable offset/sigma parameters
• Dynamic color scheme:
✓ Green/red trend differentiation via crossover comparison
✓ Optional fill areas between lines (toggleable)
• Clear trade signals:
✓ Buy/Sell labels triggered by mathematically defined crossovers
✓ Zero-reference baseline marker (#0ebb23)
• Customizable parameters:
Fast Length (9 default) controls CGO sensitivity
Slow Length (5 default) governs ALMA responsiveness
ALMA Offset/Sigma allow adaptive curve optimization
HOW TO USE
Configure core parameters:
• Adjust Fast Length (CGO timeframe window)
• Set Slow Length, ALMA Offset, and Sigma for smoother/laggier response
Interpret visuals:
• Bullish trend = green shaded zone (when primary line above lagging line)
• Bearish trend = red shaded zone (primary line below lagging line)
Analyze signals:
• Buy triggers occur when rising CGO crosses above ALMA while below zero
• Sell triggers activate when falling CGO breaks below ALMA after exceeding zero base
Optimize display:
✓ Enable/disable fill area via Fill Between Lines
LIMITATIONS
• Relies heavily on lookback periods - rapid market changes may reduce predictive accuracy
• Signal frequency increases during high-volatility environments
• Requires additional confirmation methods due to occasional premature crossovers
• Default parameter settings may lack universality across asset classes
NOTES
• Best paired with volume-based confirmations for stronger signals
• Reducing ALMA Sigma sharpens line responsiveness at cost of noise susceptibility
• Increasing Fast Length extends calculation horizon while reducing peak sensitivity
• Weighted OHLC source formula prioritizes closing prices for swing direction assessment
DCSessionStatsOHLC_v1.0DCSessionStatsOHLC_v1.0
© dc_77 | Pine Script™ v6 | Licensed under Mozilla Public License 2.0
This indicator overlays customizable session-based OHLC (Open, High, Low, Close) statistics on your TradingView chart. It tracks price action within user-defined sessions, calculates average manipulation and distribution levels based on historical data, and visually projects these levels with lines and labels. Additionally, it provides a session count table to monitor bullish and bearish sessions.
Key Features:
Session Customization: Define session time (e.g., "0000-1600") and time zone (e.g., UTC, America/New_York). Analyze up to 20 historical sessions.
Anchor Line: Displays a vertical line at session start with customizable style, color, and optional label.
Session Open Line: Plots a horizontal line at the session’s opening price with adjustable appearance and label.
Manipulation Levels: Calculates and projects average price extensions (high/low relative to open) for manipulative moves, shown as horizontal lines with labels.
Distribution Levels: Displays average price ranges (high/low beyond open) for distribution phases, with customizable lines and labels.
Visual Flexibility: Adjust line styles (solid, dashed, dotted), colors, widths, label sizes, and projection offsets (bars beyond session start).
Session Stats Table: Optional table showing counts of bullish (close > open) and bearish (close < open) sessions, with configurable position and size.
How It Works:
Tracks OHLC data within each session and identifies session start/end based on the specified time range.
Computes averages for manipulation (e.g., low below open in bullish sessions) and distribution (e.g., high above open) levels from past sessions.
Projects these levels forward as horizontal lines, extending them by a user-defined offset for easy reference.
Updates a table with real-time bullish/bearish session counts.
Use Case:
Ideal for traders analyzing intraday or custom session behavior, identifying key price levels, and gauging market sentiment over time.
Toggle individual elements on/off and fine-tune visuals to suit your trading style.

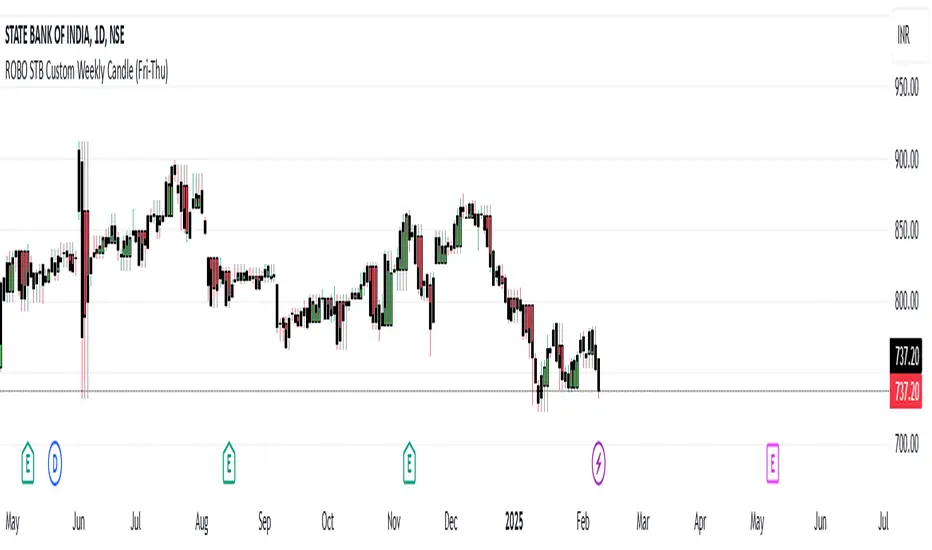
ROBO STB Custom Weekly Candle (Fri-Thu)Description:
This indicator creates custom weekly candles that start on Friday and end on Thursday, instead of the standard Monday–Friday weekly structure in TradingView. It aggregates the open, high, low, and close (OHLC) values from Friday to Thursday and displays them as candlesticks on the chart.
Features:
✅ Custom weekly candles from Friday to Thursday
✅ Dynamic calculation of open, high, low, and close
✅ Works on any timeframe
✅ Helps traders analyze market structure differently
How It Works:
Identifies the custom weekly session based on Friday's start and Thursday's end.
Aggregates OHLC values within this time range.
Resets the values when a new custom week begins.
Plots the calculated weekly candles on the chart.
Use Case:
This indicator is useful for traders who prefer to analyze weekly price movements based on a non-standard start and end day, especially those focusing on forex, crypto, or commodities where trading hours differ.
Notes:
This script does not modify existing candles but overlays new custom weekly candles on the chart.
It does not repaint and updates in real-time.
If you find this useful, like and share! 🚀
Request█ OVERVIEW
This library is a tool for Pine Script™ programmers that consolidates access to a wide range of lesser-known data feeds available on TradingView, including metrics from the FRED database, FINRA short sale volume, open interest, and COT data. The functions in this library simplify requests for these data feeds, making them easier to retrieve and use in custom scripts.
█ CONCEPTS
Federal Reserve Economic Data (FRED)
FRED (Federal Reserve Economic Data) is a comprehensive online database curated by the Federal Reserve Bank of St. Louis. It provides free access to extensive economic and financial data from U.S. and international sources. FRED includes numerous economic indicators such as GDP, inflation, employment, and interest rates. Additionally, it provides financial market data, regional statistics, and international metrics such as exchange rates and trade balances.
Sourced from reputable organizations, including U.S. government agencies, international institutions, and other public and private entities, FRED enables users to analyze over 825,000 time series, download their data in various formats, and integrate their information into analytical tools and programming workflows.
On TradingView, FRED data is available from ticker identifiers with the "FRED:" prefix. Users can search for FRED symbols in the "Symbol Search" window, and Pine scripts can retrieve data for these symbols via `request.*()` function calls.
FINRA Short Sale Volume
FINRA (the Financial Industry Regulatory Authority) is a non-governmental organization that supervises and regulates U.S. broker-dealers and securities professionals. Its primary aim is to protect investors and ensure integrity and transparency in financial markets.
FINRA's Short Sale Volume data provides detailed information about daily short-selling activity across U.S. equity markets. This data tracks the volume of short sales reported to FINRA's trade reporting facilities (TRFs), including shares sold on FINRA-regulated Alternative Trading Systems (ATSs) and over-the-counter (OTC) markets, offering transparent access to short-selling information not typically available from exchanges. This data helps market participants, researchers, and regulators monitor trends in short-selling and gain insights into bearish sentiment, hedging strategies, and potential market manipulation. Investors often use this data alongside other metrics to assess stock performance, liquidity, and overall trading activity.
It is important to note that FINRA's Short Sale Volume data does not consolidate short sale information from public exchanges and excludes trading activity that is not publicly disseminated.
TradingView provides ticker identifiers for requesting Short Sale Volume data with the format "FINRA:_SHORT_VOLUME", where "" is a supported U.S. equities symbol (e.g., "AAPL").
Open Interest (OI)
Open interest is a cornerstone indicator of market activity and sentiment in derivatives markets such as options or futures. In contrast to volume, which measures the number of contracts opened or closed within a period, OI measures the number of outstanding contracts that are not yet settled. This distinction makes OI a more robust indicator of how money flows through derivatives, offering meaningful insights into liquidity, market interest, and trends. Many traders and investors analyze OI alongside volume and price action to gain an enhanced perspective on market dynamics and reinforce trading decisions.
TradingView offers many ticker identifiers for requesting OI data with the format "_OI", where "" represents a derivative instrument's ticker ID (e.g., "COMEX:GC1!").
Commitment of Traders (COT)
Commitment of Traders data provides an informative weekly breakdown of the aggregate positions held by various market participants, including commercial hedgers, non-commercial speculators, and small traders, in the U.S. derivative markets. Tallied and managed by the Commodity Futures Trading Commission (CFTC) , these reports provide traders and analysts with detailed insight into an asset's open interest and help them assess the actions of various market players. COT data is valuable for gaining a deeper understanding of market dynamics, sentiment, trends, and liquidity, which helps traders develop informed trading strategies.
TradingView has numerous ticker identifiers that provide access to time series containing data for various COT metrics. To learn about COT ticker IDs and how they work, see our LibraryCOT publication.
█ USING THE LIBRARY
Common function characteristics
• This library's functions construct ticker IDs with valid formats based on their specified parameters, then use them as the `symbol` argument in request.security() to retrieve data from the specified context.
• Most of these functions automatically select the timeframe of a data request because the data feeds are not available for all timeframes.
• All the functions have two overloads. The first overload of each function uses values with the "simple" qualifier to define the requested context, meaning the context does not change after the first script execution. The second accepts "series" values, meaning it can request data from different contexts across executions.
• The `gaps` parameter in most of these functions specifies whether the returned data is `na` when a new value is unavailable for request. By default, its value is `false`, meaning the call returns the last retrieved data when no new data is available.
• The `repaint` parameter in applicable functions determines whether the request can fetch the latest unconfirmed values from a higher timeframe on realtime bars, which might repaint after the script restarts. If `false`, the function only returns confirmed higher-timeframe values to avoid repainting. The default value is `true`.
`fred()`
The `fred()` function retrieves the most recent value of a specified series from the Federal Reserve Economic Data (FRED) database. With this function, programmers can easily fetch macroeconomic indicators, such as GDP and unemployment rates, and use them directly in their scripts.
How it works
The function's `fredCode` parameter accepts a "string" representing the unique identifier of a specific FRED series. Examples include "GDP" for the "Gross Domestic Product" series and "UNRATE" for the "Unemployment Rate" series. Over 825,000 codes are available. To access codes for available series, search the FRED website .
The function adds the "FRED:" prefix to the specified `fredCode` to construct a valid FRED ticker ID (e.g., "FRED:GDP"), which it uses in request.security() to retrieve the series data.
Example Usage
This line of code requests the latest value from the Gross Domestic Product series and assigns the returned value to a `gdpValue` variable:
float gdpValue = fred("GDP")
`finraShortSaleVolume()`
The `finraShortSaleVolume()` function retrieves EOD data from a FINRA Short Sale Volume series. Programmers can call this function to retrieve short-selling information for equities listed on supported exchanges, namely NASDAQ, NYSE, and NYSE ARCA.
How it works
The `symbol` parameter determines which symbol's short sale volume information is retrieved by the function. If the value is na , the function requests short sale volume data for the chart's symbol. The argument can be the name of the symbol from a supported exchange (e.g., "AAPL") or a ticker ID with an exchange prefix ("NASDAQ:AAPL"). If the `symbol` contains an exchange prefix, it must be one of the following: "NASDAQ", "NYSE", "AMEX", or "BATS".
The function constructs a ticker ID in the format "FINRA:ticker_SHORT_VOLUME", where "ticker" is the symbol name without the exchange prefix (e.g., "AAPL"). It then uses the ticker ID in request.security() to retrieve the available data.
Example Usage
This line of code retrieves short sale volume for the chart's symbol and assigns the result to a `shortVolume` variable:
float shortVolume = finraShortSaleVolume(syminfo.tickerid)
This example requests short sale volume for the "NASDAQ:AAPL" symbol, irrespective of the current chart:
float shortVolume = finraShortSaleVolume("NASDAQ:AAPL")
`openInterestFutures()` and `openInterestCrypto()`
The `openInterestFutures()` function retrieves EOD open interest (OI) data for futures contracts. The `openInterestCrypto()` function provides more granular OI data for cryptocurrency contracts.
How they work
The `openInterestFutures()` function retrieves EOD closing OI information. Its design is focused primarily on retrieving OI data for futures, as only EOD OI data is available for these instruments. If the chart uses an intraday timeframe, the function requests data from the "1D" timeframe. Otherwise, it uses the chart's timeframe.
The `openInterestCrypto()` function retrieves opening, high, low, and closing OI data for a cryptocurrency contract on a specified timeframe. Unlike `openInterest()`, this function can also retrieve granular data from intraday timeframes.
Both functions contain a `symbol` parameter that determines the symbol for which the calls request OI data. The functions construct a valid OI ticker ID from the chosen symbol by appending "_OI" to the end (e.g., "CME:ES1!_OI").
The `openInterestFutures()` function requests and returns a two-element tuple containing the futures instrument's EOD closing OI and a "bool" condition indicating whether OI is rising.
The `openInterestCrypto()` function requests and returns a five-element tuple containing the cryptocurrency contract's opening, high, low, and closing OI, and a "bool" condition indicating whether OI is rising.
Example usage
This code line calls `openInterest()` to retrieve EOD OI and the OI rising condition for a futures symbol on the chart, assigning the values to two variables in a tuple:
= openInterestFutures(syminfo.tickerid)
This line retrieves the EOD OI data for "CME:ES1!", irrespective of the current chart's symbol:
= openInterestFutures("CME:ES1!")
This example uses `openInterestCrypto()` to retrieve OHLC OI data and the OI rising condition for a cryptocurrency contract on the chart, sampled at the chart's timeframe. It assigns the returned values to five variables in a tuple:
= openInterestCrypto(syminfo.tickerid, timeframe.period)
This call retrieves OI OHLC and rising information for "BINANCE:BTCUSDT.P" on the "1D" timeframe:
= openInterestCrypto("BINANCE:BTCUSDT.P", "1D")
`commitmentOfTraders()`
The `commitmentOfTraders()` function retrieves data from the Commitment of Traders (COT) reports published by the Commodity Futures Trading Commission (CFTC). This function significantly simplifies the COT request process, making it easier for programmers to access and utilize the available data.
How It Works
This function's parameters determine different parts of a valid ticker ID for retrieving COT data, offering a streamlined alternative to constructing complex COT ticker IDs manually. The `metricName`, `metricDirection`, and `includeOptions` parameters are required. They specify the name of the reported metric, the direction, and whether it includes information from options contracts.
The function also includes several optional parameters. The `CFTCCode` parameter allows programmers to request data for a specific report code. If unspecified, the function requests data based on the chart symbol's root prefix, base currency, or quoted currency, depending on the `mode` argument. The call can specify the report type ("Legacy", "Disaggregated", or "Financial") and metric type ("All", "Old", or "Other") with the `typeCOT` and `metricType` parameters.
Explore the CFTC website to find valid report codes for specific assets. To find detailed information about the metrics included in the reports and their meanings, see the CFTC's Explanatory Notes .
View the function's documentation below for detailed explanations of its parameters. For in-depth information about COT ticker IDs and more advanced functionality, refer to our previously published COT library .
Available metrics
Different COT report types provide different metrics . The tables below list all available metrics for each type and their applicable directions:
+------------------------------+------------------------+
| Legacy (COT) Metric Names | Directions |
+------------------------------+------------------------+
| Open Interest | No direction |
| Noncommercial Positions | Long, Short, Spreading |
| Commercial Positions | Long, Short |
| Total Reportable Positions | Long, Short |
| Nonreportable Positions | Long, Short |
| Traders Total | No direction |
| Traders Noncommercial | Long, Short, Spreading |
| Traders Commercial | Long, Short |
| Traders Total Reportable | Long, Short |
| Concentration Gross LT 4 TDR | Long, Short |
| Concentration Gross LT 8 TDR | Long, Short |
| Concentration Net LT 4 TDR | Long, Short |
| Concentration Net LT 8 TDR | Long, Short |
+------------------------------+------------------------+
+-----------------------------------+------------------------+
| Disaggregated (COT2) Metric Names | Directions |
+-----------------------------------+------------------------+
| Open Interest | No Direction |
| Producer Merchant Positions | Long, Short |
| Swap Positions | Long, Short, Spreading |
| Managed Money Positions | Long, Short, Spreading |
| Other Reportable Positions | Long, Short, Spreading |
| Total Reportable Positions | Long, Short |
| Nonreportable Positions | Long, Short |
| Traders Total | No Direction |
| Traders Producer Merchant | Long, Short |
| Traders Swap | Long, Short, Spreading |
| Traders Managed Money | Long, Short, Spreading |
| Traders Other Reportable | Long, Short, Spreading |
| Traders Total Reportable | Long, Short |
| Concentration Gross LE 4 TDR | Long, Short |
| Concentration Gross LE 8 TDR | Long, Short |
| Concentration Net LE 4 TDR | Long, Short |
| Concentration Net LE 8 TDR | Long, Short |
+-----------------------------------+------------------------+
+-------------------------------+------------------------+
| Financial (COT3) Metric Names | Directions |
+-------------------------------+------------------------+
| Open Interest | No Direction |
| Dealer Positions | Long, Short, Spreading |
| Asset Manager Positions | Long, Short, Spreading |
| Leveraged Funds Positions | Long, Short, Spreading |
| Other Reportable Positions | Long, Short, Spreading |
| Total Reportable Positions | Long, Short |
| Nonreportable Positions | Long, Short |
| Traders Total | No Direction |
| Traders Dealer | Long, Short, Spreading |
| Traders Asset Manager | Long, Short, Spreading |
| Traders Leveraged Funds | Long, Short, Spreading |
| Traders Other Reportable | Long, Short, Spreading |
| Traders Total Reportable | Long, Short |
| Concentration Gross LE 4 TDR | Long, Short |
| Concentration Gross LE 8 TDR | Long, Short |
| Concentration Net LE 4 TDR | Long, Short |
| Concentration Net LE 8 TDR | Long, Short |
+-------------------------------+------------------------+
Example usage
This code line retrieves "Noncommercial Positions (Long)" data, without options information, from the "Legacy" report for the chart symbol's root, base currency, or quote currency:
float nonCommercialLong = commitmentOfTraders("Noncommercial Positions", "Long", false)
This example retrieves "Managed Money Positions (Short)" data, with options included, from the "Disaggregated" report:
float disaggregatedData = commitmentOfTraders("Managed Money Positions", "Short", true, "", "Disaggregated")
█ NOTES
• This library uses dynamic requests , allowing dynamic ("series") arguments for the parameters defining the context (ticker ID, timeframe, etc.) of a `request.*()` function call. With this feature, a single `request.*()` call instance can flexibly retrieve data from different feeds across historical executions. Additionally, scripts can use such calls in the local scopes of loops, conditional structures, and even exported library functions, as demonstrated in this script. All scripts coded in Pine Script™ v6 have dynamic requests enabled by default. To learn more about the behaviors and limitations of this feature, see the Dynamic requests section of the Pine Script™ User Manual.
• The library's example code offers a simple demonstration of the exported functions. The script retrieves available data using the function specified by the "Series type" input. The code requests a FRED series or COT (Legacy), FINRA Short Sale Volume, or Open Interest series for the chart's symbol with specific parameters, then plots the retrieved data as a step-line with diamond markers.
Look first. Then leap.
█ EXPORTED FUNCTIONS
This library exports the following functions:
fred(fredCode, gaps)
Requests a value from a specified Federal Reserve Economic Data (FRED) series. FRED is a comprehensive source that hosts numerous U.S. economic datasets. To explore available FRED datasets and codes, search for specific categories or keywords at fred.stlouisfed.org Calls to this function count toward a script's `request.*()` call limit.
Parameters:
fredCode (series string) : The unique identifier of the FRED series. The function uses the value to create a valid ticker ID for retrieving FRED data in the format `"FRED:fredCode"`. For example, `"GDP"` refers to the "Gross Domestic Product" series ("FRED:GDP"), and `"GFDEBTN"` refers to the "Federal Debt: Total Public Debt" series ("FRED:GFDEBTN").
gaps (simple bool) : Optional. If `true`, the function returns a non-na value only when a new value is available from the requested context. If `false`, the function returns the latest retrieved value when new data is unavailable. The default is `false`.
Returns: (float) The value from the requested FRED series.
finraShortSaleVolume(symbol, gaps, repaint)
Requests FINRA daily short sale volume data for a specified symbol from one of the following exchanges: NASDAQ, NYSE, NYSE ARCA. If the chart uses an intraday timeframe, the function requests data from the "1D" timeframe. Otherwise, it uses the chart's timeframe. Calls to this function count toward a script's `request.*()` call limit.
Parameters:
symbol (series string) : The symbol for which to request short sale volume data. If the specified value contains an exchange prefix, it must be one of the following: "NASDAQ", "NYSE", "AMEX", "BATS".
gaps (simple bool) : Optional. If `true`, the function returns a non-na value only when a new value is available from the requested context. If `false`, the function returns the latest retrieved value when new data is unavailable. The default is `false`.
repaint (simple bool) : Optional. If `true` and the chart's timeframe is intraday, the value requested on realtime bars may change its time offset after the script restarts its executions. If `false`, the function returns the last confirmed period's values to avoid repainting. The default is `true`.
Returns: (float) The short sale volume for the specified symbol or the chart's symbol.
openInterestFutures(symbol, gaps, repaint)
Requests EOD open interest (OI) and OI rising information for a valid futures symbol. If the chart uses an intraday timeframe, the function requests data from the "1D" timeframe. Otherwise, it uses the chart's timeframe. Calls to this function count toward a script's `request.*()` call limit.
Parameters:
symbol (series string) : The symbol for which to request open interest data.
gaps (simple bool) : Optional. If `true`, the function returns non-na values only when new values are available from the requested context. If `false`, the function returns the latest retrieved values when new data is unavailable. The default is `false`.
repaint (simple bool) : Optional. If `true` and the chart's timeframe is intraday, the value requested on realtime bars may change its time offset after the script restarts its executions. If `false`, the function returns the last confirmed period's values to avoid repainting. The default is `true`.
Returns: ( ) A tuple containing the following values:
- The closing OI value for the symbol.
- `true` if the closing OI is above the previous period's value, `false` otherwise.
openInterestCrypto(symbol, timeframe, gaps, repaint)
Requests opening, high, low, and closing open interest (OI) data and OI rising information for a valid cryptocurrency contract on a specified timeframe. Calls to this function count toward a script's `request.*()` call limit.
Parameters:
symbol (series string) : The symbol for which to request open interest data.
timeframe (series string) : The timeframe of the data request. If the timeframe is lower than the chart's timeframe, it causes a runtime error.
gaps (simple bool) : Optional. If `true`, the function returns non-na values only when new values are available from the requested context. If `false`, the function returns the latest retrieved values when new data is unavailable. The default is `false`.
repaint (simple bool) : Optional. If `true` and the `timeframe` represents a higher timeframe, the function returns unconfirmed values from the timeframe on realtime bars, which repaint when the script restarts its executions. If `false`, it returns only confirmed higher-timeframe values to avoid repainting. The default is `true`.
Returns: ( ) A tuple containing the following values:
- The opening, high, low, and closing OI values for the symbol, respectively.
- `true` if the closing OI is above the previous period's value, `false` otherwise.
commitmentOfTraders(metricName, metricDirection, includeOptions, CFTCCode, typeCOT, mode, metricType)
Requests Commitment of Traders (COT) data with specified parameters. This function provides a simplified way to access CFTC COT data available on TradingView. Calls to this function count toward a script's `request.*()` call limit. For more advanced tools and detailed information about COT data, see TradingView's LibraryCOT library.
Parameters:
metricName (series string) : One of the valid metric names listed in the library's documentation and source code.
metricDirection (series string) : Metric direction. Possible values are: "Long", "Short", "Spreading", and "No direction". Consult the library's documentation or code to see which direction values apply to the specified metric.
includeOptions (series bool) : If `true`, the COT symbol includes options information. Otherwise, it does not.
CFTCCode (series string) : Optional. The CFTC code for the asset. For example, wheat futures (root "ZW") have the code "001602". If one is not specified, the function will attempt to get a valid code for the chart symbol's root, base currency, or main currency.
typeCOT (series string) : Optional. The type of report to request. Possible values are: "Legacy", "Disaggregated", "Financial". The default is "Legacy".
mode (series string) : Optional. Specifies the information the function extracts from a symbol. Possible modes are:
- "Root": The function extracts the futures symbol's root prefix information (e.g., "ES" for "ESH2020").
- "Base currency": The function extracts the first currency from a currency pair (e.g., "EUR" for "EURUSD").
- "Currency": The function extracts the currency of the symbol's quoted values (e.g., "JPY" for "TSE:9984" or "USDJPY").
- "Auto": The function tries the first three modes (Root -> Base currency -> Currency) until it finds a match.
The default is "Auto". If the specified mode is not available for the symbol, it causes a runtime error.
metricType (series string) : Optional. The metric type. Possible values are: "All", "Old", "Other". The default is "All".
Returns: (float) The specified Commitment of Traders data series. If no data is available, it causes a runtime error.

Trident FinderIntroduction to the Trident Finder
The Trident Finder is a Pine Script indicator that identifies unique bullish and bearish patterns called Tridents. These patterns are based on specific relationships between consecutive candles, combined with a simple moving average (SMA) filter for added precision. By spotting these patterns, traders can potentially identify high-probability reversal points or trend continuations.
Core Logic
The indicator identifies two patterns:
Bullish Trident
A bullish Trident forms when:
Candle (two candles back) has its High-Low range entirely above Candle (the preceding candle).
Candle (the current candle) has its Open-High-Low-Close (OHLC) above the Low of Candle .
Candle closes higher than it opens and higher than Candle ’s close.
Candle closes below the SMA, indicating a potential upward breakout against the trend.
Bearish Trident
A bearish Trident forms when:
Candle has its High-Low range entirely below Candle .
Candle has its OHLC below the High of Candle .
Candle closes lower than it opens and lower than Candle ’s close.
Candle closes above the SMA, indicating a potential downward breakout against the trend.
Visual Representation
Bullish Tridents are marked with green "Up" labels below the candle.
Bearish Tridents are marked with red "Down" labels above the candle.
The SMA is plotted as a maroon line to serve as a filter for the Trident patterns.
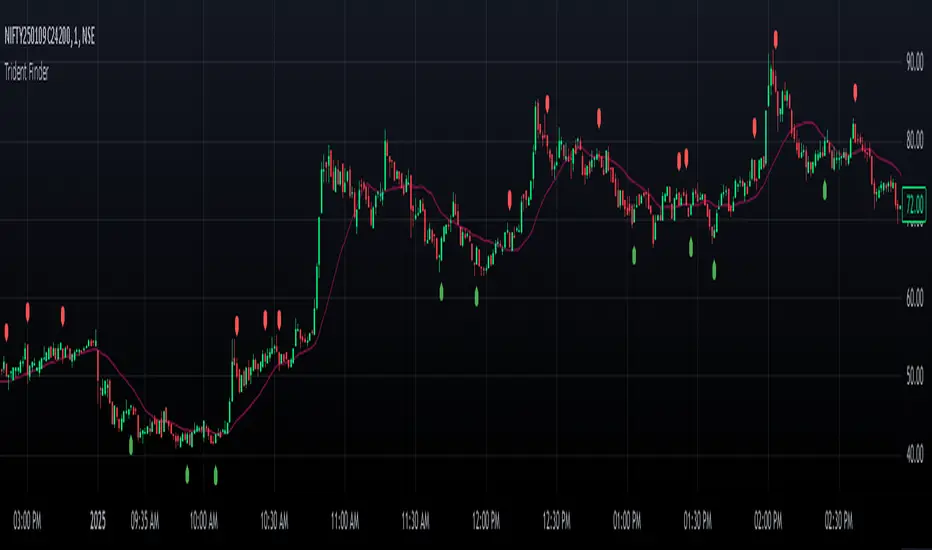
CandleCandle: A Comprehensive Pine Script™ Library for Candlestick Analysis
Overview
The Candle library, developed in Pine Script™, provides traders and developers with a robust toolkit for analyzing candlestick data. By offering easy access to fundamental candlestick components like open, high, low, and close prices, along with advanced derived metrics such as body-to-wick ratios, percentage calculations, and volatility analysis, this library enables detailed insights into market behavior.
This library is ideal for creating custom indicators, trading strategies, and backtesting frameworks, making it a powerful resource for any Pine Script™ developer.
Key Features
1. Core Candlestick Data
• Open : Access the opening price of the current candle.
• High : Retrieve the highest price.
• Low : Retrieve the lowest price.
• Close : Access the closing price.
2. Candle Metrics
• Full Size : Calculates the total range of the candle (high - low).
• Body Size : Computes the size of the candle’s body (open - close).
• Wick Size : Provides the combined size of the upper and lower wicks.
3. Wick and Body Ratios
• Upper Wick Size and Lower Wick Size .
• Body-to-Wick Ratio and Wick-to-Body Ratio .
4. Percentage Calculations
• Upper Wick Percentage : The proportion of the upper wick size relative to the full candle size.
• Lower Wick Percentage : The proportion of the lower wick size relative to the full candle size.
• Body Percentage and Wick Percentage relative to the candle’s range.
5. Candle Direction Analysis
• Determines if a candle is "Bullish" or "Bearish" based on its closing and opening prices.
6. Price Metrics
• Average Price : The mean of the open, high, low, and close prices.
• Midpoint Price : The midpoint between the high and low prices.
7. Volatility Measurement
• Calculates the standard deviation of the OHLC prices, providing a volatility metric for the current candle.
Code Architecture
Example Functionality
The library employs a modular structure, exporting various functions that can be used independently or in combination. For instance:
// This Pine Script™ code is subject to the terms of the Mozilla Public License 2.0 at mozilla.org
// © DevArjun
//@version=6
indicator("Candle Data", overlay = true)
import DevArjun/Candle/1 as Candle
// Body Size %
bodySize = Candle.BodySize()
// Determining the candle direction
candleDirection = Candle.CandleDirection()
// Calculating the volatility of the current candle
volatility = Candle.Volatility()
// Plotting the metrics (for demonstration)
plot(bodySize, title="Body Size", color=color.blue)
label.new(bar_index, high, candleDirection, style=label.style_circle)
Scalability
The modularity of the Candle library allows seamless integration into more extensive trading systems. Functions can be mixed and matched to suit specific analytical or strategic needs.
Use Cases
Trading Strategies
Developers can use the library to create strategies based on candle properties such as:
• Identifying long-bodied candles (momentum signals).
• Detecting wicks as potential reversal zones.
• Filtering trades based on candle ratios.
Visualization
Plotting components like body size, wick size, and directional labels helps visualize market behavior and identify patterns.
Backtesting
By incorporating volatility and ratio metrics, traders can design and test strategies on historical data, ensuring robust performance before live trading.
Education
This library is a great tool for teaching candlestick analysis and how each component contributes to market behavior.
Portfolio Highlights
Project Objective
To create a Pine Script™ library that simplifies candlestick analysis by providing comprehensive metrics and insights, empowering traders and developers with advanced tools for market analysis.
Development Challenges and Solutions
• Challenge : Achieving high precision in calculating ratios and percentages.
• Solution : Implemented robust mathematical operations and safeguarded against division-by-zero errors.
• Challenge : Ensuring modularity and scalability.
• Solution : Designed functions as independent modules, allowing flexible integration.
Impact
• Efficiency : The library reduces the time required to calculate complex candlestick metrics.
• Versatility : Supports various trading styles, from scalping to swing trading.
• Clarity : Clean code and detailed documentation ensure usability for developers of all levels.
Conclusion
The Candle library exemplifies the power of Pine Script™ in simplifying and enhancing candlestick analysis. By including this project in your portfolio, you showcase your expertise in:
• Financial data analysis.
• Pine Script™ development.
• Creating tools that solve real-world trading challenges.
This project demonstrates both technical proficiency and a keen understanding of market analysis, making it an excellent addition to your professional portfolio.
Library "Candle"
A comprehensive library to access and analyze the basic components of a candlestick, including open, high, low, close prices, and various derived metrics such as full size, body size, wick sizes, ratios, percentages, and additional analysis metrics.
Open()
Open
@description Returns the opening price of the current candle.
Returns: float - The opening price of the current candle.
High()
High
@description Returns the highest price of the current candle.
Returns: float - The highest price of the current candle.
Low()
Low
@description Returns the lowest price of the current candle.
Returns: float - The lowest price of the current candle.
Close()
Close
@description Returns the closing price of the current candle.
Returns: float - The closing price of the current candle.
FullSize()
FullSize
@description Returns the full size (range) of the current candle (high - low).
Returns: float - The full size of the current candle.
BodySize()
BodySize
@description Returns the body size of the current candle (open - close).
Returns: float - The body size of the current candle.
WickSize()
WickSize
@description Returns the size of the wicks of the current candle (full size - body size).
Returns: float - The size of the wicks of the current candle.
UpperWickSize()
UpperWickSize
@description Returns the size of the upper wick of the current candle.
Returns: float - The size of the upper wick of the current candle.
LowerWickSize()
LowerWickSize
@description Returns the size of the lower wick of the current candle.
Returns: float - The size of the lower wick of the current candle.
BodyToWickRatio()
BodyToWickRatio
@description Returns the ratio of the body size to the wick size of the current candle.
Returns: float - The body to wick ratio of the current candle.
UpperWickPercentage()
UpperWickPercentage
@description Returns the percentage of the upper wick size relative to the full size of the current candle.
Returns: float - The percentage of the upper wick size relative to the full size of the current candle.
LowerWickPercentage()
LowerWickPercentage
@description Returns the percentage of the lower wick size relative to the full size of the current candle.
Returns: float - The percentage of the lower wick size relative to the full size of the current candle.
WickToBodyRatio()
WickToBodyRatio
@description Returns the ratio of the wick size to the body size of the current candle.
Returns: float - The wick to body ratio of the current candle.
BodyPercentage()
BodyPercentage
@description Returns the percentage of the body size relative to the full size of the current candle.
Returns: float - The percentage of the body size relative to the full size of the current candle.
WickPercentage()
WickPercentage
@description Returns the percentage of the wick size relative to the full size of the current candle.
Returns: float - The percentage of the wick size relative to the full size of the current candle.
CandleDirection()
CandleDirection
@description Returns the direction of the current candle.
Returns: string - "Bullish" if the candle is bullish, "Bearish" if the candle is bearish.
AveragePrice()
AveragePrice
@description Returns the average price of the current candle (mean of open, high, low, and close).
Returns: float - The average price of the current candle.
MidpointPrice()
MidpointPrice
@description Returns the midpoint price of the current candle (mean of high and low).
Returns: float - The midpoint price of the current candle.
Volatility()
Volatility
@description Returns the standard deviation of the OHLC prices of the current candle.
Returns: float - The volatility of the current candle.
HTF Candles Overlay [Trendoscope®]🎲 HTF Candles Overlay is a simple indicator where you can overlay higher timeframe candles on current timeframe chart.
Most of the code is encapsulated in the library HTFCandlesLib . After publishing the library as open source, many people requested to convert that into an indicator. Based on this, we decided to publish this small code for the use of community.
🎯 Usage
The indicator is simple, it helps users visualise higher timeframe candles. We majorly use this for debugging or validating our implementations based on higher timeframe. Instead of switching back and forth to different timeframes, it helps us visualise higher timeframe candles on the same chart when we are validating the implementation that involves higher timeframe calculations.
🎯 Components
The indicator provides two types of displays
Candles - overlay candles built through lines and labels
Plot - close price of higher timeframe plotted on chart
🎯 Candles
The behaviour of the candles are similar to that of hollow candles. The color of the body and the border+wick demonstrates the movement of the candle.
Body color is lime if the HTF close is higher than HTF open. Body color is orange if the HTF close is lower than the HTF open.
Wick and border color is lime if HTF close price is higher than previous HTF close price. And they are orange if HTF close price is lower than the previous HTF close price
In most cases body color will be same as the wick color. In case of stocks and indices, it may happen that the open price is too far away from previous close price due to gaps. This can lead to close price being relatively in different direction when compared to open and previous close.
Wicks are not at the centre of the candle. Instead wicks are drawn on the current chart timeframe position where the current timeframe has reached the highest or lowest point within the given HTF candle
Candles also list OHLC price of HTF candle along with HTF bar index and the range of LTF bar index that the candle spawns
Here are some pictorial representations that can help understand better.
Here are the examples of candles with gaps where body and wick/border are in different directions (colours)
🎯 Indicator Settings
Simple settings allow users to select the timeframe, whether to display candles and plots and their specific colors.
🎯 Possible inconsistencies
The overlay can show inconsistent data in certain situations. Here are some of the scenarios where the indicator may not show consistent display of the data.
When the HTF data from request.security does not match that of combined LTF data . In such cases, HTF candles may not form inline with the current timeframe candles. This happens when there is a data issue of different OHLC data available in tradingview.
When using weekly candle as either chart timeframe or higher timeframe - end of week may not coincide with end of month or other timeframes. This can cause some inconsistencies in the visuals of the indicator.
When open and close time of either LTF or HTF falls under different day due to time zone used. - time is always the time on which the candle close. So, when we use time zone that causes the exchange day to open and close on different days, that can cause some inconsistencies in the candles being drawn.

Mean Price
^^ Plotting switched to Line.
This method of financial time series (aka bars) downsampling is literally, naturally, and thankfully the best you can do in terms of maximizing info gain. You can finally chill and feed it to your studies & eyes, and probably use nothing else anymore.
(HL2 and occ3 also have use cases, but other aggregation methods? Not really, even if they do, the use cases are ‘very’ specific). Tho in order to understand why, you gotta read the following wall, or just believe me telling you, ‘I put it on my momma’.
The true story about trading volumes and why this is all a big misdirection
Actually, you don’t need to be a quant to get there. All you gotta do is stop blindly following other people’s contextual (at best) solutions, eg OC2 aggregation xD, and start using your own brain to figure things out.
Every individual trade (basically an imprint on 1D price space that emerges when market orders hit the order book) has several features like: price, time, volume, AND direction (Up if a market buy order hits the asks, Down if a market sell order hits the bids). Now, the last two features—volume and direction—can be effectively combined into one (by multiplying volume by 1 or -1), and this is probably how every order matching engine should output data. If we’re not considering size/direction, we’re leaving data behind. Moreover, trades aren’t just one-price dots all the time. One trade can consume liquidity on several levels of the order book, so a single trade can be several ticks big on the price axis.
You may think now that there are no zero-volume ticks. Well, yes and no. It depends on how you design an exchange and whether you allow intra-spread trades/mid-spread trades (now try to Google it). Intra-spread trades could happen if implemented when a matching engine receives both buy and sell orders at the same microsecond period. This way, you can match the orders with each other at a better price for both parties without even hitting the book and consuming liquidity. Also, if orders have different sizes, the remaining part of the bigger order can be sent to the order book. Basically, this type of trade can be treated as an OTC trade, having zero volume because we never actually hit the book—there’s no imprint. Another reason why it makes sense is when we think about volume as an impact or imbalance act, and how the medium (order book in our case) responds to it, providing information. OTC and mid-spread trades are not aggressive sells or buys; they’re neutral ticks, so to say. However huge they are, sometimes many blocks on NYSE, they don’t move the price because there’s no impact on the medium (again, which is the order book)—they’re not providing information.
... Now, we need to aggregate these trades into, let’s say, 1-hour bars (remember that a trade can have either positive or negative volume). We either don’t want to do it, or we don’t have this kind of information. What we can do is take already aggregated OHLC bars and extract all the info from them. Given the market is fractal, bars & trades gotta have the same set of features:
- Highest & lowest ticks (high & low) <- by price;
- First & last ticks (open & close) <- by time;
- Biggest and smallest ticks <- by volume.*
*e.g., in the array ,
2323: biggest trade,
-1212: smallest trade.
Now, in our world, somehow nobody started to care about the biggest and smallest trades and their inclusion in OHLC data, while this is actually natural. It’s the same way as it’s done with high & low and open & close: we choose the minimum and maximum value of a given feature/axis within the aggregation period.
So, we don’t have these 2 values: biggest and smallest ticks. The best we can do is infer them, and given the fact the biggest and smallest ticks can be located with the same probability everywhere, all we can do is predict them in the middle of the bar, both in time and price axes. That’s why you can see two HL2’s in each of the 3 formulas in the code.
So, summed up absolute volumes that you see in almost every trading platform are actually just a derivative metric, something that I call Type 2 time series in my own (proprietary ‘for now’) methods. It doesn’t have much to do with market orders hitting the non-uniform medium (aka order book); it’s more like a statistic. Still wanna use VWAP? Ok, but you gotta understand you’re weighting Type 1 (natural) time series by Type 2 (synthetic) ones.
How to combine all the data in the right way (khmm khhm ‘order’)
Now, since we have 6 values for each bar, let’s see what information we have about them, what we don’t have, and what we can do about it:
- Open and close: we got both when and where (time (order) and price);
- High and low: we got where, but we don’t know when;
- Biggest & smallest trades: we know shit, we infer it the way it was described before.'
By using the location of the close & open prices relative to the high & low prices, we can make educated guesses about whether high or low was made first in a given bar. It’s not perfect, but it’s ultimately all we can do—this is the very last bit of info we can extract from the data we have.
There are 2 methods for inferring volume delta (which I call simply volume) that are presented everywhere, even here on TradingView. Funny thing is, this is actually 2 parts of the 1 method. I wonder how many folks see through it xD. The same method can be used for both inferring volume delta AND making educated guesses whether high or low was made first.
Imagine and/or find the cases on your charts to understand faster:
* Close > open means we have an up bar and probably the volume is positive, and probably high was made later than low.
* Close < open means we have a down bar and probably the volume is negative, and probably low was made later than high.
Now that’s the point when you see that these 2 mentioned methods are actually parts of the 1 method:
If close = open, we still have another clue: distance from open/close pair to high (HC), and distance from open/close pair to low (LC):
* HC < LC, probably high was made later.
* HC > LC, probably low was made later.
And only if close = open and HC = LC, only in this case we have no clue whether high or low was made earlier within a bar. We simply don’t have any more information to even guess. This bar is called a neutral bar.
At this point, we have both time (order) and price info for each of our 6 values. Now, we have to solve another weighted average problem, and that’s it. We’ll weight prices according to the order we’ve guessed. In the neutral bar case, open has a weight of 1, close has a weight of 3, and both high and low have weights of 2 since we can’t infer which one was made first. In all cases, biggest and smallest ticks are modeled with HL2 and weighted like they’re located in the middle of the bar in a time sense.
P.S.: I’ve also included a "robust" method where all the bars are treated like neutral ones. I’ve used it before; obviously, it has lesser info gain -> works a bit worse.