[ALERTS] MA Cross ElevenThis script is a crossing of eleven different MA, with alerts and SL and TP.
The simplest is what works best.
SMA --> Simple
EMA --> Exponential
WMA --> Weighted
VWMA --> Volume Weighted
SMMA --> Smoothed
DEMA --> Double Exponential
TEMA --> Triple Exponential
HMA --> Hull
TMA --> Triangular
SSMA --> SuperSmoother filter
ZEMA --> Zero Lag Exponential
Using "once per bar close" repaint is 0%, but if you like risk can choose "once per bar", better profit.
Thanks to JustUncleL and his amazing sripts.
Cari skrip untuk "Exponential"

[STRATEGY] MA Cross ElevenThis script is a crossing of eleven different MA, with alerts and SL and TP.
The simplest is what works best...
SMA --> Simple
EMA --> Exponential
WMA --> Weighted
VWMA --> Volume Weighted
SMMA --> Smoothed
DEMA --> Double Exponential
TEMA --> Triple Exponential
HMA --> Hull
TMA --> Triangular
SSMA --> SuperSmoother filter
ZEMA --> Zero Lag Exponential
Using "once per bar close" repaint is 0%, but if you like risk can choose "once per bar", better profit.
Thanks to JustUncleL and his amazing sripts.
Enjoy!
www.tradingview.com
"Note: When using non-standard (Renko, Kagi, Line Break, Point and Figure, Heikin Ashi, Spread Charts) types of chart as a basis for strategy, you need to realize that the result will be different. The orders will be executed at the prices of this chart (e.g.for Heikin Ashi it’ll take Heikin Ashi prices (the average ones) not the real market prices). Therefore we highly recommend you to use standard chart type for strategies."

RSI + BB (EMA) + Dispersion (2.0)First version here
Initial data:
1) RSI
2) Bollinger Bands (Basis - EMA )
3) Dispersion (around basis)
Signal for purchase: RSI crosses the dispersion zone upwards
Signal for sale: RSI crosses the dispersion zone downwards
Buffer zone: white area, it is not recommended to make transactions.
--- Add ( 02.10.2018 )
1) RSI lines (overbought / oversold) = 70 / 30. Сan be changed in the settings.
2) Alerts:
• RSI line crossover Dispersion Zone (green)
• RSI line crossunder Dispersion Zone (red)

MA&EMA - 10 - LibertusHello all,
Did you ever wanted to have loads of MA's and EMA's on your screen? This is script for you.
It will help you track most important MA's and EMA's. You can hide ones you don't need or change them into MA/EMA you need but it's not here by default.
Good trading and best of luck!

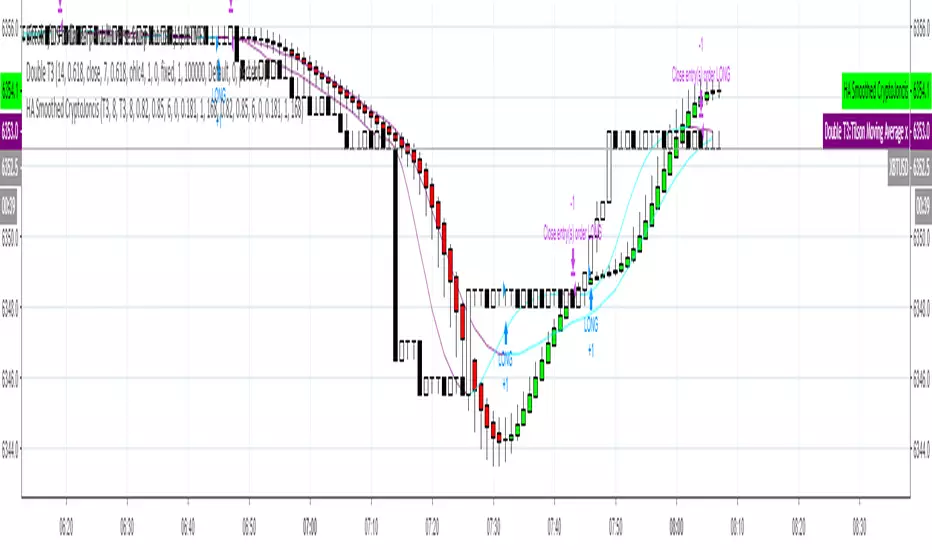
Heikin-Ashi Smoothed with option to change MA types CryptoJoncisPine Script version=3
Author CryptoJoncis
Heikin-Ashi Smoothed
The Heikin-Ashi Smoothed study is based upon the standard Heikin-Ashi study with additional moving average calculations. The following is the calculation formula for the bars:
1. The current bar Open, High, Low, Close values are smoothed individually by using the moving average type specified by the Moving Average Type 1 Input with a length/period specified by the Moving Average Period 1 Input.
2. The Heikin-Ashi bar Open, High, Low, Close values are set using the smoothed values from step 1. This is performed using the standard Heikin-Ashi formula.
3. The final Heikin-Ashi Open, High, Low, Close values are calculated by doing a second smoothing of the bar values from step 2 by using the moving average type specified by the Moving Average Type 2 Input with a length/period specified by the Moving Average Period 2 Input.
If you choose to tick the box where it offers to use only one smoothed HA then it skips the third/final step and you do not need to choose the second MA type for it to work.
Remember, using FRAMA, always make sure you use even number for length.
For simple Heikin-Ashi, please tick single smoothed and DEFAULT (Not smoothed as there are no MA used)
Heikin-Ashi bars are calculated:
1. Close = (Open + High + Low + Close) / 4
This is the average price of the current bar.
2. Open = (Open of Previous Bar + Close of Previous Bar) / 2
This is the midpoint of the previous bar.
3. High = Max of (High, Open, Close)
Highest value of the three.
4. Low = Min of (Low, Open, Close)
Lowest value of the three.
Any questions/suggestions/errors or spelling mistakes? Please leave a comment and let me know. I will try to fix it.
This took me few days to finish, so I hope you will find it useful.
Would you like to have more MA type choices? Please comment down with any other which aren't included in this indicator and I will research them and add.
MA included in this script:
Tillson Moving Average (T3)
Double Exponential Moving Average (DEMA)
Arnaud Legoux Moving Average (ALMA)
Least Squares Moving Average (LSMA)
Simple Moving Average (SMA)
Exponential Moving Average (EMA)
Weighted Moving Average (WMA)
Smoothed Moving Average (SMMA)
Triple Exponential Moving Average (TEMA)
Hull Moving Average (HMA)
Adaptive moving average (AMA)
Fractal Adaptive Moving Average (FAMA)
Variable Index Dynamic Average (VIDYA)
Triangular Moving Average (TRIMA)
You can use,publish,modify this code in any way as you wish, but only if you reference me after.
You are not allowed to sell it as it is.
If this code is useful to you, then consider to buy me a coffee (or better a pint of beer) by donating Bitcoin or Etherium to:
BTC: 3FiBnveHo3YW6DSiPEmoCFCyCnsrWS3JBR
ETH: 0xac290B4A721f5ef75b0971F1102e01E1942A4578
References:
www.sierrachart.com
www.investopedia.com
www.binarytribune.com
www.investopedia.com
www.stockfetcher.com
www.mql5.com
www.incrediblecharts.com
help.cqg.com
www.blastchart.com
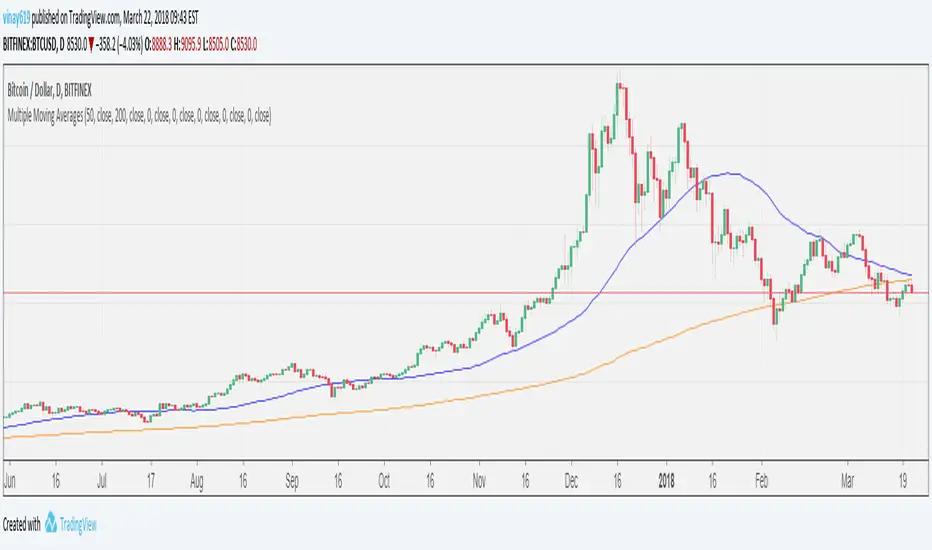
Multiple Moving AveragesFeatures
- 7 MAs in one indicator
- User changeable period for each MA
- SMA/EMA user selectable option for each MA
- Source (close,open,high,low etc) user selectable option for each MA
XPloRR MA-Trailing-Stop StrategyXPloRR MA-Trailing-Stop Strategy
Long term MA-Trailing-Stop strategy with Adjustable Signal Strength to beat Buy&Hold strategy
None of the strategies that I tested can beat the long term Buy&Hold strategy. That's the reason why I wrote this strategy.
Purpose: beat Buy&Hold strategy with around 10 trades. 100% capitalize sold trade into new trade.
My buy strategy is triggered by the fast buy EMA (blue) crossing over the slow buy SMA curve (orange) and the fast buy EMA has a certain up strength.
My sell strategy is triggered by either one of these conditions:
the EMA(6) of the close value is crossing under the trailing stop value (green) or
the fast sell EMA (navy) is crossing under the slow sell SMA curve (red) and the fast sell EMA has a certain down strength.
The trailing stop value (green) is set to a multiple of the ATR(15) value.
ATR(15) is the SMA(15) value of the difference between the high and low values.
The scripts shows a lot of graphical information:
The close value is shown in light-green. When the close value is lower then the buy value, the close value is shown in light-red. This way it is possible to evaluate the virtual losses during the trade.
the trailing stop value is shown in dark-green. When the sell value is lower then the buy value, the last color of the trade will be red (best viewed when zoomed)(in the example, there are 2 trades that end in gain and 2 in loss (red line at end))
the EMA and SMA values for both buy and sell signals are shown as a line
the buy and sell(close) signals are labeled in blue
How to use this strategy?
Every stock has it's own "DNA", so first thing to do is tune the right parameters to get the best strategy values voor EMA , SMA, Strength for both buy and sell and the Trailing Stop (#ATR).
Look in the strategy tester overview to optimize the values Percent Profitable and Net Profit (using the strategy settings icon, you can increase/decrease the parameters)
Then keep using these parameters for future buy/sell signals only for that particular stock.
Do the same for other stocks.
Important : optimizing these parameters is no guarantee for future winning trades!
Here are the parameters:
Fast EMA Buy: buy trigger when Fast EMA Buy crosses over the Slow SMA Buy value (use values between 10-20)
Slow SMA Buy: buy trigger when Fast EMA Buy crosses over the Slow SMA Buy value (use values between 30-100)
Minimum Buy Strength: minimum upward trend value of the Fast SMA Buy value (directional coefficient)(use values between 0-120)
Fast EMA Sell: sell trigger when Fast EMA Sell crosses under the Slow SMA Sell value (use values between 10-20)
Slow SMA Sell: sell trigger when Fast EMA Sell crosses under the Slow SMA Sell value (use values between 30-100)
Minimum Sell Strength: minimum downward trend value of the Fast SMA Sell value (directional coefficient)(use values between 0-120)
Trailing Stop (#ATR): the trailing stop value as a multiple of the ATR(15) value (use values between 2-20)
Example parameters for different stocks (Start capital: 1000, Order=100% of equity, Period 1/1/2005 to now) compared to the Buy&Hold Strategy(=do nothing):
BEKB(Bekaert): EMA-Buy=12, SMA-Buy=44, Strength-Buy=65, EMA-Sell=12, SMA-Sell=55, Strength-Sell=120, Stop#ATR=20
NetProfit: 996%, #Trades: 6, %Profitable: 83%, Buy&HoldProfit: 78%
BAR(Barco): EMA-Buy=16, SMA-Buy=80, Strength-Buy=44, EMA-Sell=12, SMA-Sell=45, Strength-Sell=82, Stop#ATR=9
NetProfit: 385%, #Trades: 7, %Profitable: 71%, Buy&HoldProfit: 55%
AAPL(Apple): EMA-Buy=12, SMA-Buy=45, Strength-Buy=40, EMA-Sell=19, SMA-Sell=45, Strength-Sell=106, Stop#ATR=8
NetProfit: 6900%, #Trades: 7, %Profitable: 71%, Buy&HoldProfit: 2938%
TNET(Telenet): EMA-Buy=12, SMA-Buy=45, Strength-Buy=27, EMA-Sell=19, SMA-Sell=45, Strength-Sell=70, Stop#ATR=14
NetProfit: 129%, #Trade

Triple Simple Moving AveragesBased on AdventTrading's TEMA script, but using simple moving averages instead of exponential. Also changed the colours to be nicer.

Log-Space EMA Ribbon [Krypt]Similar to basic EMA Ribbon indicator except uses log-space transformation. Should be better on very long timeframes and for determining beginning of a bull market. The tradeoff is that it is slower than regular EMA near peaks (regular EMA will outperform this indicator when determining when to sell).

EMA Ribbon [Krypt]A convenient way to add a ribbon indicator (one indicator instead of multiple EMAs)

ALTDEL S/E Awesome OscillatorA simple customization of the Awesome Oscillator: allows you to change the moving averages (integer) as well as make them exponential.

MACD WEIGHTEDA different style of MACD indicator with different period values of WEIGHTED MOVING AVERAGES INSTEAD OF EXPONENTIAL.
Default MOVING AVERAGES ARE
faster period: 8bars
slower period: 13 bars
signal period: 5 bars
TURKISH EXPLANATION:
MACD indikatörünün üssel yerine AĞIRLIKLI hareketli ortalamalar kullanılarak daha erken sinyaller alabilmek için daha kısa periyotlarla yorumlanması

Moving Average RibbonA ribbon that uses a fast EMA, a slow EMA, and a signal EMA. By default the signal EMA is invisible.
When the fast EMA > slow EMA the default fill is green, and then red when the fast EMA < slow EMA. The signal EMA adds a 2nd flavor to the ribbon. When the fast EMA > slow EMA, if the signal is beneath the fast EMA, the ribbon fill changes its color to a brighter green. When the fast EMA < slow EMA, if the signal is above the fast EMA, the ribbon fill changes its color to a brighter red. Many times these little "fishhook" pullbacks are buying/shorting opportunities in the dominate trend.
Try settings of 8/21/8 Fast/Slow/Signal, with the "Zero-Lag Signal" check box checked. Zero-Lag is a simple algorithm that tries to remove as much lag as possible from an EMA. An 8 EMA will run "slower" than an 8 Zero-Lag EMA.
Additionally, 2 simple alerts are available for whenever the fast EMA crosses above the slow EMA, and the opposite.
Cheers.
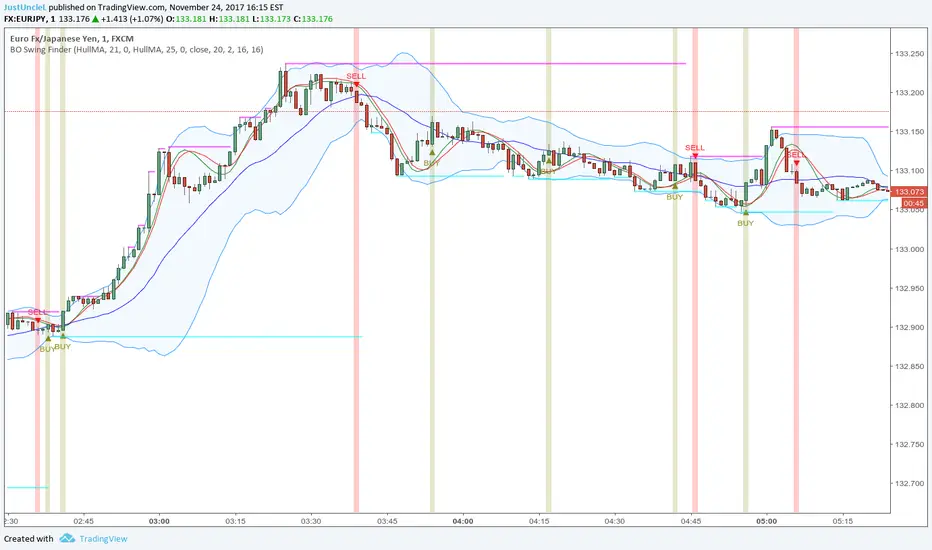
BO Swing Finder R0.6 by JustUncleLThis indicator alert study attempts to detect confirmed Swing points. It uses Bollinger Band centre line crosses as the main signal. The main detection occurs by looking for the first BB centre line cross that was initiated from outside the Bollinger Channel (alternatively KC channel can be used).
The optional HullMA (any any other MA pair) are used to confirm the swing direction. The indicator also plots the two KitKat Support and Resistance lines with optional High/Low labelling on KitKat1 lines.
This indicator tool is suitable for any time frame and can be traded with Binary Option (even 1min) orders (2-3 candle expiry) or as Forex trade orders. It is suitable for Currencies, Cryptocurrencies and Metals. May also be useful on other markets as well.
The MA filtering options, each MA line can be a different type, with an optional offset:
SMA = Simple Moving Average.
EMA = Exponential Moving Average.
WMA = Weighted Moving Average
VWMA = Volume Weighted Moving Average
SMMA = Smoothed Simple Moving Average.
DEMA = Double Exponential Moving Average
TEMA = Triple Exponential Moving Average.
HullMA = Hull Moving Average, fast moving MA.
SSMA = Ehlers Super Smoother Moving average, similar results to HullMA.
ZEMA = Near Zero Lag Exponential Moving Average.
TMA = Triangular (smoothed) Simple Moving Average.
NOTE: The signal calculations do occur on the current candle, so the state of the signal may re-build until the current candle is closed. I have designed the script to behave this way on purpose. This gives traders the option of
preparing their trade early or even taking the trade early if they want. Otherwise the trader can be more conservative and wait for signal candle to close, to give them a confirmed signal. (This is NOT re-painting as the historical signal states are fixed and will not change, unless you change some setup options.)
Hints:
1) As with all indicator and alerting tools, not all signals will yield a tradable successful swing. You need to apply you own analysis on each signal to determine the probability of success.
2) When using the MA to filter the signals you should use it for two types of filtering:
Supportive that confirm swing like fast moving MAs with fairly short lengths, eg HullMA(21,25).
Long Term Direction with smoother longer length MAs like SMMA(180,220) to show up swings back into direction of the longer term trends.
Inspiration: @Lyiness
References:
Momentum VMA KITKAT CROSS v2.1 by vdubus (- Vdubus_Channel www.vdubus.co.uk)
Moving Average RibbonRibbon of moving averages, select one of Hull, Weighted, Simple, or Exponential.

Trend Volume Accumulation R1 by JustUncleLThis simple indicator shows the Accumulated Volume within the current uptrend or downtrend. The uptrend/downtrend is detected by a change in direction of the candles which works very well with Heikin Ashi and Renko charts. Alternatively you can use a Moving average direction to indicate trend direction, which should work on any candle type.
You can select between 11 different types of moving average:
SMA = Simple Moving Average.
EMA = Exponential Moving Average.
WMA = Weighted Moving Average
VWMA = Volume Weighted Moving Average
SMMA = Smoothed Simple Moving Average.
DEMA = Double Exponential Moving Average
TEMA = Triple Exponential Moving Average.
HullMA = Hull Moving Average
SSMA = Ehlers Super Smoother Moving average
ZEMA = Near Zero Lag Exponential Moving Average.
TMA = Triangular (smoothed) Simple Moving Average.
Here is a sample chart using EMA length 6 for trend Direction:

Price Action Channel Master by JustUncleLThis indicator combines a number of PAC types into one indicator and will replace some of my previously PAC scripts (some were not published).
It draws a Moving Average (MA) channel based on various boundary criteria. Even though the MA choices are not limited to SMA and EMA, these would be the your first choices with most PAC requirements, feel free to experiment though.
Optional Bar colouring around that channel.
Options Available:
(1) Select between 11 different types of moving averages for the base (centre) MA line choices are :
SMA = Simple Moving Average (default)
EMA = Exponential Moving Average.
WMA = Weighted Moving Average
VWMA = Volume Weighted Moving Average
SMMA = Smoothed Simple Moving Average.
DEMA = Double Exponential Moving Average
TEMA = Triple Exponential Moving Average.
HullMA = Hull Moving Average
SSMA = Ehlers Super Smoother Moving average
ZEMA = Near Zero Lag Exponential Moving Average.
TMA = Triangular (smoothed) Simple Moving Average.
(2) Select Channel Boundary Criteria:
HILO = Channel boundaries based on High and Low MAs (default).
ATR = Channel boundaries are Multiplier * ATR distance from base line
PIP = Channel boundaries are Multiplier * PIPs distance from base line
STDEV = Channel boundaries are Multiplier * StdDev(price) distance from base line (this is the same as Bollinger bands if SMA is the base MA)
KC = Channel boundaries are Multiplier * StdDev(True Range) distance from base line (this is the same as Keltner channel if SMA is the base MA)
(3) Option to display coloured Candles around the Ribbon, the colouring uses the Default candle 3-tone colour scheme:
Lime = candle closed above Ribbon.
Red = candle closed below Ribbon.
Gray = Candle Closed inside Ribbon.
The Grab candles 6-tone colour scheme:
Lime = Bull candle closed above Ribbon.
Green = Bear candle closed above Ribbon.
Red = Bull candle closed below Ribbon.
DarkRed = Bear candle closed below Ribbon.
Aqua = Bull candle closed inside Ribbon.
Blue = Bear candle closed inside Ribbon.

Coloured MA R3-16 by JustUncleLThis indicator is an implementation of the coloured trend Moving Average, that includes some unique features. The Moving Average plot is coloured relative to it's direction and optionally display coloured Trend Bars using the standard 2-tone colours, or Grab candle style 4-tone colours.
Options:
1) Anchor Time Frame to a Highter Time frame, eg. set anchor to 1440 and length set to 8, the script will re-size the MA length needed to display on the current TF, say 60.
2) You can select between 11 different types of moving averages, each MA line can be a different type:
SMA = Simple Moving Average.
EMA = Exponential Moving Average.
WMA = Weighted Moving Average
VWMA = Volume Weighted Moving Average
SMMA = Smoothed Simple Moving Average.
DEMA = Double Exponential Moving Average
TEMA = Triple Exponential Moving Average.
HullMA = Hull Moving Average
SSMA = Ehlers Super Smoother Moving average
ZEMA = Near Zero Lag Exponential Moving Average.
TMA = Triangular (smoothed) Simple Moving Average.
3) Option to display coloured Candles around the Ribbon, the colouring -
Standard candle colours:
Lime = candle closed above Ribbon.
Red = candle closed below Ribbon.
The Grab candles scheme:
Lime = Bull candle closed above Ribbon.
Green = Bear candle closed above Ribbon.
Red = Bull candle closed below Ribbon.
DarkRed = Bear candle closed below Ribbon.

Stochastic Momentum IndexThis is an implementation of the Stochastic Momentum Index from William Blau's his article in Stocks & Commodities .
This also allows the use of various different kinds of moving averages for the signal line. Options for this argument are:
sma (simple moving average)
ema (exponential moving average)
wma (weighted moving average)
trima (triangular moving average)
zlema (zero-lag exponential moving average)
dema (double exponential moving average)
tema (triple exponential moving average)
hma (hull moving average)
BUZARA// © Buzzara
// =================================
// PLEASE SUPPORT THE TEAM
// =================================
//
// Telegram: t.me
// =================================
//@version=5
VERSION = ' Buzzara2.0'
strategy('ALGOX V6_1_24', shorttitle = '🚀〄 Buzzara2.0 〄🚀'+ VERSION, overlay = true, explicit_plot_zorder = true, pyramiding = 0, default_qty_type = strategy.percent_of_equity, initial_capital = 1000, default_qty_value = 1, calc_on_every_tick = false, process_orders_on_close = true)
G_SCRIPT01 = '■ ' + 'SAIYAN OCC'
//#region ———— <↓↓↓ G_SCRIPT01 ↓↓↓> {
// === INPUTS ===
res = input.timeframe('15', 'TIMEFRAME', group ="NON REPAINT")
useRes = input(true, 'Use Alternate Signals')
intRes = input(10, 'Multiplier for Alernate Signals')
basisType = input.string('ALMA', 'MA Type: ', options= )
basisLen = input.int(50, 'MA Period', minval=1)
offsetSigma = input.int(5, 'Offset for LSMA / Sigma for ALMA', minval=0)
offsetALMA = input.float(2, 'Offset for ALMA', minval=0, step=0.01)
scolor = input(false, 'Show coloured Bars to indicate Trend?')
delayOffset = input.int(0, 'Delay Open/Close MA', minval=0, step=1,
tooltip = 'Forces Non-Repainting')
tradeType = input.string('BOTH', 'What trades should be taken : ',
options = )
//=== /INPUTS ===
h = input(false, 'Signals for Heikin Ashi Candles')
//INDICATOR SETTINGS
swing_length = input.int(10, 'Swing High/Low Length', group = 'Settings', minval = 1, maxval = 50)
history_of_demand_to_keep = input.int(20, 'History To Keep', minval = 5, maxval = 50)
box_width = input.float(2.5, 'Supply/Demand Box Width', group = 'Settings', minval = 1, maxval = 10, step = 0.5)
//INDICATOR VISUAL SETTINGS
show_zigzag = input.bool(false, 'Show Zig Zag', group = 'Visual Settings', inline = '1')
show_price_action_labels = input.bool(false, 'Show Price Action Labels', group = 'Visual Settings', inline = '2')
supply_color = input.color(#00000000, 'Supply', group = 'Visual Settings', inline = '3')
supply_outline_color = input.color(#00000000, 'Outline', group = 'Visual Settings', inline = '3')
demand_color = input.color(#00000000, 'Demand', group = 'Visual Settings', inline = '4')
demand_outline_color = input.color(#00000000, 'Outline', group = 'Visual Settings', inline = '4')
bos_label_color = input.color(#00000000, 'BOS Label', group = 'Visual Settings', inline = '5')
poi_label_color = input.color(#00000000, 'POI Label', group = 'Visual Settings', inline = '7')
poi_border_color = input.color(#00000000, 'POI border', group = 'Visual Settings', inline = '7')
swing_type_color = input.color(#00000000, 'Price Action Label', group = 'Visual Settings', inline = '8')
zigzag_color = input.color(#00000000, 'Zig Zag', group = 'Visual Settings', inline = '9')
//END SETTINGS
// FUNCTION TO ADD NEW AND REMOVE LAST IN ARRAY
f_array_add_pop(array, new_value_to_add) =>
array.unshift(array, new_value_to_add)
array.pop(array)
// FUNCTION SWING H & L LABELS
f_sh_sl_labels(array, swing_type) =>
var string label_text = na
if swing_type == 1
if array.get(array, 0) >= array.get(array, 1)
label_text := 'HH'
else
label_text := 'LH'
label.new(
bar_index - swing_length,
array.get(array,0),
text = label_text,
style = label.style_label_down,
textcolor = swing_type_color,
color = swing_type_color,
size = size.tiny)
else if swing_type == -1
if array.get(array, 0) >= array.get(array, 1)
label_text := 'HL'
else
label_text := 'LL'
label.new(
bar_index - swing_length,
array.get(array,0),
text = label_text,
style = label.style_label_up,
textcolor = swing_type_color,
color = swing_type_color,
size = size.tiny)
// FUNCTION MAKE SURE SUPPLY ISNT OVERLAPPING
f_check_overlapping(new_poi, box_array, atrValue) =>
atr_threshold = atrValue * 2
okay_to_draw = true
for i = 0 to array.size(box_array) - 1
top = box.get_top(array.get(box_array, i))
bottom = box.get_bottom(array.get(box_array, i))
poi = (top + bottom) / 2
upper_boundary = poi + atr_threshold
lower_boundary = poi - atr_threshold
if new_poi >= lower_boundary and new_poi <= upper_boundary
okay_to_draw := false
break
else
okay_to_draw := true
okay_to_draw
// FUNCTION TO DRAW SUPPLY OR DEMAND ZONE
f_supply_demand(value_array, bn_array, box_array, label_array, box_type, atrValue) =>
atr_buffer = atrValue * (box_width / 10)
box_left = array.get(bn_array, 0)
box_right = bar_index
var float box_top = 0.00
var float box_bottom = 0.00
var float poi = 0.00
if box_type == 1
box_top := array.get(value_array, 0)
box_bottom := box_top - atr_buffer
poi := (box_top + box_bottom) / 2
else if box_type == -1
box_bottom := array.get(value_array, 0)
box_top := box_bottom + atr_buffer
poi := (box_top + box_bottom) / 2
okay_to_draw = f_check_overlapping(poi, box_array, atrValue)
// okay_to_draw = true
//delete oldest box, and then create a new box and add it to the array
if box_type == 1 and okay_to_draw
box.delete( array.get(box_array, array.size(box_array) - 1) )
f_array_add_pop(box_array, box.new( left = box_left, top = box_top, right = box_right, bottom = box_bottom, border_color = supply_outline_color,
bgcolor = supply_color, extend = extend.right, text = 'SUPPLY', text_halign = text.align_center, text_valign = text.align_center, text_color = poi_label_color, text_size = size.small, xloc = xloc.bar_index))
box.delete( array.get(label_array, array.size(label_array) - 1) )
f_array_add_pop(label_array, box.new( left = box_left, top = poi, right = box_right, bottom = poi, border_color = poi_border_color,
bgcolor = poi_border_color, extend = extend.right, text = 'POI', text_halign = text.align_left, text_valign = text.align_center, text_color = poi_label_color, text_size = size.small, xloc = xloc.bar_index))
else if box_type == -1 and okay_to_draw
box.delete( array.get(box_array, array.size(box_array) - 1) )
f_array_add_pop(box_array, box.new( left = box_left, top = box_top, right = box_right, bottom = box_bottom, border_color = demand_outline_color,
bgcolor = demand_color, extend = extend.right, text = 'DEMAND', text_halign = text.align_center, text_valign = text.align_center, text_color = poi_label_color, text_size = size.small, xloc = xloc.bar_index))
box.delete( array.get(label_array, array.size(label_array) - 1) )
f_array_add_pop(label_array, box.new( left = box_left, top = poi, right = box_right, bottom = poi, border_color = poi_border_color,
bgcolor = poi_border_color, extend = extend.right, text = 'POI', text_halign = text.align_left, text_valign = text.align_center, text_color = poi_label_color, text_size = size.small, xloc = xloc.bar_index))
// FUNCTION TO CHANGE SUPPLY/DEMAND TO A BOS IF BROKEN
f_sd_to_bos(box_array, bos_array, label_array, zone_type) =>
if zone_type == 1
for i = 0 to array.size(box_array) - 1
level_to_break = box.get_top(array.get(box_array,i))
// if ta.crossover(close, level_to_break)
if close >= level_to_break
copied_box = box.copy(array.get(box_array,i))
f_array_add_pop(bos_array, copied_box)
mid = (box.get_top(array.get(box_array,i)) + box.get_bottom(array.get(box_array,i))) / 2
box.set_top(array.get(bos_array,0), mid)
box.set_bottom(array.get(bos_array,0), mid)
box.set_extend( array.get(bos_array,0), extend.none)
box.set_right( array.get(bos_array,0), bar_index)
box.set_text( array.get(bos_array,0), 'BOS' )
box.set_text_color( array.get(bos_array,0), bos_label_color)
box.set_text_size( array.get(bos_array,0), size.small)
box.set_text_halign( array.get(bos_array,0), text.align_center)
box.set_text_valign( array.get(bos_array,0), text.align_center)
box.delete(array.get(box_array, i))
box.delete(array.get(label_array, i))
if zone_type == -1
for i = 0 to array.size(box_array) - 1
level_to_break = box.get_bottom(array.get(box_array,i))
// if ta.crossunder(close, level_to_break)
if close <= level_to_break
copied_box = box.copy(array.get(box_array,i))
f_array_add_pop(bos_array, copied_box)
mid = (box.get_top(array.get(box_array,i)) + box.get_bottom(array.get(box_array,i))) / 2
box.set_top(array.get(bos_array,0), mid)
box.set_bottom(array.get(bos_array,0), mid)
box.set_extend( array.get(bos_array,0), extend.none)
box.set_right( array.get(bos_array,0), bar_index)
box.set_text( array.get(bos_array,0), 'BOS' )
box.set_text_color( array.get(bos_array,0), bos_label_color)
box.set_text_size( array.get(bos_array,0), size.small)
box.set_text_halign( array.get(bos_array,0), text.align_center)
box.set_text_valign( array.get(bos_array,0), text.align_center)
box.delete(array.get(box_array, i))
box.delete(array.get(label_array, i))
// FUNCTION MANAGE CURRENT BOXES BY CHANGING ENDPOINT
f_extend_box_endpoint(box_array) =>
for i = 0 to array.size(box_array) - 1
box.set_right(array.get(box_array, i), bar_index + 100)
//
stratRes = timeframe.ismonthly ? str.tostring(timeframe.multiplier * intRes, '###M') :
timeframe.isweekly ? str.tostring(timeframe.multiplier * intRes, '###W') :
timeframe.isdaily ? str.tostring(timeframe.multiplier * intRes, '###D') :
timeframe.isintraday ? str.tostring(timeframe.multiplier * intRes, '####') :
'60'
src = h ? request.security(ticker.heikinashi(syminfo.tickerid),
timeframe.period, close, lookahead = barmerge.lookahead_off) : close
// CALCULATE ATR
atrValue = ta.atr(50)
// CALCULATE SWING HIGHS & SWING LOWS
swing_high = ta.pivothigh(high, swing_length, swing_length)
swing_low = ta.pivotlow(low, swing_length, swing_length)
// ARRAYS FOR SWING H/L & BN
var swing_high_values = array.new_float(5,0.00)
var swing_low_values = array.new_float(5,0.00)
var swing_high_bns = array.new_int(5,0)
var swing_low_bns = array.new_int(5,0)
// ARRAYS FOR SUPPLY / DEMAND
var current_supply_box = array.new_box(history_of_demand_to_keep, na)
var current_demand_box = array.new_box(history_of_demand_to_keep, na)
// ARRAYS FOR SUPPLY / DEMAND POI LABELS
var current_supply_poi = array.new_box(history_of_demand_to_keep, na)
var current_demand_poi = array.new_box(history_of_demand_to_keep, na)
// ARRAYS FOR BOS
var supply_bos = array.new_box(5, na)
var demand_bos = array.new_box(5, na)
//END CALCULATIONS
// NEW SWING HIGH
if not na(swing_high)
//MANAGE SWING HIGH VALUES
f_array_add_pop(swing_high_values, swing_high)
f_array_add_pop(swing_high_bns, bar_index )
if show_price_action_labels
f_sh_sl_labels(swing_high_values, 1)
f_supply_demand(swing_high_values, swing_high_bns, current_supply_box, current_supply_poi, 1, atrValue)
// NEW SWING LOW
else if not na(swing_low)
//MANAGE SWING LOW VALUES
f_array_add_pop(swing_low_values, swing_low)
f_array_add_pop(swing_low_bns, bar_index )
if show_price_action_labels
f_sh_sl_labels(swing_low_values, -1)
f_supply_demand(swing_low_values, swing_low_bns, current_demand_box, current_demand_poi, -1, atrValue)
f_sd_to_bos(current_supply_box, supply_bos, current_supply_poi, 1)
f_sd_to_bos(current_demand_box, demand_bos, current_demand_poi, -1)
f_extend_box_endpoint(current_supply_box)
f_extend_box_endpoint(current_demand_box)
channelBal = input.bool(false, "Channel Balance", group = "CHART")
lr_slope(_src, _len) =>
x = 0.0, y = 0.0, x2 = 0.0, xy = 0.0
for i = 0 to _len - 1
val = _src
per = i + 1
x += per
y += val
x2 += per * per
xy += val * per
_slp = (_len * xy - x * y) / (_len * x2 - x * x)
_avg = y / _len
_int = _avg - _slp * x / _len + _slp
lr_dev(_src, _len, _slp, _avg, _int) =>
upDev = 0.0, dnDev = 0.0
val = _int
for j = 0 to _len - 1
price = high - val
if price > upDev
upDev := price
price := val - low
if price > dnDev
dnDev := price
price := _src
val += _slp
//
= ta.kc(close, 80, 10.5)
= ta.kc(close, 80, 9.5)
= ta.kc(close, 80, 8)
= ta.kc(close, 80, 3)
barsL = 10
barsR = 10
pivotHigh = fixnan(ta.pivothigh(barsL, barsR) )
pivotLow = fixnan(ta.pivotlow(barsL, barsR) )
source = close, period = 150
= lr_slope(source, period)
= lr_dev(source, period, s, a, i)
y1 = low - (ta.atr(30) * 2), y1B = low - ta.atr(30)
y2 = high + (ta.atr(30) * 2), y2B = high + ta.atr(30)
x1 = bar_index - period + 1, _y1 = i + s * (period - 1), x2 = bar_index, _y2 = i
//Functions
//Line Style function
get_line_style(style) =>
out = switch style
'???' => line.style_solid
'----' => line.style_dashed
' ' => line.style_dotted
//Function to get order block coordinates
get_coordinates(condition, top, btm, ob_val)=>
var ob_top = array.new_float(0)
var ob_btm = array.new_float(0)
var ob_avg = array.new_float(0)
var ob_left = array.new_int(0)
float ob = na
//Append coordinates to arrays
if condition
avg = math.avg(top, btm)
array.unshift(ob_top, top)
array.unshift(ob_btm, btm)
array.unshift(ob_avg, avg)
ob := ob_val
//Function to remove mitigated order blocks from coordinate arrays
remove_mitigated(ob_top, ob_btm, ob_left, ob_avg, target, bull)=>
mitigated = false
target_array = bull ? ob_btm : ob_top
for element in target_array
idx = array.indexof(target_array, element)
if (bull ? target < element : target > element)
mitigated := true
array.remove(ob_top, idx)
array.remove(ob_btm, idx)
array.remove(ob_avg, idx)
array.remove(ob_left, idx)
mitigated
//Function to set order blocks
set_order_blocks(ob_top, ob_btm, ob_left, ob_avg, ext_last, bg_css, border_css, lvl_css)=>
var ob_box = array.new_box(0)
var ob_lvl = array.new_line(0)
//Global elements
var os = 0
var target_bull = 0.
var target_bear = 0.
// Create non-repainting security function
rp_security(_symbol, _res, _src) =>
request.security(_symbol, _res, _src )
htfHigh = rp_security(syminfo.tickerid, res, high)
htfLow = rp_security(syminfo.tickerid, res, low)
// Main Indicator
// Functions
smoothrng(x, t, m) =>
wper = t * 2 - 1
avrng = ta.ema(math.abs(x - x ), t)
smoothrng = ta.ema(avrng, wper) * m
rngfilt(x, r) =>
rngfilt = x
rngfilt := x > nz(rngfilt ) ? x - r < nz(rngfilt ) ? nz(rngfilt ) : x - r : x + r > nz(rngfilt ) ? nz(rngfilt ) : x + r
percWidth(len, perc) => (ta.highest(len) - ta.lowest(len)) * perc / 100
securityNoRep(sym, res, src) => request.security(sym, res, src, barmerge.gaps_off, barmerge.lookahead_on)
swingPoints(prd) =>
pivHi = ta.pivothigh(prd, prd)
pivLo = ta.pivotlow (prd, prd)
last_pivHi = ta.valuewhen(pivHi, pivHi, 1)
last_pivLo = ta.valuewhen(pivLo, pivLo, 1)
hh = pivHi and pivHi > last_pivHi ? pivHi : na
lh = pivHi and pivHi < last_pivHi ? pivHi : na
hl = pivLo and pivLo > last_pivLo ? pivLo : na
ll = pivLo and pivLo < last_pivLo ? pivLo : na
f_chartTfInMinutes() =>
float _resInMinutes = timeframe.multiplier * (
timeframe.isseconds ? 1 :
timeframe.isminutes ? 1. :
timeframe.isdaily ? 60. * 24 :
timeframe.isweekly ? 60. * 24 * 7 :
timeframe.ismonthly ? 60. * 24 * 30.4375 : na)
f_kc(src, len, sensitivity) =>
basis = ta.sma(src, len)
span = ta.atr(len)
wavetrend(src, chlLen, avgLen) =>
esa = ta.ema(src, chlLen)
d = ta.ema(math.abs(src - esa), chlLen)
ci = (src - esa) / (0.015 * d)
wt1 = ta.ema(ci, avgLen)
wt2 = ta.sma(wt1, 3)
f_top_fractal(_src) => _src < _src and _src < _src and _src > _src and _src > _src
f_bot_fractal(_src) => _src > _src and _src > _src and _src < _src and _src < _src
top_fractal = f_top_fractal(src)
bot_fractal = f_bot_fractal(src)
f_fractalize (_src) => top_fractal ? 1 : bot_fractal ? -1 : 0
f_findDivs(src, topLimit, botLimit) =>
fractalTop = f_fractalize(src) > 0 and src >= topLimit ? src : na
fractalBot = f_fractalize(src) < 0 and src <= botLimit ? src : na
highPrev = ta.valuewhen(fractalTop, src , 0)
highPrice = ta.valuewhen(fractalTop, high , 0)
lowPrev = ta.valuewhen(fractalBot, src , 0)
lowPrice = ta.valuewhen(fractalBot, low , 0)
bearSignal = fractalTop and high > highPrice and src < highPrev
bullSignal = fractalBot and low < lowPrice and src > lowPrev
// Get user input
enableSR = input(false , "SR On/Off", group="SR")
colorSup = input(#00000000 , "Support Color", group="SR")
colorRes = input(#00000000 , "Resistance Color", group="SR")
strengthSR = input.int(2 , "S/R Strength", 1, group="SR")
lineStyle = input.string("Dotted", "Line Style", , group="SR")
lineWidth = input.int(2 , "S/R Line Width", 1, group="SR")
useZones = input(true , "Zones On/Off", group="SR")
useHLZones = input(true , "High Low Zones On/Off", group="SR")
zoneWidth = input.int(2 , "Zone Width %", 0,
tooltip = "it's calculated using % of the distance between highest/lowest in last 300 bars", group="SR")
expandSR = input(true , "Expand SR")
// Get components
rb = 10
prd = 284
ChannelW = 10
label_loc = 55
style = lineStyle == "Solid" ? line.style_solid :
lineStyle == "Dotted" ? line.style_dotted : line.style_dashed
ph = ta.pivothigh(rb, rb)
pl = ta.pivotlow (rb, rb)
sr_levels = array.new_float(21, na)
prdhighest = ta.highest(prd)
prdlowest = ta.lowest(prd)
cwidth = percWidth(prd, ChannelW)
zonePerc = percWidth(300, zoneWidth)
aas = array.new_bool(41, true)
u1 = 0.0, u1 := nz(u1 )
d1 = 0.0, d1 := nz(d1 )
highestph = 0.0, highestph := highestph
lowestpl = 0.0, lowestpl := lowestpl
var sr_levs = array.new_float(21, na)
label hlabel = na, label.delete(hlabel )
label llabel = na, label.delete(llabel )
var sr_lines = array.new_line(21, na)
var sr_linesH = array.new_line(21, na)
var sr_linesL = array.new_line(21, na)
var sr_linesF = array.new_linefill(21, na)
var sr_labels = array.new_label(21, na)
if (not na(ph) or not na(pl))
for x = 0 to array.size(sr_levels) - 1
array.set(sr_levels, x, na)
highestph := prdlowest
lowestpl := prdhighest
countpp = 0
for x = 0 to prd
if na(close )
break
if not na(ph ) or not na(pl )
highestph := math.max(highestph, nz(ph , prdlowest), nz(pl , prdlowest))
lowestpl := math.min(lowestpl, nz(ph , prdhighest), nz(pl , prdhighest))
countpp += 1
if countpp > 40
break
if array.get(aas, countpp)
upl = (not na(ph ) and (ph != 0) ? high : low ) + cwidth
dnl = (not na(ph ) and (ph != 0) ? high : low ) - cwidth
u1 := countpp == 1 ? upl : u1
d1 := countpp == 1 ? dnl : d1
tmp = array.new_bool(41, true)
cnt = 0
tpoint = 0
for xx = 0 to prd
if na(close )
break
if not na(ph ) or not na(pl )
chg = false
cnt += 1
if cnt > 40
break
if array.get(aas, cnt)
if not na(ph )
if high <= upl and high >= dnl
tpoint += 1
chg := true
if not na(pl )
if low <= upl and low >= dnl
tpoint += 1
chg := true
if chg and cnt < 41
array.set(tmp, cnt, false)
if tpoint >= strengthSR
for g = 0 to 40 by 1
if not array.get(tmp, g)
array.set(aas, g, false)
if (not na(ph ) and countpp < 21)
array.set(sr_levels, countpp, high )
if (not na(pl ) and countpp < 21)
array.set(sr_levels, countpp, low )
// Plot
var line highest_ = na, line.delete(highest_)
var line lowest_ = na, line.delete(lowest_)
var line highest_fill1 = na, line.delete(highest_fill1)
var line highest_fill2 = na, line.delete(highest_fill2)
var line lowest_fill1 = na, line.delete(lowest_fill1)
var line lowest_fill2 = na, line.delete(lowest_fill2)
hi_col = close >= highestph ? colorSup : colorRes
lo_col = close >= lowestpl ? colorSup : colorRes
if enableSR
highest_ := line.new(bar_index - 311, highestph, bar_index, highestph, xloc.bar_index, expandSR ? extend.both : extend.right, hi_col, style, lineWidth)
lowest_ := line.new(bar_index - 311, lowestpl , bar_index, lowestpl , xloc.bar_index, expandSR ? extend.both : extend.right, lo_col, style, lineWidth)
if useHLZones
highest_fill1 := line.new(bar_index - 311, highestph + zonePerc, bar_index, highestph + zonePerc, xloc.bar_index, expandSR ? extend.both : extend.right, na)
highest_fill2 := line.new(bar_index - 311, highestph - zonePerc, bar_index, highestph - zonePerc, xloc.bar_index, expandSR ? extend.both : extend.right, na)
lowest_fill1 := line.new(bar_index - 311, lowestpl + zonePerc , bar_index, lowestpl + zonePerc , xloc.bar_index, expandSR ? extend.both : extend.right, na)
lowest_fill2 := line.new(bar_index - 311, lowestpl - zonePerc , bar_index, lowestpl - zonePerc , xloc.bar_index, expandSR ? extend.both : extend.right, na)
linefill.new(highest_fill1, highest_fill2, hi_col)
linefill.new(lowest_fill1 , lowest_fill2 , lo_col)
if (not na(ph) or not na(pl))
for x = 0 to array.size(sr_lines) - 1
array.set(sr_levs, x, array.get(sr_levels, x))
for x = 0 to array.size(sr_lines) - 1
line.delete(array.get(sr_lines, x))
line.delete(array.get(sr_linesH, x))
line.delete(array.get(sr_linesL, x))
linefill.delete(array.get(sr_linesF, x))
if (not na(array.get(sr_levs, x)) and enableSR)
line_col = close >= array.get(sr_levs, x) ? colorSup : colorRes
array.set(sr_lines, x, line.new(bar_index - 355, array.get(sr_levs, x), bar_index, array.get(sr_levs, x), xloc.bar_index, expandSR ? extend.both : extend.right, line_col, style, lineWidth))
if useZones
array.set(sr_linesH, x, line.new(bar_index - 355, array.get(sr_levs, x) + zonePerc, bar_index, array.get(sr_levs, x) + zonePerc, xloc.bar_index, expandSR ? extend.both : extend.right, na))
array.set(sr_linesL, x, line.new(bar_index - 355, array.get(sr_levs, x) - zonePerc, bar_index, array.get(sr_levs, x) - zonePerc, xloc.bar_index, expandSR ? extend.both : extend.right, na))
array.set(sr_linesF, x, linefill.new(array.get(sr_linesH, x), array.get(sr_linesL, x), line_col))
for x = 0 to array.size(sr_labels) - 1
label.delete(array.get(sr_labels, x))
if (not na(array.get(sr_levs, x)) and enableSR)
lab_loc = close >= array.get(sr_levs, x) ? label.style_label_up : label.style_label_down
lab_col = close >= array.get(sr_levs, x) ? colorSup : colorRes
array.set(sr_labels, x, label.new(bar_index + label_loc, array.get(sr_levs, x), str.tostring(math.round_to_mintick(array.get(sr_levs, x))), color=lab_col , textcolor=#000000, style=lab_loc))
hlabel := enableSR ? label.new(bar_index + label_loc + math.round(math.sign(label_loc)) * 20, highestph, "High Level : " + str.tostring(highestph), color=hi_col, textcolor=#000000, style=label.style_label_down) : na
llabel := enableSR ? label.new(bar_index + label_loc + math.round(math.sign(label_loc)) * 20, lowestpl , "Low Level : " + str.tostring(lowestpl) , color=lo_col, textcolor=#000000, style=label.style_label_up ) : na
// Get components
rsi = ta.rsi(close, 28)
//rsiOb = rsi > 78 and rsi > ta.ema(rsi, 10)
//rsiOs = rsi < 27 and rsi < ta.ema(rsi, 10)
rsiOb = rsi > 65 and rsi > ta.ema(rsi, 10)
rsiOs = rsi < 35 and rsi < ta.ema(rsi, 10)
dHigh = securityNoRep(syminfo.tickerid, "D", high )
dLow = securityNoRep(syminfo.tickerid, "D", low )
dClose = securityNoRep(syminfo.tickerid, "D", close )
ema = ta.ema(close, 144)
emaBull = close > ema
equal_tf(res) => str.tonumber(res) == f_chartTfInMinutes() and not timeframe.isseconds
higher_tf(res) => str.tonumber(res) > f_chartTfInMinutes() or timeframe.isseconds
too_small_tf(res) => (timeframe.isweekly and res=="1") or (timeframe.ismonthly and str.tonumber(res) < 10)
securityNoRep1(sym, res, src) =>
bool bull_ = na
bull_ := equal_tf(res) ? src : bull_
bull_ := higher_tf(res) ? request.security(sym, res, src, barmerge.gaps_off, barmerge.lookahead_on) : bull_
bull_array = request.security_lower_tf(syminfo.tickerid, higher_tf(res) ? str.tostring(f_chartTfInMinutes()) + (timeframe.isseconds ? "S" : "") : too_small_tf(res) ? (timeframe.isweekly ? "3" : "10") : res, src)
if array.size(bull_array) > 1 and not equal_tf(res) and not higher_tf(res)
bull_ := array.pop(bull_array)
array.clear(bull_array)
bull_
// === BASE FUNCTIONS ===
// Returns MA input selection variant, default to SMA if blank or typo.
variant(type, src, len, offSig, offALMA) =>
v1 = ta.sma(src, len) // Simple
v2 = ta.ema(src, len) // Exponential
v3 = 2 * v2 - ta.ema(v2, len) // Double Exponential
v4 = 3 * (v2 - ta.ema(v2, len)) + ta.ema(ta.ema(v2, len), len) // Triple Exponential
v5 = ta.wma(src, len) // Weighted
v6 = ta.vwma(src, len) // Volume Weighted
v7 = 0.0
sma_1 = ta.sma(src, len) // Smoothed
v7 := na(v7 ) ? sma_1 : (v7 * (len - 1) + src) / len
v8 = ta.wma(2 * ta.wma(src, len / 2) - ta.wma(src, len), math.round(math.sqrt(len))) // Hull
v9 = ta.linreg(src, len, offSig) // Least Squares
v10 = ta.alma(src, len, offALMA, offSig) // Arnaud Legoux
v11 = ta.sma(v1, len) // Triangular (extreme smooth)
// SuperSmoother filter
// 2013 John F. Ehlers
a1 = math.exp(-1.414 * 3.14159 / len)
b1 = 2 * a1 * math.cos(1.414 * 3.14159 / len)
c2 = b1
c3 = -a1 * a1
c1 = 1 - c2 - c3
v12 = 0.0
v12 := c1 * (src + nz(src )) / 2 + c2 * nz(v12 ) + c3 * nz(v12 )
type == 'EMA' ? v2 : type == 'DEMA' ? v3 : type == 'TEMA' ? v4 : type == 'WMA' ? v5 : type == 'VWMA' ? v6 : type == 'SMMA' ? v7 : type == 'HullMA' ? v8 : type == 'LSMA' ? v9 : type == 'ALMA' ? v10 : type == 'TMA' ? v11 : type == 'SSMA' ? v12 : v1
// security wrapper for repeat calls
reso(exp, use, res) =>
security_1 = request.security(syminfo.tickerid, res, exp, gaps = barmerge.gaps_off, lookahead = barmerge.lookahead_on)
use ? security_1 : exp
// === /BASE FUNCTIONS ===
// === SERIES SETUP ===
closeSeries = variant(basisType, close , basisLen, offsetSigma, offsetALMA)
openSeries = variant(basisType, open , basisLen, offsetSigma, offsetALMA)
// === /SERIES ===
// Get Alternate resolution Series if selected.
closeSeriesAlt = reso(closeSeries, useRes, stratRes)
openSeriesAlt = reso(openSeries, useRes, stratRes)
//
lxTrigger = false
sxTrigger = false
leTrigger = ta.crossover (closeSeriesAlt, openSeriesAlt)
seTrigger = ta.crossunder(closeSeriesAlt, openSeriesAlt)
G_RISK = '■ ' + 'Risk Management'
//#region ———— <↓↓↓ G_RISK ↓↓↓> {
// ———————————
//Tooltip
T_LVL = '(%) Exit Level'
T_QTY = '(%) Adjust trade exit volume'
T_MSG = 'Paste JSON message for your bot'
//Webhook Message
O_LEMSG = 'Long Entry'
O_LXMSGSL = 'Long SL'
O_LXMSGTP1 = 'Long TP1'
O_LXMSGTP2 = 'Long TP2'
O_LXMSGTP3 = 'Long TP3'
O_LXMSG = 'Long Exit'
O_SEMSG = 'Short Entry'
O_SXMSGSL = 'Short SL'
O_SXMSGA = 'Short TP1'
O_SXMSGB = 'Short TP2'
O_SXMSGC = 'Short TP3'
O_SXMSGX = 'Short Exit'
// ——————————— | | | Line length guide |
i_lxLvlTP1 = input.float (0.2, 'Level TP1' , group = G_RISK,
tooltip = T_LVL)
i_lxQtyTP1 = input.float (80.0, 'Qty TP1' , group = G_RISK,
tooltip = T_QTY)
i_lxLvlTP2 = input.float (0.5, 'Level TP2' , group = G_RISK,
tooltip = T_LVL)
i_lxQtyTP2 = input.float (10.0, 'Qty TP2' , group = G_RISK,
tooltip = T_QTY)
i_lxLvlTP3 = input.float (7.0, 'Level TP3' , group = G_RISK,
tooltip = T_LVL)
i_lxQtyTP3 = input.float (2, 'Qty TP3' , group = G_RISK,
tooltip = T_QTY)
i_lxLvlSL = input.float (0.5, 'Stop Loss' , group = G_RISK,
tooltip = T_LVL)
i_sxLvlTP1 = i_lxLvlTP1
i_sxQtyTP1 = i_lxQtyTP1
i_sxLvlTP2 = i_lxLvlTP2
i_sxQtyTP2 = i_lxQtyTP2
i_sxLvlTP3 = i_lxLvlTP3
i_sxQtyTP3 = i_lxQtyTP3
i_sxLvlSL = i_lxLvlSL
G_MSG = '■ ' + 'Webhook Message'
i_leMsg = input.string (O_LEMSG ,'Long Entry' , group = G_MSG, tooltip = T_MSG)
i_lxMsgSL = input.string (O_LXMSGSL ,'Long SL' , group = G_MSG, tooltip = T_MSG)
i_lxMsgTP1 = input.string (O_LXMSGTP1,'Long TP1' , group = G_MSG, tooltip = T_MSG)
i_lxMsgTP2 = input.string (O_LXMSGTP2,'Long TP2' , group = G_MSG, tooltip = T_MSG)
i_lxMsgTP3 = input.string (O_LXMSGTP3,'Long TP3' , group = G_MSG, tooltip = T_MSG)
i_lxMsg = input.string (O_LXMSG ,'Long Exit' , group = G_MSG, tooltip = T_MSG)
i_seMsg = input.string (O_SEMSG ,'Short Entry' , group = G_MSG, tooltip = T_MSG)
i_sxMsgSL = input.string (O_SXMSGSL ,'Short SL' , group = G_MSG, tooltip = T_MSG)
i_sxMsgTP1 = input.string (O_SXMSGA ,'Short TP1' , group = G_MSG, tooltip = T_MSG)
i_sxMsgTP2 = input.string (O_SXMSGB ,'Short TP2' , group = G_MSG, tooltip = T_MSG)
i_sxMsgTP3 = input.string (O_SXMSGC ,'Short TP3' , group = G_MSG, tooltip = T_MSG)
i_sxMsg = input.string (O_SXMSGX ,'Short Exit' , group = G_MSG, tooltip = T_MSG)
i_src = close
G_DISPLAY = 'Display'
//
i_alertOn = input.bool (true, 'Alert Labels On/Off' , group = G_DISPLAY)
i_barColOn = input.bool (true, 'Bar Color On/Off' , group = G_DISPLAY)
// ———————————
// @function Calculate the Take Profit line, and the crossover or crossunder
f_tp(_condition, _conditionValue, _leTrigger, _seTrigger, _src, _lxLvlTP, _sxLvlTP)=>
var float _tpLine = 0.0
_topLvl = _src + (_src * (_lxLvlTP / 100))
_botLvl = _src - (_src * (_sxLvlTP / 100))
_tpLine := _condition != _conditionValue and _leTrigger ? _topLvl :
_condition != -_conditionValue and _seTrigger ? _botLvl :
nz(_tpLine )
// @function Similar to "ta.crossover" or "ta.crossunder"
f_cross(_scr1, _scr2, _over)=>
_cross = _over ? _scr1 > _scr2 and _scr1 < _scr2 :
_scr1 < _scr2 and _scr1 > _scr2
// ———————————
//
var float condition = 0.0
var float slLine = 0.0
var float entryLine = 0.0
//
entryLine := leTrigger and condition <= 0.0 ? close :
seTrigger and condition >= 0.0 ? close : nz(entryLine )
//
slTopLvl = i_src + (i_src * (i_lxLvlSL / 100))
slBotLvl = i_src - (i_src * (i_sxLvlSL / 100))
slLine := condition <= 0.0 and leTrigger ? slBotLvl :
condition >= 0.0 and seTrigger ? slTopLvl : nz(slLine )
slLong = f_cross(low, slLine, false)
slShort = f_cross(high, slLine, true )
//
= f_tp(condition, 1.2,leTrigger, seTrigger, i_src, i_lxLvlTP3, i_sxLvlTP3)
= f_tp(condition, 1.1,leTrigger, seTrigger, i_src, i_lxLvlTP2, i_sxLvlTP2)
= f_tp(condition, 1.0,leTrigger, seTrigger, i_src, i_lxLvlTP1, i_sxLvlTP1)
tp3Long = f_cross(high, tp3Line, true )
tp3Short = f_cross(low, tp3Line, false)
tp2Long = f_cross(high, tp2Line, true )
tp2Short = f_cross(low, tp2Line, false)
tp1Long = f_cross(high, tp1Line, true )
tp1Short = f_cross(low, tp1Line, false)
switch
leTrigger and condition <= 0.0 => condition := 1.0
seTrigger and condition >= 0.0 => condition := -1.0
tp3Long and condition == 1.2 => condition := 1.3
tp3Short and condition == -1.2 => condition := -1.3
tp2Long and condition == 1.1 => condition := 1.2
tp2Short and condition == -1.1 => condition := -1.2
tp1Long and condition == 1.0 => condition := 1.1
tp1Short and condition == -1.0 => condition := -1.1
slLong and condition >= 1.0 => condition := 0.0
slShort and condition <= -1.0 => condition := 0.0
lxTrigger and condition >= 1.0 => condition := 0.0
sxTrigger and condition <= -1.0 => condition := 0.0
longE = leTrigger and condition <= 0.0 and condition == 1.0
shortE = seTrigger and condition >= 0.0 and condition == -1.0
longX = lxTrigger and condition >= 1.0 and condition == 0.0
shortX = sxTrigger and condition <= -1.0 and condition == 0.0
longSL = slLong and condition >= 1.0 and condition == 0.0
shortSL = slShort and condition <= -1.0 and condition == 0.0
longTP3 = tp3Long and condition == 1.2 and condition == 1.3
shortTP3 = tp3Short and condition == -1.2 and condition == -1.3
longTP2 = tp2Long and condition == 1.1 and condition == 1.2
shortTP2 = tp2Short and condition == -1.1 and condition == -1.2
longTP1 = tp1Long and condition == 1.0 and condition == 1.1
shortTP1 = tp1Short and condition == -1.0 and condition == -1.1
// ——————————— {
//
if strategy.position_size <= 0 and longE and barstate.isconfirmed
strategy.entry(
'Long',
strategy.long,
alert_message = i_leMsg,
comment = 'LE')
if strategy.position_size > 0 and condition == 1.0
strategy.exit(
id = 'LXTP1',
from_entry = 'Long',
qty_percent = i_lxQtyTP1,
limit = tp1Line,
stop = slLine,
comment_profit = 'LXTP1',
comment_loss = 'SL',
alert_profit = i_lxMsgTP1,
alert_loss = i_lxMsgSL)
if strategy.position_size > 0 and condition == 1.1
strategy.exit(
id = 'LXTP2',
from_entry = 'Long',
qty_percent = i_lxQtyTP2,
limit = tp2Line,
stop = slLine,
comment_profit = 'LXTP2',
comment_loss = 'SL',
alert_profit = i_lxMsgTP2,
alert_loss = i_lxMsgSL)
if strategy.position_size > 0 and condition == 1.2
strategy.exit(
id = 'LXTP3',
from_entry = 'Long',
qty_percent = i_lxQtyTP3,
limit = tp3Line,
stop = slLine,
comment_profit = 'LXTP3',
comment_loss = 'SL',
alert_profit = i_lxMsgTP3,
alert_loss = i_lxMsgSL)
if longX
strategy.close(
'Long',
alert_message = i_lxMsg,
comment = 'LX')
//
if strategy.position_size >= 0 and shortE and barstate.isconfirmed
strategy.entry(
'Short',
strategy.short,
alert_message = i_leMsg,
comment = 'SE')
if strategy.position_size < 0 and condition == -1.0
strategy.exit(
id = 'SXTP1',
from_entry = 'Short',
qty_percent = i_sxQtyTP1,
limit = tp1Line,
stop = slLine,
comment_profit = 'SXTP1',
comment_loss = 'SL',
alert_profit = i_sxMsgTP1,
alert_loss = i_sxMsgSL)
if strategy.position_size < 0 and condition == -1.1
strategy.exit(
id = 'SXTP2',
from_entry = 'Short',
qty_percent = i_sxQtyTP2,
limit = tp2Line,
stop = slLine,
comment_profit = 'SXTP2',
comment_loss = 'SL',
alert_profit = i_sxMsgTP2,
alert_loss = i_sxMsgSL)
if strategy.position_size < 0 and condition == -1.2
strategy.exit(
id = 'SXTP3',
from_entry = 'Short',
qty_percent = i_sxQtyTP3,
limit = tp3Line,
stop = slLine,
comment_profit = 'SXTP3',
comment_loss = 'SL',
alert_profit = i_sxMsgTP3,
alert_loss = i_sxMsgSL)
if shortX
strategy.close(
'Short',
alert_message = i_sxMsg,
comment = 'SX')
// ———————————
c_tp = leTrigger or seTrigger ? na :
condition == 0.0 ? na : color.green
c_entry = leTrigger or seTrigger ? na :
condition == 0.0 ? na : color.blue
c_sl = leTrigger or seTrigger ? na :
condition == 0.0 ? na : color.red
p_tp1Line = plot (
condition == 1.0 or
condition == -1.0 ? tp1Line : na,
title = "TP Line 1",
color = c_tp,
linewidth = 1,
style = plot.style_linebr)
p_tp2Line = plot (
condition == 1.0 or
condition == -1.0 or
condition == 1.1 or
condition == -1.1 ? tp2Line : na,
title = "TP Line 2",
color = c_tp,
linewidth = 1,
style = plot.style_linebr)
p_tp3Line = plot (
condition == 1.0 or
condition == -1.0 or
condition == 1.1 or
condition == -1.1 or
condition == 1.2 or
condition == -1.2 ? tp3Line : na,
title = "TP Line 3",
color = c_tp,
linewidth = 1,
style = plot.style_linebr)
p_entryLine = plot (
condition >= 1.0 or
condition <= -1.0 ? entryLine : na,
title = "Entry Line",
color = c_entry,
linewidth = 1,
style = plot.style_linebr)
p_slLine = plot (
condition == 1.0 or
condition == -1.0 or
condition == 1.1 or
condition == -1.1 or
condition == 1.2 or
condition == -1.2 ? slLine : na,
title = "SL Line",
color = c_sl,
linewidth = 1,
style = plot.style_linebr)
fill(
p_tp3Line, p_entryLine,
color = leTrigger or seTrigger ? na :color.new(color.green, 90))
fill(
p_entryLine, p_slLine,
color = leTrigger or seTrigger ? na :color.new(color.red, 90))
//
plotshape(
i_alertOn and longE,
title = 'Long',
text = 'Long',
textcolor = color.white,
color = color.green,
style = shape.labelup,
size = size.tiny,
location = location.belowbar)
plotshape(
i_alertOn and shortE,
title = 'Short',
text = 'Short',
textcolor = color.white,
color = color.red,
style = shape.labeldown,
size = size.tiny,
location = location.abovebar)
plotshape(
i_alertOn and (longX or shortX) ? close : na,
title = 'Close',
text = 'Close',
textcolor = color.white,
color = color.gray,
style = shape.labelup,
size = size.tiny,
location = location.absolute)
l_tp = i_alertOn and (longTP1 or shortTP1) ? close : na
plotshape(
l_tp,
title = "TP1 Cross",
text = "TP1",
textcolor = color.white,
color = color.olive,
style = shape.labelup,
size = size.tiny,
location = location.absolute)
plotshape(
i_alertOn and (longTP2 or shortTP2) ? close : na,
title = "TP2 Cross",
text = "TP2",
textcolor = color.white,
color = color.olive,
style = shape.labelup,
size = size.tiny,
location = location.absolute)
plotshape(
i_alertOn and (longTP3 or shortTP3) ? close : na,
title = "TP3 Cross",
text = "TP3",
textcolor = color.white,
color = color.olive,
style = shape.labelup,
size = size.tiny,
location = location.absolute)
plotshape(
i_alertOn and (longSL or shortSL) ? close : na,
title = "SL Cross",
text = "SL",
textcolor = color.white,
color = color.maroon,
style = shape.labelup,
size = size.tiny,
location = location.absolute)
//
plot(
na,
title = "─── ───",
editable = false,
display = display.data_window)
plot(
condition,
title = "condition",
editable = false,
display = display.data_window)
plot(
strategy.position_size * 100,
title = ".position_size",
editable = false,
display = display.data_window)
//#endregion }
// ——————————— <↑↑↑ G_RISK ↑↑↑>
//#region ———— <↓↓↓ G_SCRIPT02 ↓↓↓> {
// @function Queues a new element in an array and de-queues its first element.
f_qDq(_array, _val) =>
array.push(_array, _val)
_return = array.shift(_array)
_return
var line a_slLine = array.new_line(1)
var line a_entryLine = array.new_line(1)
var line a_tp3Line = array.new_line(1)
var line a_tp2Line = array.new_line(1)
var line a_tp1Line = array.new_line(1)
var label a_slLabel = array.new_label(1)
var label a_tp3label = array.new_label(1)
var label a_tp2label = array.new_label(1)
var label a_tp1label = array.new_label(1)
var label a_entryLabel = array.new_label(1)
newEntry = longE or shortE
entryIndex = 1
entryIndex := newEntry ? bar_index : nz(entryIndex )
lasTrade = bar_index >= entryIndex
l_right = 10
line.delete(
f_qDq(a_slLine,
line.new(
entryIndex,
slLine,
last_bar_index + l_right,
slLine,
style = line.style_solid,
color = c_sl)))
line.delete(
f_qDq(a_entryLine,
line.new(
entryIndex,
entryLine,
last_bar_index + l_right,
entryLine,
style = line.style_solid,
color = color.blue)))
line.delete(
f_qDq(a_tp3Line,
line.new(
entryIndex,
tp3Line,
last_bar_index + l_right,
tp3Line,
style = line.style_solid,
color = c_tp)))
line.delete(
f_qDq(a_tp2Line,
line.new(
entryIndex,
tp2Line,
last_bar_index + l_right,
tp2Line,
style = line.style_solid,
color = c_tp)))
line.delete(
f_qDq(a_tp1Line,
line.new(
entryIndex,
tp1Line,
last_bar_index + l_right,
tp1Line,
style = line.style_solid,
color = c_tp)))
label.delete(
f_qDq(a_slLabel,
label.new(
last_bar_index + l_right,
slLine,
'SL: ' + str.tostring(slLine, '##.###'),
style = label.style_label_left,
textcolor = color.white,
color = c_sl)))
label.delete(
f_qDq(a_entryLabel,
label.new(
last_bar_index + l_right,
entryLine,
'Entry: ' + str.tostring(entryLine, '##.###'),
style = label.style_label_left,
textcolor = color.white,
color = color.blue)))
label.delete(
f_qDq(a_tp3label,
label.new(
last_bar_index + l_right,
tp3Line,
'TP3: ' + str.tostring(tp3Line, '##.###'),
style = label.style_label_left,
textcolor = color.white,
color = c_tp)))
label.delete(
f_qDq(a_tp2label,
label.new(
last_bar_index + l_right,
tp2Line,
'TP2: ' + str.tostring(tp2Line, '##.###'),
style = label.style_label_left,
textcolor = color.white,
color = c_tp)))
label.delete(
f_qDq(a_tp1label,
label.new(
last_bar_index + l_right,
tp1Line,
'TP1: ' + str.tostring(tp1Line, '##.###'),
style = label.style_label_left,
textcolor = color.white,
color = c_tp)))
// ———————————
//
if longE or shortE or longX or shortX
alert(message = 'Any Alert', freq = alert.freq_once_per_bar_close)
if longE
alert(message = 'Long Entry', freq = alert.freq_once_per_bar_close)
if shortE
alert(message = 'Short Entry', freq = alert.freq_once_per_bar_close)
if longX
alert(message = 'Long Exit', freq = alert.freq_once_per_bar_close)
if shortX
alert(message = 'Short Exit', freq = alert.freq_once_per_bar_close)
//#endregion }
// ——————————— <↑↑↑ G_SCRIPT03 ↑↑↑>

Kalman Ema Crosses - [JTCAPITAL]Kalman EMA Crosses - is a modified way to use Kalman Filters applied on Exponential Moving Averages (EMA Crosses) for Trend-Following.
Credits for the kalman function itself goes to @BackQuant
The Kalman filter is a recursive smoothing algorithm that reduces noise from raw price or indicator data, and in this script it is applied both directly to price and on top of EMA calculations. The goal is to create cleaner, more reliable crossover signals between two EMAs that are less prone to false triggers caused by volatility or market noise.
The indicator works by calculating in the following steps:
Source Selection
The script starts by selecting the price input (default is Close, but can be adjusted). This chosen source is the foundation for all further smoothing and EMA calculations.
Kalman Filtering on Price
Depending on user settings, the selected source is passed through one of two independent Kalman filters. The filter takes into account process noise (representing expected market randomness) and measurement noise (representing uncertainty in the price data). The Kalman filter outputs a smoothed version of price that minimizes noise and preserves underlying trend structure.
EMA Calculation
Two exponential moving averages (EMA 1 and EMA 2) are then computed on the Kalman-smoothed price. The lengths of these EMAs are fully customizable (default 15 and 25).
Kalman Filtering on EMA Values
Instead of directly using raw EMA curves, the script applies a second layer of Kalman filtering to the EMA values themselves. This step significantly reduces whipsaw behavior, creating smoother crossovers that emphasize real momentum shifts rather than temporary volatility spikes.
Trend Detection via EMA Crossovers
-A bullish trend is detected when EMA 1 (fast) crosses above EMA 2 (slow).
-A bearish trend is detected when EMA 1 crosses below EMA 2.
The detected trend state is stored and used to dynamically color the plots.
Visual Representation
Both EMAs are plotted on the chart. Their colors shift to blue during bullish phases and purple during bearish phases. The area between the two EMAs is filled with a shaded region to clearly highlight trending conditions.
Buy and Sell Conditions:
-Buy Condition: When the Kalman-smoothed EMA 1 crosses above the Kalman-smoothed EMA 2, a bullish crossover is confirmed.
-Sell Condition: When EMA 1 crosses below EMA 2, a bearish crossover is confirmed.
Users may enhance the robustness of these signals by adjusting process noise, measurement noise, or EMA lengths. Lower measurement noise values make the filter react faster (but potentially noisier), while higher values make it smoother (but slower).
Features and Parameters:
-Source: Selectable price input (Close, Open, High, Low, etc.).
-EMA 1 Length: Defines the fast EMA period.
-EMA 2 Length: Defines the slow EMA period.
-Process Noise: Controls how much randomness the Kalman filter assumes in price dynamics.
-Measurement Noise: Controls how much uncertainty is assumed in raw input data.
-Kalman Usage: Option to apply Kalman filtering either before EMA calculation (on price) or after (on EMA values).
Specifications:
Kalman Filter
The Kalman filter is an optimal recursive algorithm that estimates the state of a system from noisy measurements. In trading, it is used to smooth prices or indicator values. By balancing process noise (expected volatility) with measurement noise (data uncertainty), it generates a smoothed signal that reacts adaptively to market conditions.
Exponential Moving Average (EMA)
An EMA is a weighted moving average that emphasizes recent data more heavily than older data. This makes it more responsive than a simple moving average (SMA). EMAs are widely used to identify trends and momentum shifts.
EMA Crossovers
The crossing of a fast EMA above a slow EMA suggests bullish momentum, while the opposite suggests bearish momentum. This is a cornerstone technique in trend-following systems.
Dual Kalman Filtering
Applying Kalman both to raw price and to the EMAs themselves reduces whipsaws further. It creates crossover signals that are not only smoothed but also validated across two levels of noise reduction. This significantly enhances signal reliability compared to traditional EMA crossovers.
Process Noise
Represents the filter’s assumption about how much the underlying market can randomly change between steps. Higher values make the filter adapt faster to sudden changes, while lower values make it more stable.
Measurement Noise
Represents uncertainty in price data. A higher measurement noise value means the filter trusts the model more than the observed data, leading to smoother results. A lower value makes the filter more reactive to observed price fluctuations.
Trend Coloring & Fill
The use of dynamic colors and filled regions provides immediate visual recognition of trend states, helping traders act faster and with greater clarity.
Enjoy!

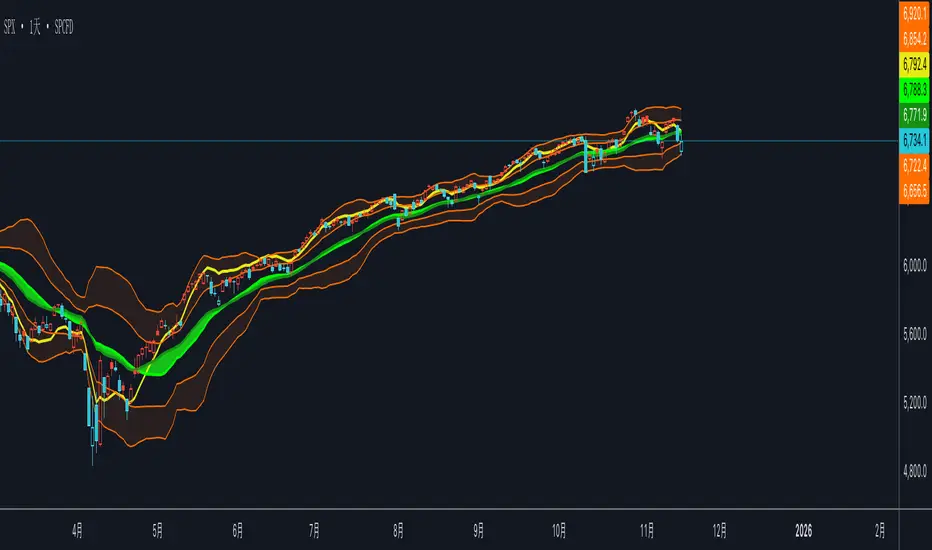
双布林Dual Bollinger Bands
This technical indicator combines dual Bollinger Bands with multiple moving average overlays to provide a comprehensive view of price trends, volatility, and potential support/resistance zones.
**Components:**
1. **TEMA21 (Triple Exponential Moving Average)**
- Yellow line representing the 21-period TEMA
- Provides smooth trend direction with reduced lag compared to traditional moving averages
- Calculated using three sequential EMAs to filter out market noise
2. **SMA21 & EMA21 Channel**
- Green filled area between the 21-period Simple Moving Average and Exponential Moving Average
- Visualizes the dynamic zone where these two averages interact
- Helps identify trend strength when price stays above/below this channel
3. **MA21 (Simple Moving Average)**
- Bright green line showing the 21-period SMA
- Classic trend-following indicator
4. **EMA21 (Exponential Moving Average)**
- Dark green line displaying the 21-period EMA
- More responsive to recent price changes than SMA
5. **Dual Bollinger Bands**
- **Outer Bands (2 Standard Deviations)**: Orange lines marking the traditional Bollinger Band boundaries
- **Inner Bands (1 Standard Deviation)**: Orange lines creating a tighter volatility zone
- **Orange Shaded Areas**: Highlight the zones between outer and inner bands
- All bands use a 21-period basis and are fully customizable
**Settings:**
- Length: 21 (adjustable)
- Source: Close price (adjustable)
- Outer Band StdDev: 2.0 (adjustable)
- Inner Band StdDev: 1.0 (adjustable)
- Offset: 0 (adjustable from -500 to +500)
**Usage:**
This indicator is ideal for identifying trend direction, volatility expansion/contraction, and potential reversal zones. The dual Bollinger Bands provide multiple levels for support/resistance analysis, while the moving averages confirm trend strength and direction.