@theCF StochasticStochastic with Bullish , Bearish and Neutral Ranges as well as a modification to check the %D line with a Exponential Moving Average .
Since Exponential Moving Averages put more weight onto recent values, they react differently than the Standard Simple Moving Average .
On Stochastic I have observed, that there can often occur false crossover signals. While this also happens with an Exponential Moving Average as %D indeed, the amount is more limited, therefore giving less false signals.
I prefer to display both at the same time, for more information.
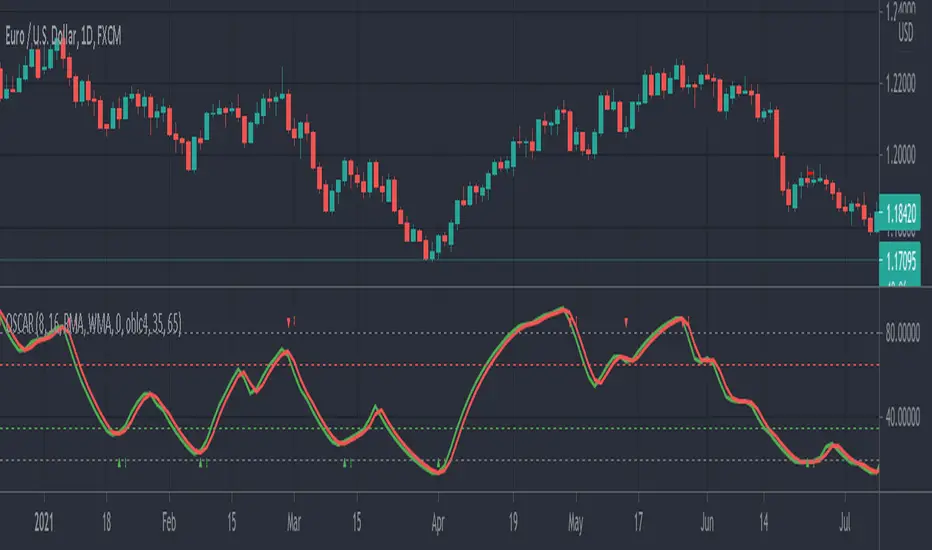
The ranges act as general support and resistance zones on Stochastic . Whenever Stochastic oscillates within one of the ranges, one can interpret it as either bullish , neutral or bearish for price.
A Stochastic that oscillates mainly within the bullish range can be interpreted rather bullish , the opposite goes for the bearish range which is interpreted bearish .
I have coded these ranges into the Standard Stochastic Script, as well as the option to display the %D line as a Exponential Moving Average .
For more information about the indicator, feel free to leave a comment and ask.
Indikator Pine Script®