Cari skrip untuk "Buy sell"

ZenTrend Follower Signals (Backtest)Buy/Sell Entry signals based on the ZenTrend Follower indicator.
Entries are taken from the setup and trend breakout level, exits from the trailing stop loss.
Overextension and trend re-entry signals are ignored.
The indicator is linked below
If you enjoy these posts please like and subscribe so more people can join you :)
If you want to tryout the indicator and strategy, follow me and drop a comment or pm and I’ll get you set up.
Stay calm, and happy trading!
More information on the indicator can be found below:

Altcoins StrategyBuy/Sell Altcoins strategy. Based on moving averages, divergences, price and volume

Buy SellKıvanc hocanın yazdığı 2 stop loss indikatörünün birleşmesi sonucu bulundu. Çalışma mantığını kullandıkça anlayacaksınızıdır.


Buy Sell signal by Spicytrader
Get on board before going to the moon !
Spicytrader instantly identifies when a potential pump or dump is beginning.
Compatible with Autoview bot
GET ACCESS : spicytrader.com


Buy/Sell Using MACD and ReversalsUsing the crossover of Signal Line and MACD line predict the reversals of trends in the chart.


Buy/Sell Ahmed Rashiedtrade with confidence good for both intra day and long term took me 2 yrs to finish it

MULTIPLE TIME-FRAME STRATEGY(TREND, MOMENTUM, ENTRY) Hey everyone, this is one strategy that I have found profitable over time. It is a multiple time frame strategy that utilizes 3 time-frames. Highest time-frame is the trend, medium time-frame is the momentum and short time-frame is the entry point.
Long Term:
- If closed candle is above entry then we are looking for longs, otherwise we are looking for shorts
Medium Term:
- If Stoch SmoothK is above or below SmoothK and the momentum matches long term trend then we look for entries.
Short Term:
- If a moving average crossover(long)/crossunder(short) occurs then place a trade in the direction of the trend.
Close Trade:
- Trade is closed when the Medium term SmoothK Crosses under/above SmoothD.
You can mess with the settings to get the best Profit Factor / Percent Profit that matches your plan.
Best of luck!

[STRATEGY][RS]MicuRobert EMA cross V2Great thanks Ricardo , watch this man . Start at 2014 December with 1000 euro.


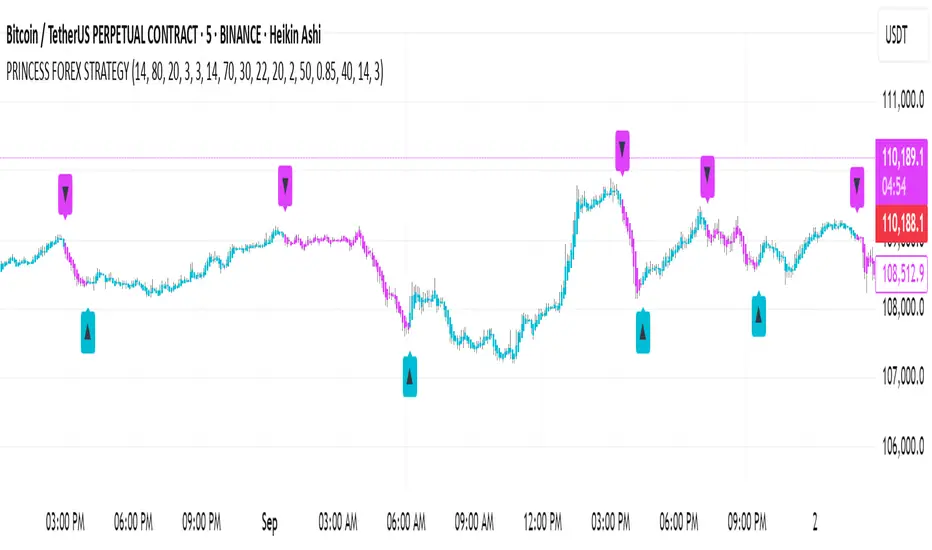
[PRINCESS FOREX STRATEGY]PRINCESS FOREX STRATEGY (BUY + SELL BY USING HEKINASHI CANDEL CHART)
This indicator combines Stochastic, RSI, and a modified Williams VIX Fix filter to generate high-probability BUY and SELL signals, with automatic candle coloring for improved visual clarity.
How It Works
By Using Hekinashi Candel (Chart)
Stochastic Oscillator (Slow)
Measures momentum and overbought/oversold zones.
Adjustable inputs for %K, %D smoothing and thresholds.
Relative Strength Index (RSI)
Confirms strength of price movement.
Helps identify reversal zones around 30 (oversold) and 70 (overbought).
Williams VIX Fix (Volatility Filter)
Detects potential bottoms/tops based on volatility spikes.
Includes Bollinger Band and percentile-based filtering to avoid false signals.
Sequential Signal Logic
Prevents back-to-back conflicting signals.
Position state: 0 = Flat, 1 = After Buy, -1 = After Sell.
Candle Coloring
Aqua candles highlight bullish sequences after a BUY signal.
Fuchsia candles highlight bearish sequences after a SELL signal.
Neutral candles remain uncolored for clean visualization.
When to Use
Works well on Forex, indices, commodities, and cryptocurrency pairs.
Can be applied to any timeframe — from scalping on M5 charts to swing trading on H4 or daily charts.
Best used with price action, support/resistance zones, and volume analysis for confirmation.
How to Interpret Signals
BUY ▲ (Aqua):
Price strength confirmed with bullish momentum.
Volatility filter supports potential upward reversal.
SELL ▼ (Fuchsia):
Price weakness confirmed with bearish momentum.
Volatility filter supports potential downward reversal.
Colored candles continue until an opposite signal is generated.
Key Features
Full input customization (RSI, Stoch, VIX Fix parameters).
No repainting — signals print on confirmed candle closes.
Clean, visual signals with built-in candle highlighting.
💎 MACD Combo Pro – Scalping + Swing🇬🇧 ENGLISH DESCRIPTION: "💎 MACD Combo Pro – Scalping + Swing"
Overview:
The MACD Combo Pro indicator is a powerful dual-mode MACD tool designed for both scalping (fast signals) and swing trading (M15 confirmation). It helps identify momentum shifts and high-probability entry signals in both short and medium-term trends.
🔍 Key Features:
Fast MACD (Scalping Mode):
Based on EMAs 5, 13, 5
Generates quick intrabar signals for fast market movements
Histogram coloring indicates bullish/bearish momentum
Arrows ("↑"/"↓") for scalp buy/sell signals
Swing MACD (15-minute timeframe):
Classic MACD based on EMAs 12, 26, 9
Uses request.security() to pull data from 15min regardless of current timeframe
Colored background shows overall M15 trend context
"SWING BUY" and "SWING SELL" labels confirm macro trend
🎯 Signal Logic:
✅ Scalp BUY: Fast MACD crosses above signal line
❌ Scalp SELL: Fast MACD crosses below signal line
🔵 Swing BUY: 15m MACD > signal
🟠 Swing SELL: 15m MACD < signal
🧠 Use Case:
Intraday traders can enter with scalp signals, confirmed by the swing trend.
Ideal for scalping XAUUSD, BTC, NASDAQ, etc.

Deviationcreate buy sell signal whenever price gets deviation signals. Green color line will give buy signal and buy should be last swing high . red color line will give sell signal and sell should be below the last swing low.
