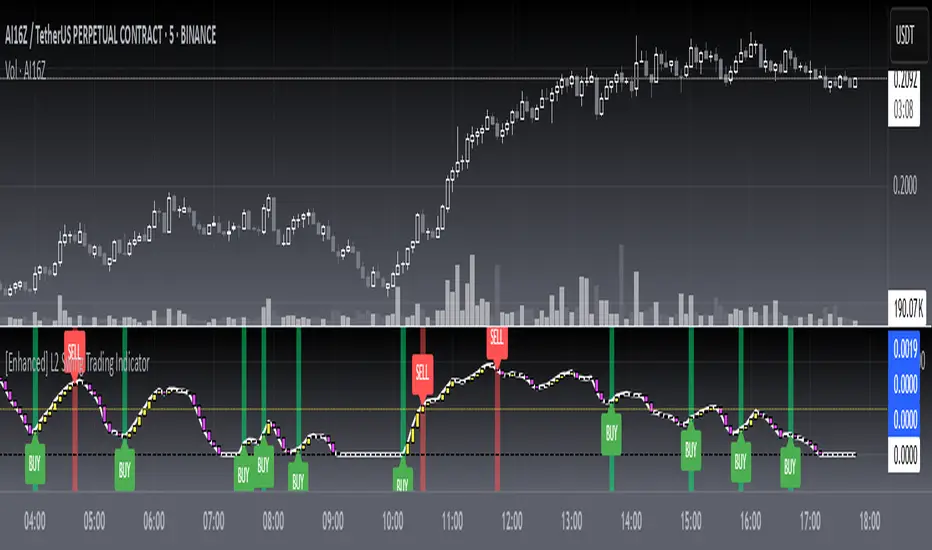
[blackcat] L2 Swing Trading IndicatorLevel: 2
Background
Swing trading is a type of trading aimed at making short to medium term profits from a trading pair over a period of a few days to several weeks. Swing traders mainly use technical analysis to look for trading opportunities. In addition to analyzing price trends and patterns, these traders can also use fundamental analysis.
Function
L2 Swing Trading Indicator
Key Signal
trend --> trend line with color candles standing for trend strength
pump --> whale pump indicator
top --> top zone for selling point
bbuy --> botton zone for buying point
varr1 ---> for selling points
bullbear --> use 50 as bull bear boundary
Pros and Cons
Pros:
1. Clear to see the trend reversals with strength changes
2. Whale pump indicator confirm the validity of trend reversals
Cons:
1. oversold zone is hidden due to using zero line as bottom
Remarks
NA
Readme
In real life, I am a prolific inventor. I have successfully applied for more than 60 international and regional patents in the past 12 years. But in the past two years or so, I have tried to transfer my creativity to the development of trading strategies. Tradingview is the ideal platform for me. I am selecting and contributing some of the hundreds of scripts to publish in Tradingview community. Welcome everyone to interact with me to discuss these interesting pine scripts.
The scripts posted are categorized into 5 levels according to my efforts or manhours put into these works.
Level 1 : interesting script snippets or distinctive improvement from classic indicators or strategy. Level 1 scripts can usually appear in more complex indicators as a function module or element.
Level 2 : composite indicator/strategy. By selecting or combining several independent or dependent functions or sub indicators in proper way, the composite script exhibits a resonance phenomenon which can filter out noise or fake trading signal to enhance trading confidence level.
Level 3 : comprehensive indicator/strategy. They are simple trading systems based on my strategies. They are commonly containing several or all of entry signal, close signal, stop loss, take profit, re-entry, risk management, and position sizing techniques. Even some interesting fundamental and mass psychological aspects are incorporated.
Level 4 : script snippets or functions that do not disclose source code. Interesting element that can reveal market laws and work as raw material for indicators and strategies. If you find Level 1~2 scripts are helpful, Level 4 is a private version that took me far more efforts to develop.
Level 5 : indicator/strategy that do not disclose source code. private version of Level 3 script with my accumulated script processing skills or a large number of custom functions. I had a private function library built in past two years. Level 5 scripts use many of them to achieve private trading strategy.
Cari skrip untuk "BULL"
Divergence RSI [mado]Divergence screener for OBV RSI
Regular Bullish: "D" navy label
Hidden Bullish: "H" navy label
Regular Bearish: "D" red label
Hidden Bearish: "H" red label

Divergence Stoch RSI[mado]Divergence screener for Stoch RSI
Regular Bullish: "D" navy label
Hidden Bullish: "H" navy label
Regular Bearish: "D" red label
Hidden Bearish: "H" red label

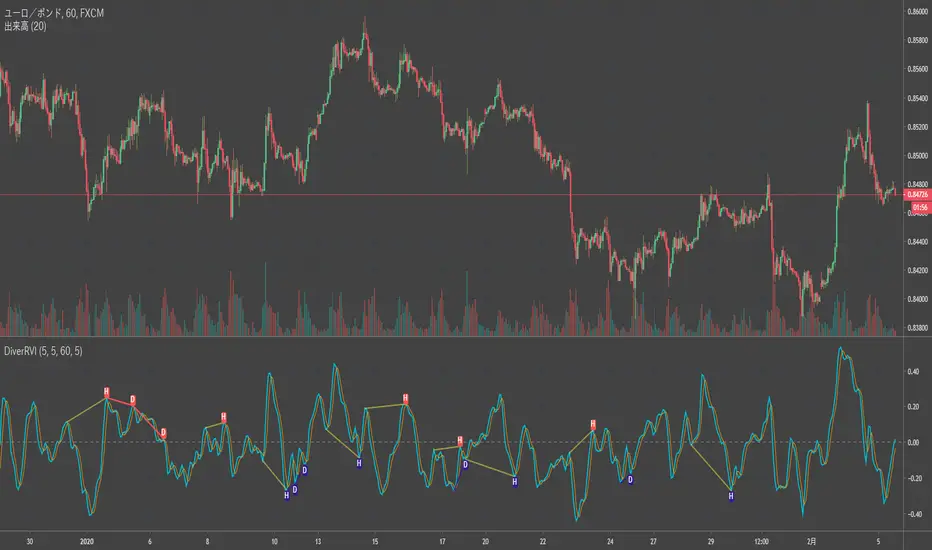
Divergence RVI[mado]Divergence screener for RVI
Regular Bullish: "D" navy label
Hidden Bullish: "H" navy label
Regular Bearish: "D" red label
Hidden Bearish: "H" red label
Divergence OBV RSI[mado]Divergence screener for OBV RSI
Regular Bullish: "D" navy label
Hidden Bullish: "H" navy label
Regular Bearish: "D" red label
Hidden Bearish: "H" red label

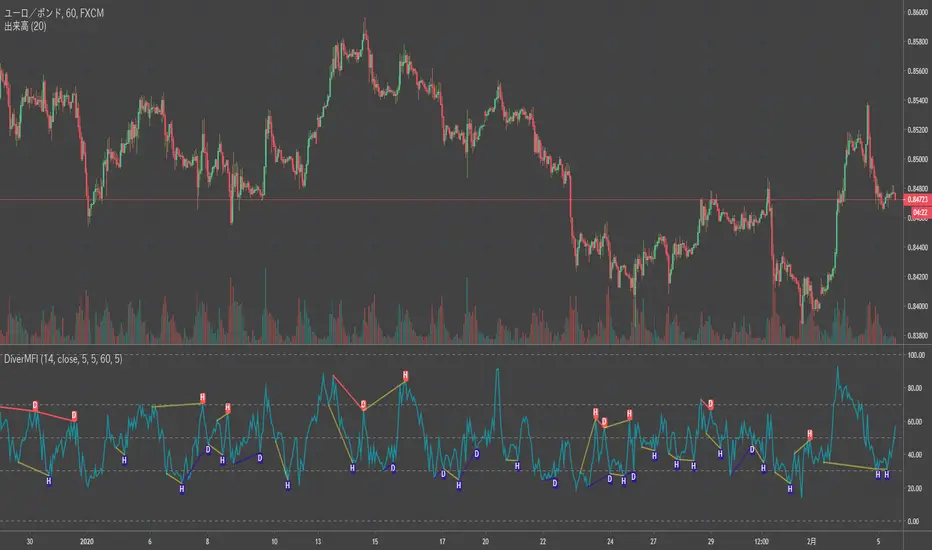
Divergence MFI[mado]Divergence screener for MFI
Regular Bullish: "D" navy label
Hidden Bullish: "H" navy label
Regular Bearish: "D" red label
Hidden Bearish: "H" red label
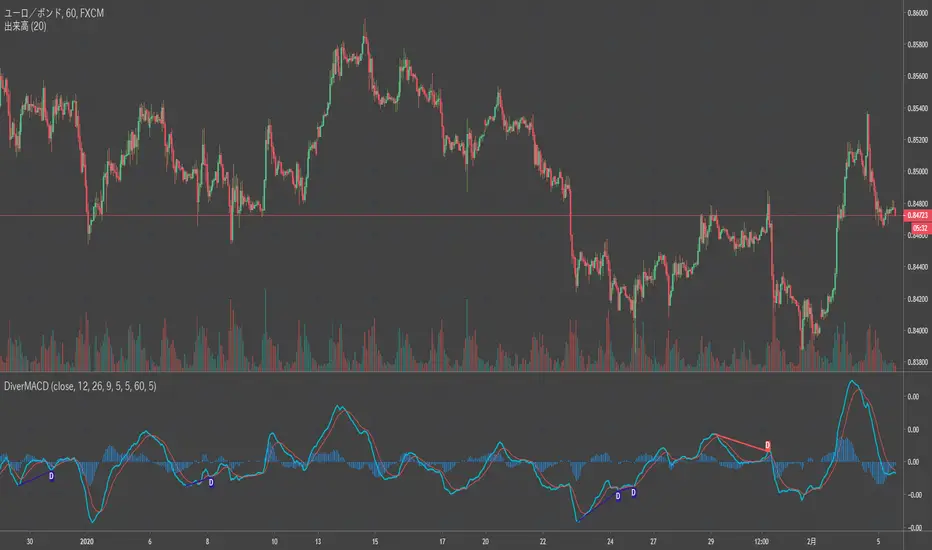
Divergence MACD [mado]Divergence screener for MACD
Regular Bullish: "D" navy label
Hidden Bullish: "H" navy label
Regular Bearish: "D" red label
Hidden Bearish: "H" red label
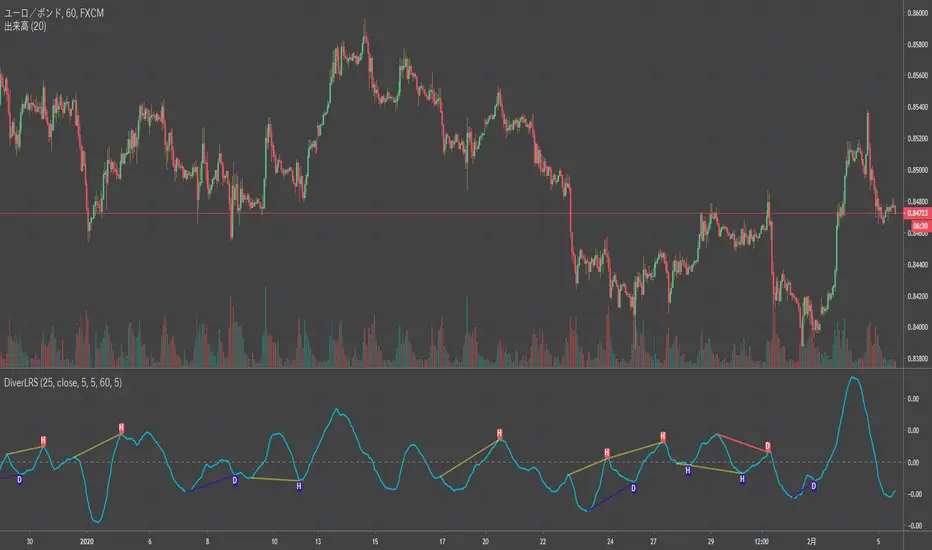
Divergence LinerRegressionSlope[mado]Divergence screener for LinerRegressionSlope
Regular Bullish: "D" navy label
Hidden Bullish: "H" navy label
Regular Bearish: "D" red label
Hidden Bearish: "H" red label
Divergence KlingerVolumeOscillator [mado]Divergence screener for KVO
Regular Bullish: "D" navy label
Hidden Bullish: "H" navy label
Regular Bearish: "D" red label
Hidden Bearish: "H" red label

Divergence CCI [mado]Divergence screener for CCI
Regular Bullish: "D" navy label
Hidden Bullish: "H" navy label
Regular Bearish: "D" red label
Hidden Bearish: "H" red label

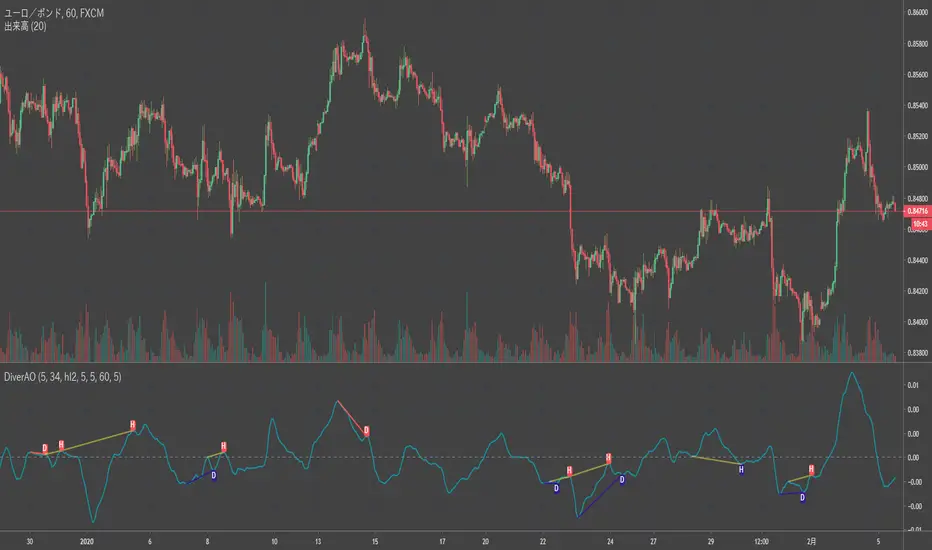
Divergence Awesome Oscillator [mado]Divergence screener for Awesome Oscillator
Regular Bullish: "D" navy label
Hidden Bullish: "H" navy label
Regular Bearish: "D" red label
Hidden Bearish: "H" red label
Market Regime Filter for BitcoinA quick indicator that shows what type of market we are in.
To be used on Daily Charts.
The color gray shows we are lacking conviction and we are waiting for a move.
Red means bear market - stay out or reduce positions.
Green means it's a bull.
There's 2 levels of intensity. Regular bull (light green), Super Bull (dark green),
Regular bear (light red) and Super Bear (dark red).
To be paired with the volatility filter indicator - the best bull markets start with
low volatility and end with bubble characteristics (volatile Super Bull)

Elder impulse system with double exponential moving average dema
This version of impulse uses the double exponential moving average instead of the typical ema both to calculate macd and the moving slow and fast moving average that are plotted.
The impulse system :
The Impulse System combines two simple but powerful indicators.
One measures market inertia, the other its momentum. When both
point in the same direction, they identify an impulse worth following.
We get an entry signal when both indicators get in gear.
The Impulse System uses an exponential moving average to find
uptrends and downtrends. When the EMA rises, it shows that inertia
favors the bulls. When EMA falls, inertia works for the bears. The sec-
ond component is MACD-Histogram, an oscillator whose slope reflects
changes of power among bulls or bears. When MACD-Histogram rises,
it shows that bulls are becoming stronger. When it falls, it shows that
bears are growing stronger.
The Impulse System flags those bars where both the inertia and the
momentum point in the same direction. When both the EMA and
MACD-Histogram rise, they show that bulls are roaring and the uptrend
is accelerating.
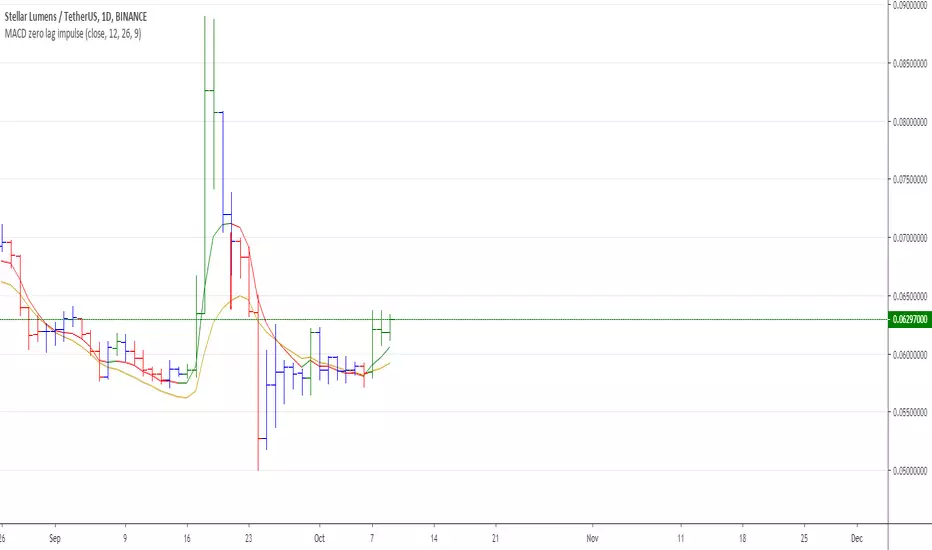
MACD Zero lag impulse systemThis version of impulse uses the double exponential moving average instead of the typical ema.
The impulse system :
The Impulse System combines two simple but powerful indicators.
One measures market inertia, the other its momentum. When both
point in the same direction, they identify an impulse worth following.
We get an entry signal when both indicators get in gear.
The Impulse System uses an exponential moving average to find
uptrends and downtrends. When the EMA rises, it shows that inertia
favors the bulls. When EMA falls, inertia works for the bears. The sec-
ond component is MACD-Histogram, an oscillator whose slope reflects
changes of power among bulls or bears. When MACD-Histogram rises,
it shows that bulls are becoming stronger. When it falls, it shows that
bears are growing stronger.
The Impulse System flags those bars where both the inertia and the
momentum point in the same direction. When both the EMA and
MACD-Histogram rise, they show that bulls are roaring and the uptrend
is accelerating.

Visual RSI [LucF]Visual RSI offers a different way of looking at RSI by providing a composite representation of 9 different RSI-generated components. Instead of focusing on one line only, this approach blends multiple sources to provide the viewer with a larger context RSI-based picture.
For those who don’t want to read
• Green in bullish (>50) zone is the most bullish.
• Red in bullish zone doesn’t necessarily mean bearish—it just means bullish strength is weakening. It may be just a pause before a reprise or exhaustion signalling a reversal—impossible to tell.
• The same in inverse applies to the bearish zone (<50).
For those who want to understand
The nine components making up Visual RSI are:
• a current timeframe RSI
• a higher timeframe RSI
• the delta between these two RSI lines
• for each of these three basic components, two independent Bollinger band: one calculated for the bullish section of the scale (>50) and a separate one calculated for the lower bearish region.
Dual BBs
In my view, RSI’s position with regards to the centerline is much more important than its position in extreme areas. Why? Because the building block of RSI is the ratio of the averages of up/down moves during the RSI period. When the average of ups is greater, RSI is > 50. So while a rising signal starting from 20 let’s say, indicates that the rate of change is increasing, only when it crosses 50 can we say that sentiment balance has truly become bullish, and this information is more reliable than the signal being at a level corresponding to whatever estimate we make of what constitutes an extreme value. In my landscape, the general balance of a ratio provides more valuable information than the ratio’s exact value.
The idea behind the dual BBs is to provide independent tracking information for both halves of the indicator’s space, which I find more useful than the normal method of simply adding a multiple of the standard deviation on both sides of the mean. With dual BBs, the upper BB will never go lower than the indicator’s centerline, and the lower BB will never go higher. The upper BB focuses on upper-bound volatility when the signal is bearish, and the lower BB focuses on downside volatility when the signal is bearish.
The functions used to calculate the independent BBs are reusable on other signals if a centerline can be defined for them. A clamping percentage is implemented, so that when a BB line is hugging the centerline it clamps to it. This helps in providing earlier signals when they use the BB line states.
Providing context to RSI
What RSI measures indirectly is the balance in the rate of change—or the speed of price movement, but not its instant value, otherwise RSI would be even noisier. More precisely, RSI represents the relative strength of the up/down movement in the last n bars of RSI’s length, with 14 often used because that’s what Wilder proposed (Visual RSI’s defaults are 20 for the current timeframe and 40 for the higher timeframe). At every bar, a new value is added to the equation and an old value carrying equal weight is dropped, so a large dropped off value will have more impact on RSI’s value if the new bar’s move is small. This accounts for some of RSI’s speed in identifying exhaustion after important moves, but almost for some of its noise.
Visual RSI is the result of trying to drown RSI’s noise in the context of other informational streams, while simultaneously providing even faster information than RSI alone, by giving more visual weight to the delta between the current and higher timeframe RSI’s.
How to read Visual RSI
The default settings show all 9 basic components as green/red areas of intensities varying with their importance. The most intense colors are reserved for the delta RSI and the BBs have the lightest intensities. The individual lines of components are intentionally difficult to distinguish so that focus is first on the general picture, including the all-important six-state background, and then on the delta RSI.
One entry setup could be reversals in a larger trend context, so low pivots of the delta in a fully bullish context (a green background in the upper section of the indicator), and inversely, high pivots in a fully bearish context (a red background in the lower section of the indicator).
Please resist the common misconception, when interpreting RSI, that a reversal in the signal will necessarily lead to a reversal in price. Each trend has its rhythm. Only machine-generated price action can progress regularly. It’s normal for trends to take a breather for some time before they continue or reverse, as traders driving the trend experience emotional fatigue and gradual fear. RSI reversals merely signify that such a breather has occurred—nothing more. Only the larger context can provide information that can situate that pause and put more meaningful odds on it having more probability of continuing in one direction or the other. This is the reasoning behind the setup just described.
Features
• All components can be hidden, displayed as a simple line, a uniformly colored fill, or a green/red fill (the default).
• The background can be colored using 9 different methods, including 3 six-state methods using the rising/falling BB lines of the 3 basic components. These six states allow for bullish/bearish/neutral sentiment in both the upper and lower regions of the indicator. A bearish (dark red) background in the bullish (>50) section of the indicator represents decreasing bullishness. A bearish (slightly brighter red) in the bearish (<50) section of the indicator means incresingly bearish sentiment. The six-state backgrounds allow for neutral (no color) sentiment when no compelling signs can be found to conclude anything with meaningful odds. The default background uses the six-state method on the higher timeframe RSI’s BBs because I find it the most useful, as it represents the largest—and slowest—context sentiment among all the indicator’s components.
• A thin status bar in the top part of the indicator also allows selection of the same 9 methods to color it. The default is a triple-state system using the rising/falling characteristics of the current timeframe RSI’s BBs to provide a short-term counterbalance to the long-term background.
• Three different markers can be configured using approximately 70 permutations each, each filtered by 20 different filter permutations. When modification of the relevant parameters in the script’s Settings/Settings/Parameters section is added, possibilities are almost endless. If the generated signals are then fed into the PineCoders Engine and combined with the Engine’s own options, the permutations go up another order of magnitude, and changes to any setting can be instantly evaluated using the Engine’s backtesting results.
• Five simple filters can be combined. They are additive. They include volume-related conditions and a chandelier, which I find useful because both volume and volatility (the chandelier using highs/lows and ATR) are sensible complementary sources to RSI’s momentum information. The filter’s state can be shown as a thin line at the bottom of the indicator.
• Alerts can be configured using any of the marker/filter combinations mentioned. As usual, once your markers/filters are set up the way you want, create your alert from the chart/timeframe you want the alert to run on and be sure to use the “Once Per Bar Close” triggering condition. Use an alert message that will remind you of which combination of markers were used when creating the alert.
• A plot providing entry signals for the PineCoders Backtesting & Trading Engine is supplied. It will use whichever marker/filter configuration is active to generate signals.
• All higher timeframe information is non-repainting. Higher timeframe lines can be smoothed (the default). The selection of the higher timeframe can be made using 3 different methods:
1. By steps (if current timeframe <= 1 minute: 60 min, <= 60 min: 1D, <= 6H: 3D, <= 1D: 1W, <=1W: 1M, >1W: 12M)
2. By a user-defined multiple of the current timeframe
3. Using a fixed timeframe
Thanks to:
• Alex Orekhov aka @everget for the chandelier code.
• @RicardoSantos who through a small remark early on, unknowingly put me on the track of eliminating noise through visual crowding.
• The brilliant guys in the PineCoders Pro room for your knowledge, limitless creativity and constant companionship.

Elder impulse system with barcolor + Safezone stops + emasThe impulse system :
The Impulse System combines two simple but powerful indicators.
One measures market inertia, the other its momentum. When both
point in the same direction, they identify an impulse worth following.
We get an entry signal when both indicators get in gear.
The Impulse System uses an exponential moving average to find
uptrends and downtrends. When the EMA rises, it shows that inertia
favors the bulls. When EMA falls, inertia works for the bears. The sec-
ond component is MACD-Histogram, an oscillator whose slope reflects
changes of power among bulls or bears. When MACD-Histogram rises,
it shows that bulls are becoming stronger. When it falls, it shows that
bears are growing stronger.
The Impulse System flags those bars where both the inertia and the
momentum point in the same direction. When both the EMA and
MACD-Histogram rise, they show that bulls are roaring and the uptrend
is accelerating.
The SafeZone Stop :
Once in a trade, where should you put your stop? This is one of the
hardest questions in technical analysis. After answering it, you’ll face
an even harder one—when and where to move that stop with the pas-
sage of time. Put a stop too close and it’ll get whacked by some mean-
ingless intraday swing. Put it too far, and you’ll have very skimpy
protection.
The Parabolic System, described in Trading for a Living, tried to
tackle this problem by moving stops closer to the market each day,
accelerating whenever a stock or a commodity reached a new extreme.
The trouble with Parabolic was that it kept moving even if the market
stayed flat and often got hit by meaningless noise.
SafeZone trails prices with stops tight enough to protect
capital but remote enough to keep clear of most random fluctuations.
Engineers design filters to suppress noise and allow the signal to come
through. If the trend is the signal, then the countertrend motion is the
noise. When the trend is up, we can define noise as that part of each
day’s range that protrudes below the previous day’s low. When the trend
is down, we can define noise as that part of each day’s range that pro-
trudes above the previous day’s high. SafeZone measures market noise
and places stops at a multiple of noise level away from the market.
We can make our lookback period 100 days or so if we want to aver-
age long-term market behavior.
SafeZone offers an original approach to placing stops. It monitors
changes in prices and adapts stops to the current levels of activity. It
places stops at individually tailored distances rather than at obvious
support and resistance levels.

NG [Wave Period Oscillator]The WPO is a short-term oscillator that measures the buying and selling period of price cycles over a certain time interval.
The leading oscillator indicates a rise in buying period when it moves above the zero line and a rise in selling period when it moves below the zero line.
Trading Tactics
Center line Crossover: a bullish center line crossover occurs when the WPO line moves above the zero level to turn positive.
A bearish center line crossover occurs when the WPO line moves below the zero level to turn negative.
When bulls are in control, the price rally begins and the average of the bull’s period T increases to drive the WPO line above the center line.
A buy signal is subsequently triggered.
When the bulls start to loose power, prices move sideways and the average period decreases. In this case, the WPO line may fl utter near the center line and cause false signals, whipsaws.
To avoid the whipsaws occurring on the center line, the following trading tactics are proposed:
Uptrend Tactic:
During an ideal uptrend, the WPO does not reach the lower boundary -2 and usually rebounds from a higher level than -2.
This means that the bulls have taken control earlier. Hence, a zero line crossover generates a buy signal. The WPO crosses the upper boundary at +2 then pulls back again below +2 to generate a sell signal.
Sideways Tactic:
During sideways, the WPO fluctuates between the lower and upper boundaries -2 and 2. This tactic is also used in an uptrend where corrections are strong enough to drive the WPO line below the lower boundary.
Downtrend Tactic:
During downtrends, the WPO fails to reach the upper boundary and oscillates between the 0 and -2 levels. The bears enter early indicating an obvious weakness in the market. Therefore, crossing the zero level generates a sell signal.
Exit at Weakness:
During uptrend reversals and downtrends, the WPO oscillates between the center line and the lower boundary -2. The bears are controlling the market and move in wide cycle periods while the bull’s strength is almost absent.
An exit signal is triggered once the WPO crosses -2. When prices decline, the WPO may cross its extreme lower boundary at -2.7. Therefore, a swift exit signal is triggered once the WPO crosses -2.
Re-Entry:
During uptrend, the WPO crosses down the upper boundary level at +2 to generate a sell signal. Yet, it does not reach the zero line and the oscillator moves back toward the upper boundary.
This case is considered as strength while a re-entry signal occurs at the +2 level crossover. The sell signal is generated when the WPO line crosses down the upper boundary.

Ichimoku Kinko Hyo: Basic StrategyIchimoku Kinko Hyo: Basic Strategy
Entry/Exit orders are placed when three basic signals are triggered.
Ichimoku Signals:
1) Tenkan-Sen/Kijun-Sen Cross
Bullish: Tenkan-Sen is above the Kijun-Sen.
Bearish: Tenkan-Sen is below the Kijun-Sen.
2) Chikou-Span Cross
Bullish: Chikou-Span is above the close of 26 bars ago.
Bearish: Chikou-Span is below the close of 26 bars ago.
3) Price versus Kumo Cloud
Bullish: Close is above the Kumo Cloud.
Bearish: Close is below the Kumo Cloud.
Notes:
1) Long-only or short-only direction is feasible by checkbox. Stop and reverse strategy is taken by default.
2) Built-in Ichimoku indicator is strictly wrong because of counting one extra bar for all Ichimoku components.
Including the current bar like moving average is correct way in Japan. This problem is fixed in my script.

ABCD Strategy (v7 Ready)//@version=6
indicator("ABCD Strategy v7 – MTF S/R Filter", overlay=true, max_lines_count=300, max_labels_count=300)
//━━━━━━━━━━━━━━━━━━━━━
// INPUTS
//━━━━━━━━━━━━━━━━━━━━━
pivotLen = input.int(5, "Swing Strength", minval=2)
bcMin = input.float(0.618, "BC Min Fib")
bcMax = input.float(0.786, "BC Max Fib")
cdMin = input.float(1.272, "CD Min Extension")
cdMax = input.float(1.618, "CD Max Extension")
htfTF = input.timeframe("240", "Higher Timeframe (S/R)")
srLookback = input.int(200, "HTF S/R Lookback")
srTolerance = input.float(0.002, "S/R Zone Tolerance (0.2%)")
showSR = input.bool(true, "Show HTF S/R Zones")
showTargets = input.bool(true, "Show Targets")
//━━━━━━━━━━━━━━━━━━━━━
// HIGHER TF SUPPORT / RESISTANCE
//━━━━━━━━━━━━━━━━━━━━━
htfHigh = request.security(syminfo.tickerid, htfTF, ta.highest(high, srLookback))
htfLow = request.security(syminfo.tickerid, htfTF, ta.lowest(low, srLookback))
srHighZoneTop = htfHigh * (1 + srTolerance)
srHighZoneBottom = htfHigh * (1 - srTolerance)
srLowZoneTop = htfLow * (1 + srTolerance)
srLowZoneBottom = htfLow * (1 - srTolerance)
//━━━━━━━━━━━━━━━━━━━━━
// DRAW HTF ZONES
//━━━━━━━━━━━━━━━━━━━━━
if showSR
box.new(bar_index - 5, srHighZoneTop, bar_index + 5, srHighZoneBottom,
bgcolor=color.new(color.red, 85), border_color=color.red)
box.new(bar_index - 5, srLowZoneTop, bar_index + 5, srLowZoneBottom,
bgcolor=color.new(color.green, 85), border_color=color.green)
//━━━━━━━━━━━━━━━━━━━━━
// SWING DETECTION
//━━━━━━━━━━━━━━━━━━━━━
ph = ta.pivothigh(high, pivotLen, pivotLen)
pl = ta.pivotlow(low, pivotLen, pivotLen)
var float A = na
var float B = na
var float C = na
var float D = na
var int Ab = na
var int Bb = na
var int Cb = na
var int Db = na
if not na(pl)
A := B
Ab := Bb
B := C
Bb := Cb
C := low
Cb := bar_index
if not na(ph)
A := B
Ab := Bb
B := C
Bb := Cb
C := high
Cb := bar_index
//━━━━━━━━━━━━━━━━━━━━━
// ABCD LOGIC
//━━━━━━━━━━━━━━━━━━━━━
ab = math.abs(B - A)
bc = math.abs(C - B)
bcFib = bc / ab
validBC = bcFib >= bcMin and bcFib <= bcMax
bull = C > B
cdMinPrice = bull ? C - bc * cdMin : C + bc * cdMin
cdMaxPrice = bull ? C - bc * cdMax : C + bc * cdMax
inDzone = low <= cdMaxPrice and high >= cdMinPrice
//━━━━━━━━━━━━━━━━━━━━━
// MTF STRUCTURE FILTER
//━━━━━━━━━━━━━━━━━━━━━
nearResistance = close <= srHighZoneTop and close >= srHighZoneBottom
nearSupport = close <= srLowZoneTop and close >= srLowZoneBottom
structureOK =
(bull and nearSupport) or
(not bull and nearResistance)
//━━━━━━━━━━━━━━━━━━━━━
// FINAL D CONFIRMATION
//━━━━━━━━━━━━━━━━━━━━━
if validBC and inDzone and structureOK
D := close
Db := bar_index
//━━━━━━━━━━━━━━━━━━━━━
// TARGETS
//━━━━━━━━━━━━━━━━━━━━━
tp1 = bull ? D + math.abs(D - C) * 0.382 : D - math.abs(D - C) * 0.382
tp2 = bull ? D + math.abs(D - C) * 0.618 : D - math.abs(D - C) * 0.618
//━━━━━━━━━━━━━━━━━━━━━
// DRAW PATTERN
//━━━━━━━━━━━━━━━━━━━━━
if not na(D)
line.new(Ab, A, Bb, B, width=2, color=color.blue)
line.new(Bb, B, Cb, C, width=2, color=color.orange)
line.new(Cb, C, Db, D, width=2, color=color.green)
label.new(Db, D, "D (HTF CONFIRMED)", style=label.style_label_down, color=color.yellow)
if showTargets
line.new(Db, tp1, Db + 12, tp1, color=color.green)
line.new(Db, tp2, Db + 12, tp2, color=color.teal)
alertcondition(validBC and inDzone and structureOK,
"ABCD v7 Confirmed",
"ABCD Pattern confirmed at Higher-Timeframe Support/Resistance — wait for price action.")

ABCD Strategy (v6 Ready)//@version=6
indicator("ABCD Strategy v7 – MTF S/R Filter", overlay=true, max_lines_count=300, max_labels_count=300)
//━━━━━━━━━━━━━━━━━━━━━
// INPUTS
//━━━━━━━━━━━━━━━━━━━━━
pivotLen = input.int(5, "Swing Strength", minval=2)
bcMin = input.float(0.618, "BC Min Fib")
bcMax = input.float(0.786, "BC Max Fib")
cdMin = input.float(1.272, "CD Min Extension")
cdMax = input.float(1.618, "CD Max Extension")
htfTF = input.timeframe("240", "Higher Timeframe (S/R)")
srLookback = input.int(200, "HTF S/R Lookback")
srTolerance = input.float(0.002, "S/R Zone Tolerance (0.2%)")
showSR = input.bool(true, "Show HTF S/R Zones")
showTargets = input.bool(true, "Show Targets")
//━━━━━━━━━━━━━━━━━━━━━
// HIGHER TF SUPPORT / RESISTANCE
//━━━━━━━━━━━━━━━━━━━━━
htfHigh = request.security(syminfo.tickerid, htfTF, ta.highest(high, srLookback))
htfLow = request.security(syminfo.tickerid, htfTF, ta.lowest(low, srLookback))
srHighZoneTop = htfHigh * (1 + srTolerance)
srHighZoneBottom = htfHigh * (1 - srTolerance)
srLowZoneTop = htfLow * (1 + srTolerance)
srLowZoneBottom = htfLow * (1 - srTolerance)
//━━━━━━━━━━━━━━━━━━━━━
// DRAW HTF ZONES
//━━━━━━━━━━━━━━━━━━━━━
if showSR
box.new(bar_index - 5, srHighZoneTop, bar_index + 5, srHighZoneBottom,
bgcolor=color.new(color.red, 85), border_color=color.red)
box.new(bar_index - 5, srLowZoneTop, bar_index + 5, srLowZoneBottom,
bgcolor=color.new(color.green, 85), border_color=color.green)
//━━━━━━━━━━━━━━━━━━━━━
// SWING DETECTION
//━━━━━━━━━━━━━━━━━━━━━
ph = ta.pivothigh(high, pivotLen, pivotLen)
pl = ta.pivotlow(low, pivotLen, pivotLen)
var float A = na
var float B = na
var float C = na
var float D = na
var int Ab = na
var int Bb = na
var int Cb = na
var int Db = na
if not na(pl)
A := B
Ab := Bb
B := C
Bb := Cb
C := low
Cb := bar_index
if not na(ph)
A := B
Ab := Bb
B := C
Bb := Cb
C := high
Cb := bar_index
//━━━━━━━━━━━━━━━━━━━━━
// ABCD LOGIC
//━━━━━━━━━━━━━━━━━━━━━
ab = math.abs(B - A)
bc = math.abs(C - B)
bcFib = bc / ab
validBC = bcFib >= bcMin and bcFib <= bcMax
bull = C > B
cdMinPrice = bull ? C - bc * cdMin : C + bc * cdMin
cdMaxPrice = bull ? C - bc * cdMax : C + bc * cdMax
inDzone = low <= cdMaxPrice and high >= cdMinPrice
//━━━━━━━━━━━━━━━━━━━━━
// MTF STRUCTURE FILTER
//━━━━━━━━━━━━━━━━━━━━━
nearResistance = close <= srHighZoneTop and close >= srHighZoneBottom
nearSupport = close <= srLowZoneTop and close >= srLowZoneBottom
structureOK =
(bull and nearSupport) or
(not bull and nearResistance)
//━━━━━━━━━━━━━━━━━━━━━
// FINAL D CONFIRMATION
//━━━━━━━━━━━━━━━━━━━━━
if validBC and inDzone and structureOK
D := close
Db := bar_index
//━━━━━━━━━━━━━━━━━━━━━
// TARGETS
//━━━━━━━━━━━━━━━━━━━━━
tp1 = bull ? D + math.abs(D - C) * 0.382 : D - math.abs(D - C) * 0.382
tp2 = bull ? D + math.abs(D - C) * 0.618 : D - math.abs(D - C) * 0.618
//━━━━━━━━━━━━━━━━━━━━━
// DRAW PATTERN
//━━━━━━━━━━━━━━━━━━━━━
if not na(D)
line.new(Ab, A, Bb, B, width=2, color=color.blue)
line.new(Bb, B, Cb, C, width=2, color=color.orange)
line.new(Cb, C, Db, D, width=2, color=color.green)
label.new(Db, D, "D (HTF CONFIRMED)", style=label.style_label_down, color=color.yellow)
if showTargets
line.new(Db, tp1, Db + 12, tp1, color=color.green)
line.new(Db, tp2, Db + 12, tp2, color=color.teal)
alertcondition(validBC and inDzone and structureOK,
"ABCD v7 Confirmed",
"ABCD Pattern confirmed at Higher-Timeframe Support/Resistance — wait for price action.")

Weekly Regime Filter - Trend + Momentum + Structure (MTF)A multi-timeframe weekly regime indicator that classifies market conditions into BULL , BEAR , or CHOP using three components: trend, momentum, and market structure.
Works on any timeframe while always referencing weekly data — no repainting.
━━━━━━━━━━━━━━━━━━━━━━━━━━━━━━
🎯 WHAT IT DOES
Answers one question: What is the weekly regime?
• Trend — EMA hierarchy (Price > EMA Fast > EMA Slow)
• Momentum — DI+ vs DI- with optional ADX filter
• Structure — Break of Structure (BOS) and Change of Character (CHOCH)
BULL = All three bullish
BEAR = All three bearish
CHOP = Mixed signals
━━━━━━━━━━━━━━━━━━━━━━━━━━━━━━
⚡ KEY FEATURES
• Multi-Timeframe (MTF) — View on 1H, 4H, Daily; regime stays consistent
• Auto-Detect Asset Type — Automatically applies optimized settings for Crypto, Stocks, Forex, Gold, Silver, Oil, Commodities
• BOS/CHOCH Labels — Visual market structure breaks on chart
• Live Status Panel — Shows regime, components, and active parameters
• Non-Repainting — Uses confirmed weekly closes only
━━━━━━━━━━━━━━━━━━━━━━━━━━━━━━
📊 ASSET PRESETS
• Crypto — EMA 50/200, ADX Off, Pivot 2
• Stocks/Indices — EMA 50/200, ADX >20, Pivot 3
• Forex — EMA 30/100, ADX >25, Pivot 2
• Gold — EMA 40/150, ADX >20, Pivot 3
• Silver — EMA 40/150, ADX >22, Pivot 3
• Oil — EMA 30/100, ADX >25, Pivot 2
• Commodities — EMA 40/120, ADX >20, Pivot 3
Select "Custom" to use your own values.
━━━━━━━━━━━━━━━━━━━━━━━━━━━━━━
📈 HOW TO USE
For Swing Trading:
• Set chart to Daily
• Use Auto-Detect or select preset
• Long only when BULL, short only when BEAR
• Reduce size or avoid when CHOP
Structure Signals:
• CHOCH ↑ after bear regime = Early reversal signal
• CHOCH ↓ after bull regime = Tighten stops
• BOS in regime direction = Trend continuation
━━━━━━━━━━━━━━━━━━━━━━━━━━━━━━
🔔 ALERTS
• Regime → BULL
• Regime → BEAR
• CHOCH → Bull
• CHOCH → Bear
━━━━━━━━━━━━━━━━━━━━━━━━━━━━━━
⚙️ SETTINGS
Preset: Auto-Detect, Crypto, Stocks, Forex, Gold, Silver, Oil, Commodities, Custom
Custom Settings (when Custom selected):
• EMA Fast/Slow lengths
• ADX Length & Threshold
• ADX Filter toggle
• Pivot Left/Right
Display:
• Plot Weekly EMAs
• Show BOS/CHOCH Labels
• Show Regime Background
• Background Opacity
• Show Status Label
━━━━━━━━━━━━━━━━━━━━━━━━━━━━━━
📝 NOTES
• Needs ~200 weeks of history for full calculation
• Weekly signals are slower by design — filters noise
• Not a standalone system — combine with entries and risk management
• When using presets, Custom input fields won't visually update (Pine limitation) — status label shows actual values

ABCD Strategy (v7 Ready)//@version=6
indicator("ABCD Strategy v7 – MTF S/R Filter", overlay=true, max_lines_count=300, max_labels_count=300)
//━━━━━━━━━━━━━━━━━━━━━
// INPUTS
//━━━━━━━━━━━━━━━━━━━━━
pivotLen = input.int(5, "Swing Strength", minval=2)
bcMin = input.float(0.618, "BC Min Fib")
bcMax = input.float(0.786, "BC Max Fib")
cdMin = input.float(1.272, "CD Min Extension")
cdMax = input.float(1.618, "CD Max Extension")
htfTF = input.timeframe("240", "Higher Timeframe (S/R)")
srLookback = input.int(200, "HTF S/R Lookback")
srTolerance = input.float(0.002, "S/R Zone Tolerance (0.2%)")
showSR = input.bool(true, "Show HTF S/R Zones")
showTargets = input.bool(true, "Show Targets")
//━━━━━━━━━━━━━━━━━━━━━
// HIGHER TF SUPPORT / RESISTANCE
//━━━━━━━━━━━━━━━━━━━━━
htfHigh = request.security(syminfo.tickerid, htfTF, ta.highest(high, srLookback))
htfLow = request.security(syminfo.tickerid, htfTF, ta.lowest(low, srLookback))
srHighZoneTop = htfHigh * (1 + srTolerance)
srHighZoneBottom = htfHigh * (1 - srTolerance)
srLowZoneTop = htfLow * (1 + srTolerance)
srLowZoneBottom = htfLow * (1 - srTolerance)
//━━━━━━━━━━━━━━━━━━━━━
// DRAW HTF ZONES
//━━━━━━━━━━━━━━━━━━━━━
if showSR
box.new(bar_index - 5, srHighZoneTop, bar_index + 5, srHighZoneBottom,
bgcolor=color.new(color.red, 85), border_color=color.red)
box.new(bar_index - 5, srLowZoneTop, bar_index + 5, srLowZoneBottom,
bgcolor=color.new(color.green, 85), border_color=color.green)
//━━━━━━━━━━━━━━━━━━━━━
// SWING DETECTION
//━━━━━━━━━━━━━━━━━━━━━
ph = ta.pivothigh(high, pivotLen, pivotLen)
pl = ta.pivotlow(low, pivotLen, pivotLen)
var float A = na
var float B = na
var float C = na
var float D = na
var int Ab = na
var int Bb = na
var int Cb = na
var int Db = na
if not na(pl)
A := B
Ab := Bb
B := C
Bb := Cb
C := low
Cb := bar_index
if not na(ph)
A := B
Ab := Bb
B := C
Bb := Cb
C := high
Cb := bar_index
//━━━━━━━━━━━━━━━━━━━━━
// ABCD LOGIC
//━━━━━━━━━━━━━━━━━━━━━
ab = math.abs(B - A)
bc = math.abs(C - B)
bcFib = bc / ab
validBC = bcFib >= bcMin and bcFib <= bcMax
bull = C > B
cdMinPrice = bull ? C - bc * cdMin : C + bc * cdMin
cdMaxPrice = bull ? C - bc * cdMax : C + bc * cdMax
inDzone = low <= cdMaxPrice and high >= cdMinPrice
//━━━━━━━━━━━━━━━━━━━━━
// MTF STRUCTURE FILTER
//━━━━━━━━━━━━━━━━━━━━━
nearResistance = close <= srHighZoneTop and close >= srHighZoneBottom
nearSupport = close <= srLowZoneTop and close >= srLowZoneBottom
structureOK =
(bull and nearSupport) or
(not bull and nearResistance)
//━━━━━━━━━━━━━━━━━━━━━
// FINAL D CONFIRMATION
//━━━━━━━━━━━━━━━━━━━━━
if validBC and inDzone and structureOK
D := close
Db := bar_index
//━━━━━━━━━━━━━━━━━━━━━
// TARGETS
//━━━━━━━━━━━━━━━━━━━━━
tp1 = bull ? D + math.abs(D - C) * 0.382 : D - math.abs(D - C) * 0.382
tp2 = bull ? D + math.abs(D - C) * 0.618 : D - math.abs(D - C) * 0.618
//━━━━━━━━━━━━━━━━━━━━━
// DRAW PATTERN
//━━━━━━━━━━━━━━━━━━━━━
if not na(D)
line.new(Ab, A, Bb, B, width=2, color=color.blue)
line.new(Bb, B, Cb, C, width=2, color=color.orange)
line.new(Cb, C, Db, D, width=2, color=color.green)
label.new(Db, D, "D (HTF CONFIRMED)", style=label.style_label_down, color=color.yellow)
if showTargets
line.new(Db, tp1, Db + 12, tp1, color=color.green)
line.new(Db, tp2, Db + 12, tp2, color=color.teal)
alertcondition(validBC and inDzone and structureOK,
"ABCD v7 Confirmed",
"ABCD Pattern confirmed at Higher-Timeframe Support/Resistance — wait for price action.")

Gold Profit Target SystemGOLD PROFIT TARGET SYSTEM
Track Real Profits, Exit With Confidence
Best on Daily or Weekly - copy and mod as you see fit. Have fun!
WHAT THIS INDICATOR DOES:
This indicator tracks your gold position from entry and shows color-coded profit targets as the price rises. Instead of guessing when to exit, you see exact profit levels in real-time: 1%, 2%, 3%, 4%, 5%, 10%, 15%, 20%, 25%, and 25%+.
Simple concept: BUY on the signal, SELL at YOUR chosen profit level.
HOW IT WORKS - 3 SIMPLE STEPS:
STEP 1: Wait for BUY Signal
• Green triangle (▲) appears below the composite line
• Triggered when inverse assets (DXY, rates, etc.) show strong correlation and are falling
• Entry price is automatically recorded
• Position tracking begins
STEP 2: Watch Profit Targets Appear
• As gold rises, color-coded symbols appear above the composite line
• Each symbol represents a profit milestone
• The info table shows your current profit
• You decide when to exit based on YOUR target
STEP 3: Exit at Your Chosen Level
• Conservative? Exit at 5-10%
• Moderate? Exit at 10-15%
• Aggressive? Hold for 20%+
• The indicator just shows the levels - YOU make the call
THE COMPOSITE LINE - WHAT IT MEANS:
The main line is a weighted composite of inverse-correlated assets:
• DXY (US Dollar Index)
• Real Interest Rates (10Y TIPS)
• US 10-Year Treasury Yield
• US 2-Year Treasury Yield
• Bitcoin (optional)
• Copper (optional)
Line Position:
• Below -30 (Bright Green): Very strong inverse correlation - excellent BUY conditions
• Below 0 (Green): Inverse correlation present - moderate BUY conditions
• Above 0 (Red): Inverse assets rising - neutral to bearish
• Above 30 (Bright Red): Strong inverse rally - bearish for gold
What Causes BUY Signals:
When the composite line is negative (inverse assets falling) AND shows strong correlation (>0.3), this suggests gold is likely to rise. The indicator records your entry and begins tracking profits.
COLOR-CODED PROFIT TARGETS:
EARLY PROFITS (Green Circles):
• 1% - Very Light Green (#c8e6c9) - First confirmation
• 2% - Light Green (#a5d6a7) - Building profit
• 3% - Green (#81c784) - Good profit
• 4% - Medium Green (#66bb6a) - Strong profit
• 5% - Dark Green (#4caf50) - Solid profit!
EXCELLENT PROFIT (Yellow Diamond):
• 10% - Yellow (#ffd54f) - Double digits, excellent trade!
OUTSTANDING PROFIT (Orange Diamonds):
• 15% - Orange (#ffb74d) - Exceptional profit, consider partial exit
EXCEPTIONAL PROFIT (Red Diamonds):
• 20% - Light Red (#ff8a65) - Rare territory, strong exit consideration
• 25% - Red (#f44336) - Extraordinary profit, very rare!
PEAK PROFIT (Purple Star):
• 25%+ - Purple (#9c27b0) - Once in a blue moon! The home run trade!
STOP LOSS (Red X):
• Default -5% - Protection against losses
• Position auto-resets if stop is hit
THE PROFIT BAR (Histogram):
Below the composite line, you'll see a colored histogram when in position:
Bar Color = Your Current Profit Tier
• Light green bar = 1-2% profit
• Green bar = 3-5% profit
• Yellow bar = 10% profit
• Orange bar = 15% profit
• Red bar = 20-25% profit
• Purple bar = 25%+ profit
• Red negative bar = Currently at a loss
Bar Height = Current Profit %
The taller the bar, the larger your profit. Negative bars extend downward when you're at a loss.
THE INFORMATION TABLE:
The table (top-right by default) shows everything at a glance:
Position: ✓ IN (green) or ✗ OUT (gray)
Shows whether you're currently holding a position
Entry Price: Your recorded buy price
Example: 2,100.50
Current Price: Gold's current price
Example: 2,142.75
Current P/L: YOUR PROFIT %
This is the most important metric - shows exactly how much you're up (or down)
Color matches your current profit tier
Example: +2.01% in light green
Profit Tier: Current milestone reached
Shows which profit level you've hit: "1%", "2%", "5%", "10%", etc.
Next Target: The next profit level to watch
Tells you what milestone is coming up next
Bars Held: How long you've been in the trade
Helps track holding time
Composite: Current correlation strength
Shows the underlying composite correlation value
REFERENCE LINES:
Zero Line (Gray):
The center line. Above = bearish for gold, Below = bullish for gold
Strong Bull Line (Green dashed at -30):
When composite crosses below -30, very strong BUY conditions
Strong Bear Line (Red dashed at +30):
When composite crosses above +30, strong bearish conditions
BACKGROUND SHADING:
Very Light Green Background:
You're in profit (position open and above entry price)
Very Light Red Background:
You're at a loss (position open and below entry price)
No Background:
No position currently open
SYMBOLS ON CHART:
▲ Green Triangle Below Line: BUY SIGNAL
Enter long position here. Entry price recorded.
● Small Green Circles Above Line: 1-5% Profits
Early profit targets. Light green to dark green progression.
◆ Diamonds Above Line: 10-25% Profits
Major profit milestones. Yellow → Orange → Red progression.
★ Purple Star Above Line: 25%+ Profit
The holy grail! Peak profit achieved.
✖ Red X Below Line: STOP LOSS HIT
Trade went against you. Position resets (if auto-reset enabled).
PROFIT-TAKING STRATEGIES:
Strategy 1: Fixed Target (Simple)
Pick one target (e.g., 10%) and always exit there.
Best for: Beginners, disciplined traders
Strategy 2: Scaled Exit (Advanced)
Exit in portions:
• 5% profit → Sell 25%
• 10% profit → Sell 25% (50% total out)
• 15% profit → Sell 25% (75% total out)
• 20%+ profit → Let final 25% ride
Best for: Risk management, maximizing upside
Strategy 3: Trailing Stop
• Hit 10%? Set stop at 5%
• Hit 15%? Set stop at 10%
• Lock in profits while letting winners run
Best for: Trend followers, bull markets
Strategy 4: Adaptive
• Strong uptrend → wait for 15-20%
• Choppy market → exit at 5-10%
• Weakening trend → exit at any profit
Best for: Experienced traders
SETTINGS YOU CAN CUSTOMIZE:
Profit Target Levels:
Change any profit % to match your strategy
• Conservative: Lower targets (0.5%, 1%, 2%, 3%, 5%)
• Aggressive: Higher targets (2%, 5%, 10%, 20%, 30%)
Assets to Include:
• Enable/disable Bitcoin
• Enable/disable Copper
• Toggle which inverse assets to track
Display Options:
• Show all targets or just current tier
• Show/hide profit bar
• Show/hide composite line
• Move table position
Stop Loss:
• Set your risk tolerance (default 5%)
• Enable/disable auto-reset on stop loss
Correlation Periods:
• Adjust for your timeframe
• Hourly: 14/30/60
• Daily: 20/50/100
• Weekly: 10/20/50
ALERTS AVAILABLE:
Set alerts for any profit milestone:
Critical Alerts:
• "BUY Signal" - Entry notification
• "5% Profit Target" - First major milestone
• "10% Profit Target" - Decision point
• "Stop Loss Hit" - Risk protection
Optional Alerts:
• 1%, 2%, 3%, 4% - Early confirmations
• 15%, 20%, 25% - Major milestones
• Individual levels for your strategy
BEST TIMEFRAMES:
Daily Chart (Recommended):
Best for swing traders holding 3-10 days
Use default settings (20/50/100 periods)
Target 5-15% profits
4-Hour Chart:
Good for active swing traders
Adjust periods to 14/30/60
Target 3-10% profits
Hourly Chart:
For day traders and scalpers
Use shorter periods (14/30/60)
Target 1-5% profits
Adjust profit levels lower (0.5%, 1%, 2%, 3%)
WHY THIS INDICATOR IS DIFFERENT:
Most indicators tell you WHEN to enter.
This one tells you WHEN TO EXIT with profit.
Most indicators use vague signals.
This one shows EXACT profit percentages.
Most indicators leave exit decisions to you.
This one gives CLEAR, COLOR-CODED milestones.
Most indicators don't track your P/L.
This one shows your profit in text you can't miss.
QUICK START GUIDE:
1. Add indicator to gold chart (XAUUSD, GLD, GC1!)
2. Wait for green triangle (▲) BUY signal
3. Watch your profit grow in the table
4. Exit when you hit YOUR target (5%, 10%, 15%, etc.)
5. Repeat
That's it. Simple. Effective. Profitable.
IMPORTANT NOTES:
• This is for LONG positions only - not for shorting gold
• Position tracking begins only after a BUY signal
• The indicator shows levels - YOU decide when to exit
• Always use stop losses (default 5% is reasonable)
• Past performance doesn't guarantee future results
• Not financial advice - use for educational purposes
PRO TIPS:
Tip 1: Don't get greedy - 10-15% is an excellent profit for most trades
Tip 2: Purple stars (25%+) are RARE - don't wait for them on every trade
Tip 3: The profit bar color change is your visual cue - green→yellow→orange→red
Tip 4: Combine with resistance levels - "10% profit + resistance = exit"
Tip 5: Set alerts for YOUR target level so you never miss it
Tip 6: The giant P/L number in the table removes emotion from decisions
EXAMPLE TRADE:
Day 1: ▲ BUY signal at $2,100
Table shows: Position ✓ IN | Entry: 2,100
Day 2: Current P/L: +1.8%
First green circle appears (1% target hit)
Table tier: "1%"
Day 4: Current P/L: +5.2%
Dark green circle appears (5% target hit)
Profit bar is dark green
Decision point: Exit 50% here?
Day 7: Current P/L: +10.5%
Yellow diamond appears (10% target hit!)
Table shows: +10.5% in yellow text
Decision point: Exit remaining 50%?
Result: Average exit ~7.5% over 7 days. Excellent swing trade!
WORKS ON:
• Gold Spot (XAUUSD)
• Gold Futures (GC1!)
• Gold ETFs (GLD, IAU)
• Any gold instrument
Inverse Assets Tracked:
• DXY (US Dollar Index)
• Real Interest Rates (TIPS)
• US Treasury Yields (2Y, 10Y)
• Bitcoin (optional)
• Copper (optional)
THE BOTTOM LINE:
Stop guessing when to take profits.
Start SEEING your profit levels in real-time.
The indicator shows you the targets.
YOU choose when to cash out.
That's YOUR edge.
Developed for traders who want clear, actionable profit targets instead of vague signals.
