BO Rule: Body & Filter Duplicates** **
**BO Rule: Advanced Breakout & Retest (Body Only + Strict Sequence)**
This indicator is designed for Price Action traders who focus on **Structure Break & Retest** setups. Unlike standard fractal indicators, this script employs a strict "New Price Rule" and "Body-Only" logic to filter out noise and identifying high-probability trend reversals.
**Key Logic & Features:**
1. **Classic Levels (Body Only):**
* Resistance is defined by a Green candle followed by a Red candle.
* Support is defined by a Red candle followed by a Green candle.
* **Crucial:** The script strictly uses Candle **Bodies** (Open/Close) to define levels, ignoring Wicks to avoid fakeouts caused by market volatility.
2. **Strict Sequence (New Price Rule):**
* The "Reset Logic" ensures that once a signal is confirmed, all previous structure levels are considered obsolete.
* The script resets its memory and only looks for *new* structure levels formed *after* the latest confirmed signal.
3. **Breakout & Retest Confirmation:**
* The script waits for a valid breakout of the classic level.
* It then monitors for a **Retest & Rejection**.
* Signal is generated only when price revisits the broken level and closes respecting the new direction.
4. **Trend Filter (No Duplicates):**
* **Option Included:** You can enable "Filter Duplicate Signals" to see only Trend Reversals (e.g., Buy -> Sell -> Buy). This hides consecutive signals in the same direction to keep the chart clean.
5. **MTF Dashboard:**
* Monitor up to 5 different timeframes simultaneously on one chart.
**How to Use:**
* **Green Dashed Line:** Bullish Confirmation (Breakout + Retest).
* **Red Dashed Line:** Bearish Confirmation (Breakdown + Retest).
* **Settings:** You can toggle the "Filter Duplicates" and "New Price Rule" in the settings menu.
-------------------------------------------------------
** **
**BO Rule: 經典水平突破回踩 (實體判斷 + 嚴格序列規則)**
這是一個專為裸K交易者 (Price Action) 設計的突破回踩指標。與傳統指標不同,它採用了嚴格的「新價格規則」與「僅看實體」邏輯,能有效過濾假突破並識別趨勢反轉。
**核心邏輯與功能:**
1. **經典水平 (僅看實體 Body Only):**
* 阻力位:由「綠K」接「紅K」形成。
* 支撐位:由「紅K」接「綠K」形成。
* **重點:** 系統僅使用 K棒實體 (收盤/開盤) 來定義水平,完全忽略影線 (Wicks),以避免影線造成的假訊號。
2. **新價格規則 (嚴格序列):**
* 採用「最新優先」原則。一旦當前訊號確認,之前所有的舊結構水平立即作廢。
* 系統只會尋找在「最新訊號之後」形成的新水平,確保交易邏輯符合當下的市場結構。
3. **突破回踩確認:**
* 偵測到實體突破後,系統會進入監控模式。
* 只有當價格回踩該水平並成功「拒絕」(收盤守住) 時,才會發出訊號。
4. **過濾重複訊號 (只看反轉):**
* **設定選項:** 您可以勾選「過濾重複方向訊號」。
* 勾選後,若當前是多頭,系統會隱藏後續的多頭訊號,直到出現空頭訊號為止 (呈現:多 -> 空 -> 多),讓圖表更乾淨。
5. **多週期 (MTF) 監控:**
* 可同時監控 5 個不同時間級別的突破狀態。
**使用說明:**
* **綠色虛線**:多頭確認 (5 多)。
* **紅色虛線**:空頭確認 (5 空)。
Cari skrip untuk "BOS"


EMA Market Structure [BOSWaves]EMA Market Structure - Trend-Driven Structural Mapping with Adaptive Swing Detection
Overview
The EMA Market Structure indicator provides an advanced framework for visualizing market structure through dynamically filtered trend and swing analysis.
Unlike conventional EMA overlays, which merely indicate average price direction, this model integrates trend acceleration, swing highs/lows, and break-of-structure (BOS) logic into a unified, visually intuitive display.
Each element adapts in real time to price movement, offering traders a living map of support, resistance, and trend bias that reacts fluidly to market momentum.
The result is a comprehensive, trend-aware representation of price structure.
EMA slope and acceleration guide trend perception, while swing points identify key inflection zones.
Breaks of prior highs or lows are highlighted with visual BOS labels and stop-loss projections, giving traders actionable context for continuation or reversal setups.
Unlike static lines or simple moving averages, the EMA Market Structure indicator fuses dynamic trend analysis with structural awareness to provide a clear picture of market bias and potential turning points.
Theoretical Foundation
The EMA Market Structure builds on principles of momentum filtering and structural analysis.
Standard moving averages track average price but ignore acceleration and context; this indicator captures both the directional slope of the EMA and its rate of change, providing a proxy for trend strength.
Simultaneously, swing detection identifies statistically significant highs and lows, while BOS logic flags decisive breaks in structure, aligned with trend direction.
At its core are three interacting components:
EMA Trend & Acceleration : Smooths price data while highlighting acceleration changes, producing gradient-driven color cues for trend momentum.
Swing Detection Engine : Identifies swing highs and lows over configurable bar lengths, ensuring key turning points are captured with minimal clutter.
Break-of-Structure Logic : Detects price breaches of previous swings and aligns them with EMA trend for actionable BOS signals, including projected stop-loss levels for tactical decision-making.
By integrating these elements, the system scales effectively across timeframes and assets, maintaining structural clarity while visualizing trend dynamics in real time. Traders receive both macro and micro perspectives of market movement, with clear cues for trend continuation or reversal.
How It Works
The EMA Market Structure indicator operates through layered processing stages:
EMA Slope & Acceleration : Calculates the EMA and its rate of change, normalizing via ATR and a smoothing function to produce gradient color coding. This allows instant visual identification of bullish or bearish momentum.
Swing Identification : Swing highs and lows are computed using configurable left/right bar lengths, filtered through a cool-off mechanism to prevent redundant signals and maintain chart clarity.
Structural Lines & Zones : Swing points are connected with lines, and shaded zones are drawn between successive highs/lows to highlight key support and resistance regions.
Break-of-Structure Detection : BOS events occur when price breaches a prior swing in alignment with the EMA trend. Bullish and bearish BOS signals include enhanced label effects and projected stop-loss lines and zones, providing immediate tactical reference.
Dynamic Background Mapping : The chart background adapts to EMA trend direction, reinforcing trend context with subtle visual cues.
Through these processes, the indicator creates a living, adaptive map of market structure that reflects both trend strength and swing-based inflection points.
Interpretation
The EMA Market Structure reframes market reading from simple trend following to structured awareness of price behavior:
Uptrend Phases : EMA is rising with positive acceleration, swings confirm higher lows, and BOS events occur above prior highs, signaling trend continuation.
Downtrend Phases : EMA slope is negative, swings form lower highs, and BOS events occur below prior lows, confirming bearish bias.
Trend Reversals : Flat or decelerating EMA with BOS failures may indicate impending structural change.
Critical Zones : Swing-based lines and shaded zones highlight areas where price may pause, reverse, or accelerate, providing high-probability decision points.
Visually, EMA color gradients, structural lines, and BOS labels combine to provide both statistical trend confirmation and actionable structural cues.
Strategy Integration
EMA Market Structure integrates seamlessly into trend-following and swing-based trading systems:
Trend Alignment : Confirm higher-timeframe EMA slope before entering continuation trades.
BOS Entry Triggers : Use BOS events aligned with EMA trend for tactical entries and stop placement.
Support/Resistance Mapping : Swing lines and zones help define areas for scaling, exits, or reversals.
Volatility Context : ATR-based smoothing and stop-loss buffers accommodate varying market volatility, ensuring robustness across conditions.
Multi-Timeframe Coordination : Combine higher-timeframe EMA trend and swings with lower-timeframe structural events for precision entries.
Technical Implementation Details
Core Engine : EMA slope and ATR-normalized acceleration for gradient-driven trend visualization.
Swing Framework : Pivot-based high/low detection with configurable bar lengths and cool-off intervals.
Structural Visualization : Lines, zones, and labels for high-fidelity mapping of support/resistance and BOS events.
BOS Engine : Detects structural breaks aligned with EMA trend, automatically plotting stop-loss lines and visual cues.
Performance Profile : Lightweight, optimized for real-time responsiveness across multiple timeframes.
Optimal Application Parameters
Timeframe Guidance:
1 - 5 min : Ideal for intraday swing spotting and microstructure trend tracking.
15 - 60 min : Medium-range structural analysis and BOS-driven entries.
4H - Daily : Macro trend mapping and key swing-based support/resistance identification.
Suggested Configuration:
EMA Length : 50
Swing Length : 5
Swing Cooloff : 10 bars
BOS Cooloff : 15 bars
SL Buffer : 0.1%
These suggested parameters should be used as a baseline; their effectiveness depends on the asset volatility, liquidity, and preferred entry frequency, so fine-tuning is expected for optimal performance.
Performance Characteristics
High Effectiveness:
Trending markets with defined swings and structural consistency.
Markets where EMA slope and acceleration reliably indicate momentum changes.
Reduced Effectiveness:
Choppy or sideways markets with minimal swing definition.
Random walk assets lacking clear structural anchors.
Integration Guidelines
Confluence Framework : Combine with volume, momentum, or BOSWaves structural indicators
to validate entries.
Directional Control: Follow EMA slope and BOS alignment for high-conviction trades.
Risk Calibration: Use SL projections for disciplined exposure management.
Multi-Timeframe Synergy: Confirm higher-timeframe trend before executing lower-timeframe structural trades.
Disclaimer
The EMA Market Structure is a professional-grade trend and structure visualization tool. It is not predictive or guaranteed profitable; performance depends on parameter tuning, market regime, and disciplined execution. BOSWaves recommends using it as part of a comprehensive analytical stack integrating trend, liquidity, and structural context.

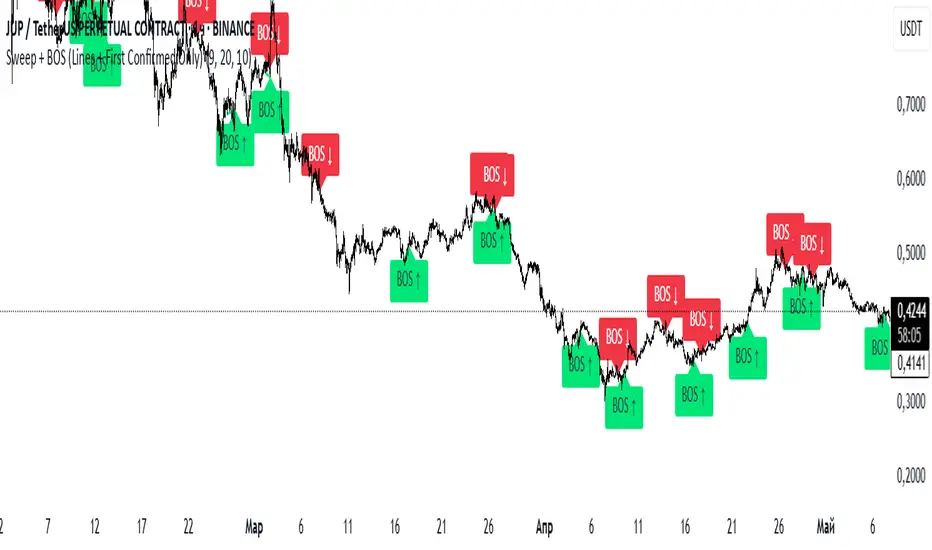
Sweep + BOS (Lines + First Confirmed Only)🔍 Indicator: Sweep + BOS (Break of Structure with Visual Lines)
🧠 Overview
This indicator combines Swing detection, Liquidity Sweeps, and Break of Structure (BOS) logic, with:
Customizable swing length,
BOS signals only after confirmed sweeps,
BOS shown only once per sweep,
Visual labels and connecting lines to highlight structure breaks clearly.
⚙️ Inputs
Swing Length:
Defines how many candles to use to identify a swing high/low. Must be an odd number (e.g., 3, 5, 7...).
Sweep Lookback Window:
Sets how far back the script checks for a sweep (false breakout over a swing).
BOS Validity After Sweep:
Number of bars within which a BOS can be considered valid after a sweep.
Toggle Options:
Show/hide:
Swing Labels
Sweep Labels
BOS Labels
BOS Connecting Lines
📌 Logic Breakdown
✅ Swings
Swing High: A candle’s high is greater than the highs of all N candles on both sides.
Swing Low: A candle’s low is lower than the lows of all N candles on both sides.
💧 Liquidity Sweeps
Sweep High:
Price spikes above a previous Swing High,
Then closes back below it (false breakout).
Sweep Low:
Price drops below a previous Swing Low,
Then closes back above it.
🔁 Break of Structure (BOS)
A BOS is only shown if:
It occurs after a valid sweep (within X bars),
It hasn’t been already plotted for that sweep,
BOS ↑ is only possible after Sweep Low,
BOS ↓ is only possible after Sweep High,
Opposite BOS type resets the last BOS state.
BOS ↑ (Bullish):
Confirmed when price closes above previous Swing High after Sweep Low.
Label appears at the candle low.
A line is drawn from the Swing Low to the BOS candle.
BOS ↓ (Bearish):
Confirmed when price closes below previous Swing Low after Sweep High.
Label appears at the candle high.
A line is drawn from the Swing High to the BOS candle.
Important High/Low (Manual DateTime Picker + Strong BOS) v2.5📐 Important High / Low(结构趋势指标)使用指南
定位一句话
这是一个 “结构派趋势确认 + 关键防守位识别” 的指标
👉 不预测行情
👉 不频繁给信号
👉 只在你定义的趋势里,标出 必须尊重的高点 / 低点
一、这个指标解决什么问题?
在一段趋势中,你真正关心的只有三件事:
趋势是否还成立
哪里是“不能被破”的关键结构位
止损应该放在哪里才是“逻辑止损”而不是情绪止损
本指标通过 结构拐点(Pivot)+ 结构突破(BOS)确认 来回答这三件事。
二、核心设计理念(非常重要)
1️⃣ 重要低点 > 次要低点
不是每个低点都重要
只有“低点 → 后续出现强势突破并创新高”
才会被确认成 重要低点
2️⃣ 上涨趋势里,只允许重要低点
不会在上涨趋势里画“重要高点”
下跌趋势同理
3️⃣ 所有重要点,都是事后确认
这是优点,不是缺点
它保证:
被画出来的点,一定“已经被市场认可”
三、输入参数详解(逐个解释)
🟦 A. 趋势控制(最重要)
Trend mode
选项 含义
Auto(EMA144) 自动趋势(推荐)
Manual(Time Window) 手动定义趋势区间
Auto(EMA144)(默认、最常用)
价格在 EMA144 上方 → 视为上涨趋势
价格在 EMA144 下方 → 视为下跌趋势
📌 行为约束:
上涨趋势:只画重要低点
下跌趋势:只画重要高点
适合 90% 日内 / 波段交易
Manual(Time Window)
当你已经主观判断趋势方向时使用。
配套参数:
Manual trend direction
Up:只允许重要低点
Down:只允许重要高点
Use manual time window?
打开后,才会启用时间段控制
Manual trend START / END (date & time)
用 TradingView 日期时间选择器 直接选
不需要手填时间戳
📌 常见用途:
回测一整段趋势
训练“趋势内只做一个方向”
事件行情 / 主升浪
🟦 B. 结构拐点识别
Pivot strength (L/R)
决定一个高点 / 低点
需要左右各多少根K线确认
周期 推荐值
1–5 分钟 2–3
15–30 分钟 3–5
1 小时 5–7
4 小时+ 7–10
📌 数值越大:
结构越“干净”
但确认越慢
🟦 C. 结构突破(BOS)规则
BOS uses Wick (High/Low)
true(推荐):
影线突破就算结构突破
false:
必须收盘价突破(更保守)
Must keep making NEW high/low
是否要求“持续创新高 / 新低”
选项 效果
true(强烈推荐) 过滤横盘、假突破
false 信号更多,但更杂
📌 打开后:
每一次 BOS
必须比上一次突破更高 / 更低
才会确认新的重要点
这是“稳”的关键来源之一。
🟦 D. 强势K线过滤(可选)
Use strong candle filter on BOS bar?
决定 BOS 那根K线是否必须是强势K线
Body / Range >=
K线实体占整根K线的比例
推荐:
0.5:宽松
0.6:平衡(推荐)
0.7:非常严格
Range >= ATR *
BOS K线的波动幅度
推荐:
日内:0.8 ~ 1.0
波段:1.0 ~ 1.2
📌 强势过滤适合:
山寨币
假突破多的品种
你想 少而准
🟦 E. 画线与止损体验
Line offset (ATR multiplier)
决定重要高/低点横线
离影线多远
市场 推荐
BTC / ETH 0.1 ~ 0.15
山寨 / 高波动 0.2 ~ 0.3
Short line length (bars)
横线长度
只影响视觉,不影响逻辑
推荐:5 ~ 8
四、不同周期的推荐模板
🔹 日内模板(15m / 30m)
Trend mode: Auto(EMA144)
Pivot strength: 3
Use wick BOS: true
Must make new high/low: true
Strong candle filter: true
Body/Range: 0.6
ATR multiple: 1.0
Line offset: 0.15
特点:
结构清晰
假突破明显减少
适合顺趋势波段
🔹 波段模板(1h / 4h)
Trend mode: Auto(EMA144)
Pivot strength: 5–7
Use wick BOS: true
Must make new high/low: true
Strong candle filter: false 或 true
Line offset: 0.2
特点:
重要点很少
但每一个都极具意义
非常适合“结构止损”
五、如何用它做交易(一句话版)
只在趋势方向上进场,
止损永远放在最近的“重要结构点”之外,
一旦被破,承认你的趋势假设是错的。
六、什么时候你“应该退出”,而不是“继续找理由”
多单:重要低点被有效跌破
空单:重要高点被有效突破
📌 这不是指标失效
📌 而是 你的趋势已经结束
📐 Important High / Low
User Guide (English Version)
One-line description
A market structure–based trend confirmation and key defense level indicator
Not predictive
No frequent signals
Only marks critical highs/lows inside a defined trend
1. What problem does this indicator solve?
In a trend, traders only care about:
Is the trend still valid?
Which level must NOT be broken?
Where should a logical stop-loss be placed?
This indicator answers these questions using
Pivot structure + Break of Structure (BOS).
2. Core Concepts
1️⃣ Important Low > Minor Low
Not every low is important
A low becomes important only if price later breaks structure and makes a new high
2️⃣ In an uptrend, only Important Lows exist
No important highs in uptrends
Vice versa for downtrends
3️⃣ All important points are confirmed after the fact
This is a feature, not a flaw
Ensures all marked levels are validated by price action
3. Input Parameters Explained
🟦 A. Trend Control (Most Important)
Trend mode
Option Meaning
Auto(EMA144) Automatic trend (recommended)
Manual(Time Window) Manually defined trend
Auto(EMA144)
Price above EMA144 → Uptrend
Price below EMA144 → Downtrend
Rules:
Uptrend → only Important Lows
Downtrend → only Important Highs
Manual(Time Window)
Used when you already know the trend direction.
Related inputs:
Manual trend direction
Up → only Important Lows
Down → only Important Highs
Use manual time window?
Enables the time window
Manual trend START / END (date & time)
Select via TradingView date-time picker
No timestamp typing required
🟦 B. Pivot Structure
Pivot strength (L/R)
Defines how many bars on each side confirm a swing point.
Timeframe Suggested
1–5m 2–3
15–30m 3–5
1h 5–7
4h+ 7–10
🟦 C. Break of Structure (BOS)
BOS uses Wick (High/Low)
true → wick break counts (recommended)
false → close break only
Must keep making NEW high/low
Requires continuous higher highs / lower lows.
true (strongly recommended)
Filters chop and fake breaks
Fewer but higher-quality structure points
false
More signals, more noise
🟦 D. Strong Candle Filter (Optional)
Use strong candle filter on BOS bar?
Defines whether the BOS candle must be strong.
Body / Range >=
Body dominance, recommended 0.6
Range >= ATR *
Expansion requirement
Intraday: 0.8–1.0
Swing: 1.0–1.2
🟦 E. Drawing & Stop-Loss Behavior
Line offset (ATR multiplier)
Distance between structure line and candle wick.
Market Suggested
BTC / ETH 0.1–0.15
Altcoins 0.2–0.3
4. Recommended Presets
🔹 Intraday (15m / 30m)
Trend mode: Auto(EMA144)
Pivot strength: 3
Use wick BOS: true
Must make new high/low: true
Strong candle filter: true
Body/Range: 0.6
ATR multiple: 1.0
Line offset: 0.15
🔹 Swing (1h / 4h)
Trend mode: Auto(EMA144)
Pivot strength: 5–7
Use wick BOS: true
Must make new high/low: true
Strong candle filter: optional
Line offset: 0.2
5. Trading Principle (One Sentence)
Trade with the trend,
place stops beyond the most recent important structure level,
and exit immediately when that structure is broken.

Multi Length Market Structure (BoS + ChoCh)█ OVERVIEW
The "Multi Length Market Structure (BoS + ChoCh)" indicator is a technical analysis tool that identifies key pivot points on the chart and signals market structure breaks (Break of Structure - BoS) and changes in market character (Change of Character - ChoCh). It is designed for traders employing market structure-based strategies, enabling the identification of critical support and resistance levels and potential trend reversal points. The indicator offers flexible pivot length settings, customizable colors, and labels, ensuring clarity and precision on the chart.
█ CONCEPTS
The indicator was developed to simplify the identification of changes in market structure, catering to both short-term and longer-term trading strategies. To this end, it simultaneously displays breakouts for four editable pivot lengths. The lengths represent the delay, measured in the number of candles, after which a pivot is recognized. Pivots with larger values are often turning points on higher timeframes, providing a broader view of the market.
Why are BoS and ChoCh important? A Break of Structure (BoS) indicates trend continuation when the price breaks a key level (e.g., a previous high or low). A Change of Character (ChoCh) signals a potential trend reversal when the price breaks a level in the opposite direction of the prior trend. These signals help traders identify moments when the market changes its dynamics, which is crucial for price action strategies.
█ FEATURES
- Pivot Detection: Identifies pivot points (highs and lows) based on four different pivot lengths (default: 5, 10, 15, 20), enabling market structure analysis with varying sensitivity.
- BoS and ChoCh Signals: Generates Break of Structure (BoS) signals in the form of triangles (green for bullish, red for bearish) and Change of Character (ChoCh) signals when the price breaks a key level in the opposite direction of the prior trend.
- Pivot Labels: Displays labels for highs (HH - Higher High, LH - Lower High) and lows (HL - Higher Low, LL - Lower Low) with the option to select which pivot to display them for.
- Customizable Colors and Styles: Allows configuration of colors for BoS and ChoCh signals and pivot labels.
- Alerts: Built-in alerts for BoS and ChoCh signals for each pivot length, including price and signal type descriptions.
█ HOW TO USE
Adding to the Chart: Add the indicator to your TradingView chart via the Pine Editor or Indicators menu.
Configuring Settings:
- Pivot Lengths: Set four different pivot lengths (Pivot Length 1-4, default: 5, 10, 15, 20) to adjust the sensitivity of pivot detection. Shorter lengths are more sensitive, while longer lengths are more significant. If you want to use only one length, set all pivot lengths to the same value.
- Colors and Styles: Configure colors for BoS signals (green for bullish, red for bearish) and pivot labels.
- Labels: Enable/disable the display of HH/HL/LH/LL labels and choose which pivot to display them for (Pivot 1-4 or none).
- Signals: BoS and ChoCh signals are displayed as triangles (upward for bullish BoS, downward for bearish). Alerts can be configured for each signal type.
Interpreting Signals:
- Bullish BoS Signal: A green triangle below the candle indicates a breakout above a previous high, suggesting bullish trend continuation.
- Bearish BoS Signal: A red triangle above the candle indicates a breakout below a previous low, suggesting bearish trend continuation.
- Bullish ChoCh Signal: A green triangle after breaking a high in a downtrend indicates a potential reversal to bullish.
- Bearish ChoCh Signal: A red triangle after breaking a low in an uptrend indicates a potential reversal to bearish.
- Pivot Levels: Use pivot points as dynamic support and resistance levels. Levels from longer pivots carry greater significance.
Combine signals with other technical analysis tools, such as RSI (to identify overbought/oversold conditions) or MACD (to confirm momentum). Analyze market structure on higher timeframes for stronger signals. Be particularly cautious when entering positions if RSI approaches overbought/oversold zones and divergences appear, as this may indicate a trend change.
█ APPLICATIONS
- Breakout Strategies: Trade based on BoS signals indicating trend continuation. A BoS signal after breaking a high in an uptrend may suggest a strong bullish impulse, especially when supported by a rising MACD.
- Reversal Strategies: ChoCh signals may indicate a potential trend reversal, particularly when confirmed by other indicators, such as RSI divergences or Fibonacci levels.

SMC Market Structure (HH/HL/LH/LL + BOS/CHoCH/MSS)SMC Market Structure (HH/HL/LH/LL + BOS/CHoCH/MSS) is a clean price-action / Smart Money Concepts market structure tool designed to automatically identify and label key structural events on the chart:
Swing structure points: HH, HL, LH, LL
Continuation confirmations: BOS (Break of Structure)
Early reversal warnings: CHoCH (Change of Character)
Stronger reversal signals: MSS (Market Structure Shift) using a displacement filter
The script is built to remain visually tidy: it draws simple horizontal structure lines at the broken swing level and prints small abbreviations (BOS / CHoCH / MSS) directly on the chart without cluttering candles or adding heavy panels.
What the Indicator Detects
1) Swing Points (HH / HL / LH / LL)
Swings are detected using confirmed pivots (left/right “Swing length” bars).
HH (Higher High): a swing high above the previous swing high
LH (Lower High): a swing high below the previous swing high
HL (Higher Low): a swing low above the previous swing low
LL (Lower Low): a swing low below the previous swing low
These labels help define the market’s active structure:
Bullish structure: HH + HL sequence
Bearish structure: LL + LH sequence
Range / consolidation: mixed swing progression
2) BOS (Break of Structure) – Trend Continuation
A BOS prints when price breaks the most recent swing level in the direction of the current structure:
In a bullish market state → break above the most recent swing high
In a bearish market state → break below the most recent swing low
This is typically treated as confirmation that the existing trend is continuing.
3) CHoCH (Change of Character) – Early Reversal Signal
A CHoCH prints on the first break against the current structure:
In a bullish market state → break below the most recent swing low
In a bearish market state → break above the most recent swing high
CHoCH is intended as an early warning that the market may be transitioning into a new directional bias.
4) MSS (Market Structure Shift) – Stronger Reversal via Displacement
MSS is treated as a “strong CHoCH” and requires a decisive, displacement-style candle at the break.
To qualify as MSS, the script requires:
A break against structure with a CLOSE break, and
A displacement candle where:
Candle body > ATR × Displacement Multiplier
This helps filter out shallow wicks or minor liquidity grabs and highlights shifts that show stronger participation and momentum.
How the Indicator Draws on the Chart
When a BOS / CHoCH / MSS occurs:
A horizontal line is drawn from the swing point to the break bar at the broken level.
A small abbreviation label (BOS / CHoCH / MSS) is placed either:
In the middle of the line segment, or
On the break bar (selectable)
Swing labels (HH/HL/LH/LL) are optional and can be disabled for a cleaner “event-only” layout.
Inputs & Settings
Swing Length (Pivot Left/Right)
Controls how sensitive the swing detection is.
Lower values (3–5): more structure points, more signals
Higher values (8–14): fewer, cleaner swings (better for higher timeframes)
Break Confirmation (Wick vs Close)
Wick: break triggers when the candle’s wick crosses the swing level
Close: break triggers only when the candle closes beyond the swing level
Many SMC traders prefer Wick for detecting liquidity runs and early breaks, while others prefer Close to reduce false signals.
MSS Displacement Filter
ATR Length: ATR calculation period
Displacement Multiplier: Minimum body size = ATR × multiplier
Higher multiplier = fewer MSS signals, but stronger quality threshold.
Display Toggles
Show/Hide Swing Labels (HH/HL/LH/LL)
Show/Hide BOS, CHoCH, MSS
Optional EQH/EQL labeling (equal highs/lows)
Visual Controls
Bullish / bearish structure colors
Line width / style
Text offset (in ticks) to keep labels neat above/below level
Maximum structure objects to keep on screen (prevents object-limit issues)
Recommended Usage
Trend Following
Use HH/HL or LL/LH progression to define the trend.
Wait for BOS to confirm continuation.
Use BOS levels as:
Bias confirmation
Potential retest zones
Risk reference for stop placement
Reversal / Shift Detection
Identify prevailing structure (bullish or bearish).
Watch for CHoCH as the first sign of a possible reversal.
Treat MSS as a stronger “shift” event (displacement + close break), often suitable for:
Changing directional bias
Switching from pullback trading to reversal continuation setups
Multi-Timeframe Workflow (Common SMC Method)
Higher timeframe (HTF): use swings and BOS to define macro bias
Lower timeframe (LTF): use CHoCH/MSS to time entries and manage risk
Confirm entries with your preferred tools (order blocks, FVGs, liquidity pools, session timing, etc.)
Notes & Limitations
This script uses confirmed pivots, so swing labels appear only after the swing is fully formed (after Swing length bars). This avoids repainting swing points.
BOS/CHoCH/MSS events are derived from the most recent confirmed swing levels.
MSS requires a close break and displacement threshold even if “Wick” breaks are enabled for other events (by design, to keep MSS strict).
Best Settings by Timeframe (General Guide)
Scalping (1–5m): Swing length 3–5, Wick breaks, MSS multiplier 1.2–1.8
Intraday (15m–1h): Swing length 5–8, Wick or Close, MSS multiplier 1.5–2.0
Swing trading (4h–1D): Swing length 8–14, Close breaks, MSS multiplier 1.8–2.5

HH HL LH LL + BOS / CHoCHHH HL LH LL + BOS / CHoCH Structure Indicator (ATR Adaptive)
This indicator provides a complete market structure framework using swing-based pivots, real-time trend detection, BOS (Break of Structure), CHoCH (Change of Character), and optional ATR-adaptive swing sensitivity.
🔹 Core Features
1. Market Structure Labels
The script detects and labels:
HH – Higher High
LH – Lower High
HL – Higher Low
LL – Lower Low
These labels help visualize trend continuation or weakness in structure.
Each label type can be individually toggled ON/OFF in settings.
2. ATR-Based Adaptive Swing Length (Optional)
Swing pivots can be calculated using:
A fixed manual swing length, or
A dynamic ATR-based swing length that adjusts automatically to volatility.
Increasing volatility → longer swings
Decreasing volatility → tighter swings
This makes structure detection more stable and timeframe-adaptive.
3. Close-Based Break of Structure (BOS)
The indicator identifies a BOS when:
Price closes above the previous swing high (Bullish BOS↑)
Price closes below the previous swing low (Bearish BOS↓)
BOS labels can be turned ON/OFF without affecting internal calculations.
4. CHoCH (Change of Character)
CHoCH is triggered when a BOS occurs against the current trend, indicating a potential trend reversal:
CHoCH↑ – Bearish → Bullish reversal
CHoCH↓ – Bullish → Bearish reversal
CHoCH remains active even when BOS labels are turned off.
5. Alerts
The indicator provides alert conditions for:
CHoCH↑ (Bullish Trend Shift)
CHoCH↓ (Bearish Trend Shift)
This allows traders to automate notifications for significant trend changes.
6. Trend State Tracking
The script internally tracks the current structure-based trend:
Uptrend
Downtrend
Undefined
The trend updates dynamically based on real BOS events.
7. Fully Backwards Compatible
The indicator generates structure, BOS, and CHoCH even when scrolling back deep in chart history, thanks to extended max_bars_back handling.
Summary
This tool provides a complete, flexible, and non-repainting framework for market structure analysis, suitable for:
SMC/ICT traders
Swing & intraday traders
Trend traders
Price action analysts
With adaptive swing detection, clean structure labeling, BOS/CHoCH logic, and alert integration, the indicator helps traders understand market transitions with clarity and precision.

Structural Liquidity Signals [BullByte]Structural Liquidity Signals (SFP, FVG, BOS, AVWAP)
Short description
Detects liquidity sweeps (SFPs) at pivots and PD/W levels, highlights the latest FVG, tracks AVWAP stretch, arms percentile extremes, and triggers after confirmed micro BOS.
Full description
What this tool does
Structural Liquidity Signals shows where price likely tapped liquidity (stop clusters), then waits for structure to actually change before it prints a trigger. It spots:
Liquidity sweeps (SFPs) at recent pivots and at prior day/week highs/lows.
The latest Fair Value Gap (FVG) that often “pulls” price or serves as a reaction zone.
How far price is stretched from two VWAP anchors (one from the latest impulse, one from today’s session), scaled by ATR so it adapts to volatility.
A “percentile” extreme of an internal score. At extremes the script “arms” a setup; it only triggers after a small break of structure (BOS) on a closed bar.
Originality and design rationale, why it’s not “just a mashup”
This is not a mashup for its own sake. It’s a purpose-built flow that links where liquidity is likely to rest with how structure actually changes:
- Liquidity location: We focus on areas where stops commonly cluster—recent pivots and prior day/week highs/lows—then detect sweeps (SFPs) when price wicks beyond and closes back inside.
- Displacement context: We track the last Fair Value Gap (FVG) to account for recent inefficiency that often acts as a magnet or reaction zone.
- Stretch measurement: We anchor VWAP to the latest N-bar impulse and to the Daily session, then normalize stretch by ATR to assess dislocation consistently across assets/timeframes.
- Composite exhaustion: We combine stretch, wick skew, and volume surprise, then bend the result with a tanh transform so extremes are bounded and comparable.
- Dynamic extremes and discipline: Rather than triggering on every sweep, we “arm” at statistical extremes via percent-rank and only fire after a confirmed micro Break of Structure (BOS). This separates “interesting” from “actionable.”
Key concepts
SFP (liquidity sweep): A candle briefly trades beyond a level (where stops sit) and closes back inside. We detect these at:
Pivots (recent swing highs/lows confirmed by “left/right” bars).
Prior Day/Week High/Low (PDH/PDL/PWH/PWL).
FVG (Fair Value Gap): A small 3‑bar gap (bar2 high vs bar1 low, or vice versa). The latest gap often acts like a magnet or reaction zone. We track the most recent Up/Down gap and whether price is inside it.
AVWAP stretch: Distance from an Anchored VWAP divided by ATR (volatility). We use:
Impulse AVWAP: resets on each new N‑bar high/low.
Daily AVWAP: resets each new session.
PR (Percentile Rank): Where the current internal score sits versus its own recent history (0..100). We arm shorts at high PR, longs at low PR.
Micro BOS: A small break of the recent high (for longs) or low (for shorts). This is the “go/no‑go” confirmation.
How the parts work together
Find likely liquidity grabs (SFPs) at pivots and PD/W levels.
Add context from the latest FVG and AVWAP stretch (how far price is from “fair”).
Build a bounded score (so different markets/timeframes are comparable) and compute its percentile (PR).
Arm at extremes (high PR → short candidate; low PR → long candidate).
Only print a trigger after a micro BOS, on a closed bar, with spacing/cooldown rules.
What you see on the chart (legend)
Lines:
Teal line = Impulse AVWAP (resets on new N‑bar extreme).
Aqua line = Daily AVWAP (resets each session).
PDH/PDL/PWH/PWL = prior day/week levels (toggle on/off).
Zones:
Greenish box = latest Up FVG; Reddish box = latest Down FVG.
The shading/border changes after price trades back through it.
SFP labels:
SFP‑P = SFP at Pivot (dotted line marks that pivot’s price).
SFP‑L = SFP at Level (at PDH/PDL/PWH/PWL).
Throttle: To reduce clutter, SFPs are rate‑limited per direction.
Triggers:
Triangle up = long trigger after BOS; triangle down = short trigger after BOS.
Optional badge shows direction and PR at the moment of trigger.
Optional Trigger Zone is an ATR‑sized box around the trigger bar’s close (for visualization only).
Background:
Light green/red shading = a long/short setup is “armed” (not a trigger).
Dashboard (Mini/Pro) — what each item means
PR: Percentile of the internal score (0..100). Near 0 = bullish extreme, near 100 = bearish extreme.
Gauge: Text bar that mirrors PR.
State: Idle, Armed Long (with a countdown), or Armed Short.
Cooldown: Bars remaining before a new setup can arm after a trigger.
Bars Since / Last Px: How long since last trigger and its price.
FVG: Whether price is in the latest Up/Down FVG.
Imp/Day VWAP Dist, PD Dist(ATR): Distance from those references in ATR units.
ATR% (Gate), Trend(HTF): Status of optional regime filters (volatility/trend).
How to use it (step‑by‑step)
Keep the Safety toggles ON (default): triggers/visuals on bar‑close, optional confirmed HTF for trend slope.
Choose timeframe:
Intraday (5m–1h) or Swing (1h–4h). On very fast/thin charts, enable Performance mode and raise spacing/cooldown.
Watch the dashboard:
When PR reaches an extreme and an SFP context is present, the background shades (armed).
Wait for the trigger triangle:
It prints only after a micro BOS on a closed bar and after spacing/cooldown checks.
Use the Trigger Zone box as a visual reference only:
This script never tells you to buy/sell. Apply your own plan for entry, stop, and sizing.
Example:
Bullish: Sweep under PDL (SFP‑L) and reclaim; PR in lower tail arms long; BOS up confirms → long trigger on bar close (ATR-sized trigger zone shown).
Bearish: Sweep above PDH/pivot (SFP‑L/P) and reject; PR in upper tail arms short; BOS down confirms → short trigger on bar close (ATR-sized trigger zone shown).
Settings guide (with “when to adjust”)
Safety & Stability (defaults ON)
Confirm triggers at bar close, Draw visuals at bar close: Keep ON for clean, stable prints.
Use confirmed HTF values: Applies to HTF trend slope only; keeps it from changing until the HTF bar closes.
Performance mode: Turn ON if your chart is busy or laggy.
Core & Context
ATR Length: Bigger = smoother distances; smaller = more reactive.
Impulse AVWAP Anchor: Larger = fewer resets; smaller = resets more often.
Show Daily AVWAP: ON if you want session context.
Use last FVG in logic: ON to include FVG context in arming/score.
Show PDH/PDL/PWH/PWL: ON to see prior day/week levels that often attract sweeps.
Liquidity & Microstructure
Pivot Left/Right: Higher values = stronger/rarer pivots.
Min Wick Ratio (0..1): Higher = only more pronounced SFP wicks qualify.
BOS length: Larger = stricter BOS; smaller = quicker confirmations.
Signal persistence: Keeps SFP context alive for a few bars to avoid flicker.
Signal Gating
Percent‑Rank Lookback: Larger = more stable extremes; smaller = more reactive extremes.
Arm thresholds (qHi/qLo): Move closer to 0.5 to see more arms; move toward 0/1 to see fewer arms.
TTL, Cooldown, Min bars and Min ATR distance: Space out triggers so you’re not reacting to minor noise.
Regime Filters (optional)
ATR percentile gate: Only allow triggers when volatility is at/above a set percentile.
HTF trend gate: Only allow longs when the HTF slope is up (and shorts when it’s down), above a minimum slope.
Visuals & UX
Only show “important” SFPs: Filters pivot SFPs by Volume Z and |Impulse stretch|.
Trigger badges/history and Max badge count: Control label clutter.
Compact labels: Toggle SFP‑P/L vs full names.
Dashboard mode and position; Dark theme.
Reading PR (the built‑in “oscillator”)
PR ~ 0–10: Potential bullish extreme (long side can arm).
PR ~ 90–100: Potential bearish extreme (short side can arm).
Important: “Armed” ≠ “Enter.” A trigger still needs a micro BOS on a closed bar and spacing/cooldown to pass.
Repainting, confirmations, and HTF notes
By default, prints wait for the bar to close; this reduces repaint‑like effects.
Pivot SFPs only appear after the pivot confirms (after the chosen “right” bars).
PD/W levels come from the prior completed candles and do not change intraday.
If you enable confirmed HTF values, the HTF slope will not change until its higher‑timeframe bar completes (safer but slightly delayed).
Performance tips
If labels/zones clutter or the chart lags:
Turn ON Performance mode.
Hide FVG or the Trigger Zone.
Reduce badge history or turn badge history off.
If price scaling looks compressed:
Keep optional “score”/“PR” plots OFF (they overlay price and can affect scaling).
Alerts (neutral)
Structural Liquidity: LONG TRIGGER
Structural Liquidity: SHORT TRIGGER
These fire when a trigger condition is met on a confirmed bar (with defaults).
Limitations and risk
Not every sweep/extreme reverses; false triggers occur, especially on thin markets and low timeframes.
This indicator does not provide entries, exits, or position sizing—use your own plan and risk control.
Educational/informational only; no financial advice.
License and credits
© BullByte - MPL 2.0. Open‑source for learning and research.
Built from repeated observations of how liquidity runs, imbalance (FVG), and distance from “fair” (AVWAPs) combine, and how a small BOS often marks the moment structure actually shifts.

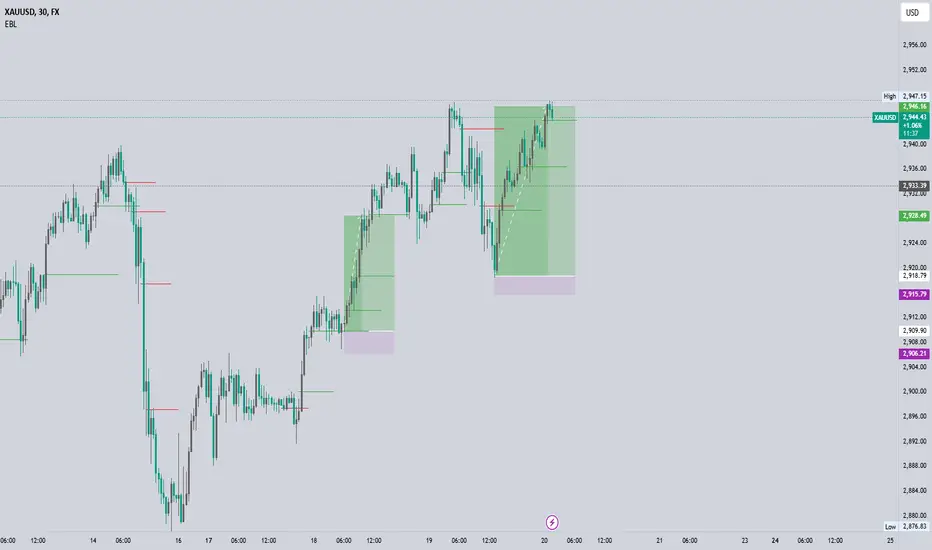
EBL - Enhanced BOS LogicEBL - Enhanced BOS Logic
The EBL (Enhanced Break of Structure Logic) script is a powerful tool for traders who want to identify and act on key structural shifts in the market. By combining visual cues, such as horizontal lines and dynamic arrows, the script highlights critical points of interest where market behavior may indicate significant bullish or bearish momentum.
What Makes EBL Unique?
Break of Structure (BOS) Identification:
The script dynamically detects when price breaks above or below significant highs and lows, marking these levels as key BOS points.
Once a BOS level is confirmed, it is displayed on the chart as a horizontal line, allowing traders to easily identify areas of potential support and resistance.
Real-Time Validation and Invalidations:
Bullish BOS levels remain active until a bearish candle closes below the initiating bullish candle.
Similarly, bearish BOS levels remain active until a bullish candle closes above the initiating bearish candle.
If a BOS level is invalidated, both the corresponding line and its arrow are automatically removed to maintain chart clarity.
Visual Clarity with Arrows and Lines:
Customizable triangle arrows (green for bullish and red for bearish) appear alongside lines to signal entry opportunities.
Traders can adjust line length, colors, and visibility of arrows to fit their charting style.
Alerts for Confirmation:
Receive alerts when bullish or bearish structures are confirmed, ensuring you never miss a signal even when away from your chart.
How the Script Works
Detection of Bullish and Bearish Structures:
The script identifies a "Bullish Break" when the price closes above the high of a bullish candle followed by a bearish one.
A "Bearish Break" is detected when the price closes below the low of a bearish candle followed by a bullish one.
Line and Arrow Placement:
Horizontal lines are drawn at the high or low of the respective BOS level.
Triangular arrows are plotted just below or above the respective levels to indicate potential trade opportunities.
Automatic Cleanup:
When a line is invalidated by opposing market movement, both the line and its connected arrow are automatically removed from the chart.
How to Use EBL
Settings:
Adjust line colors (green for bullish, red for bearish) to suit your charting theme.
Customize arrow visibility or hide lines if you prefer a less cluttered chart.
Set the horizontal line length to match your desired timeframe and analysis depth.
Trading Concepts:
Trend Reversal Zones: Use invalidated BOS levels as signals for possible trend reversals.
Momentum Trading: Follow confirmed BOS levels to identify areas where price momentum is likely to continue.
Dynamic Support and Resistance: Leverage the lines to identify evolving support and resistance zones.
Alerts:
Enable alerts to receive notifications when bullish or bearish trends are confirmed, allowing you to stay informed without constant monitoring.
Conceptual Basis
This script is based on the widely used market structure concept, which is fundamental to price action trading. By tracking the highs and lows created by bullish and bearish movements, the EBL script provides an objective and systematic approach to identifying and trading key structural points in the market.
With the EBL - Enhanced BOS Logic, traders can visually and systematically track market structure, identify potential trade setups, and maintain a cleaner chart with automated line and arrow management. This script is ideal for trend-following, scalping, and swing trading strategies across all markets and timeframes.
Market Structure MTF [HH/HL/LH/LL + CHoCH + BOS]Automatic market structure detection with pivot classification (HH/HL/LH/LL), Change of Character (CHoCH) and Break of Structure (BOS) signals. Multi-timeframe support allows overlaying higher timeframe structure on any chart.
█ OVERVIEW
This indicator automatically detects and classifies pivot points to visualize market structure. It identifies trend direction through the sequence of highs and lows, and signals potential reversals through Change of Character (CHoCH) and trend continuation through Break of Structure (BOS).
█ CONCEPTS
Market structure analysis is based on the relationship between consecutive pivot points:
Bullish Structure:
• HH (Higher High): A swing high that exceeds the previous swing high
• HL (Higher Low): A swing low that stays above the previous swing low
• Sequence: HH → HL → HH → HL confirms uptrend
Bearish Structure:
• LH (Lower High): A swing high that fails to exceed the previous swing high
• LL (Lower Low): A swing low that breaks below the previous swing low
• Sequence: LH → LL → LH → LL confirms downtrend
Structure Shifts:
• CHoCH (Change of Character): Signals when the expected sequence breaks, suggesting potential trend reversal
• BOS (Break of Structure): Confirms trend continuation when price breaks a pivot level in trend direction
█ FEATURES
• Automatic pivot detection using configurable lookback period
• Smart classification comparing each pivot to its predecessor
• CHoCH detection when trend sequence is violated
• BOS signals with anti-repetition filter to reduce noise in consolidation zones
• Multi-Timeframe (MTF) support to display higher timeframe structure
• Horizontal dashed lines marking HTF pivot levels
• Clean visual output with color-coded labels
█ SETTINGS
Structure Settings:
• Pivot Length: Number of bars on each side required to confirm a pivot (default: 5)
- Lower values (2-3) = more sensitive, detects minor swings
- Higher values (10-20) = less sensitive, only major structure
Multi-Timeframe:
• Show HTF Structure: Enable/disable higher timeframe overlay
• HTF Timeframe: Select the higher timeframe to display (D, W, M, etc.)
Visualization:
• Show Local Structure: Toggle visibility of current timeframe pivots
Filters:
• BOS Buffer: Minimum bars between BOS signals to avoid repetition
█ HOW TO USE
The indicator offers three visualization modes:
1. LOCAL STRUCTURE ONLY (default)
├─ Show Local Structure: ✓ Enabled
├─ Show HTF Structure: ✗ Disabled
└─ Use case: Analyze structure on the current timeframe only
2. HIGHER TIMEFRAME ONLY (recommended for clarity)
├─ Show Local Structure: ✗ Disabled
├─ Show HTF Structure: ✓ Enabled
├─ HTF Timeframe: Select desired TF (D, W, M)
└─ Use case: View higher TF context on lower TF charts without clutter
3. BOTH TIMEFRAMES (advanced)
├─ Show Local Structure: ✓ Enabled
├─ Show HTF Structure: ✓ Enabled
└─ Use case: See confluence between timeframes
⚠️ WARNING: This mode can make the chart visually crowded.
Recommended only for experienced users who need both layers simultaneously.
█ RECOMMENDED SETTINGS BY TIMEFRAME
| Chart TF | Pivot Length | Suggested HTF |
|----------|--------------|---------------|
| 1H | 10-15 | 4H or D |
| 4H | 5-10 | D or W |
| 1D | 5-7 | W |
| 1W | 3-5 | M |
The goal is to make pivots on lower timeframes represent equivalent time context.
█ VISUAL REFERENCE
Local Structure Labels:
• 🟩 Green (above): HH - Higher High
• 🟥 Red (above): LH - Lower High
• 🟩 Green (below): HL - Higher Low
• 🟥 Red (below): LL - Lower Low
• 🟧 Orange: CHoCH - Change of Character
• 🟦 Blue: BOS - Break of Structure
HTF Structure Labels:
• 🩵 Teal: HH/HL - Bullish HTF structure
• 🟫 Maroon: LH/LL - Bearish HTF structure
• 🟨 Yellow: CHoCH - HTF trend shift
• 🟦 Navy: BOS - HTF structure break
• ┈┈ Dashed lines mark HTF pivot price levels
█ INTERPRETATION GUIDELINES
Reading the sequence:
• Consistent HH + HL = Bullish bias, look for long opportunities
• Consistent LH + LL = Bearish bias, look for short opportunities
• CHoCH after trending sequence = Potential reversal, exercise caution
• BOS in trend direction = Trend continuation confirmed
Combining timeframes:
• HTF structure defines the primary bias
• Local structure provides entry timing
• Confluence (both TFs aligned) = Higher probability setups
█ LIMITATIONS
• Pivots are confirmed with a delay equal to the Pivot Length parameter
• In ranging markets, multiple CHoCH signals may appear (this is correct behavior - the market IS changing direction frequently)
• CHoCH signals potential reversal, not guaranteed reversal
• Works best on liquid markets with clean price action
█ TECHNICAL NOTES
• Uses ta.pivothigh() and ta.pivotlow() for pivot detection
• request.security() fetches higher timeframe data
• Anti-repetition logic prevents BOS signal clustering in consolidation
• All crossover/crossunder calculations are performed at global scope for consistency (Pine Script v6 compliance)
█ CREDITS
Developed for swing traders and position traders who use market structure for trend analysis and trade timing.
Feedback and suggestions are welcome.

ICT SMC Custom — BOS/MSS + OB + FVGWant me to fill that box? Here’s a ready‑to‑paste description for your publish screen:
⸻
ICT SMC Custom — BOS/MSS + OB + FVG (Crypto‑friendly)
A clean Smart Money Concepts tool that marks Break of Structure (BOS), Market Structure Shift (MSS), Order Blocks (OB), and Fair Value Gaps (FVG) with bold, easy‑to‑see visuals. Built for crypto but works on any market and timeframe.
What it does
• BOS & MSS detection with optional body/wick logic
• Order Blocks: auto‑draws the last opposite candle before a BOS, keeps only the most recent N, and fades when mitigated
• FVGs: 3‑candle gaps with a minimum size filter and a cap on how many to keep
• HTF Swings (optional): plots higher‑timeframe pivot highs/lows for top‑down context
• Alerts for BOS/MSS and FVG formation
Inputs
• Swing pivot length (default 3): sensitivity for structure pivots
• Use candle bodies for breaks: close vs level (on) or wicks (off)
• Show BOS/MSS labels, Show FVG, Show Order Blocks
• Min FVG size (ticks) and Max boxes to keep for FVG/OB
• OB uses candle body: body range vs full wick range
• Show higher timeframe swings + HTF timeframe
• Bullish/Bearish colors
How it works
• BOS triggers when price breaks the last opposite swing.
• MSS flags when the break flips the prior bias.
• OB is the most recent opposite candle prior to BOS; it’s marked and later greyed out once price closes through it (mitigation).
• FVG is detected when candle 1’s high < candle 3’s low (bear) or candle 1’s low > candle 3’s high (bull).
Alerts included
• BOS Up / BOS Down
• MSS Up / MSS Down
• FVG Up / FVG Down
Tips
• Start on 15m/1h for crypto, pivot length 3–5.
• Turn Use candle bodies ON for stricter confirmations, OFF for more signals.
• If boxes look cluttered, lower “Max boxes to keep.”
Note: This is a visual/educational tool, not financial advice. Always confirm with your own plan and risk management.

Support & Resistance External/Internal & BoS [sgbpulse]Market Structure Support & Resistance External/Internal & BoS
Overview: Smart & Fast Market Structure Analysis
The Market Structure "Support & Resistance External/Internal & BoS " indicator is designed to empower your technical analysis by automatically and precisely identifying significant support and resistance levels. It achieves this by pinpointing high and low Pivot Points, plus key Pre-Market High/Low levels.
Its unique strength lies in its dynamic adaptability to any timeframe and any asset you choose. This tool analyzes the relevant market structure for the current timeframe and asset, providing you with accurate and relevant levels in real-time. The indicator maintains a clean chart and swiftly displays all support, resistance, and Pre-Market levels for any asset, saving valuable analysis time and enabling you to get a clear and quick snapshot of the market.
How the Indicator Works
The indicator identifies and displays three critical types of key levels:
External Pivots: These are more significant pivot points, indicating important reversal points across a broader range of price movement, considering the current timeframe. The indicator draws dark green support lines (for low pivots) and dark red resistance lines (for high pivots) from these points.
Internal Pivots: These are shorter-term pivot points, signifying smaller corrections or reversals within the overall structure of the current timeframe. These lines provide additional areas of interest within the ranges of the External Pivots.
Pre-Market High/Low Levels: The indicator displays the High and Low reached during pre-market hours as distinct lines on the chart. Please note: These levels will only appear when the selected timeframe is lower than one day (e.g., 1-hour, 15-minute) and provided that the "Session extended trading hours" option is enabled in your TradingView chart settings. These levels are crucial for identifying potential opening ranges and critical support/resistance areas upon regular market open, especially for intraday trading.
Break of Structure (BoS) Identification
A key feature of this indicator is its ability to identify Break of Structure (BoS). When a support or resistance line is breached, the indicator changes the line's color to gray and displays a "Break of Structure" label, indicating a potential trend change or continuation:
External BoS: When an external support/resistance line is broken, a "BoS" label in red will appear. This is a strong signal for a potential shift in the primary market structure or a strong trend continuation.
Internal BoS: When an internal support/resistance line is broken, an "iBoS" label in green will appear. This indicates a break within the existing market structure, which can be used to confirm direction or identify shorter-term entry/exit opportunities.
Full Indicator Customization
The indicator provides maximum flexibility to suit any trading style and timeframe:
Number of Lines Displayed: You can choose how many support and resistance lines you want to see on your chart. The default is 15 lines, but you can increase or decrease this number according to your needs and desired level of detail.
External Pivot Settings: Define the number of bars before and after a pivot point required for External Pivot identification.
Internal Pivot Settings: Define the number of bars before and after a pivot point required for Internal Pivot identification.
Color Customization: Full control over colors! You can change the colors of the support and resistance lines, the colors of the Pre-Market levels, and also the colors of the BoS and iBoS labels to create a visual appearance that perfectly matches your personal preferences.
This flexibility allows you to adapt the indicator to your trading style and any timeframe you operate in, without needing to manually change settings each time.
Recommended Uses
Clean Chart & Quick Analysis: The indicator displays important levels clearly, enabling quick identification of areas of interest without visual clutter on the chart. This significantly saves analysis time and allows you to make faster decisions.
Critical Levels for Any Timeframe & Asset: Get precise and adaptive support and resistance, plus essential Pre-Market levels (in relevant timeframes), for any timeframe and on any asset you choose.
Trend Direction Identification: Clear support and resistance lines help understand market structure.
Breakout Confirmation: The BoS label provides visual confirmation of key level breaches, helping to confirm potential trend changes.
Locating Entry & Exit Points: Use these levels as potential areas of interest for trades, after confirming a breakout or reversal.
Finding Stop-Loss & Take-Profit Points: Strategically place protective stops and profit targets around these support and resistance levels.
Important Note
Like any technical indicator, Market Structure "Support & Resistance External/Internal & BoS " is a supplementary tool. It's highly recommended to use it in conjunction with additional analysis methods (such as price action analysis, other indicators, and fundamental analysis) for informed trading decisions. Financial markets are dynamic, and trading always carries inherent risk.

Enhanced BOS Strategy with SL/TP and EMA TableDescription:
The Enhanced BOS (Break of Structure) Strategy is an advanced open-source trading indicator designed to identify key market structure changes, integrated with dynamic Stop Loss (SL) and Take Profit (TP) levels, along with an informative EMA (Exponential Moving Average) table for added trend analysis.
Key Features:
Break of Structure (BOS) Detection:
The script detects bullish and bearish BOS by identifying pivot points using a custom pivot period. When the price crosses above or below these points, it signals a potential market trend reversal or continuation.
Dynamic SL/TP Levels:
Users can toggle static SL/TP settings, which automatically calculate levels based on user-defined points. These levels are visualized on the chart with dotted lines and labeled for clarity.
Volume Filters:
The strategy includes a volume condition filter to ensure that only trades within a specified volume range are considered. This helps in avoiding low-volume trades that might lead to false signals.
EMA Table Display:
An on-chart table displaying the current values of the 13-period, 50-period, and 200-period EMAs. This provides a quick reference for trend identification and confirmation, helping traders to stay aligned with the broader market trend.
How It Works:
The script utilizes a combination of moving averages and pivot points to identify potential breakouts or breakdowns in market structure. When a bullish BOS is detected, and the volume conditions are met, the strategy suggests a long position, marking potential SL/TP levels. Similarly, it suggests short positions for bearish BOS.
The EMA table serves as a visual aid, providing real-time updates of the EMA values, allowing traders to gauge the market’s directional bias quickly.
How to Use:
Setting Parameters:
Adjust the pivot period to fine-tune BOS detection according to your trading style and the asset’s volatility.
Configure the SL/TP settings based on your risk tolerance and target profit levels.
Interpreting Signals:
A “Buy” label on the chart indicates a bullish BOS with volume confirmation, signaling a potential long entry.
A “Sell” label indicates a bearish BOS with volume confirmation, signaling a potential short entry.
The EMA table aids in confirming these signals, where the position of the fast, mid, and slow EMAs can provide additional context to the trend’s strength and direction.
Volume Filtering:
Ensure your trades are filtered through the script’s volume condition, which allows for the exclusion of low-volume periods that might generate unreliable signals.
Unique Value:
Unlike many other BOS strategies, this script integrates volume conditions and a visual EMA table, providing a comprehensive toolkit for traders looking to capture market structure shifts while maintaining an eye on trend direction and trade execution precision.
Additional Information:
This script is designed for use on standard bar or candlestick charts for best results.
It is open-source and free to use, encouraging collaboration and improvement by the TradingView community.
By combining powerful trend-following EMAs with the precision of BOS detection and the safety of volume filtering, the Enhanced BOS Strategy offers a balanced approach to trading market structure changes.

Golden BOS Strategy - ChecklistA clean, mechanical on-chart checklist designed for multi-timeframe traders using the Golden BOS / Institutional Retracement Framework.
This tool helps you stay disciplined by tracking each requirement of the strategy in real time:
Included Criteria
4H Bias: Bullish or bearish macro structure
1H Structure: Push/pull phase + golden zone retracement
5M Entry Model:
Break of Structure (BOS)
5M golden zone retracement
POI validation (OB/FVG/Breaker)
Final micro BOS or rejection confirmation
Risk Filters:
Session validity (London / NY)
Red news avoidance
Stop-loss placement check
Liquidity-based target confirmation
Purpose
This overlay ensures every trade meets strict criteria before execution, removing emotion and improvisation. Ideal for backtesting, forward testing, and staying consistent during live market conditions.
Golden BOS Strategy — Description
The Golden BOS Strategy is a structured, multi-timeframe trading system designed to capture high-probability continuation moves during London and New York sessions. The strategy combines institutional concepts with Fibonacci-based retracements to identify discounted entry zones aligned with higher-timeframe direction.
Using the 4H timeframe, traders establish the daily macro bias and identify the dominant trend. The 1H chart is then used to confirm the current phase of market structure, distinguishing between impulsive “push” moves and corrective “pullback” phases. A Fibonacci retracement is applied to the most recent 1H impulse leg to define a high-value discount or premium zone where entries become valid.
Execution takes place on the 5-minute chart. Once price reaches the 1H golden zone (61.8–78.6%), a Break of Structure (BOS) is required to confirm a shift in short-term momentum. A second Fibonacci retracement is then drawn on the 5M impulse leg that caused the BOS, and price must retrace back into the 5M golden zone. Traders refine their entry using a confluence point of interest (POI) such as a Fair Value Gap (FVG), Order Block, Breaker Block, or Inverse FVG, ideally accompanied by a final micro BOS or rejection candle.
Risk management is strict and rule-driven. Stop loss is placed beyond the extreme wick of the POI, while take-profit targets are set at logical liquidity pools in the direction of the higher-timeframe trend. The strategy avoids red-folder news and only allows trades during active sessions to ensure optimal volatility and reliability.
The Golden BOS Strategy is designed to impose discipline, reduce discretionary errors, and give traders a repeatable, mechanical framework for navigating trending markets with precision.

Liquidity Sweep + BOS Retest System — Prop Firm Edition🟦 Liquidity Sweep + BOS Retest System — Prop Firm Edition
A High-Probability Smart Money Strategy Built for NQ, ES, and Funding Accounts
🚀 Overview
The Liquidity Sweep + BOS Retest System (Prop Firm Edition) is a precision-engineered SMC strategy built specifically for prop firm traders. It mirrors institutional liquidity behavior and combines it with strict account-safe entry rules to help traders pass and maintain funding accounts with consistency.
Unlike typical indicators, this system waits for three confirmations — liquidity sweep, displacement, and a clean retest — before executing any trade. Every component is optimized for low drawdown, high R:R, and prop-firm-approved risk management.
Whether you’re trading Apex, TakeProfitTrader, FFF, or OneUp Trader, this system gives you a powerful mechanical framework that keeps you within rules while identifying the market’s highest-probability reversal zones.
🔥 Key Features
1. Liquidity Sweep Detection (Stop Hunt Logic)
Automatically identifies when price clears a previous swing high/low with a sweep confirmation candle.
✔ Filters noise
✔ Eliminates early entries
✔ Locks onto true liquidity grabs
2. Automatic Break of Structure (BOS) Confirmation
Price must show true displacement by breaking structure opposite the sweep direction.
✔ Confirms momentum shift
✔ Removes fake reversals
✔ Ensures institutional intent
3. Precision Retest Entry Model
The strategy enters only when price retests the BOS level at premium/discount pricing.
✔ Zero chasing
✔ Extremely tight stop loss placement
✔ Prop-firm-friendly controlled risk
4. Built-In Risk & Trade Management
SL set at swept liquidity
TP set by user-defined R:R multiplier
Optional session filter (NY Open by default)
One trade at a time (no pyramiding)
Automatically resets logic after each trade
This prevents overtrading — the #1 cause of evaluation and account breaches.
5. Designed for Prop Firm Futures Trading
This script is optimized for:
Trailing/static drawdown accounts
Micro contract precision
Funding evaluations
Low-risk, high-probability setups
Structured, rule-based execution
It reduces randomness and emotional trading by automating the highest-quality SMC sequence.
🎯 The Trading Model Behind the System
Step 1 — Liquidity Sweep
Price must take out a recent high/low and close back inside structure.
This confirms stop-hunting behavior and marks the beginning of a potential reversal.
Step 2 — BOS (Break of Structure)
Price must break the opposite side swing with a displacement candle. This validates a directional shift.
Step 3 — Retest Entry
The system waits for price to retrace into the BOS level and signal continuation.
This creates optimal R:R entry with minimal drawdown.
📈 Best Markets
NQ (NASDAQ Futures) – Highly recommended
ES, YM, RTY
Gold (XAUUSD)
FX majors
Crypto (with high volatility)
Works best on 1m, 2m, 5m, or 15m depending on your trading style.
🧠 Why Traders Love This System
✔ No signals until all confirmations align
✔ Reduces overtrading and emotional decisions
✔ Follows market structure instead of random indicators
✔ Perfect for maintaining long-term funded accounts
✔ Built around institutional-grade concepts
✔ Makes your trading consistent, calm, and rules-based
⚙️ Recommended Settings
Session: 06:30–08:00 MST (NY Open)
R:R: 1.5R – 3R
Contracts: Start with 1–2 micros
Markets: NQ for best structure & volume
📦 What’s Included
Complete strategy logic
All plots, labels, sweep markers & BOS alerts
BOS retest entry automation
Session filtering
Stop loss & take profit system
Full SMC logic pipeline
🏁 Summary
The Liquidity Sweep + BOS Retest System is a complete, prop-firm-ready, structure-based strategy that automates one of the cleanest and most reliable SMC entry models. It is designed to keep you safe, consistent, and rule-compliant while capturing premium institutional setups.
If you want to trade with confidence, discipline, and prop-firm precision — this system is for you.
Good Luck -BG

EBL - Enigma BOS Logic Select Higher Time FrameThe "EBL – Enigma BOS Logic" is a unique multi-timeframe trading indicator designed for traders who rely on structured price action and key level retests to find high-probability trade opportunities. This indicator automates the identification of significant price levels on a higher timeframe, plots them across all lower timeframes, and provides actionable signals (buy/sell) when price retests those levels. It is ideal for traders who focus on lower timeframes for precise entries while using higher timeframe structure for trend confirmation.
How the Indicator Works
Key Level Detection:
The indicator allows the user to select a key level timeframe (e.g., 1H, 4H, Daily, Weekly). It then identifies Break of Structure (BOS) levels on the selected timeframe.
When a bullish-to-bearish or bearish-to-bullish reversal is detected on the selected timeframe, the corresponding high or low of the reversal candle is stored as a key level.
These key levels are plotted as horizontal lines on all lower timeframes, helping the trader visualize critical support and resistance zones across multiple timeframes.
Retest Confirmation:
Once a key level is established, the indicator continuously monitors the price action on lower timeframes.
If the price touches or crosses a key level, it is considered a retest, and an alert is generated.
The indicator plots a retest marker (customizable as a circle or diamond) at the exact price level where the retest occurred, providing a clear visual cue for the trader.
Trading Signals:
When a retest is detected, a table is displayed on the chart with the following information:
The trading pair.
The signal direction (Buy/Sell).
The price at which the retest occurred.
This table gives traders instant insight into actionable opportunities, making it easier to focus on live market conditions without missing critical retests.
Key Features
Multi-Timeframe Analysis: The indicator focuses on a higher timeframe selected by the user, ensuring that only the most relevant key levels are plotted for lower timeframe trading.
Dynamic Retest Signals: It dynamically identifies when price retests a key level and provides both visual markers and real-time alerts.
Customizable Retest Markers: Users can customize the retest marker's shape (circle/diamond) and color to suit their preferences.
Signal Table: A built-in table displays clear buy or sell signals when retests occur, ensuring that traders have all the necessary information at a glance.
Alerts: The indicator supports real-time alerts for retests, helping traders stay informed even when they are not actively monitoring the chart.
How to Use the Indicator
Select a Key Level Timeframe:
In the input settings, choose a higher timeframe (e.g., 4H or Daily) to define key levels.
The indicator will calculate Break of Structure (BOS) levels on the selected timeframe and plot them as horizontal lines across all lower timeframes.
Monitor Lower Timeframes for Retests:
Switch to a lower timeframe (e.g., 15m, 5m) to wait for price to approach the key levels plotted by the indicator.
When a retest occurs, observe the signal table and retest marker for actionable trade signals.
Act on Buy/Sell Signals:
Use the information provided by the signal table to make trading decisions.
For a buy signal, wait for bullish confirmation (e.g., price holding above the retested level).
For a sell signal, wait for bearish confirmation (e.g., price holding below the retested level).
Trading Concepts and Underlying Logic
The indicator is based on the Break of Structure (BOS) concept, a core principle in price action trading. BOS levels represent points where the market shifts its trend direction, making them critical zones for potential reversals or continuations.
By focusing on higher timeframe BOS levels, the indicator helps traders align their lower timeframe entries with the overall market trend.
The concept of retests is used to confirm the validity of a key level. A retest occurs when the price returns to a previously identified BOS level, offering a high-probability entry point.
Use Cases
Scalping: Traders who prefer lower timeframe scalping can use the indicator to align their trades with higher timeframe key levels, increasing the likelihood of successful trades.
Swing Trading: Swing traders can use the indicator to identify key reversal zones on higher timeframes and plan their trades accordingly.
Intraday Trading: Intraday traders can benefit from the real-time alerts and signals generated by the indicator, ensuring they never miss critical retests during active trading hours.
Conclusion
The "EBL – Enigma BOS Logic" is a powerful tool for traders who want to enhance their price action trading by focusing on key levels and retests across multiple timeframes. By automating the identification of BOS levels and providing clear retest signals, it helps traders make more informed and confident trading decisions. Whether you are a scalper, intraday trader, or swing trader, this indicator offers valuable insights to improve your trading performance.

FTR Rules BoS/ChoCh MarkupThis indicator marks Break of Structure (BoS) and Change of Character (ChoCh) in the price structure on your charts. It runs on any timeframe. This indicator is useful for determining if you are seeing a trend change in the market or if you are only seeing a pullback with the market continuing in the direction of the trend. The indicator will look for price to break the previous BoS line or ChoCh line to mark a new BoS. When a BoS line is broken, it will then look for the lowest or highest pullback (depending on which way the market is trending) between to 2 BoS lines to mark the ChoCh line. When the ChoCh line is broken, it will mark that line as BoS and the previous BoS line will become ChoCh.
What makes this indicator unique from other BoS and ChoCh indicators is that it follows specific rules used by the FTR Trading group. The main difference is that the ChoCh line isn't changed to a BoS line from only a candle wick break. You will need a candle body break to move your BoS line to ChoCh. If a candle wick breaks your ChoCh line, you simply extend the ChoCh line to the new high or low of the wick. There are smaller differences that are proprietary to the FTR strategy.

Market Structure Report Library [TradingFinder]🔵 Introduction
Market Structure is one of the most fundamental concepts in Price Action and Smart Money theory. In simple terms, it represents how price moves between highs and lows and reveals which phase of the market cycle we are currently in uptrend, downtrend, or transition.
Each structure in the market is formed by a combination of Breaks of Structure (BoS) and Changes of Character (CHoCH) :
BoS occurs when the market breaks a previous high or low, confirming the continuation of the current trend.
CHoCH occurs when price breaks in the opposite direction for the first time, signaling a potential trend reversal.
Since price movement is inherently fractal, market structure can be analyzed on two distinct levels :
Major / External Structure: represents the dominant macro trend.
Minor / Internal Structure: represents corrective or smaller-scale movements within the larger trend.
🔵 Library Purpose
The “Market Structure Report Library” is designed to automatically detect the current market structure type in real time.
Without drawing or displaying any visuals, it analyzes raw price data and returns a series of logical and textual outputs (Return Values) that describe the current structural state of the market.
It provides the following information :
Trend Type :
External Trend (Major): Up Trend, Down Trend, No Trend
Internal Trend (Minor): Up Trend, Down Trend, No Trend
Structure Type :
BoS : Confirms trend continuation
CHoCH : Indicates a potential trend reversal
Consecutive BoS Counter : Measures trend strength on both Major and Minor levels.
Candle Type : Returns the current candle’s condition(Bullish, Bearish, Doji)
This library is specifically designed for use in Smart Money–based screeners, indicators, and algorithmic strategies.
It can analyze multiple symbols and timeframes simultaneously and return the exact structure type (BoS or CHoCH) and trend direction for each.
🔵 Function Outputs
The function MS() processes the price data and returns seven key outputs,
each representing a distinct structural state of the market. These values can be used in indicators, strategies, or multi-symbol screeners.
🟣 ExternalTrend
Type : string
Description : Represents the direction of the Major (External) market structure.
Possible values :
Up Trend
Down Trend
No Trend
This is determined based on the behavior of Major Pivots (swing highs/lows).
🟣 InternalTrend
Type : string
Description : Represents the direction of the Minor (Internal) market structure.
Possible values :
Up Trend
Down Trend
No Trend
🟣 M_State
Type : string
Description : Specifies the type of the latest Major Structure event.
Possible values :
BoS
CHoCH
🟣 m_State
Type : string
Description : Specifies the type of the latest Minor Structure event.
Possible values :
BoS
CHoCH
🟣 MBoS_Counter
Type : integer
Description : Counts the number of consecutive structural breaks (BoS) in the Major structure.
Useful for evaluating trend strength :
Increasing count: indicates trend continuation.
Reset to zero: typically occurs after a CHoCH.
🟣 mBoS_Counter
Type : integer
Description : Counts the number of consecutive structural breaks in the Minor structure.
Helps analyze the micro structure of the market on lower timeframes.
Higher value : strong internal trend.
Reset : indicates a minor pullback or reversal.
🟣 Candle_Type
Type : string
Description : Represents the type of the current candle.
Possible values :
Bullish
Bearish
Doji
import TFlab/Market_Structure_Report_Library_TradingFinder/1 as MSS
PP = input.int (5 , 'Market Structure Pivot Period' , group = 'Symbol 1' )
= MSS.MS(PP)

Minor Break of Structure (Minor BoS)This indicator extracts and isolates the Minor Break of Structure (BoS) logic from a full SMC framework and presents it as a clean, lightweight tool for structure-based price action traders.
Unlike traditional BOS indicators that rely on swing calculations with heavy filtering, this script uses original SMC-style minor structure logic to detect meaningful shifts in internal order flow.
A Minor BoS appears when price breaks above a minor swing high (bullish) or below a minor swing low (bearish), confirming a short-term continuation in trend direction.
Features:
Bullish Minor BoS detection
Bearish Minor BoS detection
Automatic line plotting with extend-right
Clear “Minor BoS” label with tiny footprint
Customizable line styles and colors
Lightweight & optimized for fast execution
Zero repainting on BoS confirmations
This tool is ideal for traders who want a simple, clean, and reliable structure-based signal without the noise of major structure, order blocks, liquidity sweeps, or external SMC modules.

Market Structure (BOS on Break, HH/HL/LH/LL)Market Structure (BOS on Break, HH/HL/LH/LL) is a clean and reactive market structure tool designed for traders who want clear visual feedback of trend direction and structure changes.
It automatically identifies:
Higher Highs (HH)
Higher Lows (HL)
Lower Highs (LH)
Lower Lows (LL)
Breaks of Structure (BOS) when price breaches previous swing levels.
✳️ Features
Automatic Structure Detection: Detects swing highs/lows based on your left/right pivot settings.
Break of Structure Alerts: Instantly updates bias when price breaks a previous swing level (no delay).
Real-Time BOS Response: Structure flips as soon as price takes out the previous high or low.
Color-Coded Bars: Bars can auto-paint white for bullish and black for bearish conditions.
Optional Fading Dots: Visual fading dots track trend duration and strength for quick bias reading.
Customizable Pivots: Choose how many bars to use for left/right swing confirmation.
Alerts: Fully configured for HH, HL, LH, LL, BOS Up, and BOS Down events.
⚙️ Inputs
Left Pivot Bars / Right Pivot Bars: Control how many candles define a valid swing point.
Paint Bars by Trend: Toggle bar coloring to match bullish or bearish bias.
Show Fading Trend Dots: Add fading dots that shrink and fade as a trend matures.
🔔 Alerts
Break of Structure Up / Down
Higher High (HH) confirmed
Higher Low (HL) confirmed
Lower High (LH) confirmed
Lower Low (LL) confirmed
🎯 Use Case
Perfect for:
Price action traders
Smart money concept (SMC) practitioners
Trend structure analysts
Scalpers and swing traders looking for quick structure flips.
🧠 Notes
Works on any timeframe and any instrument.
BOS signals update immediately when price breaks structure (no lag).
For additional BOS markers, you can uncomment the last few lines in the script to show arrows when structure breaks.

Order Block with BoSHere’s a professional and concise description you can use for publishing your **TradingView script** titled **"Order Block with BoS"**:
---
### 📌 **Description for TradingView Publication:**
**"Order Block with Break of Structure (BoS)"** is a powerful price action-based indicator designed to identify potential reversal zones and momentum shifts using **Order Block** detection combined with **Break of Structure (BoS)** confirmation.
### 🔍 **Key Features:**
* **Order Block Detection**: Highlights bullish and bearish order blocks using precise candle structure logic.
* **Break of Structure (BoS)**: Confirms structural breaks above swing highs or below swing lows to validate potential trend continuation or reversal.
* **Dynamic ATR Filter**: Uses a 14-period ATR with dynamic thresholds to confirm significant moves, filtering out weak breakouts.
* **Visual Aids**:
* Color-coded **boxes** to mark detected Order Blocks.
* **Arrows** at BoS confirmation points when ATR confirms strong momentum.
* Optional **dashed BoS lines** to show where price broke structure.
### ⚙️ **Customizable Inputs**:
* `Swing Length`: Defines the sensitivity of swing high/low detection.
* `Show Break of Structure`: Toggle on/off BoS confirmation lines.
* `Candle Lookback`: Number of historical candles to consider.
This indicator is ideal for traders who incorporate **smart money concepts**, **market structure analysis**, or **institutional order flow** strategies.
---
Would you like me to help write the **strategy** version of this or translate the description into another language for international audiences?
