Correlated ATR Bands | AdulariHow do I use it?
Never use this indicator as standalone trading signal, it should be used as confluence.
It is highly recommended to use this indicator on the 15m timeframe and above, try experimenting with the inverse feature and multipliers as well.
When the price is above the moving average this shows the bullish trend is strong.
When the price is below the moving average this shows the bearish trend is strong.
When the moving average is purple, the trend is bullish , when it is gray, the trend is bearish.
When price is above the upper band this may indicate a bearish reversal.
When price is below the lower band this may indicate a bullish reversal.
Features:
Purple line for bullish trend and gray line for bearish trend.
Custom formula combining an ATR and Hull MA to clearly indicate trend strength and direction.
Unique approach to moving averages and bands by taking the average of 2 types of MA's combined with custom ATR's, then multiplying these by correlation factors.
Bands to indicate possible trend reversals when price crosses them.
How does it work?
1 — ATR value is calculated, then the correlation between the source and ATR is calculated.
2 — Final value is calculated using the following formula:
correlation * atr + (1 - correlation) * nz(atr , atr)
3 — Moving average is calculated with the following formula:
ta.hma((1-(correlation/100*(1+weight/10)))*(ta.sma(source+value, smoothing)+ta.sma(source-value,smoothing))/2,flength)
4 — Bands calculation using multipliers.
Cari skrip untuk "ATR"

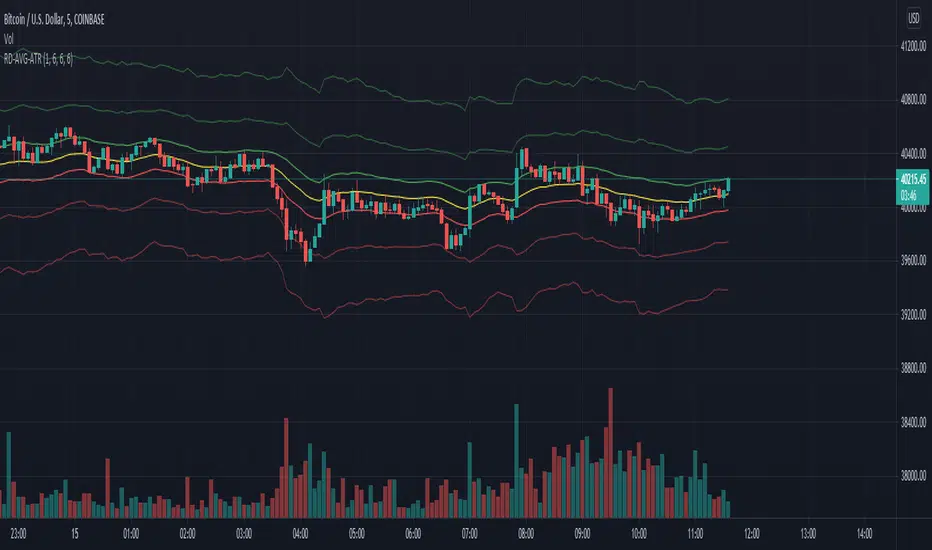
Adaptive ATR Keltner Channels [Loxx]Adaptive ATR Channels are adaptive Keltner channels. ATR is calculated using a rolling signal-to-noise ratio making this indicator flex more to changes in price volatility than the fixed Keltner Channels.
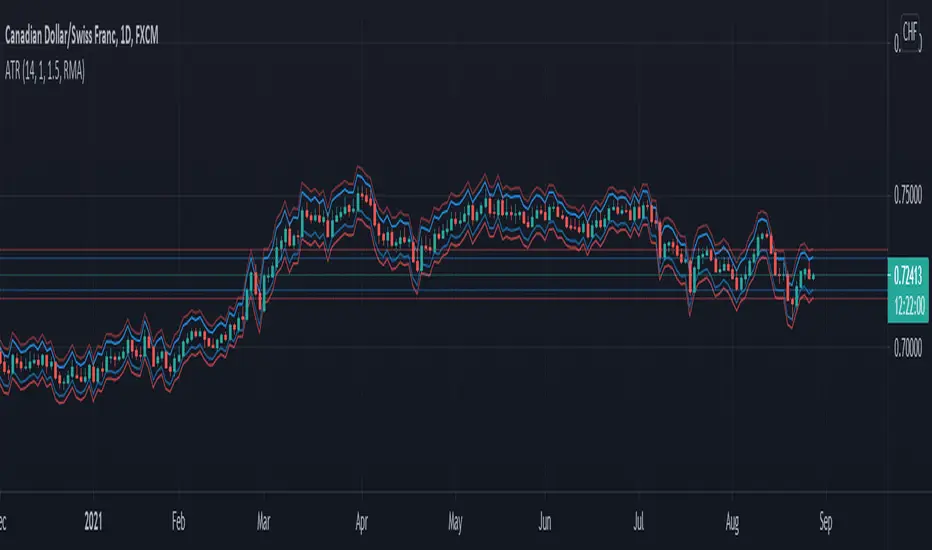
What is Average True Range (ATR)?
The average true range (ATR) is a technical analysis indicator, introduced by market technician J. Welles Wilder Jr. in his book New Concepts in Technical Trading Systems, that measures market volatility by decomposing the entire range of an asset price for that period.1
The true range is taken as the greatest of the following: current high less the current low; the absolute value of the current high less the previous close; and the absolute value of the current low less the previous close. The ATR is then a moving average, generally using 14 days, of the true ranges.
What are Keltner Channel (ATR)?
Keltner Channels are volatility-based bands that are placed on either side of an asset's price and can aid in determining the direction of a trend.
The Keltner channel uses the average-true range (ATR) or volatility, with breaks above or below the top and bottom barriers signaling a continuation.

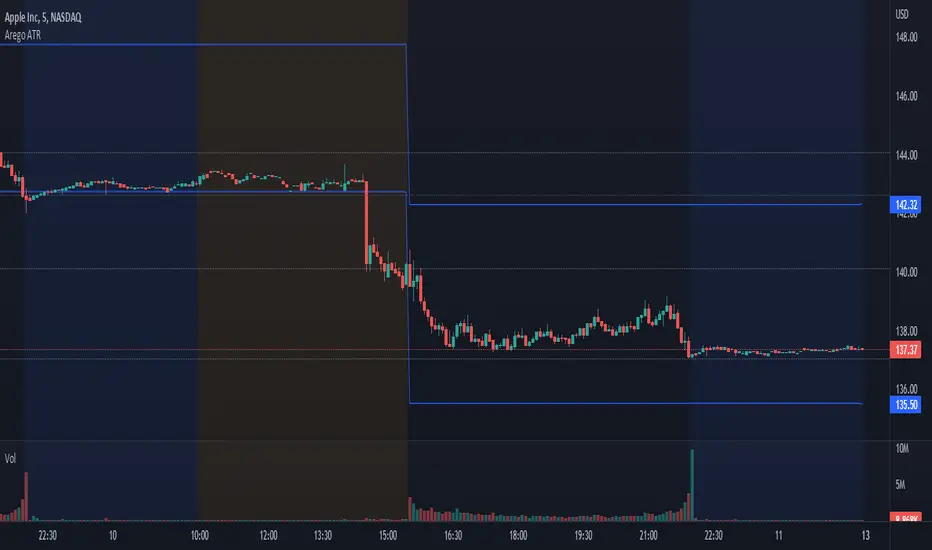
Arego ATRThis script automatically calculates ATR on a daily basis where it would be highest and lowest and draws a line there.
With this you can see whether stock has passed the ATR or not.
When stock moves, line is adjusted as well. For example, the stock opened at $100 and moved down $1.
ATR is $5.
Script will then draw two lines on the chart.
Daily low ATR would then be $95 and daily high ATR would then be $104.
The formula is very simple:
Current price + ATR = daily high
Current price - ATR = daily low
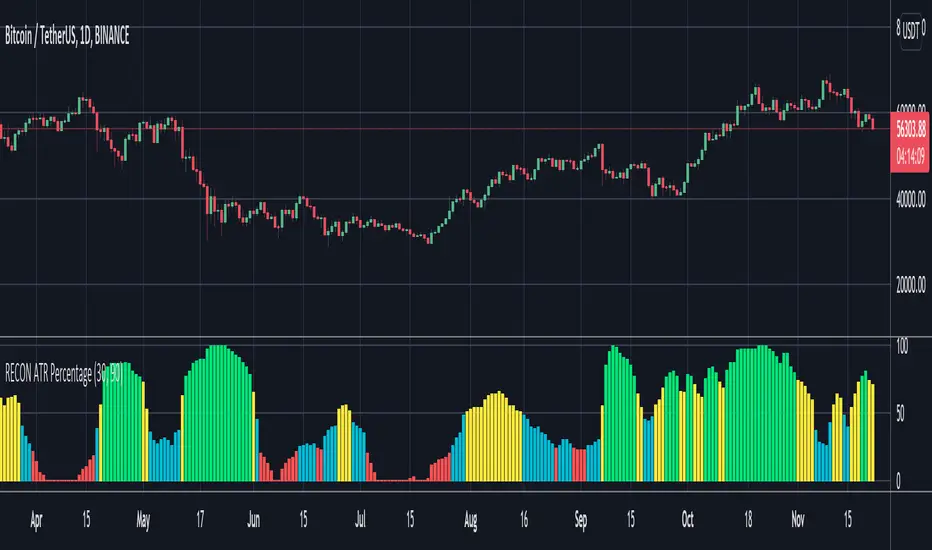
RECON ATR Volatility PercentageThe original Average True Range (ATR) indicator is a technical analysis indicator designed to measure volatility. The higher the ATR the higher the volatility.
The RECON ATR Volatility Percentage indicator calculates the Average True Range (ATR) as a percentage.
Suggested chart timeframes: 1h, 4h and 1D seem to produce the most useful intel but can be used on lower timeframes as well.
The Recon ATR Volatility Percentage can be utilized for identifying trading pairs with a desired amount of volatility, for example deploying a grid trading strategy on pairs that are trending up with a high amount of volatility (say over 50%) might produce desirable results.
It is important to note the ATR does not indicate price direction and can be high in both a rising or falling market.
The ATR Length, Period Look Back Length parameters as well as the color of the columns can be configured per your specifications.
NNFX ATRBefore I begin I want to mention:
1. This is an indicator specially made for NNFX traders who use the ATR rule of ATR1x for Take Profit and ATR1.5x for Stop Loss
2. It is a product of combining the in-built ATR and Dillon Grech's ATR ()
The indicator:
1. It can be used for a quick look using the lines to see instead of calculating whether price hit a TP or SL. However I have kept the Main ATR for those who want to record the ATR into the spreadsheet when back testing or forward testing
2. When placing a buy/long order, TP is blue and appears above price, SL is red and appears below price
3. When placing a sell/short order, TP is blue and appears below price, SL is red and appears above price
4. The Main ATR, which is yellow, is way below price because I didn't want the chart to be overwhelmed by a 5th line in the middle of 2 TPs and SLs aka make the chart look claustrophobic
RexDog Average with ATRBam-- look what Rex did. A RexDog Average with ATR bands-- he's going insane. Simple but powerful.
This indicator includes the RexDog average but provides you with the ability to plot (and customize) both above and below ATR calculated bands.
With this indicator you can display all 3 or any combination of the bands: the RexDog Avg, Adding ATR Upper or the Subtracting ATR Below.
To remove a plot or customize color and line size go to the style options.
Before we get detailed with this version you can customize the default average factor of the RexDog Avg (default is 6). More tips on this below.
How This Works
Just as with the RexDog Average we take the 6 ATR data points (200, 100, 50, 24, 9, 5). We then create an average by dividing by 6. But wait there's more...
With this indicator you can customize independently the above and below bands via a float value for precision. 6 is the default (you can customize by increments at 0.25 or input value you like 1-20).
Now this works opposite how you might think but you'll get it once you start changing the numbers. For instance, editing the above band lowering the ATR factor will raise the band.
RexDog Avg Factor
With this release you are able to change the default average factor (6) to anything you want. You'll find though going too high or low from the default won't get the best results. The default increment change is 0.1 but you can enter any float value you like between 1-20.
The Original RexDog Average Overview
Yes, simple—the RexDog Average is a bias moving average indicator. The purpose is to provide the overall momentum bias you should have when trading an instrument. It works across all markets and all timeframes.
Usage:
Price above the RexDog AVG = long momentum bias
Price below the RexDog AVG = short momentum bias
With the ATR addition most likely your usage will be similar to Bollinger Bands. While not the same as in deviations much of the same principles might apply, especially with customization.
*Note: we have banned the word “trend” in the RexDog Trading Method.
Additional Usage Advice:
If price rips through the average your momentum bias should probably change. 80% of the time when price moves through the RexDog Average it will come back and test the area around average within 1-2 bars. 20% of the time it does not. The momentum is so strong in that direction so look for a 50-70% tests of the bar that impulse through the RexDog Average.
If you are using the RexDog Trading Method by default if the price is above the average and you are short you are in a fade trade. The momentum trade would be long. Of course reverse if price is below.
On multiple time frames. Of course, one timeframe can be long bias and a lower timeframe can be short bias. Which one do you use? Both—if your in a short trade using lower timeframe and with the bias of the average your in a momentum trade—but on the higher timeframe your aware you are essential fading the overall momentum.
Background:
Rex and I searched high and low for one simple thing. A moving average (or combination of some) that we could use to form our momentum bias that worked for all timeframes and all markets we trade.
We tried and tested them all. Even went down the path of ribbons and various other types of hybrid EMA /MA derivatives. Nothing had a high enough accuracy or mathematically was reliable that we could say with a high probability that it was on the right side of the momentum.
We almost stopped and landed on using the true and tested 200 MA—but we found through extensive tests that using the 200MA or EMA you’re often late to the party. Look you don’t need to be the first one in the trade but having a heads up sure helps.
To quote one of the best financial movies of the modern era—Margin Call:
“There are three ways to make a living in this business: be first, be smarter, or cheat… it sure is a hell of a lot easier to be first”. The RexDog Average used properly enables you to be first or damn near close.
Under the Hood:
This is so simple most reading this will discount it. You might even scoff and berate Rex for wasting your time. But you would be wrong. The RexDog Average has been tested across all markets—FOREX, Crypto, Equities, Futures (even tick charts), and even the Penguin population in Antarctica.
The RexDog Average is an average of 6 simple moving averages: 200, 100, 50, 24, 9, 5.
Yes, that’s it.
ATR RangeATR Range is a minimal, clean volatility context indicator designed to show how much of the Daily and Weekly ATR has already been used — without cluttering your chart.
Instead of plotting multiple lines or tables, this indicator displays two simple, highly-informative lines:
• Day Range (X) is Y% of ATR (Z)
• Week Range (X) is Y% of ATR (Z)
These lines update intraday and give you immediate awareness of whether price has already made an average move or still has room to expand.
⸻
🔍 What It Shows
• Daily range vs Daily ATR
• Weekly range vs Weekly ATR
• Percentage of ATR already consumed
⸻
🎯 Why This Is Useful
• Helps avoid chasing extended moves
• Adds volatility context to entries and exits
• Ideal for futures, options, and index trading

ATR Trailing StopATR Trailing Stop (Dynamic Volatility Regimes)
==============================================
This indicator implements an adaptive ATR-based trailing stop for long positions. The stop automatically adjusts based on stock volatility, tightening during fast movements and widening during calm periods. It is designed as a trade management tool to help protect profits while staying aligned with strong trends.
How It Works
------------
* Tracks the highest high over a configurable lookback window and ensures this “top” never moves downward.
* Computes the trailing stop as:**Top – ATR × Dynamic Multiplier**
* The ATR multiplier changes depending on volatility:
* Low volatility → Wide stop (slower trailing)
* Medium volatility → Standard trailing
* High volatility → Tight stop (faster trailing)
* The trailing stop only moves upward; it never decreases.
* If price falls significantly below the stop (default: 5%), the system resets and begins trailing from a new top.
* An optional price-scale label displays:
* Current stop value
* Volatility regime (LOW / MID / HIGH)
* ATR percentage and active multiplier
Alerts
------
Two alert conditions are included:
### Trailing Stop – Near
Triggers when price moves within a user-defined percentage above the stop.
### Trailing Stop – Hit
Triggers when price touches or closes below the stop.
How to Use
----------
1. Add the indicator to any chart (daily timeframe recommended).
2. Configure:
* ATR length
* Lookback bars
* Volatility thresholds
* ATR multipliers
3. Set alerts for early warnings or stop-hit events.
4. Use the stop line as a dynamic risk-management tool to guide exit decisions and protect profits.
Notes
-----
* Designed for long-only trailing logic.
* This indicator does not generate entry signals; it is intended for stop management.

Đại Ka 3 ATR BandsĐại Ka 3 ATR Bands – The ultimate single-slot indicator that replaces three separate ATR plots.
Designed specifically for ICT/SMC traders in 2025:
• Light red band (±0.5 ATR) → fake moves, Judas Swing, Turtle Soup zone
• Gray band (±1.0 ATR) → normal price action
• Light green band (±2.0 ATR) → real displacement zone → Silver Bullet, SFT, high-probability entries
How to use:
– Price stuck inside red band → expect reversal/fakeout
– Price breaks and closes outside green band + volume spike → enter aggressively in that direction (85%+ win-rate inside Killzones)
Default ATR(14), subtle fills for instant visual filtering of real vs fake moves.
Perfect companion for Order Blocks, FVG, Breaker Blocks and NY/London Killzones.
Free forever – coded with love by Đại Ka & Vietnamese ICT crew.

Exponential Moving Average + ATR MTF [YSFX]Description:
This indicator is a reupload of a previously published EMA + ATR tool, updated and enhanced after a house rule violation to provide additional features and a cleaner, more versatile experience for traders.
It combines trend analysis and volatility measurement into one intuitive tool, allowing traders to visualize market direction, dynamic support and resistance, and adaptive risk levels—all in a clean, minimal interface.
The indicator calculates a customizable moving average (MA) type—EMA, SMA, WMA, HMA, RMA, DEMA, TEMA, VWMA, LSMA, or KAMA—and surrounds it with ATR-based bands that expand and contract with market volatility. This creates a dynamic envelope around price, helping traders identify potential breakouts, pullbacks, or high-probability entry/exit zones.
Advanced Features:
Multiple MA types: Supports all major moving averages, including advanced options like KAMA, DEMA, and TEMA.
KAMA customization: Adjustable fast and slow lengths for precise tuning.
Dual timeframe support: Optionally use separate timeframes for the MA and ATR, or a global timeframe for both.
Dynamic ATR bands: Automatically adjust to market volatility, useful for setting adaptive stop-loss levels.
Optional fill: Shade the area between upper and lower ATR bands for a clear visual representation of volatility.
Flexible for all markets: Works across any timeframe or asset class.
Who It’s For:
This indicator is ideal for trend-following traders, swing traders, and volatility-focused analysts who want to:
Confirm trend direction while accounting for volatility
Identify high-probability trade entries and exits
Implement dynamic, ATR-based stop-loss strategies
Keep charts clean and uncluttered while still capturing key market information
This reuploaded version ensures compliance with platform rules while offering enhanced flexibility and clarity for modern trading workflows.

ATR Spike KienthogoATR Spike Kienthogo
This indicator, titled "ATR Spike Kienthogo", is designed to visualize volatility spikes in the market by comparing the current Average True Range (ATR) against a dynamic threshold. The threshold is calculated as an EMA-smoothed ATR multiplied by a user-defined factor. When the current ATR exceeds this threshold, the indicator highlights it as a spike event, further classified by price direction (up or down).
The script features:
Configurable ATR smoothing methods: RMA, SMA, EMA, WMA.
Customizable spike detection threshold via spike_multiple.
Conditional color plotting of ATR:
Spike + Price Up → Green
Spike + Price Down → Red
Non-spike → User-defined neutral color, adaptive to candle direction (greenish for bullish candles, reddish for bearish candles).
This script is especially useful for:
Detecting volatility expansions.
Enhancing entry/exit timing during strong directional moves.
Confirming breakout strength or trap signals in low-volatility regimes.
The logic maintains clean separation between spike vs. non-spike conditions and offers full control over color coding for better visual integration in multi-indicator environments.

ATR, ADX, RSI TableATR, ADX & RSI Dashboard (Color-Coded)
Overview
This indicator provides a clean, all-in-one dashboard that displays the current values for three of the most popular technical indicators: Average True Range (ATR), Average Directional Index (ADX), and Relative Strength Index (RSI).
To make analysis faster and more intuitive, the values in the table are dynamically color-coded based on key thresholds. This allows you to get an immediate visual summary of market volatility, trend strength, and momentum without cluttering your main chart area.
Features
The indicator displays a simple table in the bottom-right corner of your chart with the following color logic:
ATR (Volatility): Measures the average volatility of an asset.
Green: Low Volatility (ATR is less than 3% of the current price).
Orange: Moderate Volatility (ATR is between 3% and 5%).
Red: High Volatility (ATR is greater than 5%).
ADX (Trend Strength): Measures the strength of the underlying trend, regardless of its direction.
Red: Weak or Non-Trending Market (ADX is below 20).
Orange: Developing or Neutral Trend (ADX is between 20 and 25).
Green: Strong Trend (ADX is above 25).
RSI (Momentum): Measures the speed and change of price movements to identify overbought or oversold conditions.
Green: Potentially Oversold (RSI is below 40).
Orange: Neutral/Normal Conditions (RSI is between 40 and 70).
Red: Potentially Overbought (RSI is above 70).
How to Use
This tool is perfect for traders who want a quick, at-a-glance understanding of the current market state. Instead of analyzing three separate indicators, you can use this dashboard to:
Quickly confirm if a strong trend is present before entering a trade.
Assess volatility to adjust your stop-loss and take-profit levels.
Instantly spot potential overbought or oversold conditions.
Customization
All input lengths for the ATR, ADX, and RSI are fully customizable in the indicator's settings menu, allowing you to tailor the calculations to your specific trading style and timeframe.

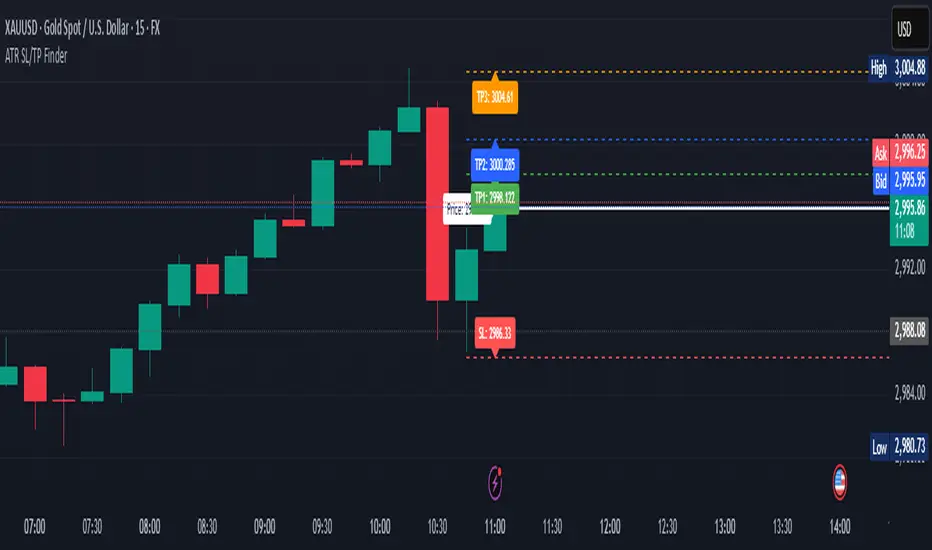
ATR Stop Loss & 3 TP FinderATR Stop Loss & 3 TP Finder - By SeehraSingh
This indicator is designed to help traders automate Stop Loss (SL) and Take Profit (TP) placement based on the Average True Range (ATR). It dynamically calculates:
Stop Loss (SL): Set based on a user-defined ATR multiplier.
Three Take Profit (TP) levels: Configurable ATR multipliers for TP1, TP2, and TP3.
Customizable Price Sources: Allows traders to choose different price sources (Open, High, Low, Close, HL2, HLC3, OHLC4, HLCC4) for both SL and TP calculations.
Visual Representation: Plots dashed lines for Entry, SL, TP1, TP2, and TP3.
Table Display: Provides an easy-to-read table at the bottom showing SL, TP1, TP2, and TP3 values.
How It Works:
Select ATR length and smoothing type (RMA, SMA, EMA, WMA).
Set ATR multipliers for SL and TP levels.
Choose the price source for SL and TP calculations.
The indicator automatically plots entry, SL, and three TP levels on the chart.
Ideal For:
Traders who use ATR-based dynamic Stop Loss and Take Profit strategies.
Those who want to avoid fixed SL/TP placements and prefer volatility-based risk management.
Scalpers, Swing Traders, and Position Traders looking for automated SL/TP visualization.
Disclaimer
⚠️ Trading involves risk. This indicator is for educational purposes only and should not be considered financial advice. Always conduct your own analysis before entering any trade. The author is not responsible for any financial losses incurred while using this tool. Past performance does not guarantee future results.
Daily True Range (DTR) vs Average True Range (ATR)Overview
The "DTR vs ATR with Color-Coded Percentage" indicator is a powerful volatility analysis tool designed for traders who want to understand daily price movements in the context of historical volatility. It calculates the Daily True Range (DTR)—the raw measure of a single day’s volatility—and compares it to the Average True Range (ATR), which smooths volatility over a user-defined period (default 14 days). The indicator presents this data in an intuitive table, featuring a color-coded percentage that visually represents how the current day’s move (DTR) stacks up against the average volatility (ATR). This helps traders quickly assess whether the current day’s price action is unusually volatile, average, or subdued relative to recent history.
Purpose
Volatility Comparison: Visualize how the current day’s price range (DTR) relates to the average range (ATR) over a specified period.
Decision Support: Identify days with exceptional movement (e.g., breakouts or reversals) versus normal or quiet days, aiding in trade entry/exit decisions.
Risk Management: Gauge daily volatility to adjust position sizing or stop-loss levels based on whether the market is exceeding or falling short of typical movement.
Features
Daily True Range (DTR) Calculation:
Computes the True Range for the current day as the greatest of:
Current day’s High - Low
High - Previous Close
Low - Previous Close
Aggregates data on any timeframe to ensure accurate daily values.
Average True Range (ATR):
Calculates the smoothed average of DTR over a customizable period (default 14 days) using Wilder’s smoothing method.
Updates in real-time as the day progresses.
Timeframe Flexibility: Works on any chart timeframe (e.g., 1-minute, 1-hour) while always calculating DTR and ATR based on daily data.
Color-Coded Display in either compact or table mode
The percentage value is color-coded in the table based on configurable thresholds:
Safe (default 75): Normal range, within typical volatility
Warning: (default 75-125): Above-average volatility.
Danger (default 125): Exceptionally high volatility

Double Supertrend Entry with ADX Filter and ATR Exits/EntriesThe Double Supertrend Entry with ADX Filter and ATR Exits/Entries indicator is a custom trading strategy designed to help traders identify potential buy and sell signals in trending markets. This indicator combines the strengths of multiple technical analysis tools, enhancing the effectiveness of the overall strategy.
Key features:
Two Supertrend Indicators - The indicator includes two Supertrend indicators with customizable parameters. These trend-following indicators calculate upper and lower trendlines based on the ATR and price. Buy signals are generated when the price crosses above both trendlines, and sell signals are generated when the price crosses below both trendlines.
ADX Filter - The Average Directional Index (ADX) is used to filter out weak trends and only generate buy/sell signals when the market exhibits a strong trend. The ADX measures the strength of the trend, and a customizable threshold level ensures that trades are only entered during strong trends.
ATR-based Exits and Entries - The indicator uses the Average True Range (ATR) to set profit target and stop-loss levels. ATR is a measure of market volatility, and these levels help traders determine when to exit a trade to secure profit or minimize loss.
Performance Statistics Table - A table is displayed on the chart, recording and showing the total number of winning trades, losing trades, percentage of profitable trades, average profit, and average loss. This information helps traders evaluate the performance of the strategy over time.
The Double Supertrend Entry with ADX Filter and ATR Exits/Entries indicator is a powerful trend-following strategy that can assist traders in making more informed decisions in the financial markets. By combining multiple technical analysis tools and providing performance statistics, this indicator helps traders improve their trading strategy and evaluate its success.

Correlated ATR MA | AdulariHow do I use it?
Never use this indicator as standalone trading signal, it should be used as confluence.
When the price is above the moving average this shows the bullish trend is strong.
When the price is below the moving average this shows the bearish trend is strong.
When the moving average is purple, the trend is bullish, when it is gray, the trend is bearish.
Features:
Purple line for bullish trend and gray line for bearish trend.
Custom formula combining an ATR and Hull MA to clearly indicate trend strength and direction.
Unique approach to moving averages by taking the average of 3 types of MA's combined with custom ATR's.
How does it work?
1 — ATR value is calculated, then the correlation between the source and ATR is calculated.
2 — Signal value is calculated from the difference between the previous source and ATR values.
3 — Final value is being calculated using the following formula:
cor * target + (1 - cor) * nz(atr , target)
4 — Moving average is calculated by getting the average of 3 values: a normal HMA, HMA plus final value, and HMA minus final value.

Session Lines + ATR AnalyticsDescription:
Overview:
A comprehensive trading tool that combines session visualization with real-time ATR analytics. Perfect for intraday traders who need precise timing and volatility measurements.
Features:
Session Markers
Visual indicators for Asia (00:00-08:00), London (07:00-15:00), and New York (13:00-21:00) trading sessions
Color-coded session bands at the bottom of the chart for quick identification
Fully customizable session times and colors
Hourly Vertical Lines
Automatic vertical lines drawn at the start of each hour (works on 1-minute charts)
Multiple line styles available: solid, dotted, dashed, arrows
Adjustable color and width settings
Helps identify exact timing of price movements
ATR Tool
Real-time candle range measurement
Modified ATR calculation (excludes current candle for accuracy)
Customizable ATR length and multiplier
Live countdown timer showing time remaining in current timeframe
Floating label with adjustable offset and styling
Date & Timeframe Display
Bottom-right watermark showing current date in LA timezone
Displays current timeframe with proper units (1m, 5m, 1H, etc.)
Useful for backtesting to confirm you're viewing the correct date
Best Used For:
Day trading and scalping (especially on 1-minute charts)
Session-based trading strategies
Volatility analysis using ATR
Time-based entry and exit planning
Settings:
All elements are fully customizable through the indicator settings panel, including colors, sizes, visibility toggles, and calculation parameters.

Combined: Net Volume, RSI & ATR# Combined: Net Volume, RSI & ATR Indicator
## Overview
This custom TradingView indicator overlays **Net Volume** and **RSI (Relative Strength Index)** on the same chart panel, with RSI scaled to match the visual range of volume spikes. It also displays **ATR (Average True Range)** values in a table.
## Key Features
### Net Volume
- Calculates buying vs selling pressure by analyzing lower timeframe data
- Displays as a **yellow line** centered around zero
- Automatically selects optimal timeframe or allows manual override
- Shows net buying pressure (positive values) and selling pressure (negative values)
### RSI (Relative Strength Index)
- Traditional 14-period RSI displayed as a **blue line**
- **Overlays directly on the volume chart** - scaled to match volume spike heights
- Includes **70/30 overbought/oversold levels** (shown as dotted red/green lines)
- Adjustable scale factor to fine-tune visual sizing relative to volume
- Optional **smoothing** with multiple moving average types (SMA, EMA, RMA, WMA, VWMA)
- Optional **Bollinger Bands** around RSI smoothing line
- **Divergence detection** - identifies regular bullish/bearish divergences with labels
### ATR (Average True Range)
- Displays current ATR value in a **table at top-right corner**
- Configurable period length (default: 50)
- Multiple smoothing methods: RMA, SMA, EMA, or WMA
- Helps assess current market volatility
## Use Cases
- **Momentum & Volume Confirmation**: See if RSI trends align with net volume flows
- **Divergence Trading**: Automatically spots when price makes new highs/lows but RSI doesn't
- **Volatility Assessment**: Monitor ATR for position sizing and stop-loss placement
- **Overbought/Oversold + Volume**: Identify exhaustion when RSI hits extremes with volume spikes
## Customization
All components can be toggled on/off independently. RSI scale factor allows you to adjust how prominent the RSI line appears relative to volume bars.

ATR Daniel# ATR Daniel - Indicator Description
## 🇬🇧 ENGLISH VERSION
### ATR Daniel - Smart Trailing Stop Manager
**ATR Daniel** is an intelligent trailing stop indicator that automatically adapts to your trading style and the asset you're trading.
#### Key Features:
**🎯 3 Trading Modes:**
- **Swing Trading** - For position trading with wider stops
- **Intraday** - For day trading with balanced parameters
- **Scalping** - For quick trades with tight stops
**📊 Automatic Asset Detection:**
The indicator automatically recognizes 3 major assets and applies optimized parameters:
- **XAUUSD (Gold)** - Lower volatility settings
- **BTCUSDT (Bitcoin)** - Medium volatility settings
- **NAS100USD (Nasdaq 100)** - Higher volatility settings
**🔧 Flexible Configuration:**
- **Auto Mode**: Applies optimal parameters based on detected asset and selected trading mode
- **Manual Mode**: Customize ATR length and multiplier to your preferences
- **Customizable Colors**: Choose your own line color
- **ON/OFF Display**: Toggle line visibility as needed
**📈 Visual Display:**
- Dynamic trailing stop line that follows price action
- Color changes based on trend direction (bullish/bearish)
- Real-time info table showing:
- Current asset
- Trading mode
- ATR value
- Stop loss distance
- Recommended SL price
- Current trend direction
- Signal arrows at trend reversals (optional)
**💡 How It Works:**
The indicator uses ATR (Average True Range) to calculate dynamic stop loss levels that adapt to market volatility. The trailing stop follows the price in trending markets while protecting your position.
**Perfect for:**
- Traders who want automated stop loss management
- Multi-asset traders (Gold, Bitcoin, Nasdaq)
- All trading styles (Swing, Intraday, Scalping)
---

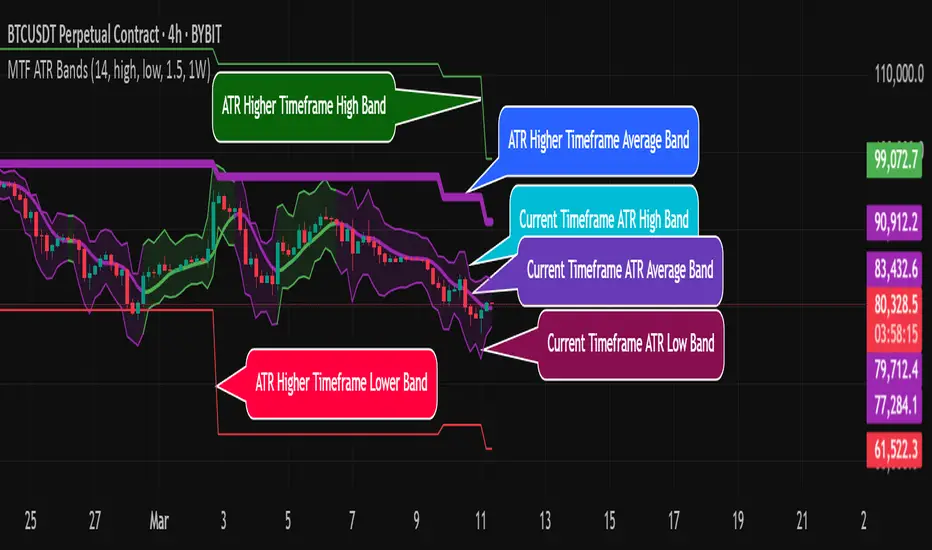
MTF ATR BandsA simple but effective MTF ATR bands indicator.
The script calculate and display ATR bands low and high of the current timeframe using high, low inputs and an RMA moving average, adding to it ATR of the period multiplied with the user multiplier, default is set to 1.5.
Than is calculated a smoothed average of the range and the color of it based on its slope, same color is used to fill the atr bands.
Than the higher timeframe bands are calculated and displayed on the chart.
How can be used ?
The higher timeframe average and bands can give you long term direction of the trend and the current timeframes moving average and filling short term trend, for example using the 15 min chart with a 4h HTF bands, or an 1h with a daily, or a daily with an weekly or weekly with bi-monthly atr bands.
Also can be used as a stop loss indicator.
Hope you will like it, any question send me a PM.
Volatility ATR Support and Resistance Bands [Quantigenics]Volatility ATR Support and Resistance Bands
The “Volatility ATR Support and Resistance Bands” is a trend visualization tool that uses Average True Range (ATR) to create a dynamic channel around price action, adapting to changes in volatility and offering clear trend indicators. The band direction can indicate trend and the lines can indicate support and resistance levels.
The script works by calculating a series of moving averages from the highest and lowest prices, then applies an ATR-based multiplier to generate a set of bands. These bands expand and contract with the market’s volatility, providing a visual guide to the strength and potential direction of price movements.
How to Trade with Volatility ATR Band:
Identify Trend Direction: When the bands slope upwards, the market is trending upwards, which may be a good opportunity to consider a long position. When the bands slope downward, the market is trending downwards, which could be a sign to sell or short.
Volatility Awareness: The wider the bands, the higher the market volatility. Narrow bands suggest a quieter market, which might indicate consolidation or a potential breakout/breakdown.
Confirm Entries and Exits: Use the bands as dynamic support and resistance; entering trades as the price bounces off the bands and considering exits as it reaches the opposite side or breaches the bands.
Hope you enjoy this script!
Happy trading!

The Flash-Strategy (Momentum-RSI, EMA-crossover, ATR)The Flash-Strategy (Momentum-RSI, EMA-crossover, ATR)
Are you tired of manually analyzing charts and trying to find profitable trading opportunities? Look no further! Our algorithmic trading strategy, "Flash," is here to simplify your trading process and maximize your profits.
Flash is an advanced trading algorithm that combines three powerful indicators to generate highly selective and accurate trading signals. The Momentum-RSI, Super-Trend Analysis and EMA-Strategy indicators are used to identify the strength and direction of the underlying trend.
The Momentum-RSI signals the strength of the trend and only generates trading signals in confirmed upward or downward trends. The Super-Trend Analysis confirms the trend direction and generates signals when the price breaks through the super-trend line. The EMA-Strategy is used as a qualifier for the generation of trading signals, where buy signals are generated when the EMA crosses relevant trend lines.
Flash is highly selective, as it only generates trading signals when all three indicators align. This ensures that only the highest probability trades are taken, resulting in maximum profits.
Our trading strategy also comes with two profit management options. Option 1 uses the so-called supertrend-indicator which uses the dynamic ATR as a key input, while option 2 applies pre-defined, fixed SL and TP levels.
The settings for each indicator can be customized, allowing you to adjust the length, limit value, factor, and source value to suit your preferences. You can also set the time period in which you want to run the backtest and how many dollar trades you want to open in each position for fully automated trading.
Choose your preferred trade direction and stop-loss/take-profit settings, and let Flash do the rest. Say goodbye to manual chart analysis and hello to consistent profits with Flash. Try it now!
General Comments
This Flash Strategy has been developed in cooperation between Baby_whale_to_moon and JS-TechTrading. Cudos to Baby_whale_to_moon for doing a great job in transforming sophisticated trading ideas into pine scripts.
Detailed Description
The “Flash” script considers the following indicators for the generation of trading signals:
1. Momentum-RSI
2. ‘Super-Trend’-Analysis
3. EMA-Strategy
1. Momentum-RSI
• This indicator signals the strength of the underlying upward- or downward-trend.
• The signal range of this indicator is from 0 to 100. Values > 60 indicate a confirmed upward- or downward-trend.
• The strategy will only generate trading signals in case the stock (or any other financial security) is in a confirmed upward- (long entry signals) or downward-trend (short entry signals).
• This indicator provides information with regards to the strength of the underlying trend and it does not give any insight with regard to the direction of the trend. Therefore, this strategy also considers other indicators which provide technical confirmation with regards to the direction of the underlying trend.
Graph 1 shows this concept:
• The Momentum-RSI indicator gives lower readings during consolidation phases and no trading signals are generated during these periods.
Example (graph 2):
2. Super-Trend Analysis
• The red line in the graph below represents the so-called super-trend-line. Trading signals are only generated in case the price action breaks through this super-trend-line indicating a new confirmed upward-trend (or downward-trend, respectively).
• If that happens, the super trend-line changes its color from red to green, giving confirmation that the trend changed from bearish to bullish and long-entries can be considered.
• The vice-versa approach can be considered for short entries.
Graph 3 explains this concept:
3. Exponential Moving Average / EMA-Strategy
The functionality of this EMA-element of the strategy has been programmed as follows:
• The exponential moving average and two other trend lines are being used as qualifiers for the generation of trading-signals.
• Buy-signals for long-entries are only considered in case the EMA (yellow line in the graph below) crosses the red line.
• Sell-signals for short-entries are only considered in case the EMA (yellow line in the graph below) crosses the green line.
An example is shown in graph 4 below:
We use this indicator to determine the new trend direction that may occur by using the data of the price's past movement.
4. Bringing it all together
This section describes in detail, how this strategy combines the Momentum-RSI, the super-trend analysis and the EMA-strategy.
The strategy only generates trading-signals in case all of the following conditions and qualifiers are being met:
1. Momentum-RSI is higher than the set value of this strategy. The standard and recommended value is 60 (graph 5):
2. The super-trend analysis needs to indicate a confirmed upward-trend (for long-entry signals) or a confirmed downward-trend (for short-entry signals), respectively.
3. The EMA-strategy needs to indicate that the stock or financial security is in a confirmed upward-trend (long-entries) or downward-trend (short-entries), respectively.
The strategy will only generate trading signals if all three qualifiers are being met. This makes this strategy highly selective and is the key secret for its success.
Example for Long-Entry (graph 6):
When these conditions are met, our Long position is opened.
Example for Short-Entry (graph 7):
Trade Management Options (graph 8)
Option 1
In this dynamic version, the so-called supertrend-indicator is being used for the trade exit management. This supertrend-indicator is a sophisticated and optimized methodology which uses the dynamic ATR as one of its key input parameters.
The following settings of the supertrend-indicator can be changed and optimized (graph 9):
The dynamic SL/TP-lines of the supertrend-indicator are shown in the charts. The ATR-length and the supertrend-factor result in a multiplier value which can be used to fine-tune and optimize this strategy based on the financial security, timeframe and overall market environment.
Option 2 (graph 10):
Option 2 applies pre-defined, fixed SL and TP levels which will appear as straight horizontal lines in the chart.
Settings options (graph 11):
The following settings can be changed for the three elements of this strategy:
1. (Length Mom-Rsi): Length of our Mom-RSI indicator.
2. Mom-RSI Limit Val: the higher this number, the more momentum of the underlying trend is required before the strategy will start creating trading signals.
3. The length and factor values of the super trend indicator can be adjusted:ATR Length SuperTrend and Factor Super Trend
4. You can set the source value used by the ema trend indicator to determine the ema line: Source Ema Ind
5. You can set the EMA length and the percentage value to follow the price: Length Ema Ind and Percent Ema Ind
6. The backtesting period can be adjusted: Start and End time of BackTest
7. Dollar cost per position: this is relevant for 100% fully automated trading.
8. Trade direction can be adjusted: LONG, SHORT or BOTH
9. As we explained above, we can determine our stop-loss and take-profit levels dynamically or statically. (Version 1 or Version 2 )
Display options on the charts graph 12):
1. Show horizontal lines for the Stop-Loss and Take-profit levels on the charts.
2. Display relevant Trend Lines, including color setting options for the supertrend functionality. In the example below, green lines indicate a confirmed uptrend, red lines indicate a confirmed downtrend.
Other comments
• This indicator has been optimized to be applied for 1 hour-charts. However, the underlying principles of this strategy are supply and demand in the financial markets and the strategy can be applied to all timeframes. Daytraders can use the 1min- or 5min charts, swing-traders can use the daily charts.
• This strategy has been designed to identify the most promising, highest probability entries and trades for each stock or other financial security.
• The combination of the qualifiers results in a highly selective strategy which only considers the most promising swing-trading entries. As a result, you will normally only find a low number of trades for each stock or other financial security per year in case you apply this strategy for the daily charts. Shorter timeframes will result in a higher number of trades / year.
• Consequently, traders need to apply this strategy for a full watchlist rather than just one financial security.

Ladder ATRThis indicator shows the upwards (green) and downward (red) volatility of the market. It is a moving average of the true range values like the ATR indicator does but with a twist! For the upwards volatility, only the green candles are taken into account, and for the downwards only the red candles are.
To the best of my knowledge, this technique had been introduced by HeWhoMustNotBeNamed in his "Supertrend - Ladder ATR" publication where the different types of volatility helped to improve the "trend reversal" conditions compared to the "Supertrend" indicator.
However, the actual "Ladder ATR" values were hard to see. This indicator shows the actual upward and downward volatility making it easy to reason about long and short price moves and potential biases in each direction.
In layman's terms this indicator "Ladder ATR" is to the "Supertrend - Ladder ATR" what the "Average True Range" indicator is to the "Supertrend" indicator.
