itradesize /\ Silver Bullet x Macro x KillzoneThis indicator shows the best way to annotate ICT Killzones, Silver Bullet and Macro times on the chart. With the help of a new pane, it will not distract your chart and will not cause any distractions to your eye, or brain but you can see when will they happen.
The indicator also draws everything beforehand when a proper new day starts.
You can customize them how you want to show up.
Collapsed or full view?
You can hide any of them and keep only the ones you would like to.
All the colors can be customized, texts & sizes or just use shortened texts and you are also able to hide those drawings which are older than the actual day.
You should minimize the pane where the script has been automatically drawn to therefore you will have the best experience and not show any distractions.
The script automatically shows the time-based boxes, based on the New York timezone.
Killzone Time windows ( for indices ):
London KZ 02:00 - 05:00
New York AM KZ 07:00 - 10:00
New York PM KZ 13:30 - 16:00
Silver Bullet times:
03:00 - 04:00
10:00 - 11:00
14:00 - 15:00
Macro times:
02:33 - 03:00
04:03 - 04:30
08:50 - 0910
09:50 - 10:10
10:50 - 11:10
11:50 - 12:50
Cari skrip untuk "A股市场较发行价上涨最多的10个股票"

[imba]lance algo🟩 INTRODUCTION
Hello, everyone!
Please take the time to review this description and source code to utilize this script to its fullest potential.
🟩 CONCEPTS
This is a trend indicator. The trend is the 0.5 fibonacci level for a certain period of time.
A trend change occurs when at least one candle closes above the level of 0.236 (for long) or below 0.786 (for short). Also it has massive amout of settings and features more about this below.
With good settings, the indicator works great on any market and any time frame!
A distinctive feature of this indicator is its backtest panel. With which you can dynamically view the results of setting up a strategy such as profit, what the deposit size is, etc.
Please note that the profit is indicated as a percentage of the initial deposit. It is also worth considering that all profit calculations are based on the risk % setting.
🟩 FEATURES
First, I want to show you what you see on the chart. And I’ll show you everything closer and in more detail.
1. Position
2. Statistic panel
3. Backtest panel
Indicator settings:
Let's go in order:
1. Strategies
This setting is responsible for loading saved strategies. There are only two preset settings, MANUAL and UNIVERSAL. If you choose any strategy other than MANUAL, then changing the settings for take profits, stop loss, sensitivity will not bring any results.
You can also save your customized strategies, this is discussed in a separate paragraph “🟩HOW TO SAVE A STRATEGY”
2. Sensitive
Responsible for the time period in bars to create Fibonacci levels
3. Start calculating date
This is the time to start backtesting strategies
4. Position group
Show checkbox - is responsible for displaying positions
Fill checkbox - is responsible for filling positions with background
Risk % - is responsible for what percentage of the deposit you are willing to lose if there is a stop loss
BE target - here you can choose when you reach which take profit you need to move your stop loss to breakeven
Initial deposit- starting deposit for profit calculation
5. Stoploss group
Fixed stoploss % checkbox - If choosed: stoploss will be calculated manually depending on the setting below( formula: entry_price * (1 - stoploss percent)) If NOT choosed: stoploss will be ( formula: fibonacci level(0.786/0.236) * (1 + stoploss percent))
6. Take profit group
This group of settings is responsible for how far from the entry point take profits will be and what % of the position to fix
7. RSI
Responsible for configuring the built-in RSI. Suitable bars will be highlighted with crosses above or below, depending on overbought/oversold
8. Infopanels group
Here I think everything is clear, you can hide or show information panels
9. Developer mode
If enabled, all events that occur will be shown, for example, reaching a take profit or stop loss with detailed information about the unfixed balance of the position
🟩 HOW TO USE
Very simple. All you need is to wait for the trend to change to long or short, you will immediately see a stop loss and four take profits, and you will also see prices. Like in this picture:
🟩 ALERTS
There are 3 types of alerts:
1. Long signal
2. Short signal
3. Any alert() function call - will be send to you json with these fields
{
"side": "LONG",
"entry": "64.454",
"tp1": "65.099",
"tp2": "65.743",
"tp3": "66.388",
"tp4": "67.032",
"winrate": "35.42%",
"strategy": "MANUAL",
"beTargetTrigger": "1",
"stop": "64.44"
}
🟩 HOW TO SAVE A STRATEGY
First, you need to make sure that the “MANUAL” strategy is selected in the strategy settings.
After this, you can start selecting parameters that will show the largest profit in the statistics panel.
I have highlighted what you need to pay attention to when choosing a strategy
Let's assume you have set up a strategy. The main question is how to preserve it?
Let’s say the strategy turned out with the following parameters:
Next we need to find this section of code:
// STRATS
selector(string strategy_name) =>
strategy_settings = Strategy_settings.new()
switch strategy_name
"MANUAL" =>
strategy_settings.sensitivity := 18
strategy_settings.risk_percent := 1
strategy_settings.break_even_target := "1"
strategy_settings.tp1_percent := 1
strategy_settings.tp1_percent_fix := 40
strategy_settings.tp2_percent := 2
strategy_settings.tp2_percent_fix := 30
strategy_settings.tp3_percent := 3
strategy_settings.tp3_percent_fix := 20
strategy_settings.tp4_percent := 4
strategy_settings.tp4_percent_fix := 10
strategy_settings.fixed_stop := false
strategy_settings.sl_percent := 0.0
"UNIVERSAL" =>
strategy_settings.sensitivity := 20
strategy_settings.risk_percent := 1
strategy_settings.break_even_target := "1"
strategy_settings.tp1_percent := 1
strategy_settings.tp1_percent_fix := 40
strategy_settings.tp2_percent := 2
strategy_settings.tp2_percent_fix := 30
strategy_settings.tp3_percent := 3
strategy_settings.tp3_percent_fix := 20
strategy_settings.tp4_percent := 4
strategy_settings.tp4_percent_fix := 10
strategy_settings.fixed_stop := false
strategy_settings.sl_percent := 0.0
// "NEW STRATEGY" =>
// strategy_settings.sensitivity := 20
// strategy_settings.risk_percent := 1
// strategy_settings.break_even_target := "1"
// strategy_settings.tp1_percent := 1
// strategy_settings.tp1_percent_fix := 40
// strategy_settings.tp2_percent := 2
// strategy_settings.tp2_percent_fix := 30
// strategy_settings.tp3_percent := 3
// strategy_settings.tp3_percent_fix := 20
// strategy_settings.tp4_percent := 4
// strategy_settings.tp4_percent_fix := 10
// strategy_settings.fixed_stop := false
// strategy_settings.sl_percent := 0.0
strategy_settings
// STRATS
Let's uncomment on the latest strategy called "NEW STRATEGY" rename it to "SOL 5m" and change the sensitivity:
// STRATS
selector(string strategy_name) =>
strategy_settings = Strategy_settings.new()
switch strategy_name
"MANUAL" =>
strategy_settings.sensitivity := 18
strategy_settings.risk_percent := 1
strategy_settings.break_even_target := "1"
strategy_settings.tp1_percent := 1
strategy_settings.tp1_percent_fix := 40
strategy_settings.tp2_percent := 2
strategy_settings.tp2_percent_fix := 30
strategy_settings.tp3_percent := 3
strategy_settings.tp3_percent_fix := 20
strategy_settings.tp4_percent := 4
strategy_settings.tp4_percent_fix := 10
strategy_settings.fixed_stop := false
strategy_settings.sl_percent := 0.0
"UNIVERSAL" =>
strategy_settings.sensitivity := 20
strategy_settings.risk_percent := 1
strategy_settings.break_even_target := "1"
strategy_settings.tp1_percent := 1
strategy_settings.tp1_percent_fix := 40
strategy_settings.tp2_percent := 2
strategy_settings.tp2_percent_fix := 30
strategy_settings.tp3_percent := 3
strategy_settings.tp3_percent_fix := 20
strategy_settings.tp4_percent := 4
strategy_settings.tp4_percent_fix := 10
strategy_settings.fixed_stop := false
strategy_settings.sl_percent := 0.0
"SOL 5m" =>
strategy_settings.sensitivity := 15
strategy_settings.risk_percent := 1
strategy_settings.break_even_target := "1"
strategy_settings.tp1_percent := 1
strategy_settings.tp1_percent_fix := 40
strategy_settings.tp2_percent := 2
strategy_settings.tp2_percent_fix := 30
strategy_settings.tp3_percent := 3
strategy_settings.tp3_percent_fix := 20
strategy_settings.tp4_percent := 4
strategy_settings.tp4_percent_fix := 10
strategy_settings.fixed_stop := false
strategy_settings.sl_percent := 0.0
strategy_settings
// STRATS
Now let's find this code:
strategy_input = input.string(title = "STRATEGY", options = , defval = "MANUAL", tooltip = "EN:\nTo manually configure the strategy, select MANUAL otherwise, changing the settings won't have any effect\nRU:\nЧтобы настроить стратегию вручную, выберите MANUAL в противном случае изменение настроек не будет иметь никакого эффекта")
And let's add our new strategy there, it turned out like this:
strategy_input = input.string(title = "STRATEGY", options = , defval = "MANUAL", tooltip = "EN:\nTo manually configure the strategy, select MANUAL otherwise, changing the settings won't have any effect\nRU:\nЧтобы настроить стратегию вручную, выберите MANUAL в противном случае изменение настроек не будет иметь никакого эффекта")
That's all. Our new strategy is now saved! It's simple! Now we can select it in the list of strategies:

The Ultimate Buy and Sell IndicatorThis indicator should be used in conjunction with a solid risk management strategy that does not over-leverage positions and uses stop-losses. You can not rely 100% on the signals provided by this indicator (or any other for that matter).
With that said, this indicator can provide some excellent signals.
It has been designed with a large number of customization options intended for advanced traders, but you do not HAVE to be an advanced user to simply use the indicator. I have tried to make it easy to understand, and this section will provide you with a better understanding of how to use it.
NOTE:
While NOT REQUIRED, I would recommend also finding my indicator called, "Ultimate RSI", which is designed to work together with this indicator (visually). They both contain the same settings and allow you to visualize changes made in this indicator that can not be displayed on the main chart.
This indicator creates it's own candles(bars), so you have to go into your main settings and turn off the "body, border and wick" color settings. Using a dark background is also recommended.
How does it work?
The indicator mainly relies on the RSI indicator with Bollinger Bands for signals. (Though not entirely)
First, there are something that I call "Watch Signals", which are various Bollinger Band crossing events. This could be the price crossing Bollinger Bands or the RSI crossing Bollinger Bands.
There are separate watch signals for buys and sells. Buy watch signals are colored orange to match the BUY signal candle color and Fuchsia (kind of a bright purple) to match SELL signal candles.
In order for most buy or sell signals to be created, there must first be a watch signal. There is a lookback period (or length) for watch signals to be used, and after that many candles (bars) have passed, they will be ignored. You can set a length to look back as well as a time to wait before creating any.
What this means is that if there has previously been (for instance) a sell signal. You can tell it to wait 10 bars before creating any buy watch signals. You can then also tell it that it should look back 10 bars from the current one in order to find any buy watch signals. This means that if you had it set up that way 10 to wait and 10 to validate, it would start allowing buy watch signals 11 bars after a sell, and then once you hit 20 bars, it will start leaving a gap (invisible to you) as the 10 bar lookback period starts moving forward with each new bar. This is useful in order to keep signals more spaced apart as some bad signals come quickly after another one.
Example: You may get a sell signal where the Bollinger bands are tight, then the price easily drops down into the lower band creating a buy watch signal, then you get a "fake" or short pump up and it says buy, but then drops dramatically afterwards. The wait period can ensure that the sell stays in effect longer before a buy is considered by blocking any buy watch signals for a period of time.
After you get a watch signal, the system then looks for various other things to happen to create buy or sell signals. This could be the RSI crossing the (slow) RSI Basis line (from its Bollinger bands), it could be the price crossing its basis line, it could be MACD crosses, it could even be RSI crossing certain levels. All of these are options. If you like the MACD strategy and want it to give you buy and sell signals from just MACD crosses, simply select that option for signals.
It is also able to use the first of any of the options that takes place.
I included an option to force alternating buy and sell signals, rather than showing groups of, or subsequent buy, buy, buy signals, for instance.
Moving on....
You can change the moving average that is used to calculate the RSI. The standard moving average for RSI is the RMA (aka SWMA). Changes to this can dramatically change your signals. You also have the option to change the moving average type used in the Bollinger bands calculation. You can change the length of these as well. The same goes for the Bollinger bands over the Price chart. I added an ATR option for the RSI Bollinger bands to play with, as well. You are able to adjust the standard deviation (multiplier) of the bands as well, which will of course affect the signals.
The ways you can play with signals are nearly infinite, so have fun figuring it out.
The indicator allows for moving averages to be shown as well, with a variety of types to choose from. The standard numbers are 5, 10, 20, 50, 100 and 200, with the addition of a custom moving average of your choice. You can also change the color of this one. You can choose to show them all or any of them you want to show, in any combination, although the TYPE of moving average (SMA, EMA, WMA, etc.) will apply to all of them.
You may also notice the Bollinger Bands over the Price are colored, and become more or less transparent.
The color is derived from the trend of the RSI or the RSI basis (your choice). It looks back at the value however many bars you want and compares the values and that's how it determines if it is trending up or down. Since RSI is a directional momentum indicator, this can be quite useful. If you see the bands are getting darker, this will explain why.
The indicator has a lookback period for determining the widest the bands (which measure volatility) have been over that period of time. This is the baseline. It then will make the bands disappear (by making them more transparent) if the volatility is low. This indicates that a change in volatility is coming and that price isn't really changing much compared to the past (default 500) bars. If they become bright, this is because price has started trending in a direction and volatility is increasing.
I should also note that the candles are colored based on RSI levels.
If you use the Ultimate Companion indicator, you will be able to see the RSI levels (zones) that the colors are based on. As RSI moves into a new range, the candle color will change.
I have created a yellow zone where the candles turn yellow. This is when RSI is between (default) 45 and 55, indicating there is basically no momentum and price is going sideways. This is a good place to get trapped in bad trades, and there is a Yellow RSI Filter to block signals in this area to keep you from entering bad trades.
Green candles indicate values over 55 (getting brighter as RSI rises) and red candles are RSI values under 45 (getting brighter as RSI values get lower). If you see white, this means RSI is either over 80 or under 20. A sharp reversal is almost always imminent at this stage.
When we talk about Buy and Sell Signals, they draw a green or red triangle and it literally says BUY or SELL. There is an option to color the background for added visibility. These signals do not "repaint", what this means is that they can be late. To account for this, I have included a background color that will flash as a warning that a buy or sell could be imminent, although it may fail to break through and set a buy or sell signal. This is simply an advanced warning. The reason is that sometimes a candle may be very large and you won't be told to buy or sell during the candle until the move is completely over and now you're getting in on the next one. That's not a great feeling, so I made it repaint the background color and not repaint the completed signal. You get the best of both worlds.
This indicator also uses complex logic to handle things.
When there is a buy signal, it enters into a state of having been bought, or a "bought state". The same for sells. If Force alternating signals is off, you could have more than one buy in a bought state, or more than one sell in a sell state. There is an option to color the background green during the full duration of a bought state, or red during the full duration of a sold state.
I have added divergence.
This shows that the lows or highs of RSI and PRICE are different. If RSI is making higher highs but the price is not, then the price is likely to follow this bullish divergence, if the opposite happens, it's bearish. It will draw a line on the chart connecting the highs and lows and call it bearish or bullish. You can adjust this as well.
I have an RSI High/Low filter. If the RSI basis (or average) is very high or low, you can block signal from this area since the price is likely to continue in that direction before actually reversing.
You can change the settings of the MACD if you choose to use it for signals, and if you want to see it, you'll have to run that indicator below the chart and match the settings to see what is going on, just like the RSI.
Going back to Watch Signals. You can also choose to require more than one watch signal if you choose. You can skip watch signals, so it will ignore the first or second one, whatever you want to do. You can color the background to show you where watch signals have been skipped.
Regarding the wait period for creating watch signals after a sell or after a buy, you can also color the background to see where these were blocked by the wait period.
Lastly you can choose which type of watch signals to use, or keep them from being shown on the chart. This allows you to study the history of how the asset you are trading behaves and customize the behavior of signals based on your study of it.
Everything in the settings area has tooltips, which will explain what that thing does to help you along this journey.
I hope this indicator (and perhaps Ultimate RSI alongside this) will help you take your trading to the next level.

RAINBOW AVERAGES - INDICATOR - (AS) - 1/3
-INTRODUCTION:
This is the first of three scripts I intend to publish using rainbow indicators. This script serves as a groundwork for the other two. It is a RAINBOW MOVING AVERAGES indicator primarily designed for trend detection. The upcoming script will also be an indicator but with overlay=false (below the chart, not on it) and will utilize RAINBOW BANDS and RAINBOW OSCILLATOR. The third script will be a strategy combining all of them.
RAINBOW moving averages can be used in various ways, but this script is mainly intended for trend analysis. It is meant to be used with overlay=true, but if the user wishes, it can be viewed below the chart. To achieve this, you need to change the code from overlay=true to false and turn off the first switch that plots the rainbow on the chart (or simply move the indicator to a new pane below). By doing this, you will be able to see how all four conditions used to detect trends work on the chart. But let's not get ahead of ourselves.
-WHAT IS IT:
In its simplest form, this indicator uses 10 moving averages colored like a rainbow. The calculation is as follows:
MA0: This is the main moving average and can be defined with the type (SMA, EMA, RMA, WMA, SINE), length, and price source. However, the second moving average (MA1) is calculated using MA0 as its source, MA2 uses MA1 as the data source, and so on, until the last one, MA9. Hence, there are 10 moving averages. The first moving average is special as all the others derive from it. This indicator has many potential uses, such as entry/exit signals, volatility indication, and stop-loss placement, but for now, we will focus on trend detection.
-TREND DETECTION:
The indicator offers four different background color options based on the user's preference:
0-NONE: No background color is applied as no trend detection tools is being used (boring)
1-CHANGE: The background color is determined by summing the changes of all 10 moving averages (from two bars). If the sum is positive and not falling, the background color is GREEN. If the sum is negative and not rising, the background color is RED. From early testing, it works well for the beginning of a movement but not so much for a lasting trend.
2-RAINBW: The background color is green when all the moving averages are in ascending order, indicating a bullish trend. It is red when all the moving averages are in descending order, indicating a bearish trend. For example, if MA1>MA2>MA3>MA4..., the background color is green. If MA1 threshold, and red indicates width < -threshold.
4-DIRECT: The background color is determined by counting the number of moving averages that are either above or below the input source. If the specified number of moving averages is above the source, the background color is green. If the specified number of moving averages is below the source, the background color is red. If all ten MAs are below the price source, the indicator will show 10, and if all ten MAs are above, it will show -10. The specific value will be set later in the settings (same for 3-TSHOLD variant). This method works well for lasting trends.
Note: If the indicator is turned into a below-chart version, all four color options can be seen as separate indicators.
-PARAMETERS - SETTINGS:
The first line is an on/off switch to plot the skittles indicator (and some info in the tooltip). The second line has already been discussed, which is the background color and the selection of the source (only used for MA0!).
The line "MA1: TYP/LEN" is where we define the parameters of MA0 (important). We choose from the types of moving averages (SMA, EMA, RMA, WMA, SINE) and set the length.
Important Note: It says MA1, but it should be MA0!.
The next line defines whether we want to smooth MA1 (which is actually MA0) and the period for smoothing. When smoothing is turned on, MA0 will be smoothed using a 3-pole super smoother. It's worth noting that although this only applies to MA0, as the other MAs are derived from it, they will also be smoothed.
In the line below, we define the type and length of MAs for MA2 (and other MAs except MA0). The same type and length are used for MA1 to MA9. It's important to remember that these values should be smaller. For example, if we set 55, it means that MA1 is the average of 55 periods of MA0, MA2 will be 55 periods of MA1, and so on. I encourage trying different combinations of MA types as it can be easily adjusted for ur type of trading. RMA looks quirky.
Moving on to the last line, we define some inputs for the background color:
TSH: The threshold value when using 3-TSHOLD-BGC. It's a good idea to change the chart to a pane below for easier adjustment. The default values are based on EURUSD-5M.
BG_DIR: The value that must be crossed or equal to the MA score if using 4-DIRECT-BGC. There are 10 MAs, so the maximum value is also 10. For example, if you set it to 9, it means that at least 9 MAs must be below/above the price for the script to detect a trend. Higher values are recommended as most of the time, this indicator oscillates either around the maximum or minimum value.
-SUMMARY OF SETTINGS:
L1 - PLOT MAs and general info tooltip
L2 - Select the source for MA0 and type of trend detection.
L3 - Set the type and length of MA0 (important).
L4 - Turn smoothing on/off for MA0 and set the period for super smoothing.
L5 - Set the type and length for the rest of the MAs.
L6 - Set values if using 4-DIRECT or 3-TSHOLD for the trend detection.
-OTHERS:
To see trend indicators, you need to turn off the plotting of MAs (first line), and then choose the variant you want for the background color. This will plot it on the chart below.
Keep in mind that M1 int settings stands for MA0 and MA2 for all of the 9 MAs left.
Yes, it may seem more complicated than it actually is. In a nutshell, these are 10 MAs, and each one after MA0 uses the previous one as its source. Plus few conditions for range detection. rest is mainly plots and colors.
There are tooltips to help you with the parameters.
I hope this will be useful to someone. If you have any ideas, feedback, or spot errors in the code, LET ME KNOW.
Stay tuned for the remaining two scripts using skittles indicators and check out my other scripts.
-ALSO:
I'm always looking for ideas for interesting indicators and strategies that I could code, so if you don't know Pinescript, just message me, and I would be glad to write your own indicator/strategy for free, obviously.
-----May the force of the market be with you, and until we meet again,

True Trend Average BandsThis is the indicator I am most proud of. After reading Glenn Neely's book "Mastering Eliott Waves" / "Neowave" and chatting with @timwest who got acknowledged by Neely, we came up with the idea of an moving average which does calculate the real average price since a trend started. Addionally I adapted a method from Neely Neowave and Tim Wests TimeAtMode to not force a timeframe on a chart but instead let the charts data decide which timeframe to use, to then calculate the real average price since the trend started.
It took me a while to get this right and coded, so take a moment and dive deeper and you might learn something new.
We assume that the price is in multiple trends on multiple timeframes, this is caused by short term traders, long term traders and investors who trade on different timeframes. To find out in which timeframe the important trends are, we have to look out for significant lows and highs. Then we change the timeframe in the chart to a value so that we have 10 to 20 bars since the significant low/high. While new bars are printed, and we reach more than 20 bars, we have to switch to a higher timeframe so we have 10 to 20 bars again. In the chart you see two significant trends: a downtrend on the 3 week timeframe and an uptrend from the 2 month timeframe. Based on the logic I have described, these are the two important timeframes to watch right now for the spx (there is another uptrend in the yearly chart, which is not shown here).
Now that we understand how to find the important timeframes, let's look what the magic in this script is that tells us the real average price since a trend started.
I developed a new type of moving average, which includes only the prices since a trend started. The difference to the regular sma is that it will not include prices which happened before the significant low or high happened. For example, if a top happened in a market 10 days ago, the regular sma20 would be calculated by 10 bars which happened before the top and 10 bars which happened after the top. If we want to know the average price of the last 10 bars we manually have to change the ma20 to the ma10 which is annoying manual work, additionally even if we use the ma10 in this case, and we look at yesterday's bar the ma10 will include 9 bars from after the top and one bar before the top, so the ma10 would only show the real average price for the current bar which is not what we want.
To come up with a solution to this problem, the True Trend Average searches for the lowest/highest bar in a given period (20 bars). Then starts to calculate the average value since the low/high. For example: if the price reaches a new 20 day high and then trades below it, the day of the high will be the sma1, the day after it's the sma2, ... up to the maximum look back length.
This way, we always know what the average price would have been if someone sold/bought a little bit every bar of his investment since the high/low.
Why is this even important? Let's assume we missed selling the top or buying the low, and think it would have been at least better to buy/sell a little bit since the new trend started. Once the price reaches the true trend average again, we can buy/sell, and it would be as good as selling/buying a little bit every day. We find prices to buy the dip and sell the bounce, which are as good as scaling in/out.
There is a lot more we can learn from these price levels but I think it is better to let you figure out yourself what you can learn from the information given by this indicator. Think about how market participants who accumulate or distribute feel when prices are above or below certain levels.
Now that we understand this new type of moving average, let's look into the lines we see in the chart:
The upper red band line shows the true trend average high price since the last significant top within 20 bars.
The lower red band line shows the true trend average hl2 price since the last significant top within 20 bars.
The lower green band line shows the true trend average low price since the last significant low within 20 bars.
The upper green band line shows the true trend average hl2 price since the last significant low within 20 bars.
The centerline is the average between the upper red band and the lower green band.
The teal lines show 1 standard deviation from the outer bands.
Before today only a few people had access to this indicator, now that it is public and open source, I am curious if you will find it useful and what you will do with it. Please share your findings.
/edit: The chart only shows the 3week timeframe so here are the other two trends from the 2month and 1year timeframe

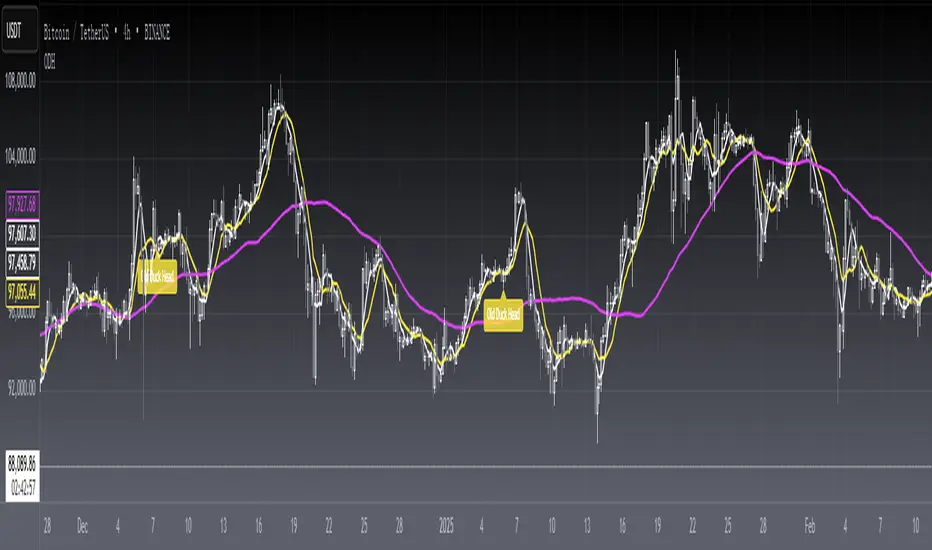
[blackcat] L1 Old Duck HeadLevel 1
Background
The old duck head is a classic form formed by a series of behaviors such as bankers opening positions, washing dishes, and pulling over the top of the duck head.
Function
A form of stock candles:
(1) Moving averages using 5, 10 and 60 parameters. When the 5-day and 10-day moving averages crossed the 60-day moving average, a duck neck was formed.
(2) The high point when the stock price fell back formed a duck head.
(3) When the stock price fell back soon, the 5-day and 10-day moving averages again turned up to form a duckbill.
(4) Duck nose refers to the hole formed when the 5-day moving average crosses the 10-day moving average and the two lines cross again.
Market significance:
(1) When the dealer starts to collect chips, the stock price rises slowly, and the 5-day and 10-day moving averages cross the 60-day moving average, forming a duck neck.
(2) When the stock price of the banker shakes the position and starts to pull back, the high point of the stock price forms the top of the duck's head.
(3) When the dealer builds a position again to collect chips, the stock price rises again, forming a duck bill.
Operation method:
(1) Buy when the 5-day and 10-day moving averages cross the 60-day moving average and form a duck neck.
(2) Buy on dips near the sesame point of trading volume near the duckbill.
(3) Intervene when the stock price crosses the top of the duck's head in heavy volume.
The top of the duck’s head should be a little far away from the 60-day moving average, otherwise it means that the dealer is not willing to open a position at this old duck’s head, and the bottom of the old duck’s head must be heavy. Small is better, nothing is the strongest! There must be a lot of sesame dots under the nostrils of the duck, otherwise it means that the dealer has poor control. There must be ventilation under the duck bill, the higher the ventilation, the better!
Remarks
Feedbacks are appreciated.
Variety N-Tuple Moving Averages w/ Variety Stepping [Loxx]Variety N-Tuple Moving Averages w/ Variety Stepping is a moving average indicator that allows you to create 1- 30 tuple moving average types; i.e., Double-MA, Triple-MA, Quadruple-MA, Quintuple-MA, ... N-tuple-MA. This version contains 2 different moving average types. For example, using "50" as the depth will give you Quinquagintuple Moving Average. If you'd like to find the name of the moving average type you create with the depth input with this indicator, you can find a list of tuples here: Tuples extrapolated
Due to the coding required to adapt a moving average to fit into this indicator, additional moving average types will be added as they are created to fit into this unique use case. Since this is a work in process, there will be many future updates of this indicator. For now, you can choose from either EMA or RMA.
This indicator is also considered one of the top 10 forex indicators. See details here: forex-station.com
Additionally, this indicator is a computationally faster, more streamlined version of the following indicators with the addition of 6 stepping functions and 6 different bands/channels types.
STD-Stepped, Variety N-Tuple Moving Averages
STD-Stepped, Variety N-Tuple Moving Averages is the standard deviation stepped/filtered indicator of the following indicator
Last but not least, a big shoutout to @lejmer for his help in formulating a looping solution for this streamlined version. this indicator is speedy even at 50 orders deep. You can find his scripts here: www.tradingview.com
How this works
Step 1: Run factorial calculation on the depth value,
Step 2: Calculate weights of nested moving averages
factorial(depth) / (factorial(depth - k) * factorial(k); where depth is the depth and k is the weight position
Examples of coefficient outputs:
6 Depth: 6 15 20 15 6
7 Depth: 7 21 35 35 21 7
8 Depth: 8 28 56 70 56 28 8
9 Depth: 9 36 34 84 126 126 84 36 9
10 Depth: 10 45 120 210 252 210 120 45 10
11 Depth: 11 55 165 330 462 462 330 165 55 11
12 Depth: 12 66 220 495 792 924 792 495 220 66 12
13 Depth: 13 78 286 715 1287 1716 1716 1287 715 286 78 13
Step 3: Apply coefficient to each moving average
For QEMA, which is 5 depth EMA , the calculation is as follows
ema1 = ta. ema ( src , length)
ema2 = ta. ema (ema1, length)
ema3 = ta. ema (ema2, length)
ema4 = ta. ema (ema3, length)
ema5 = ta. ema (ema4, length)
In this new streamlined version, these MA calculations are packed into an array inside loop so Pine doesn't have to keep all possible series information in memory. This is handled with the following code:
temp = array.get(workarr, k + 1) + alpha * (array.get(workarr, k) - array.get(workarr, k + 1))
array.set(workarr, k + 1, temp)
After we pack the array, we apply the coefficients to derive the NTMA:
qema = 5 * ema1 - 10 * ema2 + 10 * ema3 - 5 * ema4 + ema5
Stepping calculations
First off, you can filter by both price and/or MA output. Both price and MA output can be filtered/stepped in their own way. You'll see two selectors in the input settings. Default is ATR ATR. Here's how stepping works in simple terms: if the price/MA output doesn't move by X deviations, then revert to the price/MA output one bar back.
ATR
The average true range (ATR) is a technical analysis indicator, introduced by market technician J. Welles Wilder Jr. in his book New Concepts in Technical Trading Systems, that measures market volatility by decomposing the entire range of an asset price for that period.
Standard Deviation
Standard deviation is a statistic that measures the dispersion of a dataset relative to its mean and is calculated as the square root of the variance. The standard deviation is calculated as the square root of variance by determining each data point's deviation relative to the mean. If the data points are further from the mean, there is a higher deviation within the data set; thus, the more spread out the data, the higher the standard deviation.
Adaptive Deviation
By definition, the Standard Deviation (STD, also represented by the Greek letter sigma σ or the Latin letter s) is a measure that is used to quantify the amount of variation or dispersion of a set of data values. In technical analysis we usually use it to measure the level of current volatility .
Standard Deviation is based on Simple Moving Average calculation for mean value. This version of standard deviation uses the properties of EMA to calculate what can be called a new type of deviation, and since it is based on EMA , we can call it EMA deviation. And added to that, Perry Kaufman's efficiency ratio is used to make it adaptive (since all EMA type calculations are nearly perfect for adapting).
The difference when compared to standard is significant--not just because of EMA usage, but the efficiency ratio makes it a "bit more logical" in very volatile market conditions.
See how this compares to Standard Devaition here:
Adaptive Deviation
Median Absolute Deviation
The median absolute deviation is a measure of statistical dispersion. Moreover, the MAD is a robust statistic, being more resilient to outliers in a data set than the standard deviation. In the standard deviation, the distances from the mean are squared, so large deviations are weighted more heavily, and thus outliers can heavily influence it. In the MAD, the deviations of a small number of outliers are irrelevant.
Because the MAD is a more robust estimator of scale than the sample variance or standard deviation, it works better with distributions without a mean or variance, such as the Cauchy distribution.
For this indicator, I used a manual recreation of the quantile function in Pine Script. This is so users have a full inside view into how this is calculated.
Efficiency-Ratio Adaptive ATR
Average True Range (ATR) is widely used indicator in many occasions for technical analysis . It is calculated as the RMA of true range. This version adds a "twist": it uses Perry Kaufman's Efficiency Ratio to calculate adaptive true range
See how this compares to ATR here:
ER-Adaptive ATR
Mean Absolute Deviation
The mean absolute deviation (MAD) is a measure of variability that indicates the average distance between observations and their mean. MAD uses the original units of the data, which simplifies interpretation. Larger values signify that the data points spread out further from the average. Conversely, lower values correspond to data points bunching closer to it. The mean absolute deviation is also known as the mean deviation and average absolute deviation.
This definition of the mean absolute deviation sounds similar to the standard deviation (SD). While both measure variability, they have different calculations. In recent years, some proponents of MAD have suggested that it replace the SD as the primary measure because it is a simpler concept that better fits real life.
For Pine Coders, this is equivalent of using ta.dev()
Bands/Channels
See the information above for how bands/channels are calculated. After the one of the above deviations is calculated, the channels are calculated as output +/- deviation * multiplier
Signals
Green is uptrend, red is downtrend, yellow "L" signal is Long, fuchsia "S" signal is short.
Included:
Alerts
Loxx's Expanded Source Types
Bar coloring
Signals
6 bands/channels types
6 stepping types
Related indicators
3-Pole Super Smoother w/ EMA-Deviation-Corrected Stepping
STD-Stepped Fast Cosine Transform Moving Average
ATR-Stepped PDF MA

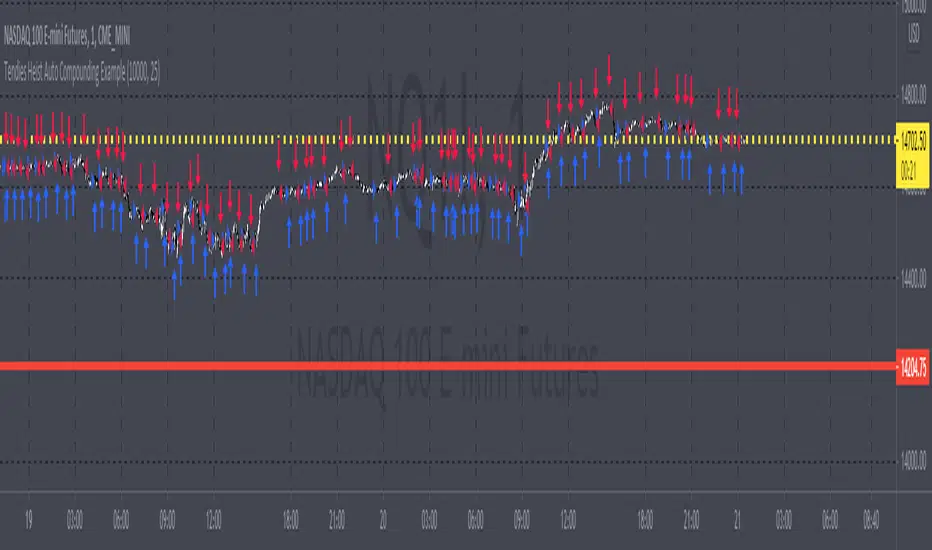
Tendies Heist Auto Compounding ExampleThis is an example of how we can use compounding to control our position size. This example shows how we can automatically add and reduce position size based on account equity. The "initial capital" in properties is the starting account equity. At default its set to 100,000. If our max position size is set to 25 then the very first position that's taken has a position size of 10, IF our leverage is set to 10,000. Account equity divided by leverage equals position size. So in that example 100,000 divided by 10,000 in leverage gives us a max position size of 10. However the max position size was set to 25 meaning we would need 250k in equity for it to open a position size of 25 with the leverage set at 10k. Now if the initial capital was set to 100,000 and the max position size was set to 5 and leverage remained at 10,000, all though 100,000 divided by 10,000 equals 10 it will ONLY open a position size of 5, because the max position size in this example was set at 5. Since this works for strategies you may look through the trade log on the posted back test and check out the position size, you can see in this back test the default 100k is used for the initial capital and the default 10k was used for the leverage. You will be able to see as this logic loses money it takes contracts away and as it gains money it adds contracts. I'm using trading view's basic strategy logic example to provide an example of how the compounding logic works.
Note, don't forget to add the syntax below to your strategy.entry call for this logic to work.
qty = size
Tendies Heist LLC 2021
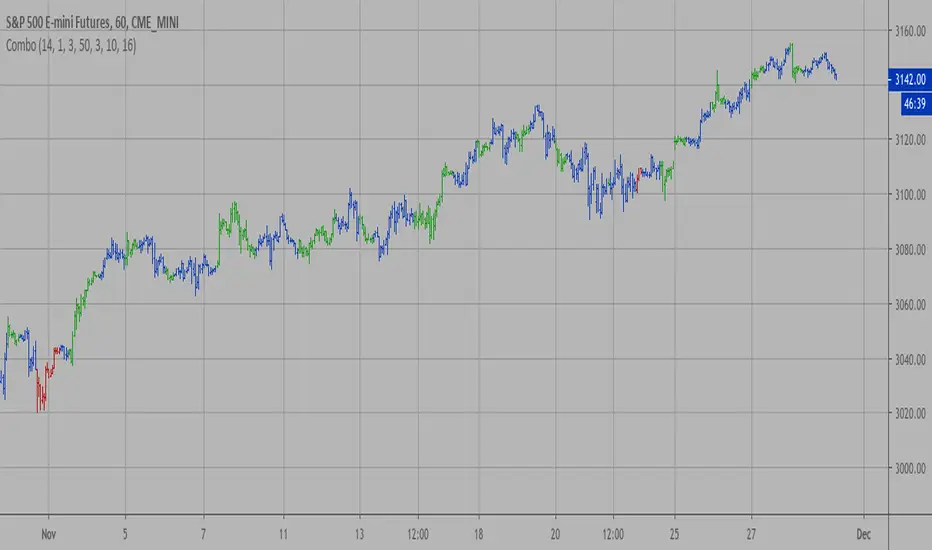
Combo Backtest 123 Reversal & D_Three Ten OscThis is combo strategies for get a cumulative signal.
First strategy
This System was created from the Book "How I Tripled My Money In The
Futures Market" by Ulf Jensen, Page 183. This is reverse type of strategies.
The strategy buys at market, if close price is higher than the previous close
during 2 days and the meaning of 9-days Stochastic Slow Oscillator is lower than 50.
The strategy sells at market, if close price is lower than the previous close price
during 2 days and the meaning of 9-days Stochastic Fast Oscillator is higher than 50.
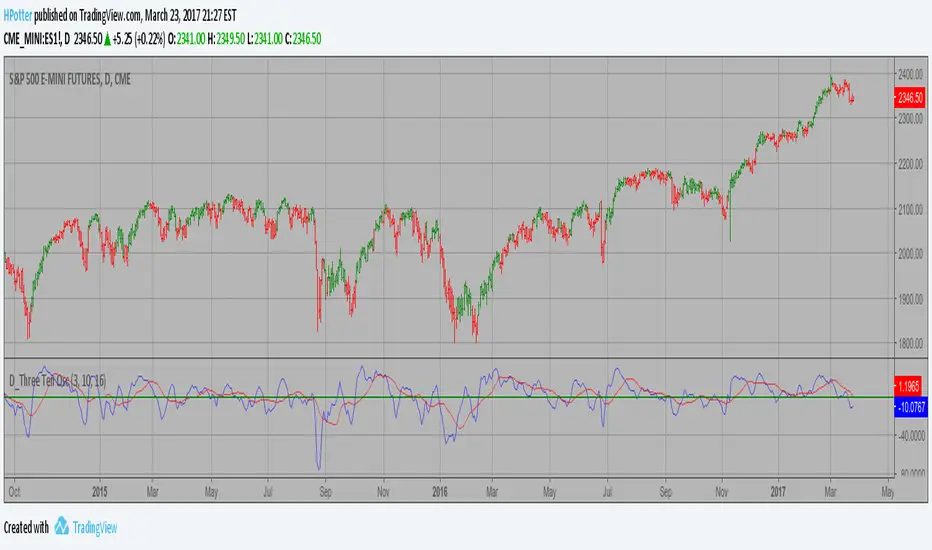
Second strategy
TradeStation does not allow the user to make a Multi Data Chart with
a Tick Bar Chart and any other type a chart. This indicator allows the
user to plot a daily 3-10 Oscillator on a Tick Bar Chart or any intraday interval.
Walter Bressert's 3-10 Oscillator is a detrending oscillator derived
from subtracting a 10 day moving average from a 3 day moving average.
The second plot is an 16 day simple moving average of the 3-10 Oscillator.
The 16 period moving average is the slow line and the 3/10 oscillator is
the fast line.
For more information on the 3-10 Oscillator see Walter Bressert's book
"The Power of Oscillator/Cycle Combinations"
WARNING:
- For purpose educate only
- This script to change bars colors.

Combo Backtest 123 Reversal & D_Three Ten Osc This is combo strategies for get a cumulative signal.
First strategy
This System was created from the Book "How I Tripled My Money In The
Futures Market" by Ulf Jensen, Page 183. This is reverse type of strategies.
The strategy buys at market, if close price is higher than the previous close
during 2 days and the meaning of 9-days Stochastic Slow Oscillator is lower than 50.
The strategy sells at market, if close price is lower than the previous close price
during 2 days and the meaning of 9-days Stochastic Fast Oscillator is higher than 50.
Second strategy
TradeStation does not allow the user to make a Multi Data Chart with
a Tick Bar Chart and any other type a chart. This indicator allows the
user to plot a daily 3-10 Oscillator on a Tick Bar Chart or any intraday interval.
Walter Bressert's 3-10 Oscillator is a detrending oscillator derived
from subtracting a 10 day moving average from a 3 day moving average.
The second plot is an 16 day simple moving average of the 3-10 Oscillator.
The 16 period moving average is the slow line and the 3/10 oscillator is
the fast line.
For more information on the 3-10 Oscillator see Walter Bressert's book
"The Power of Oscillator/Cycle Combinations"
WARNING:
- For purpose educate only
- This script to change bars colors.
D_Three Ten Osc Strategy Backtest This indicator allows the user to plot a daily 3-10 Oscillator on a Tick Bar Chart or any intraday interval.
Walter Bressert's 3-10 Oscillator is a detrending oscillator derived
from subtracting a 10 day moving average from a 3 day moving average.
The second plot is an 16 day simple moving average of the 3-10 Oscillator.
The 16 period moving average is the slow line and the 3/10 oscillator is
the fast line.
For more information on the 3-10 Oscillator see Walter Bressert's book
"The Power of Oscillator/Cycle Combinations"
You can change long to short in the Input Settings
Please, use it only for learning or paper trading. Do not for real trading.

D_Three Ten Osc Strategy This indicator allows the user to plot a daily 3-10 Oscillator on a Tick Bar
Chart or any intraday interval.
Walter Bressert's 3-10 Oscillator is a detrending oscillator derived
from subtracting a 10 day moving average from a 3 day moving average.
The second plot is an 16 day simple moving average of the 3-10 Oscillator.
The 16 period moving average is the slow line and the 3/10 oscillator is
the fast line.
For more information on the 3-10 Oscillator see Walter Bressert's book
"The Power of Oscillator/Cycle Combinations"
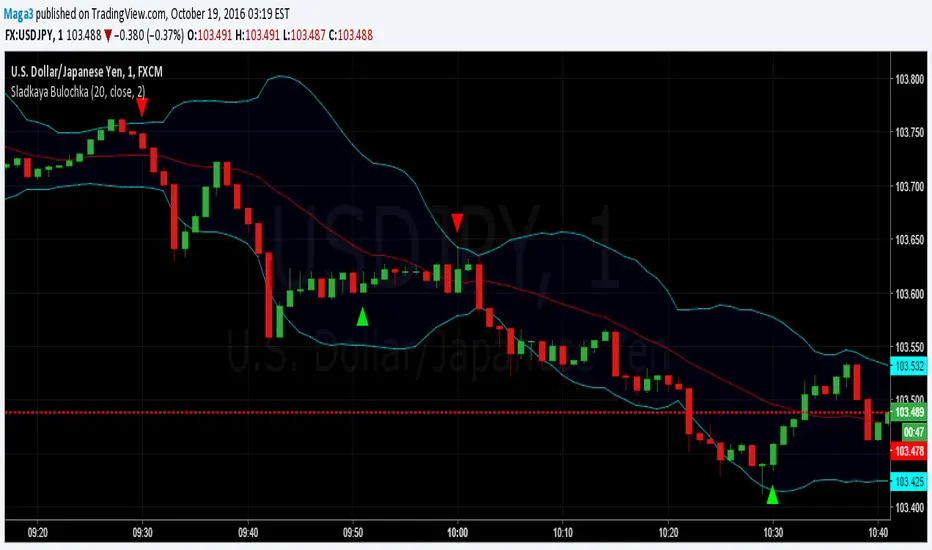
Sladkaya BulochkaAccording to the statistics of Thomas Bulkovski collected over several years on the 1-minute chart (21 million candles), there is a statistically significant periods, where the higher the probability of reversal rates on short-term timeframe.
By reversal, on average, had in mind the movement to 5 candles.
This three periods, they remain unchanged, depending on the hour:
- the first minute of each hour (10:01, 11:01, etc.)
- the first minute after the hour (10:31, 11:31)
- 51 minutes each hour (10:51, 11:51)
------------------------------------------------------
По статистике Томаса Булковски, собранной за несколько лет на 1-минутном графике (21 миллион свечей), есть статистически значимые периоды, где более высока вероятность разворота цены на краткосрочных ТФ.
Под разворотом, в среднем, имелось в виду движение на 5 свечей.
Это три периода, они неизменны в зависимости от часа:
- первая минута каждого часа (10:01, 11:01 и т.д.)
- первая минута после получаса (10:31, 11:31)
- каждая 51 минута часа (10:51, 11:51)
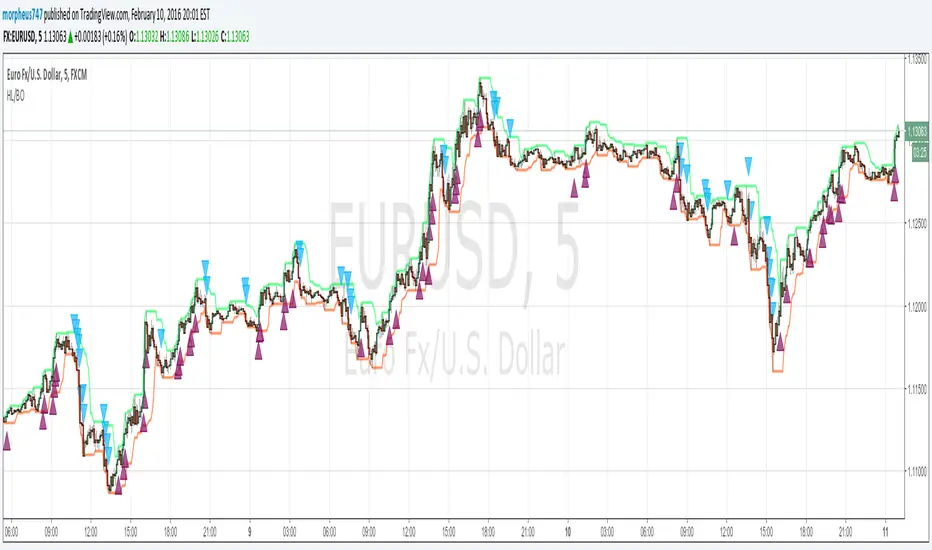
HL BREAKOUTThe base of the indicator is the breakout of historic High and lows.
There are 3 basic configurations
1° The High length that measure the latest 10 bars and make the "higher high"
2° The Low length taht measure the latest 10 bars and make the "lower low"
3° The Breakout PIPs administrator that defines how much pips are needed from the latest higher high to be defined as a level breakout.
So the strategy is super easy. The indicators show you the 10...20.. or whatever you need old bars high and lows.
When a breakout of that levels occurs and the candle "close" above or below and the close are more than "X" amount of PIPs a marker show up. The marker are the signals of buy and sell
I test some configurations, and work in all timeframes but.
I suggest
10, 10, 0.0003 for timeframes from 1m to 15m
and 10, 10, 0.0005 for timeframes higher than 15m
Maybe you need to test other configurations for 4h 1 day, etc the basics are the same in all timeframes, the main difference is the amount of pips that will be considered as "breakout" the higher timeframe the higher amount you need to prevent false positives.
Last words: 0.000X are for the PIPs for currencies that have 4 or 5 decimals like euro and other, if you use in YEN change it to a configuration of 2 digits decimal. Just that.
Have "fun" !
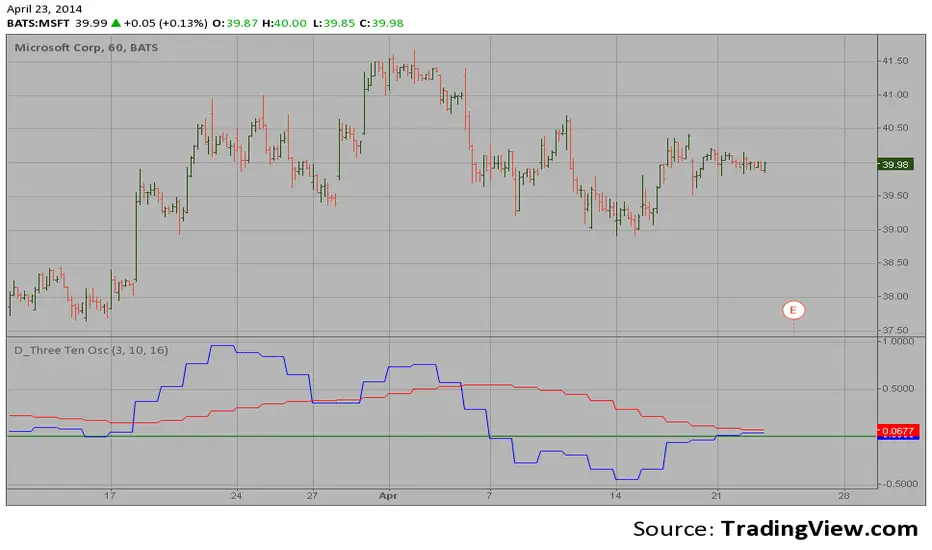
D_Three Ten Osc on the IntradayHi
Let me introduce my D_Three Ten Osc script.
This indicator allows the
user to plot a daily 3-10 Oscillator on a Tick Bar Chart or any intraday interval.
Walter Bressert's 3-10 Oscillator is a detrending oscillator derived
from subtracting a 10 day moving average from a 3 day moving average.
The second plot is an 16 day simple moving average of the 3-10 Oscillator.
The 16 period moving average is the slow line and the 3/10 oscillator is
the fast line.
For more information on the 3-10 Oscillator see Walter Bressert's book
"The Power of Oscillator/Cycle Combinations"
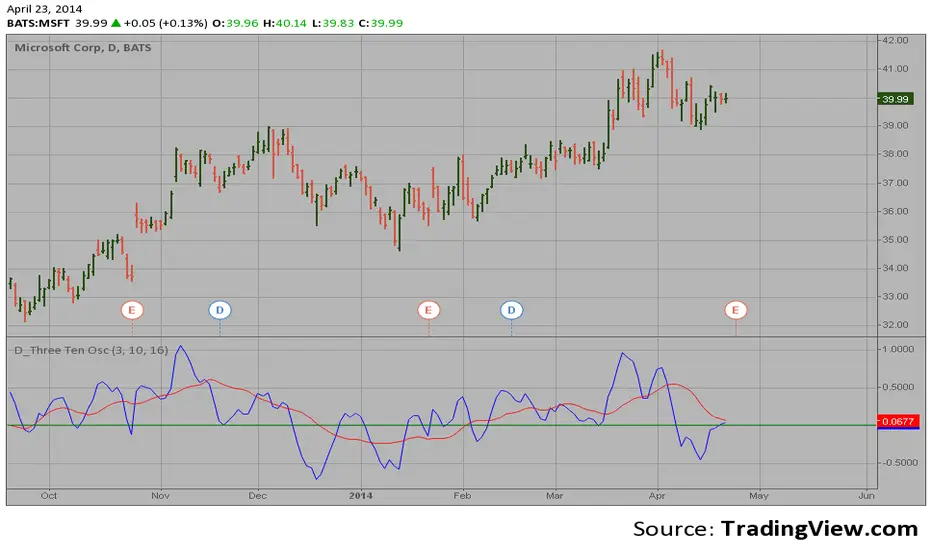
D_Three Ten Osc on the DailyHi
Let me introduce my D_Three Ten Osc script.
This indicator allows the
user to plot a daily 3-10 Oscillator on a Tick Bar Chart or any intraday interval.
Walter Bressert's 3-10 Oscillator is a detrending oscillator derived
from subtracting a 10 day moving average from a 3 day moving average.
The second plot is an 16 day simple moving average of the 3-10 Oscillator.
The 16 period moving average is the slow line and the 3/10 oscillator is
the fast line.
For more information on the 3-10 Oscillator see Walter Bressert's book
"The Power of Oscillator/Cycle Combinations"
CM MACD Ultimate MTF + SuperTrend Strategy [PickMyTrade]Overview
This strategy is built upon ChrisMoody's legendary "CM_MacD_Ult_MTF" indicator (one of the most popular MACD indicators on TradingView with over 1.7 million views). The PickMyTrade team has converted this powerful indicator into a fully automated trading strategy with an essential SuperTrend filter for improved trade quality.
What Makes This Different?
While ChrisMoody's original MACD indicator provides excellent momentum signals with multi-timeframe analysis and 4-color histogram visualization, our strategy adds a critical enhancement:
SuperTrend Trend Filter – We only take trades when both momentum AND trend agree:
Long trades: MACD crosses above Signal Line AND SuperTrend is bullish (green)
Short trades: MACD crosses below Signal Line AND SuperTrend is bearish (red)
This combination dramatically reduces false signals in choppy markets and keeps you on the right side of the trend.
How It Works
The MACD Calculation
Fast EMA (12) - Slow EMA (26) = MACD Line
Signal Line = 9-period SMA of MACD
Histogram = MACD - Signal (shows momentum strength)
4-Color Histogram Logic (ChrisMoody's Innovation)
The histogram changes color based on direction AND position:
Above Zero Line (Bullish Territory):
Aqua → Histogram rising (strengthening bullish momentum)
Blue → Histogram falling (weakening bullish momentum)
Below Zero Line (Bearish Territory):
Maroon → Histogram rising (weakening bearish momentum)
Red → Histogram falling (strengthening bearish momentum)
SuperTrend Filter
Green background = Bullish trend (SuperTrend below price)
Red background = Bearish trend (SuperTrend above price)
Uses ATR (Average True Range) to adapt to market volatility
Entry Signals
Long Entry (Green Background Flash):
MACD Line crosses above Signal Line
SuperTrend is bullish (green)
Optional: MACD above zero line for extra confirmation
Short Entry (Red Background Flash):
MACD Line crosses below Signal Line
SuperTrend is bearish (red)
Optional: MACD below zero line for extra confirmation
Exit Signals:
Opposite MACD/Signal crossover (configurable)
SuperTrend reversal (configurable)
Stop Loss / Take Profit levels (configurable)
Key Features
Multi-Timeframe Support – Analyze MACD on higher timeframes while trading on lower timeframes
Visual Crossover Dots – Clear markers when MACD crosses Signal Line
4-Color Histogram – Instant visual feedback on momentum strength and direction
SuperTrend Filter – Only trade with the trend, not against it
Flexible Exit Options – Exit on opposite signal, SuperTrend flip, or fixed targets
Risk Management Built-In – Customizable Stop Loss and Take Profit percentages
Prop Firm Friendly – Conservative approach with trend confirmation
Works on All Markets – Stocks, Forex, Crypto, Futures, Indices
No Repainting – All signals are confirmed on bar close
Recommended Settings
For Stocks & Indices:
MACD: 12/26/9 (default)
SuperTrend: ATR Period 10, Multiplier 3.0
Timeframes: 1H, 4H, Daily
Stop Loss: 2%
For Crypto:
MACD: 8/17/9 (faster settings for crypto volatility)
SuperTrend: ATR Period 10, Multiplier 2.0
Timeframes: 15M, 1H, 4H
Stop Loss: 3%
For Forex:
MACD: 12/26/9 (default)
SuperTrend: ATR Period 10, Multiplier 3.0
Timeframes: 4H, Daily
Stop Loss: 1.5%
Input Parameters
Timeframe Settings
Use Current Chart Resolution: Toggle ON for current timeframe, OFF for custom MTF
Custom Timeframe: Select higher timeframe for MACD calculation (e.g., 60 = 1 hour)
MACD Settings
Fast Length (12): Fast EMA period
Slow Length (26): Slow EMA period
Signal Length (9): Signal line smoothing period
Source: Price input (default: close)
SuperTrend Filter
Use SuperTrend Filter: Toggle trend filter ON/OFF
ATR Period (10): Period for ATR calculation
ATR Multiplier (3.0): Sensitivity (lower = more signals, higher = stronger trends)
Display Settings
Show MACD & Signal Line: Toggle line display
Show Dots at Crossovers: Visual markers at crosses
Show Histogram: Toggle histogram display
Change MACD Line Color: Dynamic coloring based on Signal Line cross
MACD Histogram 4 Colors: Enable ChrisMoody's color scheme
Strategy Settings
Allow Short Positions: Enable/disable short trades
Only Trade in Trend Direction: Extra filter (MACD > 0 for longs)
Exit on Opposite Signal: Close position on reverse crossover
Exit on SuperTrend Reversal: Close when trend changes
Risk Management
Use Stop Loss: Enable fixed stop loss
Stop Loss % (2.0): Percentage from entry
Use Take Profit: Enable fixed take profit
Take Profit % (4.0): Percentage from entry
Usage Tips
Entry Tips:
Wait for alignment – Don't force trades. Wait for both MACD cross AND SuperTrend confirmation
Higher timeframe confirmation – Check the trend on a higher timeframe before entering
Avoid low volatility – Best results during active trading sessions
Volume confirmation – Look for above-average volume on entry signals
Exit Tips:
Let winners run – Consider using trailing stops instead of fixed take profits
Cut losers quickly – Respect your stop loss levels
Watch for divergences – If price makes new highs/lows but MACD doesn't, consider exiting
Exit on SuperTrend flip – Strong signal that trend is changing
Optimization Tips:
Backtest thoroughly – Test on at least 6 months of data for your specific market
Adjust for volatility – Lower ATR multiplier in volatile markets, higher in stable markets
Match your timeframe – Shorter timeframes need faster MACD settings
Consider session times – Some markets perform better during specific sessions
Best Practices
DO:
Use on trending markets for best results
Combine with higher timeframe analysis
Test on demo account before going live
Adjust parameters for each market/timeframe
Use proper position sizing (1-2% risk per trade)
DON'T:
Trade during major news events without experience
Use on choppy, range-bound markets
Ignore the SuperTrend background color
Overtrade – quality over quantity
Risk more than you can afford to lose
Performance Notes
The strategy performs best when:
Markets are trending (avoid ranging markets)
Volatility is moderate to high
Volume is above average
Multiple timeframes align
The strategy may underperform when:
Markets are choppy or sideways
During major news events (whipsaw risk)
In extremely low volatility conditions
Against strong macro trends
Credits
Original MACD Indicator: ChrisMoody - "CM_MacD_Ult_MTF" (April 10, 2014)
Special thanks to ChrisMoody for creating one of the most comprehensive and visually intuitive MACD indicators on TradingView. His 4-color histogram and multi-timeframe features are preserved in this strategy.
Strategy Conversion & Enhancement: PickMyTrade Team
Added SuperTrend filter, automated trading logic, and risk management system.
About PickMyTrade
Strategy Automation:
Love this strategy? Automate it with real-time execution!
For Stock, Crypto, Futures & Options Trading:
Visit pickmytrade.io
Supported Brokers: Rithmic, TradeStation, TradeLocker, Interactive Brokers, ProjectX
For Tradovate Futures Trading:
Visit pickmytrade.trade
Transform your TradingView strategies into fully automated trading systems with:
Real-time order execution
Alert-based automation
Multiple broker connectivity
Risk management controls
Portfolio management
24/7 trading (crypto/forex)
Disclaimer
This strategy is for educational and informational purposes only.
Important Risk Disclosure:
Past performance does NOT guarantee future results
Trading involves substantial risk of loss
Never risk more than you can afford to lose
Always test strategies on paper/demo accounts first
This is not financial advice – consult a professional advisor
Results will vary based on market conditions and individual execution
Slippage, commissions, and spread costs will affect real-world performance
Recommended:
Start with small position sizes
Use proper risk management (stop losses)
Backtest thoroughly on your specific market
Paper trade for at least 30 days before live trading
Keep a trading journal to track performance

Price Action Concepts [RUDYINDICATOR]/// This work is licensed under a Attribution-NonCommercial-ShareAlike 4.0 International (CC BY-NC-SA 4.0) creativecommons.org
// © RUDYBANK INDICATOR - formerly know as RUDY INDICATOR
//@version=5
indicator("Price Action Concepts ", shorttitle = "RUDYINDICATOR-V1
- Price Action RUDYINDICATOR ", overlay = true, max_lines_count = 500, max_labels_count = 500, max_boxes_count = 500, max_bars_back = 500, max_polylines_count = 100)
//-----------------------------------------------------------------------------{
//Boolean set
//-----------------------------------------------------------------------------{
s_BOS = 0
s_CHoCH = 1
i_BOS = 2
i_CHoCH = 3
i_pp_CHoCH = 4
green_candle = 5
red_candle = 6
s_CHoCHP = 7
i_CHoCHP = 8
boolean =
array.from(
false
, false
, false
, false
, false
, false
, false
, false
, false
)
//-----------------------------------------------------------------------------{
// User inputs
//-----------------------------------------------------------------------------{
show_swing_ms = input.string ("All" , "Swing        " , inline = "1", group = "MARKET STRUCTURE" , options = )
show_internal_ms = input.string ("All" , "Internal     " , inline = "2", group = "MARKET STRUCTURE" , options = )
internal_r_lookback = input.int (5 , "" , inline = "2", group = "MARKET STRUCTURE" , minval = 2)
swing_r_lookback = input.int (50 , "" , inline = "1", group = "MARKET STRUCTURE" , minval = 2)
ms_mode = input.string ("Manual" , "Market Structure Mode" , inline = "a", group = "MARKET STRUCTURE" , tooltip = " Use selected lenght\n Use automatic lenght" ,options = )
show_mtf_str = input.bool (true , "MTF Scanner" , inline = "9", group = "MARKET STRUCTURE" , tooltip = "Display Multi-Timeframe Market Structure Trend Directions. Green = Bullish. Red = Bearish")
show_eql = input.bool (false , "Show EQH/EQL" , inline = "6", group = "MARKET STRUCTURE")
plotcandle_bool = input.bool (false , "Plotcandle" , inline = "3", group = "MARKET STRUCTURE" , tooltip = "Displays a cleaner colored candlestick chart in place of the default candles. (requires hiding the current ticker candles)")
barcolor_bool = input.bool (false , "Bar Color" , inline = "4", group = "MARKET STRUCTURE" , tooltip = "Color the candle bodies according to market strucutre trend")
i_ms_up_BOS = input.color (#089981 , "" , inline = "2", group = "MARKET STRUCTURE")
i_ms_dn_BOS = input.color (#f23645 , "" , inline = "2", group = "MARKET STRUCTURE")
s_ms_up_BOS = input.color (#089981 , "" , inline = "1", group = "MARKET STRUCTURE")
s_ms_dn_BOS = input.color (#f23645 , "" , inline = "1", group = "MARKET STRUCTURE")
lvl_daily = input.bool (false , "Day   " , inline = "1", group = "HIGHS & LOWS MTF")
lvl_weekly = input.bool (false , "Week " , inline = "2", group = "HIGHS & LOWS MTF")
lvl_monthly = input.bool (false , "Month" , inline = "3", group = "HIGHS & LOWS MTF")
lvl_yearly = input.bool (false , "Year  " , inline = "4", group = "HIGHS & LOWS MTF")
css_d = input.color (color.blue , "" , inline = "1", group = "HIGHS & LOWS MTF")
css_w = input.color (color.blue , "" , inline = "2", group = "HIGHS & LOWS MTF")
css_m = input.color (color.blue , "" , inline = "3", group = "HIGHS & LOWS MTF")
css_y = input.color (color.blue , "" , inline = "4", group = "HIGHS & LOWS MTF")
s_d = input.string ('⎯⎯⎯' , '' , inline = '1', group = 'HIGHS & LOWS MTF' , options = )
s_w = input.string ('⎯⎯⎯' , '' , inline = '2', group = 'HIGHS & LOWS MTF' , options = )
s_m = input.string ('⎯⎯⎯' , '' , inline = '3', group = 'HIGHS & LOWS MTF' , options = )
s_y = input.string ('⎯⎯⎯' , '' , inline = '4', group = 'HIGHS & LOWS MTF' , options = )
ob_show = input.bool (true , "Show Last    " , inline = "1", group = "VOLUMETRIC ORDER BLOCKS" , tooltip = "Display volumetric order blocks on the chart \n\n Ammount of volumetric order blocks to show")
ob_num = input.int (5 , "" , inline = "1", group = "VOLUMETRIC ORDER BLOCKS" , tooltip = "Orderblocks number", minval = 1, maxval = 10)
ob_metrics_show = input.bool (true , "Internal Buy/Sell Activity" , inline = "2", group = "VOLUMETRIC ORDER BLOCKS" , tooltip = "Display volume metrics that have formed the orderblock")
css_metric_up = input.color (color.new(#089981, 50) , "         " , inline = "2", group = "VOLUMETRIC ORDER BLOCKS")
css_metric_dn = input.color (color.new(#f23645 , 50) , "" , inline = "2", group = "VOLUMETRIC ORDER BLOCKS")
ob_swings = input.bool (false , "Swing Order Blocks" , inline = "a", group = "VOLUMETRIC ORDER BLOCKS" , tooltip = "Display swing volumetric order blocks")
css_swing_up = input.color (color.new(color.gray , 90) , "                 " , inline = "a", group = "VOLUMETRIC ORDER BLOCKS")
css_swing_dn = input.color (color.new(color.silver, 90) , "" , inline = "a", group = "VOLUMETRIC ORDER BLOCKS")
ob_filter = input.string ("None" , "Filtering             " , inline = "d", group = "VOLUMETRIC ORDER BLOCKS" , tooltip = "Filter out volumetric order blocks by BOS/CHoCH/CHoCH+", options = )
ob_mitigation = input.string ("Absolute" , "Mitigation           " , inline = "4", group = "VOLUMETRIC ORDER BLOCKS" , tooltip = "Trigger to remove volumetric order blocks", options = )
ob_pos = input.string ("Precise" , "Positioning          " , inline = "k", group = "VOLUMETRIC ORDER BLOCKS" , tooltip = "Position of the Order Block\n Cover the whole candle\n Cover half candle\n Adjust to volatility\n Same as Accurate but more precise", options = )
use_grayscale = input.bool (false , "Grayscale" , inline = "6", group = "VOLUMETRIC ORDER BLOCKS" , tooltip = "Use gray as basic order blocks color")
use_show_metric = input.bool (true , "Show Metrics" , inline = "7", group = "VOLUMETRIC ORDER BLOCKS" , tooltip = "Show volume associated with the orderblock and his relevance")
use_middle_line = input.bool (true , "Show Middle-Line" , inline = "8", group = "VOLUMETRIC ORDER BLOCKS" , tooltip = "Show mid-line order blocks")
use_overlap = input.bool (true , "Hide Overlap" , inline = "9", group = "VOLUMETRIC ORDER BLOCKS" , tooltip = "Hide overlapping order blocks")
use_overlap_method = input.string ("Previous" , "Overlap Method    " , inline = "Z", group = "VOLUMETRIC ORDER BLOCKS" , tooltip = " Preserve the most recent volumetric order blocks\n\n Preserve the previous volumetric order blocks", options = )
ob_bull_css = input.color (color.new(#089981 , 90) , "" , inline = "1", group = "VOLUMETRIC ORDER BLOCKS")
ob_bear_css = input.color (color.new(#f23645 , 90) , "" , inline = "1", group = "VOLUMETRIC ORDER BLOCKS")
show_acc_dist_zone = input.bool (false , "" , inline = "1", group = "Accumulation And Distribution")
zone_mode = input.string ("Fast" , "" , inline = "1", group = "Accumulation And Distribution" , tooltip = " Find small zone pattern formation\n Find bigger zone pattern formation" ,options = )
acc_css = input.color (color.new(#089981 , 60) , "" , inline = "1", group = "Accumulation And Distribution")
dist_css = input.color (color.new(#f23645 , 60) , "" , inline = "1", group = "Accumulation And Distribution")
show_lbl = input.bool (false , "Show swing point" , inline = "1", group = "High and Low" , tooltip = "Display swing point")
show_mtb = input.bool (false , "Show High/Low/Equilibrium" , inline = "2", group = "High and Low" , tooltip = "Display Strong/Weak High And Low and Equilibrium")
toplvl = input.color (color.red , "Premium Zone   " , inline = "3", group = "High and Low")
midlvl = input.color (color.gray , "Equilibrium Zone" , inline = "4", group = "High and Low")
btmlvl = input.color (#089981 , "Discount Zone    " , inline = "5", group = "High and Low")
fvg_enable = input.bool (false , "        " , inline = "1", group = "FAIR VALUE GAP" , tooltip = "Display fair value gap")
what_fvg = input.string ("FVG" , "" , inline = "1", group = "FAIR VALUE GAP" , tooltip = "Display fair value gap", options = )
fvg_num = input.int (5 , "Show Last  " , inline = "1a", group = "FAIR VALUE GAP" , tooltip = "Number of fvg to show")
fvg_upcss = input.color (color.new(#089981, 80) , "" , inline = "1", group = "FAIR VALUE GAP")
fvg_dncss = input.color (color.new(color.red , 80) , "" , inline = "1", group = "FAIR VALUE GAP")
fvg_extend = input.int (10 , "Extend FVG" , inline = "2", group = "FAIR VALUE GAP" , tooltip = "Extend the display of the FVG.")
fvg_src = input.string ("Close" , "Mitigation  " , inline = "3", group = "FAIR VALUE GAP" , tooltip = " Use the close of the body as trigger\n\n Use the extreme point of the body as trigger", options = )
fvg_tf = input.timeframe ("" , "Timeframe " , inline = "4", group = "FAIR VALUE GAP" , tooltip = "Timeframe of the fair value gap")
t = color.t (ob_bull_css)
invcol = color.new (color.white , 100)
//{----------------------------------------------------------------------------------------------------------------------------------------------}
//{----------------------------------------------------------------------------------------------------------------------------------------------}
//{----------------------------------------------------------------------------------------------------------------------------------------------}
//{----------------------------------------------------------------------------------------------------------------------------------------------}
//{ - UDT }
//{----------------------------------------------------------------------------------------------------------------------------------------------}
//{----------------------------------------------------------------------------------------------------------------------------------------------}
//{----------------------------------------------------------------------------------------------------------------------------------------------}
//{----------------------------------------------------------------------------------------------------------------------------------------------}
type bar
float o = open
float c = close
float h = high
float l = low
float v = volume
int n = bar_index
int t = time
type Zphl
line top
line bottom
label top_label
label bottom_label
bool stopcross
bool sbottomcross
bool itopcross
bool ibottomcross
string txtup
string txtdn
float topy
float bottomy
float topx
float bottomx
float tup
float tdn
int tupx
int tdnx
float itopy
float itopx
float ibottomy
float ibottomx
float uV
float dV
type FVG
box box
line ln
bool bull
float top
float btm
int left
int right
type ms
float p
int n
float l
type msDraw
int n
float p
color css
string txt
bool bull
type obC
float top
float btm
int left
float avg
float dV
float cV
int wM
int blVP
int brVP
int dir
float h
float l
int n
type obD
box ob
box eOB
box blB
box brB
line mL
type zone
chart.point points
float p
int c
int t
type hqlzone
box pbx
box ebx
box lbx
label plb
label elb
label lbl
type ehl
float pt
int t
float pb
int b
type pattern
string found = "None"
bool isfound = false
int period = 0
bool bull = false
type alerts
bool chochswing = false
bool chochplusswing = false
bool swingbos = false
bool chochplus = false
bool choch = false
bool bos = false
bool equal = false
bool ob = false
bool swingob = false
bool zone = false
bool fvg = false
bool obtouch = false
//{----------------------------------------------------------------------------------------------------------------------------------------------}
//{----------------------------------------------------------------------------------------------------------------------------------------------}
//{----------------------------------------------------------------------------------------------------------------------------------------------}
//{----------------------------------------------------------------------------------------------------------------------------------------------}
//{ - End }
//{----------------------------------------------------------------------------------------------------------------------------------------------}
//{----------------------------------------------------------------------------------------------------------------------------------------------}
//{----------------------------------------------------------------------------------------------------------------------------------------------}
//{----------------------------------------------------------------------------------------------------------------------------------------------}
//{----------------------------------------------------------------------------------------------------------------------------------------------}
//{----------------------------------------------------------------------------------------------------------------------------------------------}
//{----------------------------------------------------------------------------------------------------------------------------------------------}
//{----------------------------------------------------------------------------------------------------------------------------------------------}
//{ - General Setup }
//{----------------------------------------------------------------------------------------------------------------------------------------------}
//{----------------------------------------------------------------------------------------------------------------------------------------------}
//{----------------------------------------------------------------------------------------------------------------------------------------------}
//{----------------------------------------------------------------------------------------------------------------------------------------------}
bar b = bar.new()
var pattern p = pattern.new()
alerts blalert = alerts.new()
alerts bralert = alerts.new()
if p.isfound
p.period += 1
if p.period == 50
p.period := 0
p.found := "None"
p.isfound := false
p.bull := na
switch
b.c > b.o => boolean.set(green_candle, true)
b.c < b.o => boolean.set(red_candle , true)
f_zscore(src, lookback) =>
(src - ta.sma(src, lookback)) / ta.stdev(src, lookback)
var int iLen = internal_r_lookback
var int sLen = swing_r_lookback
vv = f_zscore(((close - close ) / close ) * 100,iLen)
if ms_mode == "Dynamic"
switch
vv >= 1.5 or vv <= -1.5 => iLen := 10
vv >= 1.6 or vv <= -1.6 => iLen := 9
vv >= 1.7 or vv <= -1.7 => iLen := 8
vv >= 1.8 or vv <= -1.8 => iLen := 7
vv >= 1.9 or vv <= -1.9 => iLen := 6
vv >= 2.0 or vv <= -2.0 => iLen := 5
=> iLen
var msline = array.new(0)
iH = ta.pivothigh(high, iLen, iLen)
sH = ta.pivothigh(high, sLen, sLen)
iL = ta.pivotlow (low , iLen, iLen)
sL = ta.pivotlow (low , sLen, sLen)
//{----------------------------------------------------------------------------------------------------------------------------------------------}
//{----------------------------------------------------------------------------------------------------------------------------------------------}
//{----------------------------------------------------------------------------------------------------------------------------------------------}
//{----------------------------------------------------------------------------------------------------------------------------------------------}
//{ - End }
//{----------------------------------------------------------------------------------------------------------------------------------------------}
//{----------------------------------------------------------------------------------------------------------------------------------------------}
//{----------------------------------------------------------------------------------------------------------------------------------------------}
//{----------------------------------------------------------------------------------------------------------------------------------------------}
//{----------------------------------------------------------------------------------------------------------------------------------------------}
//{----------------------------------------------------------------------------------------------------------------------------------------------}
//{----------------------------------------------------------------------------------------------------------------------------------------------}
//{----------------------------------------------------------------------------------------------------------------------------------------------}
//{ - ARRAYS }
//{----------------------------------------------------------------------------------------------------------------------------------------------}
//{----------------------------------------------------------------------------------------------------------------------------------------------}
//{----------------------------------------------------------------------------------------------------------------------------------------------}
//{----------------------------------------------------------------------------------------------------------------------------------------------}
hl () =>
= request.security(syminfo.tickerid , 'D' , hl() , lookahead = barmerge.lookahead_on)
= request.security(syminfo.tickerid , 'W' , hl() , lookahead = barmerge.lookahead_on)
= request.security(syminfo.tickerid , 'M' , hl() , lookahead = barmerge.lookahead_on)
= request.security(syminfo.tickerid , '12M', hl() , lookahead = barmerge.lookahead_on)
lstyle(style) =>
out = switch style
'⎯⎯⎯' => line.style_solid
'----' => line.style_dashed
'····' => line.style_dotted
mtfphl(h, l ,tf ,css, pdhl_style) =>
var line hl = line.new(
na
, na
, na
, na
, xloc = xloc.bar_time
, color = css
, style = lstyle(pdhl_style)
)
var line ll = line.new(
na
, na
, na
, na
, xloc = xloc.bar_time
, color = css
, style = lstyle(pdhl_style)
)
var label lbl = label.new(
na
, na
, xloc = xloc.bar_time
, text = str.format('P{0}L', tf)
, color = invcol
, textcolor = css
, size = size.small
, style = label.style_label_left
)
var label hlb = label.new(
na
, na
, xloc = xloc.bar_time
, text = str.format('P{0}H', tf)
, color = invcol
, textcolor = css
, size = size.small
, style = label.style_label_left
)
hy = ta.valuewhen(h != h , h , 1)
hx = ta.valuewhen(h == high , time , 1)
ly = ta.valuewhen(l != l , l , 1)
lx = ta.valuewhen(l == low , time , 1)
if barstate.islast
extension = time + (time - time ) * 50
line.set_xy1(hl , hx , hy)
line.set_xy2(hl , extension , hy)
label.set_xy(hlb, extension , hy)
line.set_xy1(ll , lx , ly)
line.set_xy2(ll , extension , ly)
label.set_xy(lbl, extension , ly)
if lvl_daily
mtfphl(pdh , pdl , 'D' , css_d, s_d)
if lvl_weekly
mtfphl(pwh , pwl , 'W' , css_w, s_w)
if lvl_monthly
mtfphl(pmh , pml, 'M' , css_m, s_m)
if lvl_yearly
mtfphl(pyh , pyl , '12M', css_y, s_y)
//{----------------------------------------------------------------------------------------------------------------------------------------------}
//{----------------------------------------------------------------------------------------------------------------------------------------------}
//{----------------------------------------------------------------------------------------------------------------------------------------------}
//{----------------------------------------------------------------------------------------------------------------------------------------------}
//{ - End }
//{----------------------------------------------------------------------------------------------------------------------------------------------}
//{----------------------------------------------------------------------------------------------------------------------------------------------}
//{----------------------------------------------------------------------------------------------------------------------------------------------}
//{----------------------------------------------------------------------------------------------------------------------------------------------}
//{----------------------------------------------------------------------------------------------------------------------------------------------}
//{----------------------------------------------------------------------------------------------------------------------------------------------}
//{----------------------------------------------------------------------------------------------------------------------------------------------}
//{----------------------------------------------------------------------------------------------------------------------------------------------}
//{ - Market Structure }
//{----------------------------------------------------------------------------------------------------------------------------------------------}
//{----------------------------------------------------------------------------------------------------------------------------------------------}
//{----------------------------------------------------------------------------------------------------------------------------------------------}
//{----------------------------------------------------------------------------------------------------------------------------------------------}
method darkcss(color css, float factor, bool bull) =>
blue = color.b(css) * (1 - factor)
red = color.r(css) * (1 - factor)
green = color.g(css) * (1 - factor)
color.rgb(red, green, blue, 0)
method f_line(msDraw d, size, style) =>
var line id = na
var label lbl = na
id := line.new(
d.n
, d.p
, b.n
, d.p
, color = d.css
, width = 1
, style = style
)
if msline.size() >= 250
line.delete(msline.shift())
msline.push(id)
lbl := label.new(
int(math.avg(d.n, b.n))
, d.p
, d.txt
, color = invcol
, textcolor = d.css
, style = d.bull ? label.style_label_down : label.style_label_up
, size = size
, text_font_family = font.family_monospace
)
structure(bool mtf) =>
msDraw drw = na
bool isdrw = false
bool isdrwS = false
var color css = na
var color icss = na
var int itrend = 0
var int trend = 0
bool bull_ob = false
bool bear_ob = false
bool s_bull_ob = false
bool s_bear_ob = false
n = bar_index
var ms up = ms.new(
array.new()
, array.new< int >()
, array.new()
)
var ms dn = ms.new(
array.new()
, array.new< int >()
, array.new()
)
var ms sup = ms.new(
array.new()
, array.new< int >()
, array.new()
)
var ms sdn = ms.new(
array.new()
, array.new< int >()
, array.new()
)
switch show_swing_ms
"All" => boolean.set(s_BOS , true ), boolean.set(s_CHoCH, true ) , boolean.set(s_CHoCHP, true )
"CHoCH" => boolean.set(s_BOS , false), boolean.set(s_CHoCH, true ) , boolean.set(s_CHoCHP, false )
"CHoCH+" => boolean.set(s_BOS , false), boolean.set(s_CHoCH, false) , boolean.set(s_CHoCHP, true )
"BOS" => boolean.set(s_BOS , true ), boolean.set(s_CHoCH, false) , boolean.set(s_CHoCHP, false )
"None" => boolean.set(s_BOS , false), boolean.set(s_CHoCH, false) , boolean.set(s_CHoCHP, false )
=> na
switch show_internal_ms
"All" => boolean.set(i_BOS, true ), boolean.set(i_CHoCH, true ), boolean.set(i_CHoCHP, true )
"CHoCH" => boolean.set(i_BOS, false), boolean.set(i_CHoCH, true ), boolean.set(i_CHoCHP, false)
"CHoCH+" => boolean.set(i_BOS, false), boolean.set(i_CHoCH, false ), boolean.set(i_CHoCHP, true )
"BOS" => boolean.set(i_BOS, true ), boolean.set(i_CHoCH, false ), boolean.set(i_CHoCHP, false)
"None" => boolean.set(i_BOS, false), boolean.set(i_CHoCH, false ), boolean.set(i_CHoCHP, false)
=> na
switch
iH =>
up.p.unshift(b.h )
up.l.unshift(b.h )
up.n.unshift(n )
iL =>
dn.p.unshift(b.l )
dn.l.unshift(b.l )
dn.n.unshift(n )
sL =>
sdn.p.unshift(b.l )
sdn.l.unshift(b.l )
sdn.n.unshift(n )
sH =>
sup.p.unshift(b.h )
sup.l.unshift(b.h )
sup.n.unshift(n )
// INTERNAL BULLISH STRUCTURE
if up.p.size() > 0 and dn.l.size() > 1
if ta.crossover(b.c, up.p.first())
bool CHoCH = na
string txt = na
if itrend < 0
CHoCH := true
switch
not CHoCH =>
txt := "BOS"
css := i_ms_up_BOS
blalert.bos := true
if boolean.get(i_BOS) and mtf == false and na(drw)
isdrw := true
drw := msDraw.new(
up.n.first()
, up.p.first()
, i_ms_up_BOS
, txt
, true
)
CHoCH =>
dn.l.first() > dn.l.get(1) ? blalert.chochplus : blalert.choch
txt := dn.l.first() > dn.l.get(1) ? "CHoCH+" : "CHoCH"
css := i_ms_up_BOS.darkcss(0.25, true)
if (dn.l.first() > dn.l.get(1) ? boolean.get(i_CHoCHP) : boolean.get(i_CHoCH)) and mtf == false and na(drw)
isdrw := true
drw := msDraw.new(
up.n.first()
, up.p.first()
, i_ms_up_BOS.darkcss(0.25, true)
, txt
, true
)
if mtf == false
switch
ob_filter == "None" => bull_ob := true
ob_filter == "BOS" and txt == "BOS" => bull_ob := true
ob_filter == "CHoCH" and txt == "CHoCH" => bull_ob := true
ob_filter == "CHoCH+" and txt == "CHoCH+" => bull_ob := true
itrend := 1
up.n.clear()
up.p.clear()
// INTERNAL BEARISH STRUCTURE
if dn.p.size() > 0 and up.l.size() > 1
if ta.crossunder(b.c, dn.p.first())
bool CHoCH = na
string txt = na
if itrend > 0
CHoCH := true
switch
not CHoCH =>
bralert.bos := true
txt := "BOS"
css := i_ms_dn_BOS
if boolean.get(i_BOS) and mtf == false and na(drw)
isdrw := true
drw := msDraw.new(
dn.n.first()
, dn.p.first()
, i_ms_dn_BOS
, txt
, false
)
CHoCH =>
if up.l.first() < up.l.get(1)
bralert.chochplus := true
else
bralert.choch := true
txt := up.l.first() < up.l.get(1) ? "CHoCH+" : "CHoCH"
css := i_ms_dn_BOS.darkcss(0.25, false)
if (up.l.first() < up.l.get(1) ? boolean.get(i_CHoCHP) : boolean.get(i_CHoCH)) and mtf == false and na(drw)
isdrw := true
drw := msDraw.new(
dn.n.first()
, dn.p.first()
, i_ms_dn_BOS.darkcss(0.25, false)
, txt
, false
)
if mtf == false
switch
ob_filter == "None" => bear_ob := true
ob_filter == "BOS" and txt == "BOS" => bear_ob := true
ob_filter == "CHoCH" and txt == "CHoCH" => bear_ob := true
ob_filter == "CHoCH+" and txt == "CHoCH+" => bear_ob := true
itrend := -1
dn.n.clear()
dn.p.clear()
// SWING BULLISH STRUCTURE
if sup.p.size() > 0 and sdn.l.size() > 1
if ta.crossover(b.c, sup.p.first())
bool CHoCH = na
string txt = na
if trend < 0
CHoCH := true
switch
not CHoCH =>
blalert.swingbos := true
txt := "BOS"
icss := s_ms_up_BOS
if boolean.get(s_BOS) and mtf == false and na(drw)
isdrwS := true
drw := msDraw.new(
sup.n.first()
, sup.p.first()
, s_ms_up_BOS
, txt
, true
)
CHoCH =>
if sdn.l.first() > sdn.l.get(1)
blalert.chochplusswing := true
else
blalert.chochswing := true
txt := sdn.l.first() > sdn.l.get(1) ? "CHoCH+" : "CHoCH"
icss := s_ms_up_BOS.darkcss(0.25, true)
if (sdn.l.first() > sdn.l.get(1) ? boolean.get(s_CHoCHP) : boolean.get(s_CHoCH)) and mtf == false and na(drw)
isdrwS := true
drw := msDraw.new(
sup.n.first()
, sup.p.first()
, s_ms_up_BOS.darkcss(0.25, true)
, txt
, true
)
if mtf == false
switch
ob_filter == "None" => s_bull_ob := true
ob_filter == "BOS" and txt == "BOS" => s_bull_ob := true
ob_filter == "CHoCH" and txt == "CHoCH" => s_bull_ob := true
ob_filter == "CHoCH+" and txt == "CHoCH+" => s_bull_ob := true
trend := 1
sup.n.clear()
sup.p.clear()
// SWING BEARISH STRUCTURE
if sdn.p.size() > 0 and sup.l.size() > 1
if ta.crossunder(b.c, sdn.p.first())
bool CHoCH = na
string txt = na
if trend > 0
CHoCH := true
switch
not CHoCH =>
bralert.swingbos := true
txt := "BOS"
icss := s_ms_dn_BOS
if boolean.get(s_BOS) and mtf == false and na(drw)
isdrwS := true
drw := msDraw.new(
sdn.n.first()
, sdn.p.first()
, s_ms_dn_BOS
, txt
, false
)
CHoCH =>
if sup.l.first() < sup.l.get(1)
bralert.chochplusswing := true
else
bralert.chochswing := true
txt := sup.l.first() < sup.l.get(1) ? "CHoCH+" : "CHoCH"
icss := s_ms_dn_BOS.darkcss(0.25, false)
if (sup.l.first() < sup.l.get(1) ? boolean.get(s_CHoCHP) : boolean.get(s_CHoCH)) and mtf == false and na(drw)
isdrwS := true
drw := msDraw.new(
sdn.n.first()
, sdn.p.first()
, s_ms_dn_BOS.darkcss(0.25, false)
, txt
, false
)
if mtf == false
switch
ob_filter == "None" => s_bear_ob := true
ob_filter == "BOS" and txt == "BOS" => s_bear_ob := true
ob_filter == "CHoCH" and txt == "CHoCH" => s_bear_ob := true
ob_filter == "CHoCH+" and txt == "CHoCH+" => s_bear_ob := true
trend := -1
sdn.n.clear()
sdn.p.clear()
= structure(false)
if isdrw
f_line(drw, size.small, line.style_dashed)
if isdrwS
f_line(drw, size.small, line.style_solid)
= request.security("", "15" , structure(true))
= request.security("", "60" , structure(true))
= request.security("", "240" , structure(true))
= request.security("", "1440" , structure(true))
if show_mtf_str
var tab = table.new(position = position.top_right, columns = 10, rows = 10, bgcolor = na, frame_color = color.rgb(54, 58, 69, 0), frame_width = 1, border_color = color.rgb(54, 58, 69, 100), border_width = 1)
table.cell(tab, 0, 1, text = "15" , text_color = color.silver, text_halign = text.align_center, text_size = size.normal, bgcolor = chart.bg_color, text_font_family = font.family_monospace, width = 2)
table.cell(tab, 0, 2, text = "1H" , text_color = color.silver, text_halign = text.align_center, text_size = size.normal, bgcolor = chart.bg_color, text_font_family = font.family_monospace, width = 2)
table.cell(tab, 0, 3, text = "4H" , text_color = color.silver, text_halign = text.align_center, text_size = size.normal, bgcolor = chart.bg_color, text_font_family = font.family_monospace, width = 2)
table.cell(tab, 0, 4, text = "1D" , text_color = color.silver, text_halign = text.align_center, text_size = size.normal, bgcolor = chart.bg_color, text_font_family = font.family_monospace, width = 2)
table.cell(tab, 1, 1, text = itrend15 == 1 ? "BULLISH" : itrend15 == -1 ? "BEARISH" : na , text_halign = text.align_center, text_size = size.normal, text_color = itrend15 == 1 ? i_ms_up_BOS.darkcss(-0.25, true) : itrend15 == -1 ? i_ms_dn_BOS.darkcss(0.25, false) : color.gray, bgcolor = chart.bg_color, text_font_family = font.family_monospace)
table.cell(tab, 1, 2, text = itrend1H == 1 ? "BULLISH" : itrend1H == -1 ? "BEARISH" : na , text_halign = text.align_center, text_size = size.normal, text_color = itrend1H == 1 ? i_ms_up_BOS.darkcss(-0.25, true) : itrend1H == -1 ? i_ms_dn_BOS.darkcss(0.25, false) : color.gray, bgcolor = chart.bg_color, text_font_family = font.family_monospace)
table.cell(tab, 1, 3, text = itrend4H == 1 ? "BULLISH" : itrend4H == -1 ? "BEARISH" : na , text_halign = text.align_center, text_size = size.normal, text_color = itrend4H == 1 ? i_ms_up_BOS.darkcss(-0.25, true) : itrend4H == -1 ? i_ms_dn_BOS.darkcss(0.25, false) : color.gray, bgcolor = chart.bg_color, text_font_family = font.family_monospace)
table.cell(tab, 1, 4, text = itrend1D == 1 ? "BULLISH" : itrend1D == -1 ? "BEARISH" : na , text_halign = text.align_center, text_size = size.normal, text_color = itrend1D == 1 ? i_ms_up_BOS.darkcss(-0.25, true) : itrend1D == -1 ? i_ms_dn_BOS.darkcss(0.25, false) : color.gray, bgcolor = chart.bg_color, text_font_family = font.family_monospace)
table.cell(tab, 0, 5, text = "Detected Pattern", text_halign = text.align_center, text_size = size.normal, text_color = color.silver, bgcolor = chart.bg_color, text_font_family = font.family_monospace)
table.cell(tab, 0, 6, text = p.found, text_halign = text.align_center, text_size = size.normal, text_color = na(p.bull) ? color.white : p.bull ? i_ms_up_BOS.darkcss(-0.25, true) : p.bull == false ? i_ms_dn_BOS.darkcss(0.25, false) : na, bgcolor = chart.bg_color, text_font_family = font.family_monospace)
table.merge_cells(tab, 0, 5, 1, 5)
table.merge_cells(tab, 0, 6, 1, 6)
//{----------------------------------------------------------------------------------------------------------------------------------------------}
//{----------------------------------------------------------------------------------------------------------------------------------------------}
//{----------------------------------------------------------------------------------------------------------------------------------------------}
//{----------------------------------------------------------------------------------------------------------------------------------------------}
//{ - End }
//{----------------------------------------------------------------------------------------------------------------------------------------------}
//{----------------------------------------------------------------------------------------------------------------------------------------------}
//{----------------------------------------------------------------------------------------------------------------------------------------------}
//{----------------------------------------------------------------------------------------------------------------------------------------------}
//{----------------------------------------------------------------------------------------------------------------------------------------------}
//{----------------------------------------------------------------------------------------------------------------------------------------------}
//{----------------------------------------------------------------------------------------------------------------------------------------------}
//{----------------------------------------------------------------------------------------------------------------------------------------------}
//{ - Strong/Weak High/Low And Equilibrium }
//{----------------------------------------------------------------------------------------------------------------------------------------------}
//{----------------------------------------------------------------------------------------------------------------------------------------------}
//{----------------------------------------------------------------------------------------------------------------------------------------------}
//{----------------------------------------------------------------------------------------------------------------------------------------------}
var phl = Zphl.new(
na
, na
, label.new(na , na , color = invcol , textcolor = i_ms_dn_BOS , style = label.style_label_down , size = size.tiny , text = "")
, label.new(na , na , color = invcol , textcolor = i_ms_up_BOS , style = label.style_label_up , size = size.tiny , text = "")
, true
, true
, true
, true
, ""
, ""
, 0
, 0
, 0
, 0
, high
, low
, 0
, 0
, 0
, 0
, 0
, 0
, na
, na
)
zhl(len)=>
upper = ta.highest(len)
lower = ta.lowest(len)
var float out = 0
out := b.h > upper ? 0 : b.l < lower ? 1 : out
top = out == 0 and out != 0 ? b.h : 0
btm = out == 1 and out != 1 ? b.l : 0
= zhl(sLen)
= zhl(iLen)
upphl(trend) =>
var label lbl = label.new(
na
, na
, color = invcol
, textcolor = toplvl
, style = label.style_label_down
, size = size.small
)
if top
phl.stopcross := true
phl.txtup := top > phl.topy ? "HH" : "HL"
if show_lbl
topl = label.new(
b.n - swing_r_lookback
, top
, phl.txtup
, color = invcol
, textcolor = toplvl
, style = label.style_label_down
, size = size.small
)
line.delete(phl.top )
phl.top := line.new(
b.n - sLen
, top
, b.n
, top
, color = toplvl)
phl.topy := top
phl.topx := b.n - sLen
phl.tup := top
phl.tupx := b.n - sLen
if itop
phl.itopcross := true
phl.itopy := itop
phl.itopx := b.n - iLen
phl.tup := math.max(high, phl.tup)
phl.tupx := phl.tup == high ? b.n : phl.tupx
phl.uV := phl.tup != phl.tup ? b.v : phl.uV
if barstate.islast
line.set_xy1(
phl.top
, phl.tupx
, phl.tup
)
line.set_xy2(
phl.top
, b.n + 50
, phl.tup
)
label.set_x(
lbl
, b.n + 50
)
label.set_y(
lbl
, phl.tup
)
dist = math.abs(phl.uV / (phl.uV + phl.dV)) * 100
label.set_text (lbl, trend < 0
? "Strong High | " + str.tostring(phl.uV, format.volume) + " (" + str.tostring(math.round(dist,0)) + "%)"
: "Weak High | " + str.tostring(phl.uV, format.volume) + " (" + str.tostring(math.round(dist,0)) + "%)")
dnphl(trend) =>
var label lbl = label.new(
na
, na
, color = invcol
, textcolor = btmlvl
, style = label.style_label_up
, size = size.small
)
if btm
phl.sbottomcross := true
phl.txtdn := btm > phl.bottomy ? "LH" : "LL"
if show_lbl
btml = label.new(
b.n - swing_r_lookback
, btm, phl.txtdn
, color = invcol
, textcolor = btmlvl
, style = label.style_label_up
, size = size.small
)
line.delete(phl.bottom )
phl.bottom := line.new(
b.n - sLen
, btm
, b.n
, btm
, color = btmlvl
)
phl.bottomy := btm
phl.bottomx := b.n - sLen
phl.tdn := btm
phl.tdnx := b.n - sLen
if ibtm
phl.ibottomcross := true
phl.ibottomy := ibtm
phl.ibottomx := b.n - iLen
phl.tdn := math.min(low, phl.tdn)
phl.tdnx := phl.tdn == low ? b.n : phl.tdnx
phl.dV := phl.tdn != phl.tdn ? b.v : phl.dV
if barstate.islast
line.set_xy1(
phl.bottom
, phl.tdnx
, phl.tdn
)
line.set_xy2(
phl.bottom
, b.n + 50
, phl.tdn
)
label.set_x(
lbl
, b.n + 50
)
label.set_y(
lbl
, phl.tdn
)
dist = math.abs(phl.dV / (phl.uV + phl.dV)) * 100
label.set_text (lbl, trend > 0
? "Strong Low | " + str.tostring(phl.dV, format.volume) + " (" + str.tostring(math.round(dist,0)) + "%)"
: "Weak Low | " + str.tostring(phl.uV, format.volume) + " (" + str.tostring(math.round(dist,0)) + "%)")
midphl() =>
avg = math.avg(phl.bottom.get_y2(), phl.top.get_y2())
var line l = line.new(
y1 = avg
, y2 = avg
, x1 = b.n - sLen
, x2 = b.n + 50
, color = midlvl
, style = line.style_solid
)
var label lbl = label.new(
x = b.n + 50
, y = avg
, text = "Equilibrium"
, style = label.style_label_left
, color = invcol
, textcolor = midlvl
, size = size.small
)
if barstate.islast
more = (phl.bottom.get_x1() + phl.bottom.get_x2()) > (phl.top.get_x1() + phl.top.get_x2()) ? phl.top.get_x1() : phl.bottom.get_x1()
line.set_xy1(l , more , avg)
line.set_xy2(l , b.n + 50, avg)
label.set_x (lbl , b.n + 50 )
label.set_y (lbl , avg )
dist = math.abs((l.get_y2() - close) / close) * 100
label.set_text (lbl, "Equilibrium (" + str.tostring(math.round(dist,0)) + "%)")
hqlzone() =>
if barstate.islast
var hqlzone dZone = hqlzone.new(
box.new(
na
, na
, na
, na
, bgcolor = color.new(toplvl, 70)
, border_color = na
)
, box.new(
na
, na
, na
, na
, bgcolor = color.new(midlvl, 70)
, border_color = na
)
, box.new(
na
, na
, na
, na
, bgcolor = color.new(btmlvl, 70)
, border_color = na
)
, label.new(na, na, text = "Premium" , color = invcol, textcolor = toplvl, style = label.style_label_down, size = size.small)
, label.new(na, na, text = "Equilibrium", color = invcol, textcolor = midlvl, style = label.style_label_left, size = size.small)
, label.new(na, na, text = "Discount" , color = invcol, textcolor = btmlvl, style = label.style_label_up , size = size.small)
)
dZone.pbx.set_lefttop(int(math.max(phl.topx, phl.bottomx)) , phl.tup)
dZone.pbx.set_rightbottom(b.n + 50 , 0.95 * phl.tup + 0.05 * phl.tdn)
dZone.ebx.set_lefttop(int(math.max(phl.topx, phl.bottomx)), 0.525 * phl.tup + 0.475 * phl.tdn)
dZone.ebx.set_rightbottom(b.n + 50 , 0.525 * phl.tdn + 0.475 * phl.tup)
dZone.lbx.set_lefttop(int(math.max(phl.topx, phl.bottomx)), 0.95 * phl.tdn + 0.05 * phl.tup)
dZone.lbx.set_rightbottom(b.n + 50 , phl.tdn)
dZone.plb.set_xy( int(math.avg(math.max(phl.topx, phl.bottomx), int(b.n + 50))) , phl.tup)
dZone.elb.set_xy( int(b.n + 50) , math.avg(phl.tup, phl.tdn))
dZone.lbl.set_xy( int(math.avg(math.max(phl.topx, phl.bottomx), int(b.n + 50))) , phl.tdn)
if show_mtb
upphl (trend)
dnphl (trend)
hqlzone()
//{----------------------------------------------------------------------------------------------------------------------------------------------}
//{----------------------------------------------------------------------------------------------------------------------------------------------}
//{----------------------------------------------------------------------------------------------------------------------------------------------}
//{----------------------------------------------------------------------------------------------------------------------------------------------}
//{ - End }
//{----------------------------------------------------------------------------------------------------------------------------------------------}
//{----------------------------------------------------------------------------------------------------------------------------------------------}
//{----------------------------------------------------------------------------------------------------------------------------------------------}
//{----------------------------------------------------------------------------------------------------------------------------------------------}
//{----------------------------------------------------------------------------------------------------------------------------------------------}
//{----------------------------------------------------------------------------------------------------------------------------------------------}
//{----------------------------------------------------------------------------------------------------------------------------------------------}
//{----------------------------------------------------------------------------------------------------------------------------------------------}
//{ - Volumetric Order Block }
//{----------------------------------------------------------------------------------------------------------------------------------------------}
//{----------------------------------------------------------------------------------------------------------------------------------------------}
//{----------------------------------------------------------------------------------------------------------------------------------------------}
//{----------------------------------------------------------------------------------------------------------------------------------------------}
method eB(box b, bool ext, color css, bool swing) =>
b.unshift(
box.new(
na
, na
, na
, na
, xloc = xloc.bar_time
, text_font_family = font.family_monospace
, extend = ext ? extend.right : extend.none
, border_color = swing ? color.new(css, 0) : color.new(color.white,100)
, bgcolor = css
, border_width = 1
)
)
method eL(line l, bool ext, bool solid, color css) =>
l.unshift(
line.new(
na
, na
, na
, na
, width = 1
, color = css
, xloc = xloc.bar_time
, extend = ext ? extend.right : extend.none
, style = solid ? line.style_solid : line.style_dashed
)
)
method drawVOB(bool cdn, bool bull, color css, int loc, bool swing) =>
= request.security(
syminfo.tickerid
, ""
,
, lookahead = barmerge.lookahead_off
)
var obC obj = obC.new(
array.new()
, array.new()
, array.new< int >()
, array.new()
, array.new()
, array.new()
, array.new< int >()
, array.new< int >()
, array.new< int >()
, array.new< int >()
, array.new()
, array.new()
, array.new< int >()
)
var obD draw = obD.new(
array.new()
, array.new()
, array.new()
, array.new()
, array.new()
)
if barstate.isfirst
for i = 0 to ob_num - 1
draw.mL .eL(false, false, use_grayscale ? color.new(color.gray, 0) : color.new(css,0))
draw.ob .eB(false, use_grayscale ? color.new(color.gray, 90) : css, swing)
draw.blB.eB(false, css_metric_up , swing)
draw.brB.eB(false, css_metric_dn , swing)
draw.eOB.eB(true , use_grayscale ? color.new(color.gray, 90) : css, swing)
float pos = ob_pos == "Full"
? (bull ? high : low)
: ob_pos == "Middle"
? ohlc4
: ob_pos == "Accurate"
? hl2
: hl2
if cdn
obj.h.clear()
obj.l.clear()
obj.n.clear()
for i = 0 to math.abs((loc - b.n)) - 1
obj.h.push(hH )
obj.l.push(lL )
obj.n.push(b.t )
// obj.h.reverse()
// obj.l.reverse()
int iU = obj.l.indexof(obj.l.min()) + 1
int iD = obj.h.indexof(obj.h.max()) + 1
obj.dir.unshift(
bull
? (b.c > b.o ? 1 : -1)
: (b.c > b.o ? 1 : -1)
)
obj.top.unshift(
bull
? pos
: obj.h.max()
)
obj.btm.unshift(
bull
? obj.l.min()
: pos
)
obj.left.unshift(
bull
? obj.n.get(obj.l.indexof(obj.l.min()))
: obj.n.get(obj.h.indexof(obj.h.max()))
)
obj.avg.unshift(
math.avg(obj.top.first(), obj.btm.first())
)
obj.cV.unshift(
bull
? b.v
: b.v
)
if ob_pos == "Precise"
switch bull
true =>
if obj.avg.get(0) < (b.c < b.o ? b.c : b.o ) and obj.top.get(0) > hlcc4
obj.top.set(0, obj.avg.get(0))
obj.avg.set(0, math.avg(obj.top.first(), obj.btm.first()))
false =>
if obj.avg.get(0) > (b.c < b.o ? b.o : b.c ) and obj.btm.get(0) < hlcc4
obj.btm.set(0, obj.avg.get(0))
obj.avg.set(0, math.avg(obj.top.first(), obj.btm.first()))
obj.blVP.unshift ( 0 )
obj.brVP.unshift ( 0 )
obj.wM .unshift ( 1 )
if use_overlap
int rmP = use_overlap_method == "Recent" ? 1 : 0
if obj.avg.size() > 1
if bull
? obj.btm.first() < obj.top.get(1)
: obj.top.first() > obj.btm.get(1)
obj.wM .remove(rmP)
obj.cV .remove(rmP)
obj.dir .remove(rmP)
obj.top .remove(rmP)
obj.avg .remove(rmP)
obj.btm .remove(rmP)
obj.left .remove(rmP)
obj.blVP .remove(rmP)
obj.brVP .remove(rmP)
if barstate.isconfirmed
for x = 0 to ob_num - 1
tg = switch ob_mitigation
"Middle" => obj.avg
"Absolute" => bull ? obj.btm : obj.top
for in tg
if (bull ? cC < pt : cC > pt)
obj.wM .remove(idx)
obj.cV .remove(idx)
obj.dir .remove(idx)
obj.top .remove(idx)
obj.avg .remove(idx)
obj.btm .remove(idx)
obj.left .remove(idx)
obj.blVP .remove(idx)
obj.brVP .remove(idx)
if barstate.islast
if obj.avg.size() > 0
// Alert
if bull
? ta.crossunder(low , obj.top.get(0))
: ta.crossover (high, obj.btm.get(0))
switch bull
true => blalert.obtouch := true
false => bralert.obtouch := true
float tV = 0
obj.dV.clear()
seq = math.min(ob_num - 1, obj.avg.size() - 1)
for j = 0 to seq
tV += obj.cV.get(j)
if j == seq
for y = 0 to seq
obj.dV.unshift(
math.floor(
(obj.cV.get(y) / tV) * 100)
)
obj.dV.reverse()
for i = 0 to math.min(ob_num - 1, obj.avg.size() - 1)
dmL = draw.mL .get(i)
dOB = draw.ob .get(i)
dblB = draw.blB.get(i)
dbrB = draw.brB.get(i)
deOB = draw.eOB.get(i)
dOB.set_lefttop (obj.left .get(i) , obj.top.get(i))
deOB.set_lefttop (b.t , obj.top.get(i))
dOB.set_rightbottom (b.t , obj.btm.get(i))
deOB.set_rightbottom(b.t + (b.t - b.t ) * 100 , obj.btm.get(i))
if use_middle_line
dmL.set_xy1(obj.left.get(i), obj.avg.get(i))
dmL.set_xy2(b.t , obj.avg.get(i))
if ob_metrics_show
dblB.set_lefttop (obj.left.get(i), obj.top.get(i))
dbrB.set_lefttop (obj.left.get(i), obj.avg.get(i))
dblB.set_rightbottom(obj.left.get(i), obj.avg.get(i))
dbrB.set_rightbottom(obj.left.get(i), obj.btm.get(i))
rpBL = dblB.get_right()
rpBR = dbrB.get_right()
dbrB.set_right(rpBR + (b.t - b.t ) * obj.brVP.get(i))
dblB.set_right(rpBL + (b.t - b.t ) * obj.blVP.get(i))
if use_show_metric
txt = switch
obj.cV.get(i) >= 1000000000 => str.tostring(math.round(obj.cV.get(i) / 1000000000,3)) + "B"
obj.cV.get(i) >= 1000000 => str.tostring(math.round(obj.cV.get(i) / 1000000,3)) + "M"
obj.cV.get(i) >= 1000 => str.tostring(math.round(obj.cV.get(i) / 1000,3)) + "K"
obj.cV.get(i) < 1000 => str.tostring(math.round(obj.cV.get(i)))
deOB.set_text(
str.tostring(
txt + " (" + str.tostring(obj.dV.get(i)) + "%)")
)
deOB.set_text_size (size.auto)
deOB.set_text_halign(text.align_left)
deOB.set_text_color (use_grayscale ? color.silver : color.new(css, 0))
if ob_metrics_show and barstate.isconfirmed
if obj.wM.size() > 0
for i = 0 to obj.avg.size() - 1
switch obj.dir.get(i)
1 =>
switch obj.wM.get(i)
1 => obj.blVP.set(i, obj.blVP.get(i) + 1), obj.wM.set(i, 2)
2 => obj.blVP.set(i, obj.blVP.get(i) + 1), obj.wM.set(i, 3)
3 => obj.brVP.set(i, obj.brVP.get(i) + 1), obj.wM.set(i, 1)
-1 =>
switch obj.wM.get(i)
1 => obj.brVP.set(i, obj.brVP.get(i) + 1), obj.wM.set(i, 2)
2 => obj.brVP.set(i, obj.brVP.get(i) + 1), obj.wM.set(i, 3)
3 => obj.blVP.set(i, obj.blVP.get(i) + 1), obj.wM.set(i, 1)
var hN = array.new(1, b.n)
var lN = array.new(1, b.n)
var hS = array.new(1, b.n)
var lS = array.new(1, b.n)
if iH
hN.pop()
hN.unshift(int(b.n ))
if iL
lN.pop()
lN.unshift(int(b.n ))
if sH
hS.pop()
hS.unshift(int(b.n ))
if sL
lS.pop()
lS.unshift(int(b.n ))
if ob_show
bull_ob.drawVOB(true , ob_bull_css, hN.first(), false)
bear_ob.drawVOB(false, ob_bear_css, lN.first(), false)
if ob_swings
s_bull_ob.drawVOB(true , css_swing_up, hS.first(), true)
s_bear_ob.drawVOB(false, css_swing_dn, lS.first(), true)
if bull_ob
blalert.ob := true
if bear_ob
bralert.ob := true
if s_bull_ob
blalert.swingob := true
if s_bear_ob
blalert.swingob := true
//{----------------------------------------------------------------------------------------------------------------------------------------------}
//{----------------------------------------------------------------------------------------------------------------------------------------------}
//{----------------------------------------------------------------------------------------------------------------------------------------------}
//{----------------------------------------------------------------------------------------------------------------------------------------------}
//{ - End }
//{----------------------------------------------------------------------------------------------------------------------------------------------}
//{----------------------------------------------------------------------------------------------------------------------------------------------}
//{----------------------------------------------------------------------------------------------------------------------------------------------}
//{----------------------------------------------------------------------------------------------------------------------------------------------}
//{----------------------------------------------------------------------------------------------------------------------------------------------}
//{----------------------------------------------------------------------------------------------------------------------------------------------}
//{----------------------------------------------------------------------------------------------------------------------------------------------}
//{----------------------------------------------------------------------------------------------------------------------------------------------}
//{ - FVG | VI | OG }
//{----------------------------------------------------------------------------------------------------------------------------------------------}
//{----------------------------------------------------------------------------------------------------------------------------------------------}
//{----------------------------------------------------------------------------------------------------------------------------------------------}
//{----------------------------------------------------------------------------------------------------------------------------------------------}
ghl() => request.security(syminfo.tickerid, fvg_tf, [high , low , close , open ])
tfG() => request.security(syminfo.tickerid, fvg_tf, )
cG(bool bull) =>
= ghl()
= tfG()
var FVG draw = FVG.new(
array.new()
, array.new()
)
var FVG cords = array.new()
float pup = na
float pdn = na
bool cdn = na
int pos = 2
cc = timeframe.change(fvg_tf)
if barstate.isfirst
for i = 0 to fvg_num - 1
draw.box.unshift(box.new (na, na, na, na, border_color = color.new(color.white, 100), xloc = xloc.bar_time))
draw.ln.unshift (line.new(na, na, na, na, xloc = xloc.bar_time, width = 1, style = line.style_solid))
switch what_fvg
"FVG" =>
pup := bull ? gl : l
pdn := bull ? h : gh
cdn := bull ? gl > h and cc : gh < l and cc
pos := 2
"VI" =>
pup := bull
? (gc > go
? go
: gc)
: (gc > go
? go
: gc )
pdn := bull
? (gc > go
? gc
: go )
: (gc > go
? gc
: go)
cdn := bull
? go > gc and gh >

TenUp Bots S R - Fixed (ta.highest)//@version=5
indicator("TenUp Bots S R - Fixed (ta.highest)", overlay = true)
// Inputs
a = input.int(10, "Sensitivity (bars)", minval = 1, maxval = 9999)
d_pct = input.int(85, "Transparency (%)", minval = 0, maxval = 100)
// Convert 0-100% to 0-255 transparency (color.new uses 0..255)
transp = math.round(d_pct * 255 / 100)
// Colors with transparency applied
resColor = color.new(color.red, transp)
supColor = color.new(color.blue, transp)
// Helper (calculations only)
getRes(len) => ta.highest(high, len)
getSup(len) => ta.lowest(low, len)
// === PLOTS (all in global scope) ===
plot(getRes(a*1), title="Resistance 1", color=resColor, linewidth=2)
plot(getSup(a*1), title="Support 1", color=supColor, linewidth=2)
plot(getRes(a*2), title="Resistance 2", color=resColor, linewidth=2)
plot(getSup(a*2), title="Support 2", color=supColor, linewidth=2)
plot(getRes(a*3), title="Resistance 3", color=resColor, linewidth=2)
plot(getSup(a*3), title="Support 3", color=supColor, linewidth=2)
plot(getRes(a*4), title="Resistance 4", color=resColor, linewidth=2)
plot(getSup(a*4), title="Support 4", color=supColor, linewidth=2)
plot(getRes(a*5), title="Resistance 5", color=resColor, linewidth=2)
plot(getSup(a*5), title="Support 5", color=supColor, linewidth=2)
plot(getRes(a*6), title="Resistance 6", color=resColor, linewidth=2)
plot(getSup(a*6), title="Support 6", color=supColor, linewidth=2)
plot(getRes(a*7), title="Resistance 7", color=resColor, linewidth=2)
plot(getSup(a*7), title="Support 7", color=supColor, linewidth=2)
plot(getRes(a*8), title="Resistance 8", color=resColor, linewidth=2)
plot(getSup(a*8), title="Support 8", color=supColor, linewidth=2)
plot(getRes(a*9), title="Resistance 9", color=resColor, linewidth=2)
plot(getSup(a*9), title="Support 9", color=supColor, linewidth=2)
plot(getRes(a*10), title="Resistance 10", color=resColor, linewidth=2)
plot(getSup(a*10), title="Support 10", color=supColor, linewidth=2)
plot(getRes(a*15), title="Resistance 15", color=resColor, linewidth=2)
plot(getSup(a*15), title="Support 15", color=supColor, linewidth=2)
plot(getRes(a*20), title="Resistance 20", color=resColor, linewidth=2)
plot(getSup(a*20), title="Support 20", color=supColor, linewidth=2)
plot(getRes(a*25), title="Resistance 25", color=resColor, linewidth=2)
plot(getSup(a*25), title="Support 25", color=supColor, linewidth=2)
plot(getRes(a*30), title="Resistance 30", color=resColor, linewidth=2)
plot(getSup(a*30), title="Support 30", color=supColor, linewidth=2)
plot(getRes(a*35), title="Resistance 35", color=resColor, linewidth=2)
plot(getSup(a*35), title="Support 35", color=supColor, linewidth=2)
plot(getRes(a*40), title="Resistance 40", color=resColor, linewidth=2)
plot(getSup(a*40), title="Support 40", color=supColor, linewidth=2)
plot(getRes(a*45), title="Resistance 45", color=resColor, linewidth=2)
plot(getSup(a*45), title="Support 45", color=supColor, linewidth=2)
plot(getRes(a*50), title="Resistance 50", color=resColor, linewidth=2)
plot(getSup(a*50), title="Support 50", color=supColor, linewidth=2)
plot(getRes(a*75), title="Resistance 75", color=resColor, linewidth=2)
plot(getSup(a*75), title="Support 75", color=supColor, linewidth=2)
plot(getRes(a*100), title="Resistance 100", color=resColor, linewidth=2)
plot(getSup(a*100), title="Support 100", color=supColor, linewidth=2)
plot(getRes(a*150), title="Resistance 150", color=resColor, linewidth=2)
plot(getSup(a*150), title="Support 150", color=supColor, linewidth=2)
plot(getRes(a*200), title="Resistance 200", color=resColor, linewidth=2)
plot(getSup(a*200), title="Support 200", color=supColor, linewidth=2)
plot(getRes(a*250), title="Resistance 250", color=resColor, linewidth=2)
plot(getSup(a*250), title="Support 250", color=supColor, linewidth=2)
plot(getRes(a*300), title="Resistance 300", color=resColor, linewidth=2)
plot(getSup(a*300), title="Support 300", color=supColor, linewidth=2)
plot(getRes(a*350), title="Resistance 350", color=resColor, linewidth=2)
plot(getSup(a*350), title="Support 350", color=supColor, linewidth=2)
plot(getRes(a*400), title="Resistance 400", color=resColor, linewidth=2)
plot(getSup(a*400), title="Support 400", color=supColor, linewidth=2)
plot(getRes(a*450), title="Resistance 450", color=resColor, linewidth=2)
plot(getSup(a*450), title="Support 450", color=supColor, linewidth=2)
plot(getRes(a*500), title="Resistance 500", color=resColor, linewidth=2)
plot(getSup(a*500), title="Support 500", color=supColor, linewidth=2)
plot(getRes(a*750), title="Resistance 750", color=resColor, linewidth=2)
plot(getSup(a*750), title="Support 750", color=supColor, linewidth=2)
plot(getRes(a*1000), title="Resistance 1000", color=resColor, linewidth=2)
plot(getSup(a*1000), title="Support 1000", color=supColor, linewidth=2)
plot(getRes(a*1250), title="Resistance 1250", color=resColor, linewidth=2)
plot(getSup(a*1250), title="Support 1250", color=supColor, linewidth=2)
plot(getRes(a*1500), title="Resistance 1500", color=resColor, linewidth=2)
plot(getSup(a*1500), title="Support 1500", color=supColor, linewidth=2)
Elliott Wave + SMC Fusion # Elliott Wave + SMC Fusion
## TITLE:
Elliott Wave + Smart Money Concepts Fusion
---
## SHORT DESCRIPTION:
Automated Elliott Wave pattern detection with Smart Money Concepts confirmation, EWO oscillator integration, and confluence scoring system.
---
## FULL DESCRIPTION:
### 📊 OVERVIEW
This indicator combines three powerful trading methodologies into a unified system:
- **Elliott Wave Theory** - Automated detection of Wave 1-2 impulse patterns
- **Smart Money Concepts (SMC)** - Order Blocks and Fair Value Gaps for institutional confirmation
- **Elliott Wave Oscillator (EWO)** - Momentum-based signal validation
The core concept is to identify high-probability Wave 3 entries by detecting completed Wave 1-2 structures and validating them with SMC and momentum indicators.
---
### 🔧 HOW IT WORKS
**1. Pattern Detection (ZigZag Method)**
- Uses pivot high/low detection to identify swing points
- Validates Wave 2 retracement using Fibonacci ratios (default: 38.2% - 88.6%)
- Requires minimum wave size to filter noise
- Applies confirmation bars to avoid premature signals
**2. Wave Projections**
- Wave 3 target: Fibonacci extension of Wave 1 (default: 1.618)
- Wave 4 retracement: Percentage of Wave 3 (default: 38.2%)
- Wave 5 projection: Extension of Wave 1 from Wave 4
**3. Smart Money Validation**
- **Order Blocks**: Identifies last opposing candle before breakout (institutional footprint)
- **Fair Value Gaps**: Detects price imbalances for potential support/resistance
**4. EWO Confirmation**
- Calculates momentum: (EMA5 / EMA34 - 1) × 100
- Signal line crossovers confirm trend direction
- Strong signals occur at extremes (< -13 or > 13 threshold)
**5. Confluence Scoring (0-100%)**
Points awarded for:
- Fibonacci quality of Wave 2 retracement (10-30 pts)
- Order Block presence (15 pts)
- Fair Value Gap presence (10 pts)
- Volume confirmation (10-15 pts)
- Trend alignment with EMA50 (10 pts)
- EWO confirmation (10-20 pts)
---
### 🎯 UNIQUE FEATURES
**Pattern Locking System**
- Once a valid pattern is detected, it locks until:
- Pattern invalidates (price breaks Wave 0)
- Pattern completes (Wave 5 reached)
- Auto-timeout (configurable bars)
- Prevents rapid signal flipping and false alerts
**Signal Stability Controls**
- Adjustable cooldown between signals (default: 20 bars)
- Minimum bar distance between wave points
- Direction change requirement option
- Confirmation bars after Wave 2 formation
**Visual Wave Tracking**
- Solid lines for impulse waves (0→1, 2→3, 4→5)
- Dashed lines for corrective waves (1→2, 3→4)
- Numbered labels on each wave point
- Real-time projection lines to targets
**Comprehensive Dashboard**
- Current wave status and lock state
- Pattern grade (A+ to D based on confluence)
- Projected vs actual wave levels (✓ when completed)
- SMC confirmation status
- Risk/Reward ratio calculation
- EWO trend direction
---
### 📈 TRADING APPLICATION
**Entry Strategy**
- Wait for Wave 1-2 pattern detection (diamond signal)
- Check confluence score (>65% = higher probability)
- Verify EWO alignment with pattern direction
- Enter after 30% retracement of Wave 2 (customizable)
**Risk Management**
- Stop Loss: Below Wave 0 (with buffer)
- Take Profit 1: Wave 3 projection
- Take Profit 2: Wave 5 projection
- R:R displayed in dashboard
**Invalidation Rules**
- Price breaks below Wave 0 (bullish) or above (bearish)
- Wave 2 level violated before Wave 3 forms
- Pattern timeout exceeded
---
### ⚙️ KEY SETTINGS
**Elliott Wave**
- ZigZag Length: Pivot detection sensitivity
- Fib Tolerance: Acceptable retracement range
- Min Wave Size: Filter small movements
**Signal Stability**
- Signal Cooldown: Minimum bars between signals
- Lock Pattern Until Invalid: Prevent signal changes
- Confirmation Bars: Wait after Wave 2
**Wave Projection**
- Wave 3/4/5 Fibonacci extensions
- Projection display distance
**EWO Settings**
- Fast/Slow EMA lengths
- Signal smoothing
- Strength threshold
**SMC Settings**
- Order Block lookback period
- FVG minimum size percentage
---
### 🔔 ALERTS
- New bullish/bearish pattern detected
- High confluence setup (>75%)
- Pattern invalidation
- Wave completion
---
### ⚠️ IMPORTANT NOTES
- This indicator identifies **potential** Elliott Wave patterns based on mathematical rules
- Elliott Wave analysis is subjective - patterns may be interpreted differently
- Always combine with other analysis methods and proper risk management
- Past pattern performance does not guarantee future results
- Pattern locking prevents repainting but delays new pattern detection
- Best used on higher timeframes (1H+) for cleaner wave structures
---
### 📚 METHODOLOGY REFERENCES
**Elliott Wave Theory**
- Wave 2 typically retraces 38.2% - 88.6% of Wave 1
- Wave 3 is often the strongest, extending 161.8% of Wave 1
- Wave 4 usually retraces 38.2% of Wave 3
- Wave 5 completes the impulse structure
**Smart Money Concepts**
- Order Blocks represent institutional supply/demand zones
- FVGs indicate price inefficiencies that may act as magnets
**Elliott Wave Oscillator**
- Developed to identify wave momentum
- Crossovers signal potential wave transitions
- Extreme readings often coincide with wave completions
---
### 🎨 VISUAL ELEMENTS
- **Green**: Bullish patterns and projections
- **Red**: Bearish patterns and projections
- **Orange**: Wave projection levels
- **Purple**: Order Block zones
- **Yellow**: Fair Value Gaps
- **Blue**: Entry levels
- **Diamond shapes**: New pattern signals
- **Triangle shapes**: EWO crossover signals
---
### 💡 TIPS FOR BEST RESULTS
1. Use on liquid markets with clear trend behavior
2. Higher timeframes produce more reliable patterns
3. Look for confluence scores above 65%
4. Verify EWO alignment before entry
5. Consider market context (overall trend, key levels)
6. Adjust ZigZag length based on your trading style
7. Increase cooldown period for longer-term signals
---
**Indicator Type**: Overlay
**Markets**: All (Crypto, Forex, Stocks, Commodities)
**Timeframes**: All (1H+ recommended)
**Style**: Pattern Recognition + Momentum + Price Action

EMA Dynamic Crossover Detector with Real-Time Signal TableDescriptionWhat This Indicator Does:This indicator monitors all possible crossovers between four key exponential moving averages (20, 50, 100, and 200 periods) and displays them both visually on the chart and in an organized data table. Unlike standard EMA indicators that only plot the lines, this tool actively detects every crossover event, marks the exact crossover point with a circle, records the precise price level, and maintains a running log of all crossovers during the trading session. It's designed for traders who want comprehensive EMA crossover analysis without manually watching multiple moving average pairs.Key Features:
Four Essential EMAs: Plots 20, 50, 100, and 200-period exponential moving averages with color-coded thin lines for clean chart presentation
Complete Crossover Detection: Monitors all 6 possible EMA pair combinations (20×50, 20×100, 20×200, 50×100, 50×200, 100×200) in both directions
Precise Price Marking: Places colored circles at the exact average price where crossovers occur (not just at candle close)
Real-Time Signal Table: Displays up to 10 most recent crossovers with timestamp, direction, exact price, and signal type
Session Filtering: Only records crossovers during active trading hours (10:00-18:00 Istanbul time) to avoid noise from low-liquidity periods
Automatic Daily Reset: Clears the signal table at the start of each new trading day for fresh analysis
Built-In Alerts: Two alert conditions (bullish and bearish crossovers) that can be configured to send notifications
How It Works:The indicator calculates four exponential moving averages using the standard EMA formula, then continuously monitors for crossover events using Pine Script's ta.crossover() and ta.crossunder() functions:Bullish Crossovers (Green ▲):
When a faster EMA crosses above a slower EMA, indicating potential upward momentum:
20 crosses above 50, 100, or 200
50 crosses above 100 or 200
100 crosses above 200 (Golden Cross when it's the 50×200)
Bearish Crossovers (Red ▼):
When a faster EMA crosses below a slower EMA, indicating potential downward momentum:
20 crosses below 50, 100, or 200
50 crosses below 100 or 200
100 crosses below 200 (Death Cross when it's the 50×200)
Price Calculation:
Instead of marking crossovers at the candle's close price (which might not be where the actual cross occurred), the indicator calculates the average price between the two crossing EMAs, providing a more accurate representation of the crossover point.Signal Table Structure:The table in the top-right corner displays four columns:
Saat (Time): Exact time of crossover in HH:MM format
Yön (Direction): Arrow indicator (▲ green for bullish, ▼ red for bearish)
Fiyat (Price): Calculated average price at the crossover point
Durum (Status): Signal classification ("ALIŞ" for buy signals, "SATIŞ" for sell signals) with color-coded background
The table shows up to 10 most recent crossovers, automatically updating as new signals appear. If no crossovers have occurred during the session within the time filter, it displays "Henüz kesişim yok" (No crossovers yet).EMA Color Coding:
EMA 20 (Aqua/Turquoise): Fastest-reacting, most sensitive to recent price changes
EMA 50 (Green): Short-term trend indicator
EMA 100 (Yellow): Medium-term trend indicator
EMA 200 (Red): Long-term trend baseline, key support/resistance level
How to Use:For Day Traders:
Monitor 20×50 crossovers for quick entry/exit signals within the day
Use the time filter (10:00-18:00) to focus on high-volume trading hours
Check the signal table throughout the session to track momentum shifts
Look for confirmation: if 20 crosses above 50 and price is above EMA 200, bullish bias is stronger
For Swing Traders:
Focus on 50×200 crossovers (Golden Cross/Death Cross) for major trend changes
Use higher timeframes (4H, Daily) for more reliable signals
Wait for price to close above/below the crossover point before entering
Combine with support/resistance levels for better entry timing
For Position Traders:
Monitor 100×200 crossovers on daily/weekly charts for long-term trend changes
Use as confirmation of major market shifts
Don't react to every crossover—wait for sustained movement after the cross
Consider multiple timeframe analysis (if crossovers align on weekly and daily, signal is stronger)
Understanding EMA Hierarchies:The indicator becomes most powerful when you understand EMA relationships:Bullish Hierarchy (Strongest to Weakest):
All EMAs ascending (20 > 50 > 100 > 200): Strong uptrend
20 crosses above 50 while both are above 200: Pullback ending in uptrend
50 crosses above 200 while 20/50 below: Early trend reversal signal
Bearish Hierarchy (Strongest to Weakest):
All EMAs descending (20 < 50 < 100 < 200): Strong downtrend
20 crosses below 50 while both are below 200: Rally ending in downtrend
50 crosses below 200 while 20/50 above: Early trend reversal signal
Trading Strategy Examples:Pullback Entry Strategy:
Identify major trend using EMA 200 (price above = uptrend, below = downtrend)
Wait for pullback (20 crosses below 50 in uptrend, or above 50 in downtrend)
Enter when 20 re-crosses 50 in the trend direction
Place stop below/above the recent swing point
Exit when 20 crosses 50 against the trend again
Golden Cross/Death Cross Strategy:
Wait for 50×200 crossover (appears in the signal table)
Verify: Check if crossover occurs with increasing volume
Entry: Enter in the direction of the cross after a pullback
Stop: Place stop below/above the 200 EMA
Target: Swing high/low or when opposite crossover occurs
Multi-Crossover Confirmation:
Watch for multiple crossovers in the same direction within a short period
Example: 20×50 crossover followed by 20×100 = strengthening momentum
Enter after the second confirmation crossover
More crossovers = stronger signal but also means you're entering later
Time Filter Benefits:The 10:00-18:00 Istanbul time filter prevents recording crossovers during:
Pre-market volatility and gaps
Low-volume overnight sessions (for 24-hour markets)
After-hours erratic movements

Moving Average ProjectionDisplays 2-5 moving averages (solid lines) and projects their future trajectory (dashed lines) based on current trend momentum. This helps you anticipate where key MAs are heading and identify potential future support/resistance levels.
Important: Projections show where MAs would move IF the current trend continues—they're not predictions. Market conditions change, so use projections as planning tools, not trading signals.
General Settings
Number of MAs (2-5) controls how many moving averages display on your chart. Start with 2-3 to avoid clutter. Projection Bars (1-100) determines how far into the future to project—use 10-20 for intraday charts and 20-40 for daily charts. Lookback for Slope (2-100) sets the number of bars used to calculate trend slope, where shorter lookbacks are more responsive and longer ones are smoother. The default of 20 works well for most situations.
Individual MA Settings (MA 1-5)
Each MA has four settings: Length sets the period for the MA (common values are 9, 20, 50, 100, and 200), Type lets you choose between SMA, EMA, WMA, HMA, VWMA, or RMA (EMA is most popular), Color sets the historical MA line color, and Projection Color sets the projected line color (usually a lighter or transparent version of the main color).
MA Types Quick Reference: EMA is most popular and responsive to recent prices. SMA gives equal weight to all periods and is the smoothest. HMA is very responsive with low lag. VWMA incorporates volume data.
Quick Setup Examples
Day Trading: 3 MAs (9/21/50 EMA), 10-15 projection bars, 10-15 lookback
Swing Trading: 2 MAs (50/200 EMA), 20-30 projection bars, 20 lookback
Scalping: 2 MAs (9/20 EMA), 5-10 projection bars, 5-10 lookback
How to Use
Trend Identification: An uptrend shows price above rising MAs with projections pointing up. A downtrend shows price below falling MAs with projections pointing down. Consolidation appears as flat MAs with horizontal projections.
Support & Resistance: Rising MA projections act as future dynamic support levels, while falling MA projections act as future dynamic resistance levels.
Anticipating Changes: Watch for projected MA crossovers before they happen. When projections converge, expect volatility or consolidation. Steep projections suggest unsustainable trends, so be cautious. Flat projections indicate ranging markets.
Trade Planning: Check the current trend using MA alignment, then look at projections to gauge trend continuation likelihood. Use projected MA levels for potential targets or stop placement.
Important Tips
When Projections Work Best: Projections are most reliable in stable trending markets with consistent momentum, low volatility environments, and away from major news events.
When to Be Cautious: Use caution during high volatility or choppy price action, around major economic releases, when projections show extreme or parabolic angles, and during trend transitions.
Combine With Other Analysis: Don't trade projections alone. Use them alongside price action, volume, support and resistance levels, and other indicators for confirmation.
Best Practices
Start with 2-3 MAs to avoid chart clutter. Match your projection and lookback bars to your trading timeframe. Use consistent color schemes for quick interpretation. Adjust settings as market conditions change. Always use proper risk management—projections are planning tools, not guarantees.
Troubleshooting
Projections not showing: Check that Projection Bars > 0 and you're viewing the most recent bar
Chart too cluttered: Reduce number of MAs or increase projection color transparency
Projections too volatile: Increase lookback bars or switch to EMA/SMA from HMA
Can't see certain MAs: Verify "Number of MAs" setting includes them (MA 3 won't show if set to 2)
