Root mean squared error range (RMSER)Similarly to Bollinger bands, the RMSER gives a support and resistance areas for the trading price. Unlike bollinger bands, which use standard deviation, this support and resistance is calculated with 2 * the root mean squared error away from the moving average. This works very well with indices, like $SPX, and prices only fall outside the range during black swan events like the 2020 crash.
Cari skrip untuk "2020年+国债收益率"

[blackcat] L1 Vitali Apirine OBVMLevel 1
Background
Traders’ Tips of April 2020, the focus is Vitali Apirine’s article in the April issue, “On-Balance Volume Modified (OBVM)”.
Function
In “On-Balance Volume Modified (OBVM)” in this issue, author Vitali Apirine presents a new indicator called OBVM that is based on the classic on-balance volume indicator originally developed by Joe Granville. The author has smoothed the OBV calculation and has added a signal line to help the trader identify entry and exit points. Apirine also notes that the OBVM indicator is useful in helping to identify divergences.
Remarks
Feedbacks are appreciated.

[blackcat] L1 Vitali Apirine Compare Price Momentum OscillatorLevel 1
Background
Traders’ Tips of August 2020, the focus is Vitali Apirine’s article in the August issue, “The Compare Price Momentum Oscillator (CPMO)”.
Function
In his article in this issue, “The Compare Price Momentum Oscillator (CPMO),” author Vitali Apirine reintroduces us to the DecisionPoint PMO originally developed by Carl Swenlin and presents a new way to use it to compare the relative momentum of two different securities. Trading signals can be derived in a number of ways including momentum, signal line, and zero-line crossovers.
Remarks
This is a Level 1 free and open source indicator.
Feedbacks are appreciated.

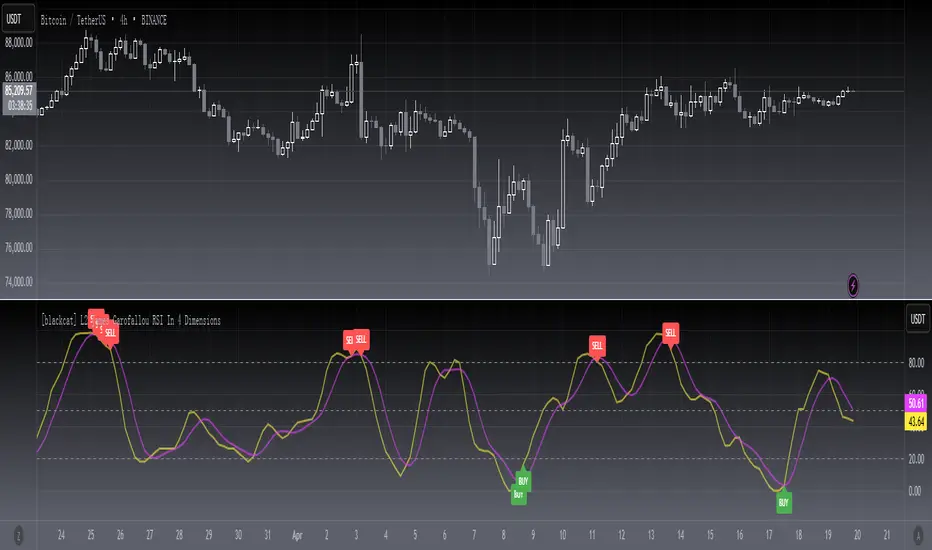
[blackcat] L2 James Garofallou RSI In 4 DimLevel 2
Background
Traders’ Tips of September 2020, the focus is James Garofallou’s article in the September issue, “Tracking Relative Strength In Four Dimensions”.
Function
In “Tracking Relative Strength In Four Dimensions” in this issue, author James Garofallou introduces us to a new method of measuring the relative strength of a security. This new technique creates a much broader reference than would be obtained by using a single security or index and combines several dimensions, as the author calls them, into a single rank value. This study compares a security to another in four dimensions, as explained in the article. James Garofallou presents a metric for a security’s strength relative to 11 major market sectors and over several time periods. All this is squeezed into a single value. The first step is the RS2. It normalizes the security to a market index, then calculates four moving averages and encodes their relations in a returned number. I just modified it by using most BTC-correlated instruments to reflect how BTC response to their performance.
Remarks
This is a Level 2 free and open source indicator.
Feedbacks are appreciated.
Esqvair's Neural Reversal Probability IndicatorIntroduction
Esqvair's Neural Reversal Probability Indicator is the indicator that shows probability of reversal.
Warning: This script should only be used on 1 minute chart.
How to use
When a signal appears (by default it is a green bar), a reversal should be expected.
The signal appears when the indicator value >= Threshold.
If you want more signals, you must lower the threshold, if less, you must increase the threshold.
For some assets, like Forex pairs, you have to optimize the threshold yourself, but for most stocks, the default threshold works well.
How well a threshold fits an asset depends on the volatility of the asset.
For most assets, the indicator ranges from 35 to 75.
Settings
Smoothing - The default is 1, which means no smoothing. Indicator smoothing by SMA.
Threshold - default 71.0 is responsible for the occurrence of signals, read "How to use" part to learn more
The Indicator
This indicator is a pre-trained neural network that was trained outside of TradingView and then its structure and weights values were converted to PineScript.
Warning: A neural network is a black box in the sense that although it can approximate any function, studying its structure will not give you any idea about the structure of the function being approximated.
Possible questions
Why does the indicator value most time range from 35 to 75 when the probability should ranges from 0 to 100?
-Due to some randomness in the markets, a neural network can never be 100% sure.
What data was used to train the neural network?
-This was BTCUSD 1 minute chart data from 02/05/2020 to 02/05/2022.
Where did you train the neural network and convert it to PineScript?
-I used a programming language that I know.

NormalizedOscillatorsLibrary "NormalizedOscillators"
Collection of some common Oscillators. All are zero-mean and normalized to fit in the -1..1 range. Some are modified, so that the internal smoothing function could be configurable (for example, to enable Hann Windowing, that John F. Ehlers uses frequently). Some are modified for other reasons (see comments in the code), but never without a reason. This collection is neither encyclopaedic, nor reference, however I try to find the most correct implementation. Suggestions are welcome.
rsi2(upper, lower) RSI - second step
Parameters:
upper : Upwards momentum
lower : Downwards momentum
Returns: Oscillator value
Modified by Ehlers from Wilder's implementation to have a zero mean (oscillator from -1 to +1)
Originally: 100.0 - (100.0 / (1.0 + upper / lower))
Ignoring the 100 scale factor, we get: upper / (upper + lower)
Multiplying by two and subtracting 1, we get: (2 * upper) / (upper + lower) - 1 = (upper - lower) / (upper + lower)
rms(src, len) Root mean square (RMS)
Parameters:
src : Source series
len : Lookback period
Based on by John F. Ehlers implementation
ift(src) Inverse Fisher Transform
Parameters:
src : Source series
Returns: Normalized series
Based on by John F. Ehlers implementation
The input values have been multiplied by 2 (was "2*src", now "4*src") to force expansion - not compression
The inputs may be further modified, if needed
stoch(src, len) Stochastic
Parameters:
src : Source series
len : Lookback period
Returns: Oscillator series
ssstoch(src, len) Super Smooth Stochastic (part of MESA Stochastic) by John F. Ehlers
Parameters:
src : Source series
len : Lookback period
Returns: Oscillator series
Introduced in the January 2014 issue of Stocks and Commodities
This is not an implementation of MESA Stochastic, as it is based on Highpass filter not present in the function (but you can construct it)
This implementation is scaled by 0.95, so that Super Smoother does not exceed 1/-1
I do not know, if this the right way to fix this issue, but it works for now
netKendall(src, len) Noise Elimination Technology by John F. Ehlers
Parameters:
src : Source series
len : Lookback period
Returns: Oscillator series
Introduced in the December 2020 issue of Stocks and Commodities
Uses simplified Kendall correlation algorithm
Implementation by @QuantTherapy:
rsi(src, len, smooth) RSI
Parameters:
src : Source series
len : Lookback period
smooth : Internal smoothing algorithm
Returns: Oscillator series
vrsi(src, len, smooth) Volume-scaled RSI
Parameters:
src : Source series
len : Lookback period
smooth : Internal smoothing algorithm
Returns: Oscillator series
This is my own version of RSI. It scales price movements by the proportion of RMS of volume
mrsi(src, len, smooth) Momentum RSI
Parameters:
src : Source series
len : Lookback period
smooth : Internal smoothing algorithm
Returns: Oscillator series
Inspired by RocketRSI by John F. Ehlers (Stocks and Commodities, May 2018)
rrsi(src, len, smooth) Rocket RSI
Parameters:
src : Source series
len : Lookback period
smooth : Internal smoothing algorithm
Returns: Oscillator series
Inspired by RocketRSI by John F. Ehlers (Stocks and Commodities, May 2018)
Does not include Fisher Transform of the original implementation, as the output must be normalized
Does not include momentum smoothing length configuration, so always assumes half the lookback length
mfi(src, len, smooth) Money Flow Index
Parameters:
src : Source series
len : Lookback period
smooth : Internal smoothing algorithm
Returns: Oscillator series
lrsi(src, in_gamma, len) Laguerre RSI by John F. Ehlers
Parameters:
src : Source series
in_gamma : Damping factor (default is -1 to generate from len)
len : Lookback period (alternatively, if gamma is not set)
Returns: Oscillator series
The original implementation is with gamma. As it is impossible to collect gamma in my system, where the only user input is length,
an alternative calculation is included, where gamma is set by dividing len by 30. Maybe different calculation would be better?
fe(len) Choppiness Index or Fractal Energy
Parameters:
len : Lookback period
Returns: Oscillator series
The Choppiness Index (CHOP) was created by E. W. Dreiss
This indicator is sometimes called Fractal Energy
er(src, len) Efficiency ratio
Parameters:
src : Source series
len : Lookback period
Returns: Oscillator series
Based on Kaufman Adaptive Moving Average calculation
This is the correct Efficiency ratio calculation, and most other implementations are wrong:
the number of bar differences is 1 less than the length, otherwise we are adding the change outside of the measured range!
For reference, see Stocks and Commodities June 1995
dmi(len, smooth) Directional Movement Index
Parameters:
len : Lookback period
smooth : Internal smoothing algorithm
Returns: Oscillator series
Based on the original Tradingview algorithm
Modified with inspiration from John F. Ehlers DMH (but not implementing the DMH algorithm!)
Only ADX is returned
Rescaled to fit -1 to +1
Unlike most oscillators, there is no src parameter as DMI works directly with high and low values
fdmi(len, smooth) Fast Directional Movement Index
Parameters:
len : Lookback period
smooth : Internal smoothing algorithm
Returns: Oscillator series
Same as DMI, but without secondary smoothing. Can be smoothed later. Instead, +DM and -DM smoothing can be configured
doOsc(type, src, len, smooth) Execute a particular Oscillator from the list
Parameters:
type : Oscillator type to use
src : Source series
len : Lookback period
smooth : Internal smoothing algorithm
Returns: Oscillator series
Chande Momentum Oscillator (CMO) is RSI without smoothing. No idea, why some authors use different calculations
LRSI with Fractal Energy is a combo oscillator that uses Fractal Energy to tune LRSI gamma, as seen here: www.prorealcode.com
doPostfilter(type, src, len) Execute a particular Oscillator Postfilter from the list
Parameters:
type : Oscillator type to use
src : Source series
len : Lookback period
Returns: Oscillator series

BTC Cap Dominance RSIBTC Cap Dominance RSI indicator is a combination of the RSI of Bitcoin Market Cap and the RSI of Bitcoin Dominance. The concept of this indicator is to get a good grasp of the bitcoin market flow by combining bitcoin dominance as well as bitcoin market cap.
BTC Cap Dominance (BCD) RSI is defined as:
BCD RSI = (BTC Cap RSI + BTC Dominance RSI) / 2
Case 1 (Bull market):
Both Cap RSI and Dominance RSI values are high
Case 2 (Neutral market):
Cap RSI is high but Dominance RSI is low
Cap RSI is low but Dominance RSI is high
Case 3 (Bear market):
Both Cap RSI and Dominance RSI values are low
(Note) Please note that the market capitalization symbols (CRYPTOCAP:TOTAL and CRYPTOCAP:TOTAL2) of TradingView started in January 2020, so you can check the indicator value from this point on.

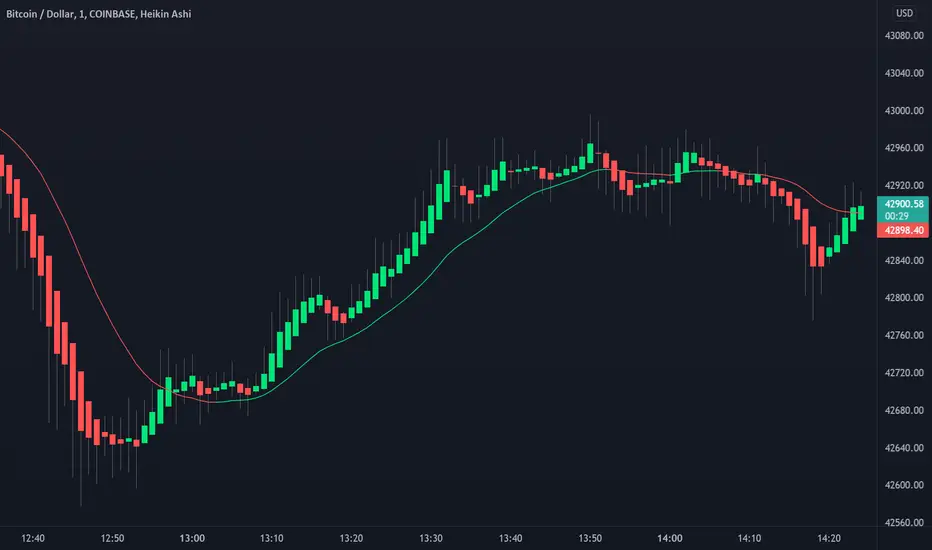
Heikin Ashi Candles [Improved] - real closing priceHeikin Ashi Candles - with real closing price!, and with a Heikin Ashi based moving average!
One of the main functionality of Heikin Ashi is to provide a smoothed price to get clarity in trends. This script builds upon the Heikin Ashi Candlestick I published in 2020 that took the standard Heikin Ashi calculations and added the actual closing price.
The improved version adds a new smoothing calculation to give traders an even better way to display trends. In addition to that, a Heikin Ashi based moving average is added to guide you to take trades in the trend direction. The best part is the users have the ability to display both the real closing price and the Improved Heikin Ashi closing price.
With a few modifications within the smoothing settings, the users can get features like Candle Cloud that provides traders with functionalities like Ichimoku clouds.
Usage:
This indicator serves as a trend tool with enhanced features of the original Heikin Ashi calculations. The indicator help traders to take trades in the same direction of the trend. The new improved version gives traders a new better way to make use of all Heikin Ashi strategies that have been developed during the years. Apply the same methods with this new version.
Disclaimer: No financial advice, only for educational/entertainment purposes.
XLNX-AMD arb calcOn October 27th 2020, AMD formally announced an acquisition of Xilinx , Inc for 35B.
Per the terms of the deal, each 1 Xilinx share was to be converted into 1.7234 AMD shares.
This script visualizes the upside gap between current Xilinx price and expected closing price as a percentage.

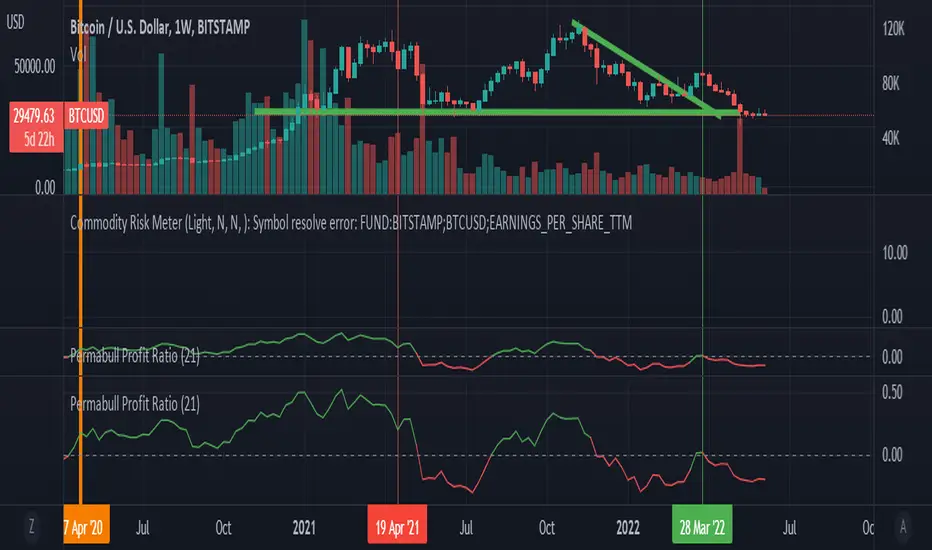
Permabull Profit RatioCumulative profit/loss of market bulls.
Price is only half the story - volume is just as important. This indicator combines both to calculate the ratio of profitable longs to losing longs.
Presumably the banks like to reset this to negative territory now and then (eg March 2020) - which is always a great time to buy. Right now we see a modern record of profitable longs - probably not the best entry, but not an indicator of imminent doom. However it does mean that the "fall will be great" when it comes.
Price is only half the story - volume is just as important. This indicator combines both to calculate the cumulative profit/loss of market bulls.
How Old Is this Bull Run Getting? Check MA Test Bars SinceThere are many price-based techniques for anticipating the end of a move. However, the simple passage of time can also help because bull markets don’t last forever. While old age doesn’t necessarily cause investors to sell, a reversal becomes more likely the longer a trend lasts.
So, how long have prices been going up? There are various ways to measure that. Our earlier script, MA streak , offered one solution by counting the number of bars that a given moving average has been rising or falling.
Today’s script takes a different approach by counting the number of candles since price touched or crossed a given moving average. It tracks the 50-day simple moving average (SMA) by default. It can be adjusted to other types like exponential and weighted with the AvgType input.
In the chart above, Bars Since MA Test was adjusted to use the 200-day SMA. Viewing the S&P 500 with this study helps put the current market into context.
We can see that prices last touched the 200-day SMA 386 sessions ago (June 29, 2020). That’s relatively long based on history, but not unprecedented. For example, the indicator was at 407 in February 2018 as the market pulled back. It also hit 475 in October 2014 (following the breakout above 2007 highs).
Additionally, the S&P 500 is nearing the record of the 1990s bull market (393 candles on July 12, 1996).
Before that, you have to look all the way back to the 1950s, when it twice peaked at 627.
The conclusion? The current run without a test of the 200-day SMA is above average, but not yet record-setting. It may be interesting to watch as earnings season approaches and the Federal Reserve looks to tighten monetary policy.
TradeStation is a pioneer in the trading industry, providing access to stocks, options, futures and cryptocurrencies. See our Overview for more.
Important Information
TradingView is not affiliated with TradeStation Securities Inc. or its affiliates. TradeStation Securities, Inc., TradeStation Crypto, Inc., and TradeStation Technologies, Inc. are each wholly owned subsidiaries of TradeStation Group, Inc., all operating, and providing products and services, under the TradeStation brand and trademark. When applying for, or purchasing, accounts, subscriptions, products and services, it is important that you know which company you will be dealing with. Please click here for further important information explaining what this means.
This content is for informational and educational purposes only. This is not a recommendation regarding any investment or investment strategy. Any opinions expressed herein are those of the author and do not represent the views or opinions of TradeStation or any of its affiliates.
Investing involves risks. Past performance, whether actual or indicated by historical tests of strategies, is no guarantee of future performance or success. There is a possibility that you may sustain a loss equal to or greater than your entire investment regardless of which asset class you trade (equities, options, futures, or digital assets); therefore, you should not invest or risk money that you cannot afford to lose. Before trading any asset class, first read the relevant risk disclosure statements on the Important Documents page, found here: www.tradestation.com .

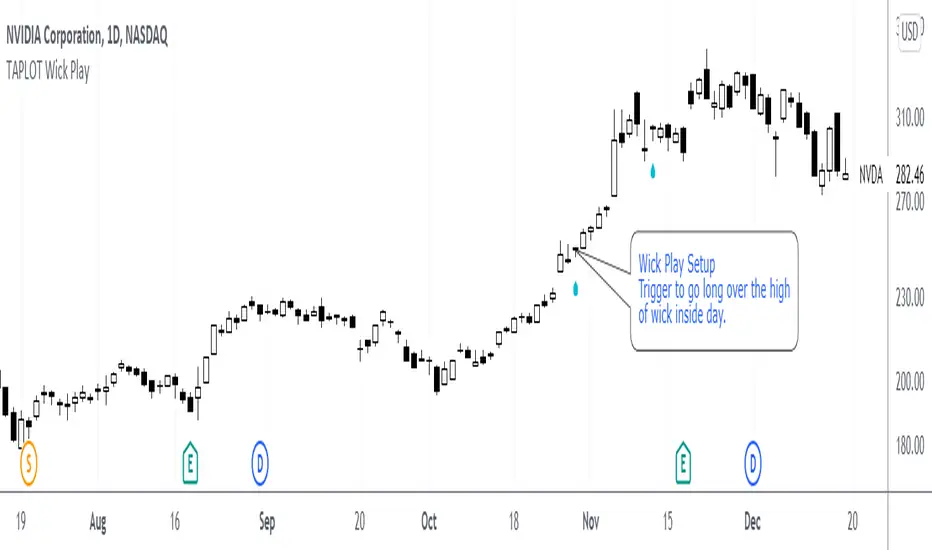
TAPLOT Wick PlayWick play is a candle stick long setup popularized by 2020 US Investing Champion Oliver Kell
Wick Play is a setup in which:
Strong stock with momentum to the upside closes off the highs of the day in yesterdays session.
Today's session opens in the candle "wick" of yesterdays bar.
If stock holds in the wick and doesn't trade in the body of yesterdays candle, it is a sign of strength.
Trigger happens on day 3 when price moves over the high of the wick inside day.
It is important to note that this setup should not be traded in isolation. Not every wick play is buyable.
This is to be used in the context of strong stocks like True Market Leaders and with buying momentum behind them.
Indicator places an up arrow under the candle setup. It also colors the candle itself. All configurable through indicator settings.
Cheers!
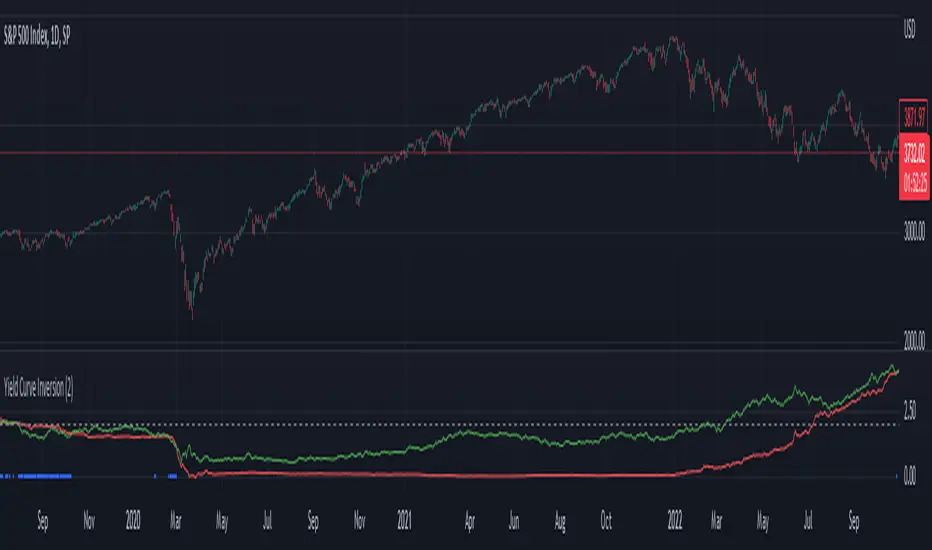
Yield Curve Inversion IndicatorIntroduction
The last time (as of this publishing) that this indicator detected an inverted interest rate yield curve was on February 20th, 2020 at 12:30pm EST, the afternoon before the S&P500 began one of its largest crashes in US history. The vast majority of major economic recessions since the 1950's have been preceded by an interest rate yield curve inversion. I created this indicator originally as an input to study the impacts of more conservative risk management on quantitative trading strategies following a yield curve inversion event. It is being shared with the community as a quick indicator to check to see the comparative status of short term and long term interest rates, and as an indicator where you can easily check to see if we are experiencing an inverted yield curve in real-time.
Background of the significance of an inverted yield curve:
"What an inverted yield curve really means is that most investors believe that short-term interest rates are going to fall sharply at some point in the future. As a practical matter, recessions usually cause interest rates to fall. Historically, inversions of the yield curve have preceded recessions in the U.S. Due to this historical correlation, the yield curve is often seen as a way to predict the turning points of the business cycle. When the yield curve inverts, short-term interest rates become higher than long-term rates. This type of yield curve is the rarest of the three main curve types and is considered to be a predictor of economic recession. Because of the rarity of yield curve inversions, they typically draw attention from all parts of the financial world." (www.investopedia.com)
Settings and Usage
This indicator pulls in pricing data from tickers that represent short term and long term interest rates, and compares them. The red line represents short term interest rates, and the green line represents long term interest rates. When the red line is above the green line, it indicates that we are experiencing a yield curve inversion. Small blue crosses also appear on the bottom of the indicator during an inversion to further highlight the event visually. This indicator pulls in the same information on the same two interest rate tickers regardless of what chart it is applied to.
Other Thoughts
This script uses the f_secureSecurity function as a best practice. For those that are versed in PineScript, code from this indicator could be adapted to be applied to an interest rate chart that allows custom alerts to be created the moment that there is an inverted interest rate yield curve.
FBMKLCI VolumeVolume for FBMKLCI Malaysia. Note that the volume starts on 27th Oct 2020 due to the change of securities in index. There are 30 securities combined into single volume.

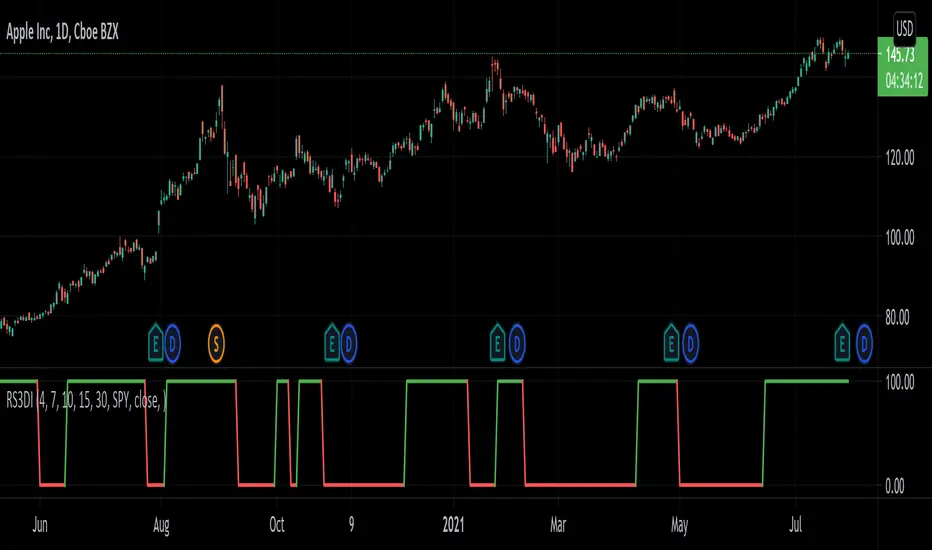
Relative Strength 3D Indicator [CC]This is a custom indicator of mine loosely based on the work by James Garofallou (Stocks and Commodities Sep 2020 pg 14) and this is meant for medium to long term trend confirmations. The idea behind this indicator is to capture 3 different dimensions of trend strength. The first dimension captures the overall strength of the underlying stock vs the market (in this case the S&P 500). The second dimension captures the overall trend strength by assigning a scoring system so when all faster moving averages are stronger than slower moving averages then it gets the max points. The final dimension is the strength of the overall strength of everything so far. Buy when the indicator line turns green and sell when it turns red.
Let me know if there are any other indicators or scripts you would like to see me publish!
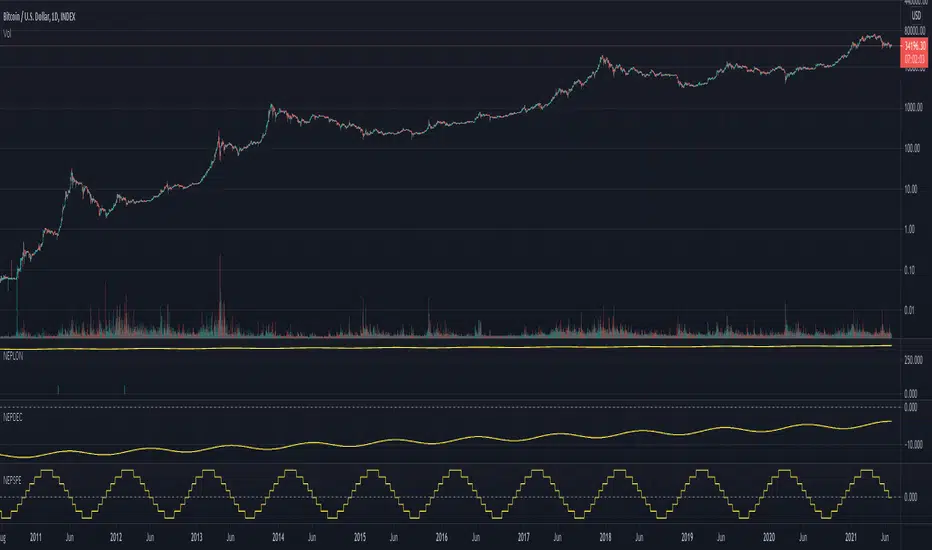
Financial Astrology Neptune SpeedNeptune retrograde and stationary phases indicates periods of delusion, on that moments the traders optimism bubble is burst, as consequence, we can see that most of this retrograde speed phase periods correlates with BTCUSD price correction or consolidation periods. Is very clear to see in the chart that only once, the Neptune retrogradation occurrence in September 2020, resulted in price growth. Therefore, periods of price growth and optimism are more likely when Neptune is direct.
Note: The Neptune speed indicator is based on an ephemeris array that covers years 2010 to 2030, prior or after this years the speed is not available, this daily ephemeris are based on UTC time so in order to align properly with the price bars times you should set UTC as your chart timezone.
5MA_X_LThis is a 5 day moving average crossing long strategy in 10 min. chart, used in short term momentum trading strategy.
Momentum trading Strategy: When S&P 500 index is at up trend (or above 60 sma ), buy 10+ stocks in top 20% stock RS ranking at equal weight using this MA5X_L strategy. Change stocks when any stock exited by algorithm.
Back test start since 2020/7/1, each long entry for condition 1 is $30000, condition 2 is $20000, with max of 2 long positions.
Setup: 10 minutes chart
Buy condition 1) 3 wma cross up 195 wma (5day) 2) 3wma > 78wma > 195wma UP Trend Arrangement (UTA)
Exit condition 1) 3 wma cross under 195 wma 2) position profit > 20% and 3 wma cross under 6 ATRs line (green)

Sortino RatioThe Sortino ratio is a variation of the Sharpe ratio that differentiates harmful volatility from total overall volatility using the asset's standard deviation of negative portfolio returns—downside deviation—instead of the total standard deviation of portfolio returns. The Sortino ratio takes an asset or portfolio's return and subtracts the risk-free rate and then divides that amount by the asset's downside deviation. The ratio was named after Frank A. Sortino.
What Can the Sortino Ratio Tell You?
The Sortino ratio is useful for investors, analysts, and portfolio managers to evaluate an investment's return for a given level of bad risk. Since this ratio uses only the downside deviation as its risk measure, it addresses the problem of using total risk, or standard deviation, which is important because upside volatility is beneficial to investors and isn't a factor most investors worry about.
The Difference Between the Sortino Ratio and the Sharpe Ratio
The Sortino ratio improves upon the Sharpe ratio by isolating downside or negative volatility from total volatility by dividing excess return by the downside deviation instead of the total standard deviation of a portfolio or asset.
The Sharpe ratio punishes the investment for good risk, which provides positive returns for investors. However, determining which ratio to use depends on whether the investor wants to focus on total or standard deviation or just downside deviation.
CONCLUSION: THE HIGHER THE RATIO, THE BETTER IT IS.
Note: The default risk-free rate is based on the Malaysian rate. Please change based on your country rate.
Note: The default length is based on 1 year Malaysia trading day (11/6/2020 - 11/6/2021).
Note: Sortino ratio is good for assessing a long-term investment, and thus, please use a longer time frame to get a better risk assessment.
Please let me know if this script contains any mistake. Cheers!

Relative Difference Of Squares Oscillator [CC]The Relative Difference Of Squares Oscillator was created by Marco Alves (Stocks and Commodities Aug 2020 pg 10) and this is a heavily customized version of his indicator that works for single stocks instead of the entire market. I have included extra buy and sell signals to account for strong signals vs normal signals based on some user feedback I got. Buy when the line turns green and sell when it turns red. Keep in mind that this is a lagging indicator so good for trend confirmation.
Let me know if there are any other scripts you would like to see me publish!

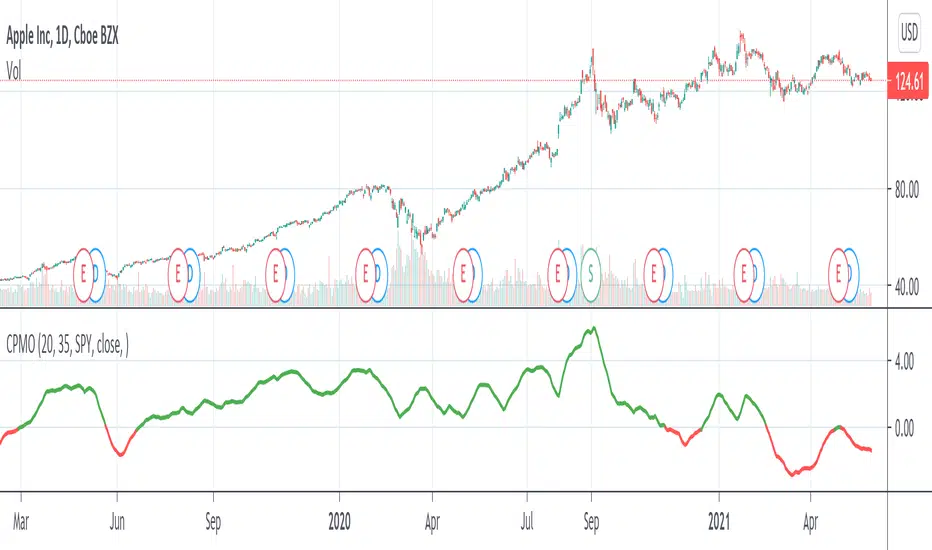
Compare Price Momentum Oscillator [CC]The Compare Price Momentum Oscillator was created by Vitali Apirine (Stocks and Commodities Aug 2020 pg 16) and this is a handy indicator to compare the momentum of the current symbol you are looking at to the s&p to determine the relative strength of the underlying security. Buy when the line turns green and sell when it turns red.
Let me know if there are any other scripts you would like to see me publish!
Tripple super Trend + EMA + RSI StrategyGreetings!
Here I show you the Tripple Super Trend Strategy.
I discovered the strategy on a YouTube channel and tried to transfer it as a strategy into a script.
Tested with the currency pair EUR/USD in the one hour chart.
Period: beginning of 2020 until today.
The strategy should also work with cryptocurrencies. But then the settings have to be adjusted.
There is the possibility to activate only long or only short position.
The EMA can be used in a time different from the chart.
-----------------------------------------------------------------------------------
How does the strategy work?
For long positions, the candle must be above the EMA .
The candle must be closed above at least two of the supertrend lines.
The stochastic RSI must show oversold and the k line must cross over the D line.
For short positions, the candle must be below the EMA .
The candle must be closed below at least two of the supertrend lines.
The stochastic RSI must indicate overbought and the K line must cross below the D line.
The stop loss is determined with the "lowest low/highest high lookback".
The profit factor is multiplied by the value of the lowest low/highest high lookback.
The results of the strategy are without commissions and levers.
If you have any questions or feedback, please let me know in the comments.
In the future I will add other types of stop loss / take profits. (ATR; %; eg.)
If you need more information about the strategy and want to know exactly how to apply it, check out my profile.
I wish you good luck with the strategy!

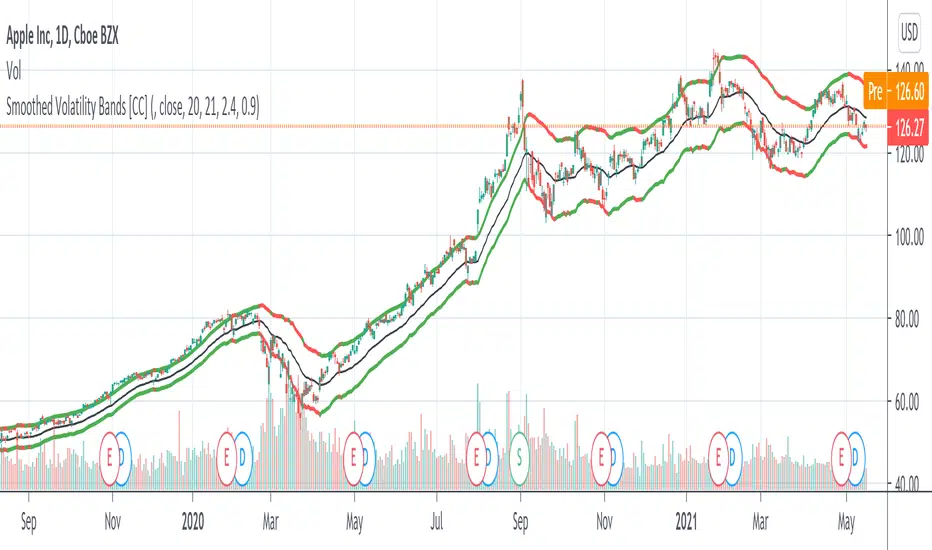
Smoothed Volatility Bands [CC]The Smoothed Volatility Bands were created by Sylvain Vervoort (Stocks and Commodities Sep 2020 pg 19) and this is a heavily customized version of regular Bollinger Bands that take volatility into account. Feel free to change the moving average since Vervoort recommended trying that out. Buy when the indicator line turns green and sell when it turns red.
Let me know if there are any other indicators you want me to publish!
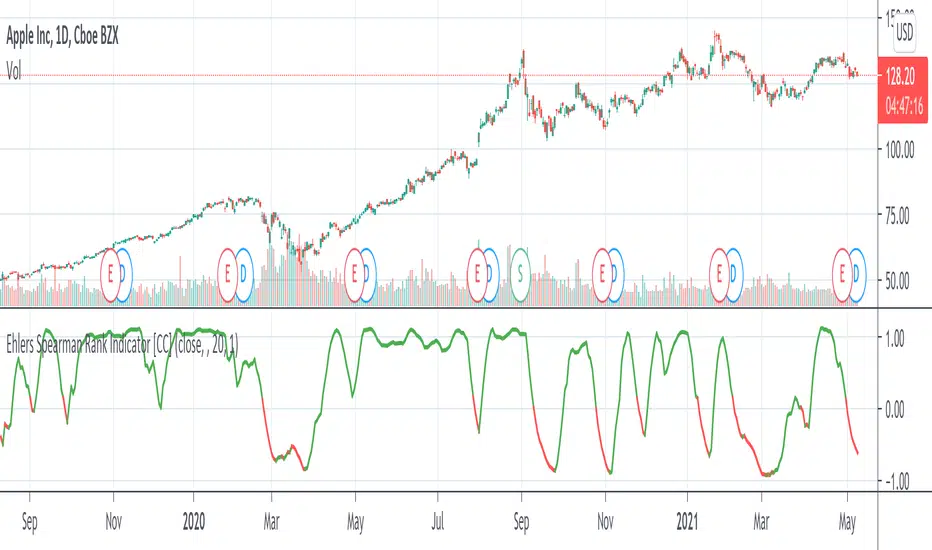
Ehlers Spearman Rank Indicator [CC]The Spearman Rank Indicator was created by John Ehlers (Stocks and Commodities July 2020 pg 6) and this works well as a trend confirmation indicator. This is obviously his take on the Spearman Ranking Correlation and make sure to let me know what you think! Buy when the line turns green and sell when it turns red.
Let me know if there are any other indicators you want me to publish!