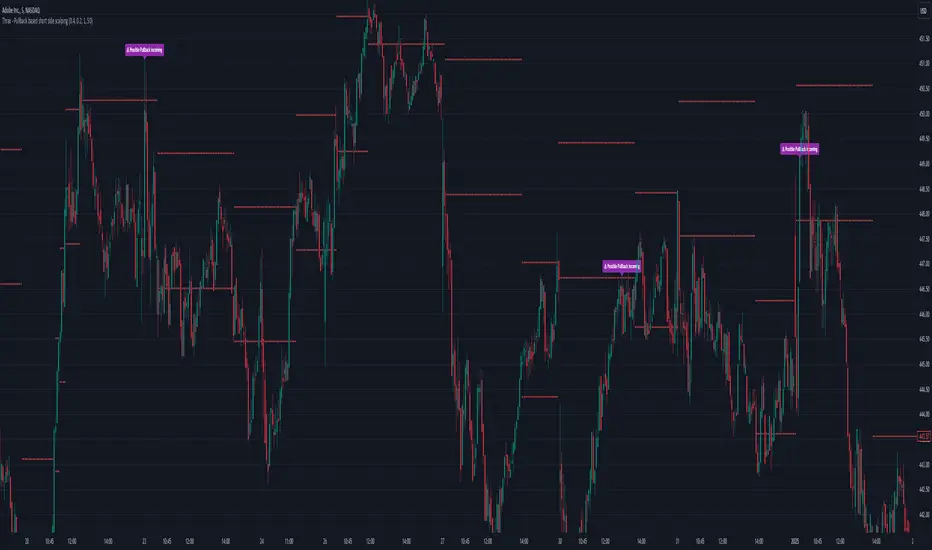
Thrax - Pullback based short side scalping⯁ This indicator is built for short trades only.
⤞ Pullback based scalping is a strategy where a trader anticipates a pullback and makes a quick scalp in this pullback. This strategy usually works in a ranging market as probability of pullbacks occurrence in ranging market is quite high.
⤞ The strategy is built by first determining a possible candidate price levels having high chance of pullbacks. This is determined by finding out multiple rejection point and creating a zone around this price. A rejection is considered to be valid only if it comes to this zone after going down by a minimum pullback percentage. Once the price has gone down by this minimum pullback percentage multiple times and reaches the zone again chances of pullback goes high and an indication on chart for the same is given.
⯁ Inputs
⤞ Zone-Top : This input parameter determines the upper range for the price zone.
⤞ Zone bottom : This input parameter determines the lower range for price zone.
⤞ Minimum Pullback : This input parameter determines the minimum pullback percentage required for valid rejection. Below is the recommended settings
⤞ Lookback : lookback period before resetting all the variables
⬦Below is the recommended settings across timeframes
⤞ 15-min : lookback – 24, Pullback – 2, Zone Top Size %– 0.4, Zone Bottom Size % – 0.2
⤞ 5-min : lookback – 50, pullback – 1% - 1.5%, Zone Top Size %– 0.4, Zone Bottom Size % – 0.2
⤞ 1-min : lookback – 100, pullback – 1%, Zone Top Size %– 0.4, Zone Bottom Size % – 0.2
⤞ Anything > 30-min : lookback – 11, pullback – 3%, Zone Top Size %– 0.4, Zone Bottom Size % – 0.2
✵ This indicator gives early pullback detection which can be used in below ways
1. To take short trades in the pullback.
2. To use this to exit an existing position in the next few candles as pullback may be incoming.
📌 Kindly note, it’s not necessary that pullback will happen at the exact point given on the chart. Instead, the indictor gives you early signals for the pullback
⯁ Trade Steup
1. Wait for pullback signal to occur on the chart.
2. Once the pullback warning has been displayed on the chart, you can either straight away enter the short position or wait for next 2-4 candles for initial sign of actual pullback to occurrence.
3. Once you have initiated short trade, since this is pullback-based strategy, a quick scalp should be made and closed as price may resume it’s original direction. If you have risk appetite you can stay in the trade longer and trial the stops if price keeps pulling back.
4. You can zone top as your stop, usually zone top + some% should be used as stop where ‘some %’ is based on your risk appetite.
5. It’s important to note that this indicator gives early sings of pullback so you may actually wait for 2-3 candles post ‘Pullback warning’ occurs on the chart before entering short trade.
Cari skrip untuk "11月1日是什么星座"
Smart Money Breakouts [iskess 01-02 11:05]This is an big update to the excellent Smart Money Breakout Script published in Oct 2023 by ChartPrime who, to my knowledge, was the original author.
FULL CREDIT GOES TO CHARTPRIME FOR THIS ORIGINAL WORK.
Per the moderator's rules, you will find below a meaningful, detailed self-contained description that does not rely on delegation to the open source code or links to other content. You will find in the description details on what the script does, how it does that, how to use it, and how it is original.
The "Smart Money Breakouts" indicator is designed to identify breakouts based on changes in character (CHOCH) or breaks of structure (BOS) patterns, facilitating automated trading with user-defined Take Profit (TP) level.
The indicator incorporates essential elements such as volume analysis and a data table to assist traders in optimizing their strategies.
🔸Breakout Detection:
The indicator scans price movements for "Change in Character" (CHOCH) and "Break of Structure" (BOS) patterns, signaling potential breakout opportunities in the market.
🔸User-Defined TP/SL :
Traders can customize the Take Profit (TP) and Stop Loss (SL) through the indicator settings, with these levels dynamically calculated based on the Average True Range (ATR). This allows for precise risk management and profit targets that adapt to market volatility. Traders can also select the lookback period for the TP/SL calculations.
🔸Volume Analysis and Trade Direction Specific Analysis:
The indicator includes a volume checker that provides valuable insights into the strength of the breakout, taking into account trade direction.
🔸If the volume label is red and the trade is long, it suggests a higher likelihood of hitting the Stop Loss (SL).
🔸If the volume label is green and the trade is long, it indicates a higher probability of hitting the Take Profit (TP).
🔸For short trades, a red volume label suggests a higher likelihood of hitting TP, while a green label suggests a higher likelihood of hitting SL.
🔸A yellow volume label suggests that the volume is inconclusive, neither favoring bullish nor bearish movements.
🔸Data Table:
The indicator features a data table that keeps track of the number of winning and losing trades for specific timeframes or configurations. It also shows the percentage of profits vs losses, and the overall profit/loss for the selected lookback period.
This table serves as a valuable tool for traders to analyze performance and discover optimal settings and timeframes.
The "Smart Money Breakouts" indicator provides traders with a comprehensive solution for breakout trading, combining technical analysis of changes in character and breaks of structure, volume insights, and performance tracking while dynamically adjusting TP and SL levels based on market volatility through the ATR.
This version of the script is a "significant improvement" from Chart Prime's original work in the following ways:
- A selectable range of candles for the profit/loss calculations to look back on.
- An updated table that includes the percentage of wins/losses, and and overall P&L during the selected lookback range.
- The user can now select only Long trades, Short trades, or both.
- The percentage gain/loss is now indicated for every trade on the chart.
- The user can now select a different multiplier for Stop Loss or Take Profit thresholds.

Volatility IndicatorThe volatility indicator presented here is based on multiple volatility indices that reflect the market’s expectation of future price fluctuations across different asset classes, including equities, commodities, and currencies. These indices serve as valuable tools for traders and analysts seeking to anticipate potential market movements, as volatility is a key factor influencing asset prices and market dynamics (Bollerslev, 1986).
Volatility, defined as the magnitude of price changes, is often regarded as a measure of market uncertainty or risk. Financial markets exhibit periods of heightened volatility that may precede significant price movements, whether upward or downward (Christoffersen, 1998). The indicator presented in this script tracks several key volatility indices, including the VIX (S&P 500), GVZ (Gold), OVX (Crude Oil), and others, to help identify periods of increased uncertainty that could signal potential market turning points.
Volatility Indices and Their Relevance
Volatility indices like the VIX are considered “fear gauges” as they reflect the market’s expectation of future volatility derived from the pricing of options. A rising VIX typically signals increasing investor uncertainty and fear, which often precedes market corrections or significant price movements. In contrast, a falling VIX may suggest complacency or confidence in continued market stability (Whaley, 2000).
The other volatility indices incorporated in the indicator script, such as the GVZ (Gold Volatility Index) and OVX (Oil Volatility Index), capture the market’s perception of volatility in specific asset classes. For instance, GVZ reflects market expectations for volatility in the gold market, which can be influenced by factors such as geopolitical instability, inflation expectations, and changes in investor sentiment toward safe-haven assets. Similarly, OVX tracks the implied volatility of crude oil options, which is a crucial factor for predicting price movements in energy markets, often driven by geopolitical events, OPEC decisions, and supply-demand imbalances (Pindyck, 2004).
Using the Indicator to Identify Market Movements
The volatility indicator alerts traders when specific volatility indices exceed a defined threshold, which may signal a change in market sentiment or an upcoming price movement. These thresholds, set by the user, are typically based on historical levels of volatility that have preceded significant market changes. When a volatility index exceeds this threshold, it suggests that market participants expect greater uncertainty, which often correlates with increased price volatility and the possibility of a trend reversal.
For example, if the VIX exceeds a pre-determined level (e.g., 30), it could indicate that investors are anticipating heightened volatility in the equity markets, potentially signaling a downturn or correction in the broader market. On the other hand, if the OVX rises significantly, it could point to an upcoming sharp movement in crude oil prices, driven by changing market expectations about supply, demand, or geopolitical risks (Geman, 2005).
Practical Application
To effectively use this volatility indicator in market analysis, traders should monitor the alert signals generated when any of the volatility indices surpass their thresholds. This can be used to identify periods of market uncertainty or potential market turning points across different sectors, including equities, commodities, and currencies. The indicator can help traders prepare for increased price movements, adjust their risk management strategies, or even take advantage of anticipated price swings through options trading or volatility-based strategies (Black & Scholes, 1973).
Traders may also use this indicator in conjunction with other technical analysis tools to validate the potential for significant market movements. For example, if the VIX exceeds its threshold and the market is simultaneously approaching a critical technical support or resistance level, the trader might consider entering a position that capitalizes on the anticipated price breakout or reversal.
Conclusion
This volatility indicator is a robust tool for identifying market conditions that are conducive to significant price movements. By tracking the behavior of key volatility indices, traders can gain insights into the market’s expectations of future price fluctuations, enabling them to make more informed decisions regarding market entries and exits. Understanding and monitoring volatility can be particularly valuable during times of heightened uncertainty, as changes in volatility often precede substantial shifts in market direction (French et al., 1987).
References
• Bollerslev, T. (1986). Generalized Autoregressive Conditional Heteroskedasticity. Journal of Econometrics, 31(3), 307-327.
• Christoffersen, P. F. (1998). Evaluating Interval Forecasts. International Economic Review, 39(4), 841-862.
• Whaley, R. E. (2000). Derivatives on Market Volatility. Journal of Derivatives, 7(4), 71-82.
• Pindyck, R. S. (2004). Volatility and the Pricing of Commodity Derivatives. Journal of Futures Markets, 24(11), 973-987.
• Geman, H. (2005). Commodities and Commodity Derivatives: Modeling and Pricing for Agriculturals, Metals and Energy. John Wiley & Sons.
• Black, F., & Scholes, M. (1973). The Pricing of Options and Corporate Liabilities. Journal of Political Economy, 81(3), 637-654.
• French, K. R., Schwert, G. W., & Stambaugh, R. F. (1987). Expected Stock Returns and Volatility. Journal of Financial Economics, 19(1), 3-29.

Ahtep 11
Here’s a brief description for your indicator:
Custom FCPO Indicator with Buy/Sell Signals
This custom indicator combines multiple technical analysis tools to generate buy and sell signals for FCPO trading. It uses two exponential moving averages (EMA) to identify market trends, Stochastic RSI for momentum analysis, and volume thresholds to filter signals. When the short EMA crosses above the long EMA with oversold conditions on the Stochastic RSI and high volume, a buy signal is triggered. Conversely, a sell signal is generated when the short EMA crosses below the long EMA with overbought conditions on the Stochastic RSI and high volume. The indicator also provides entry, stop loss, and target levels based on the market conditions.
Feel free to modify or expand this description based on your needs! Let me know if you'd like to make any adjustments.

Uptrick: Volatility Reversion BandsUptrick: Volatility Reversion Bands is an indicator designed to help traders identify potential reversal points in the market by combining volatility and momentum analysis within one comprehensive framework. It calculates dynamic bands around a simple moving average and issues signals when price interacts with these bands. Below is a fully expanded description, structured in multiple sections, detailing originality, usefulness, uniqueness, and the purpose behind blending standard deviation-based and ATR-based concepts. All references to code have been removed to focus on the written explanation only.
Section 1: Overview
Uptrick: Volatility Reversion Bands centers on a moving average around which various bands are constructed. These bands respond to changes in price volatility and can help gauge potential overbought or oversold conditions. Signals occur when the price moves beyond certain thresholds, which may imply a reversal or significant momentum shift.
Section 2: Originality, Usefulness, Uniqness, Purpose
This indicator merges two distinct volatility measurements—Bollinger Bands and ATR—into one cohesive system. Bollinger Bands use standard deviation around a moving average, offering a baseline for what is statistically “normal” price movement relative to a recent mean. When price hovers near the upper band, it may indicate overbought conditions, whereas price near the lower band suggests oversold conditions. This straightforward construction often proves invaluable in moderate-volatility settings, as it pinpoints likely turning points and gauges a market’s typical trading range.
Yet Bollinger Bands alone can falter in conditions marked by abrupt volatility spikes or sudden gaps that deviate from recent norms. Intraday news, earnings releases, or macroeconomic data can alter market behavior so swiftly that standard-deviation bands do not keep pace. This is where ATR (Average True Range) adds an important layer. ATR tracks recent highs, lows, and potential gaps to produce a dynamic gauge of how much price is truly moving from bar to bar. In quieter times, ATR contracts, reflecting subdued market activity. In fast-moving markets, ATR expands, exposing heightened volatility on each new bar.
By overlaying Bollinger Bands and ATR-based calculations, the indicator achieves a broader situational awareness. Bollinger Bands excel at highlighting relative overbought or oversold areas tied to an established average. ATR simultaneously scales up or down based on real-time market swings, signaling whether conditions are calm or turbulent. When combined, this means a price that barely crosses the Bollinger Band but also triggers a high ATR-based threshold is likely experiencing a volatility surge that goes beyond typical market fluctuations. Conversely, a price breach of a Bollinger Band when ATR remains low may still warrant attention, but not necessarily the same urgency as in a high-volatility regime.
The resulting synergy offers balanced, context-rich signals. In a strong trend, the ATR layer helps confirm whether an apparent price breakout really has momentum or if it is just a temporary spike. In a range-bound market, standard deviation-based Bollinger Bands define normal price extremes, while ATR-based extensions highlight whether a breakout attempt has genuine force behind it. Traders gain clarity on when a move is both statistically unusual and accompanied by real volatility expansion, thus carrying a higher probability of a directional follow-through or eventual reversion.
Practical advantages emerge across timeframes. Scalpers in fast-paced markets appreciate how ATR-based thresholds update rapidly, revealing if a sudden price push is routine or exceptional. Swing traders can rely on both indicators to filter out false signals in stable conditions or identify truly notable moves. By calibrating to changes in volatility, the merged system adapts naturally whether the market is trending, ranging, or transitioning between these phases.
In summary, combining Bollinger Bands (for a static sense of standard-deviation-based overbought/oversold zones) with ATR (for a dynamic read on current volatility) yields an adaptive, intuitive indicator. Traders can better distinguish fleeting noise from meaningful expansions, enabling more informed entries, exits, and risk management. Instead of relying on a single yardstick for all market conditions, this fusion provides a layered perspective, encouraging traders to interpret price moves in the broader context of changing volatility.
Section 3: Why Bollinger Bands and ATR are combined
Bollinger Bands provide a static snapshot of volatility by computing a standard deviation range above and below a central average. ATR, on the other hand, adapts in real time to expansions or contractions in market volatility. When combined, these measures offset each other’s limitations: Bollinger Bands add structure (overbought and oversold references), and ATR ensures responsiveness to rapid price shifts. This synergy helps reduce noisy signals, particularly during sudden market turbulence or extended consolidations.
Section 4: User Inputs
Traders can adjust several parameters to suit their preferences and strategies. These typically include:
1. Lookback length for calculating the moving average and standard deviation.
2. Multipliers to control the width of Bollinger Bands.
3. An ATR multiplier to set the distance for additional reversal bands.
4. An option to display weaker signals when the price merely approaches but does not cross the outer bands.
Section 5: Main Calculations
At the core of this indicator are four important steps:
1. Calculate a basis using a simple moving average.
2. Derive Bollinger Bands by adding and subtracting a product of the standard deviation and a user-defined multiplier.
3. Compute ATR over the same lookback period and multiply it by the selected factor.
4. Combine ATR-based distance with the Bollinger Bands to set the outer reversal bands, which serve as stronger signal thresholds.
Section 6: Signal Generation
The script interprets meaningful reversal points when the price:
1. Crosses below the lower outer band, potentially highlighting oversold conditions where a bullish reversal may occur.
2. Crosses above the upper outer band, potentially indicating overbought conditions where a bearish reversal may develop.
Section 7: Visualization
The indicator provides visual clarity through labeled signals and color-coded references:
1. Distinct colors for upper and lower reversal bands.
2. Markers that appear above or below bars to denote possible buying or selling signals.
3. A gradient bar color scheme indicating a bar’s position between the lower and upper bands, helping traders quickly see if the price is near either extreme.
Section 8: Weak Signals (Optional)
For those preferring early cues, the script can highlight areas where the price nears the outer bands. When weak signals are enabled:
1. Bars closer to the upper reversal zone receive a subtle marker suggesting a less robust, yet still noteworthy, potential selling area.
2. Bars closer to the lower reversal zone receive a subtle marker suggesting a less robust, yet still noteworthy, potential buying area.
Section 9: Simplicity, Effectiveness, and Lower Timeframes
Although combining standard deviation and ATR involves sophisticated volatility concepts, this indicator is visually straightforward. Reversal bands and gradient-colored bars make it easy to see at a glance when price approaches or crosses a threshold. Day traders operating on lower timeframes benefit from such clarity because it helps filter out minor fluctuations and focus on more meaningful signals.
Section 10: Adaptability across Market Phases
Because both the standard deviation (for Bollinger Bands) and ATR adapt to changing volatility, the indicator naturally adjusts to various environments:
1. Trending: The additional ATR-based outer bands help distinguish between temporary pullbacks and deeper reversals.
2. Ranging: Bollinger Bands often remain narrower, identifying smaller reversals, while the outer ATR bands remain relatively close to the main bands.
Section 11: Reduced Noise in High-Volatility Scenarios
By factoring ATR into the band calculations, the script widens or narrows the thresholds during rapid market fluctuations. This reduces the amount of false triggers typically found in indicators that rely solely on fixed calculations, preventing overreactions to abrupt but short-lived price spikes.
Section 12: Incorporation with Other Technical Tools
Many traders combine this indicator with oscillators such as RSI, MACD, or Stochastic, as well as volume metrics. Overbought or oversold signals in momentum oscillators can provide additional confirmation when price reaches the outer bands, while volume spikes may reinforce the significance of a breakout or potential reversal.
Section 13: Risk Management Considerations
All trading strategies carry risk. This indicator, like any tool, can and does produce losing trades if price unexpectedly reverses again or if broader market conditions shift rapidly. Prudent traders employ protective measures:
1. Stop-loss orders or trailing stops.
2. Position sizing that accounts for market volatility.
3. Diversification across different asset classes when possible.
Section 14: Overbought and Oversold Identification
Standard Bollinger Bands highlight regions where price might be overextended relative to its recent average. The extended ATR-based reversal bands serve as secondary lines of defense, identifying moments when price truly stretches beyond typical volatility bounds.
Section 15: Parameter Customization for Different Needs
Users can tailor the script to their unique preferences:
1. Shorter lookback settings yield faster signals but risk more noise.
2. Higher multipliers spread the bands further apart, filtering out small moves but generating fewer signals.
3. Longer lookback periods smooth out market noise, often leading to more stable but less frequent trading cues.
Section 16: Examples of Different Trading Styles
1. Day Traders: Often reduce the length to capture quick price swings.
2. Swing Traders: May use moderate lengths such as 20 to 50 bars.
3. Position Traders: Might opt for significantly longer settings to detect macro-level reversals.
Section 17: Performance Limitations and Reality Check
No technical indicator is free from false signals. Sudden fundamental news events, extreme sentiment changes, or low-liquidity conditions can render signals less reliable. Backtesting and forward-testing remain essential steps to gauge whether the indicator aligns well with a trader’s timeframe, risk tolerance, and instrument of choice.
Section 18: Merging Volatility and Momentum
A critical uniqueness of this indicator lies in how it merges Bollinger Bands (standard deviation-based) with ATR (pure volatility measure). Bollinger Bands provide a relative measure of price extremes, while ATR dynamically reacts to market expansions and contractions. Together, they offer an enhanced perspective on potential market turns, ideally reducing random noise and highlighting moments where price has traveled beyond typical bounds.
Section 19: Purpose of this Merger
The fundamental purpose behind blending standard deviation measures with real-time volatility data is to accommodate different market behaviors. Static standard deviation alone can underreact or overreact in abnormally volatile conditions. ATR alone lacks a baseline reference to normality. By merging them, the indicator aims to provide:
1. A versatile dynamic range for both typical and extreme moves.
2. A filter against frequent whipsaws, especially in choppy environments.
3. A visual framework that novices and experts can interpret rapidly.
Section 20: Summary and Practical Tips
Uptrick: Volatility Reversion Bands offers a powerful tool for traders looking to combine volatility-based signals with momentum-derived reversals. It emphasizes clarity through color-coded bars, defined reversal zones, and optional weak signal markers. While potentially useful across all major timeframes, it demands ongoing risk management, realistic expectations, and careful study of how signals behave under different market conditions. No indicator serves as a crystal ball, so integrating this script into an overall strategy—possibly alongside volume data, fundamentals, or momentum oscillators—often yields the best results.
Disclaimer and Educational Use
This script is intended for educational and informational purposes. It does not constitute financial advice, nor does it guarantee trading success. Sudden economic events, low-liquidity times, and unexpected market behaviors can all undermine technical signals. Traders should use proper testing procedures (backtesting and forward-testing) and maintain disciplined risk management measures.

Binary Options Pro Helper By Himanshu AgnihotryThe Binary Options Pro Helper is a custom indicator designed specifically for one-minute binary options trading. This tool combines technical analysis methods like moving averages, RSI, Bollinger Bands, and pattern recognition to provide precise Buy and Sell signals. It also includes a time-based filter to ensure trades are executed only during optimal market conditions.
Features:
Moving Averages (EMA):
Uses short-term (7-period) and long-term (21-period) EMA crossovers for trend detection.
RSI-Based Signals:
Identifies overbought/oversold conditions for entry points.
Bollinger Bands:
Highlights market volatility and potential reversal zones.
Chart Pattern Recognition:
Detects double tops (sell signals) and double bottoms (buy signals).
Time-Based Filter:
Trades only within specified hours (e.g., 9:30 AM to 11:30 AM) to avoid unnecessary noise.
Visual Signals:
Plots buy and sell markers directly on the chart for ease of use.
How to Use:
Setup:
Add this script to your TradingView chart and select a 1-minute timeframe.
Signal Interpretation:
Buy Signal: Triggered when EMA crossover occurs, RSI is oversold (<30), and a double bottom pattern is detected.
Sell Signal: Triggered when EMA crossover occurs, RSI is overbought (>70), and a double top pattern is detected.
Timing:
Ensure trades are executed only during the specified time window for better accuracy.
Best Practices:
Use this indicator alongside fundamental analysis or market sentiment.
Test it thoroughly with historical data (backtesting) and in a demo account before live trading.
Adjust parameters (e.g., EMA periods, RSI thresholds) based on your trading style.

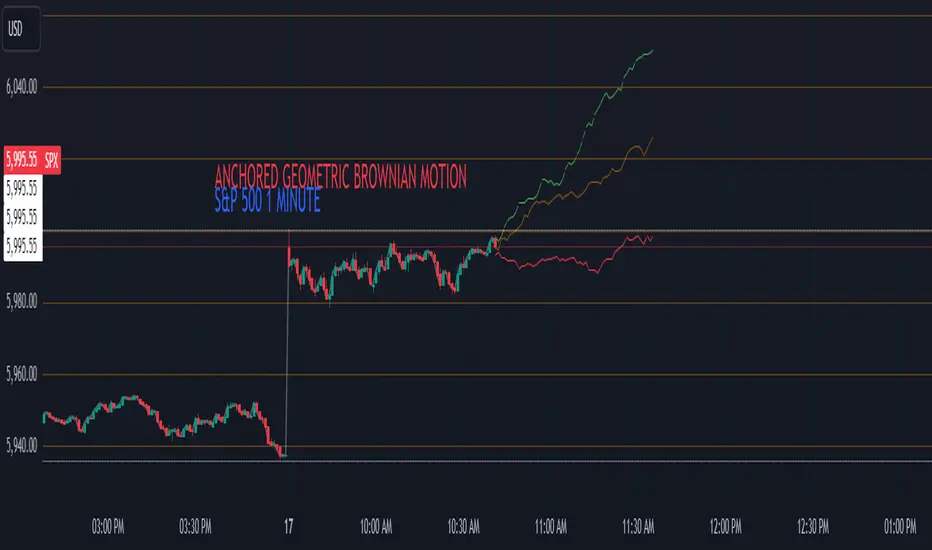
Anchored Geometric Brownian Motion Projections w/EVAnchored GBM (Geometric Brownian Motion) Projections + EV & Confidence Bands
Version: Pine Script v6
Overlay: Yes
Author:
Published On:
Overview
The Anchored GBM Projections + EV & Confidence Bands indicator leverages the Geometric Brownian Motion (GBM) model to project future price movements based on historical data. By simulating multiple potential future price paths, it provides traders with insights into possible price trajectories, their expected values, and confidence intervals. Additionally, it offers a "Mean of EV" (EV of EV) line, representing the running average of expected values across the projection period.
Key Features
Anchor Time Setup:
Define a specific point in time from which the projections commence.
By default, it uses the current bar's timestamp but can be customized.
Projection Parameters:
Projection Candles (Bars): Determines the number of future bars (time periods) to project.
Number of Simulations: Specifies how many GBM paths to simulate, ensuring statistical relevance via the Central Limit Theorem (CLT).
Display Toggles:
Simulation Lines: Visual representation of individual GBM simulation paths.
Expected Value (EV) Line: The average price across all simulations at each projection bar.
Upper & Lower Confidence Bands: 95% confidence intervals indicating potential price boundaries.
EV of EV Line: Running average of EV values, providing a smoothed central tendency across the projection period. Additionally, this line often acts as an indicator of trend direction.
Visualization:
Clear and distinguishable lines with customizable colors and styles.
Overlayed on the price chart for direct comparison with actual price movements.
Mathematical Foundation
Geometric Brownian Motion (GBM):
Definition: GBM is a continuous-time stochastic process used to model stock prices. It assumes that the logarithm of the stock price follows a Brownian motion with drift.
Equation:
S(t)=S0⋅e(μ−12σ2)t+σW(t)
S(t)=S0⋅e(μ−21σ2)t+σW(t) Where:
S(t)S(t) = Stock price at time tt
S0S0 = Initial stock price
μμ = Drift coefficient (average return)
σσ = Volatility coefficient (standard deviation of returns)
W(t)W(t) = Wiener process (standard Brownian motion)
Drift (μμ) and Volatility (σσ):
Drift (μμ) represents the expected return of the stock.
Volatility (σσ) measures the stock's price fluctuation intensity.
Central Limit Theorem (CLT):
Principle: With a sufficiently large number of independent simulations, the distribution of the sample mean (EV) approaches a normal distribution, regardless of the underlying distribution.
Application: Ensures that the EV and confidence bands are statistically reliable.
Expected Value (EV) and Confidence Bands:
EV: The mean price across all simulations at each projection bar.
Confidence Bands: Range within which the actual price is expected to lie with a specified probability (e.g., 95%).
EV of EV (Mean of Sample Means):
Definition: Represents the running average of EV values across the projection period, offering a smoothed central tendency.
Methodology
Anchor Time Setup:
The indicator starts projecting from a user-defined Anchor Time. If not customized, it defaults to the current bar's timestamp.
Purpose: Allows users to analyze projections from a specific historical point or the latest market data.
Calculating Drift and Volatility:
Returns Calculation: Computes the logarithmic returns from the Anchor Time to the current bar.
returns=ln(StSt−1)
returns=ln(St−1St)
Drift (μμ): Calculated as the simple moving average (SMA) of returns over the period since the Anchor Time.
Volatility (σσ): Determined using the standard deviation (stdev) of returns over the same period.
Simulation Generation:
Number of Simulations: The user defines how many GBM paths to simulate (e.g., 30).
Projection Candles: Determines the number of future bars to project (e.g., 12).
Process:
For each simulation:
Start from the current close price.
For each projection bar:
Generate a random number zz from a standard normal distribution.
Calculate the next price using the GBM formula:
St+1=St⋅e(μ−12σ2)+σz
St+1=St⋅e(μ−21σ2)+σz
Store the projected price in an array.
Expected Value (EV) and Confidence Bands Calculation:
EV Path: At each projection bar, compute the mean of all simulated prices.
Variance and Standard Deviation: Calculate the variance and standard deviation of simulated prices to determine the confidence intervals.
Confidence Bands: Using the standard normal z-score (1.96 for 95% confidence), establish upper and lower bounds:
Upper Band=EV+z⋅σEV
Upper Band=EV+z⋅σEV
Lower Band=EV−z⋅σEV
Lower Band=EV−z⋅σEV
EV of EV (Running Average of EV Values):
Calculation: For each projection bar, compute the average of all EV values up to that bar.
EV of EV =1j+1∑k=0jEV
EV of EV =j+11k=0∑jEV
Visualization: Plotted as a dynamic line reflecting the evolving average EV across the projection period.
Visualization Elements
Simulation Lines:
Appearance: Semi-transparent blue lines representing individual GBM simulation paths.
Purpose: Illustrate a range of possible future price trajectories based on current drift and volatility.
Expected Value (EV) Line:
Appearance: Solid orange line.
Purpose: Shows the average projected price at each future bar across all simulations.
Confidence Bands:
Upper Band: Dashed green line indicating the upper 95% confidence boundary.
Lower Band: Dashed red line indicating the lower 95% confidence boundary.
Purpose: Highlight the range within which the price is statistically expected to remain with 95% confidence.
EV of EV Line:
Appearance: Dashed purple line.
Purpose: Displays the running average of EV values, providing a smoothed trend of the central tendency across the projection period. As the mean of sample means it approximates the population mean (i.e. the trend since the anchor point.)
Current Price:
Appearance: Semi-transparent white line.
Purpose: Serves as a reference point for comparing actual price movements against projected paths.
Usage Instructions
Configuring User Inputs:
Anchor Time:
Set to a specific timestamp to start projections from a historical point or leave it as default to use the current bar's time.
Projection Candles (Bars):
Define the number of future bars to project (e.g., 12). Adjust based on your trading timeframe and analysis needs.
Number of Simulations:
Specify the number of GBM paths to simulate (e.g., 30). Higher numbers yield more accurate EV and confidence bands but may impact performance.
Display Toggles:
Show Simulation Lines: Toggle to display or hide individual GBM simulation paths.
Show Expected Value Line: Toggle to display or hide the EV path.
Show Upper Confidence Band: Toggle to display or hide the upper confidence boundary.
Show Lower Confidence Band: Toggle to display or hide the lower confidence boundary.
Show EV of EV Line: Toggle to display or hide the running average of EV values.
Managing TradingView's Object Limits:
Understanding Limits:
TradingView imposes a limit on the number of graphical objects (e.g., lines) that can be rendered. High values for projection candles and simulations can quickly consume these limits. TradingView appears to only allow a total of 55 candles to be projected, so if you want to see two complete lines, you would have to set the projection length to 27: since 27 * 2 = 54 and 54 < 55.
Optimizing Performance:
Use Toggles: Enable only the necessary visual elements. For instance, disable simulation lines and confidence bands when focusing on the EV and EV of EV lines. You can also use the maximum projection length of 55 with the lower limit confidence band as the only line, visualizing a long horizon for your risk.
Adjust Parameters: Lower the number of projection candles or simulations to stay within object limits without compromising essential insights.
Interpreting the Indicator:
Simulation Lines (Blue):
Represent individual potential future price paths based on GBM. A wider spread indicates higher volatility.
Expected Value (EV) Line (Goldenrod):
Shows the mean projected price at each future bar, providing a central trend.
Confidence Bands (Green & Red):
Indicate the statistical range (95% confidence) within which the price is expected to remain.
EV of EV Line (Dotted Line - Goldenrod):
Reflects the running average of EV values, offering a smoothed perspective of expected price trends over the projection period.
Current Price (White):
Serves as a benchmark for assessing how actual prices compare to projected paths.
Practical Applications
Risk Management:
Confidence Bands: Help in identifying potential support and resistance levels based on statistical confidence intervals.
EV Path: Assists in setting realistic target prices and stop-loss levels aligned with projected expectations.
Trend Analysis:
EV of EV Line: Offers a smoothed trendline, aiding in identifying overarching market directions amidst price volatility. Indicative of the population mean/overall trend of the data since your anchor point.
Scenario Planning:
Simulation Lines: Enable traders to visualize multiple potential outcomes, fostering better decision-making under uncertainty.
Performance Evaluation:
Comparing Actual vs. Projected Prices: Assess how actual price movements align with projected scenarios, refining trading strategies over time.
Mathematical and Statistical Insights
Simulation Integrity:
Independence: Each simulation path is generated independently, ensuring unbiased and diverse projections.
Randomness: Utilizes a Gaussian random number generator to introduce variability in diffusion terms, mimicking real market randomness.
Statistical Reliability:
Central Limit Theorem (CLT): By simulating a sufficient number of paths (e.g., 30), the sample mean (EV) converges to the population mean, ensuring reliable EV and confidence band calculations.
Variance Calculation: Accurate computation of variance from simulation data ensures precise confidence intervals.
Dynamic Projections:
Running Average (EV of EV): Provides a cumulative perspective, allowing traders to observe how the average expectation evolves as the projection progresses.
Customization and Enhancements
Adjustable Parameters:
Tailor the projection length and simulation count to match your trading style and analysis depth.
Visual Customization:
Modify line colors, styles, and transparency to enhance clarity and fit chart aesthetics.
Extended Statistical Metrics:
Future iterations can incorporate additional metrics like median projections, skewness, or alternative confidence intervals.
Dynamic Recalculation:
Implement logic to automatically update projections as new data becomes available, ensuring real-time relevance.
Performance Considerations
Object Count Management:
High simulation counts and extended projection periods can lead to a significant number of graphical objects, potentially slowing down chart performance.
Solution: Utilize display toggles effectively and optimize projection parameters to balance detail with performance.
Computational Efficiency:
The script employs efficient array handling and conditional plotting to minimize unnecessary computations and object creation.
Conclusion
The Anchored GBM Projections + EV & Confidence Bands indicator is a robust tool for traders seeking to forecast potential future price movements using statistical models. By integrating Geometric Brownian Motion simulations with expected value calculations and confidence intervals, it offers a comprehensive view of possible market scenarios. The addition of the "EV of EV" line further enhances analytical depth by providing a running average of expected values, aiding in trend identification and strategic decision-making.
Hope it helps!
[w3ss1] Timeframe SyncThe "Timeframe Sync" indicator provides a comprehensive view of price action across multiple timeframes for a single symbol, allowing traders to analyze market conditions from a multi-timeframe perspective with ease.
Key Features:
Flexible Symbol Selection: Choose between analyzing the symbol of the current chart or select another symbol to monitor.
Customizable Timeframes: Control which timeframes you want to analyze through toggle switches. Choose from 11 different timeframes ranging from 1-minute to Monthly charts, with the ability to customize each one:
1m, 5m, 15m, 30m, 1H, 4H, 8H, 12H, 1D, 1W, 1M
Visual Feedback:
-Candle Close Color: Each timeframe's last closed candle is color-coded. Bullish closes are highlighted in green, bearish in dark shades, and inside candles in orange.
-Bias Indicator: The indicator shows whether the close is "above", "below", or "inside" the previous candle's high/low range, providing insight into the market's momentum.
Table Display: Information is presented in a clear table format:
-The first row shows the symbol being analyzed.
-The second row displays "Candle close" to indicate the relevance of the information below.
-Each subsequent row represents a different timeframe, showing its abbreviation and the bias of the last close.
Conditional Display: Timeframes are only shown if they are relevant to the current chart's timeframe. This ensures that you're not looking at outdated data when on lower timeframes.
Customization:
-Adjust text size, table position, background color, text color, and colors for different candle close scenarios.
Usage:
Ideal for traders who need a quick multi-timeframe analysis without switching charts.
Helps in confirming short-term moves with longer-term trends or spotting divergences across timeframes.
Instructions:
Add the indicator to your chart.
Customize the timeframes you wish to monitor via the toggle switches.
Optionally, select a different symbol if not analyzing the current chart's symbol.
Adjust colors and table settings to your preference.
Observe how price action behaves across different timeframes to make informed trading decisions.
BK MA Horizontal Lines
Indicator Description:
I am incredibly proud and excited to share my first indicator with the TradingView community! This tool has been instrumental in helping me optimize my positioning and maximize my trades.
Moving Averages (MAs) are among the top three most crucial indicators for trading, and I believe that the Daily, Weekly, and Monthly MAs are especially critical. The way I’ve designed this indicator allows you to combine MAs from your Daily timeframe with one or two from the Weekly or Monthly timeframes, depending on what is most relevant for the specific product or timeframe you’re analyzing.
For optimal use, I recommend:
Spacing your chart about 11 spaces from the right side.
Setting the Labels at 10 in the indicator configuration.
Keeping the line thickness at size 1, while using size 2 for my other indicator, "BK BB Horizontal Lines", which follows a similar concept but applies to Bollinger Bands.
If you find success with this indicator, I kindly ask that you give back in some way through acts of philanthropy, helping others in the best way you see fit.
Good luck to everyone, and always remember: God gives us everything. May all the glory go to the Almighty!

ATT + Key Levels with SessionsKey Features:
ATT Turning Point Numbers:
This input allows the user to define specific numbers (e.g., "3,11,17,29,41,47,53,59") that mark turning points in price action, which are checked using the bar_index modulo 60. If the current bar index matches one of these turning points, it triggers potential buy or sell signals.
RSI (Relative Strength Index):
The RSI is calculated based on a user-defined period (rsi_period), typically 14, and used to indicate overbought or oversold conditions. The script defines overbought (70) and oversold (30) levels, which are used to filter buy or sell signals.
Session Times:
The script includes predefined session times for major trading markets:
New York: From 9:30 AM EST to 4:00 PM EST.
London: From 8:00 AM GMT to 4:30 PM GMT.
Asia: From 12:00 AM GMT to 9:00 AM GMT.
These session times are used to restrict the buy and sell signals to specific market sessions.
Key Levels:
The script calculates and plots key market levels for the current day and week:
Daily High and Low: The highest and lowest prices of the current day.
Weekly High and Low: The highest and lowest prices of the current week.
These levels are plotted with different colors for visual reference.
Signal Logic:
Buy Signal: Triggered when the current bar is a turning point (according to the ATT model), the RSI is below the oversold threshold, and the current time is within the active session times (New York, London, or Asia).
Sell Signal: Triggered when the current bar is a turning point, the RSI is above the overbought threshold, and the current time is within the active session times.
Signal Limitations:
A user-defined limit (max_signals_per_session) controls the maximum number of signals that can be plotted within each session. This prevents excessive signal generation.
Plotting and Background Highlights:
Buy and Sell Signals: The script plots shapes (labels) above or below the bars to indicate buy or sell signals when the conditions are met.
Background Highlight: The background color is highlighted in yellow when the current bar matches one of the defined ATT turning points.
In Summary:
The indicator combines multiple technical factors to generate trading signals:
Turning points in price action (based on custom ATT numbers),
RSI levels (overbought/oversold),
Market session times (New York, London, Asia),
Key price levels (daily and weekly highs and lows).
This combination helps traders identify potential buying and selling opportunities while considering broader market dynamics and limiting the number of signals during each session.

[blackcat] L1 Extreme Shadows█ OVERVIEW
The Pine Script provided is an indicator designed to detect market volatility and extreme shadow conditions. It calculates various conditions based on simple moving averages (SMAs) and plots the results to help traders identify potential market extremes. The primary function of the script is to provide visual cues for extreme market conditions without generating explicit trading signals.
█ LOGICAL FRAMEWORK
Structure:
1 — Input Parameters:
• No user-defined input parameters are present in this script.
2 — Calculations:
• Calculate Extreme Shadow: Checks if the differences between certain SMAs and prices exceed predefined thresholds.
• Calculate Buy Extreme Shadow: Extends the logic by incorporating additional SMAs to identify stronger buy signals.
• Calculate Massive Bullish Sell: Detects massive bullish sell conditions using longer-term SMAs.
3 — Plotting:
• The script plots the calculated conditions using distinct colors to differentiate between various types of extreme shadows.
Data Flow:
• The close price is passed through each custom function.
• Each function computes its respective conditions based on specified SMAs and thresholds.
• The computed values are then summed and returned.
• Finally, the aggregated values are plotted on the chart using the plot function.
█ CUSTOM FUNCTIONS
1 — calculate_extreme_shadow(close)
• Purpose: Identify extreme shadow conditions based on 8-period and 14-period SMAs.
• Functionality: Computes the difference between the 8-period SMA and the close price, and the difference between the 14-period SMA and the 4-period SMA, relative to the 6-period SMA. Returns 2 if both conditions exceed 0.04; otherwise, returns 0.
• Parameters: close (price series)
• Return Value: Integer (0 or 2)
2 — calculate_buy_extreme_shadow(close)
• Purpose: Identify more robust buy signals by evaluating multiple SMAs.
• Functionality: Considers the 8-period SMA along with additional SMAs (21, 42, 63, 84, 105) and combines multiple conditions to provide a comprehensive buy signal.
• Parameters: close (price series)
• Return Value: Integer (sum of conditions, ranging from 0 to 14)
3 — calculate_massive_bullish_sell(close)
• Purpose: Detect massive bullish sell conditions using longer-term SMAs.
• Functionality: Evaluates conditions based on the 8-period SMA and longer-term SMAs (88, 44, 22, 11, 5), returning a sum of conditions meeting specified thresholds.
• Parameters: close (price series)
• Return Value: Integer (sum of conditions, ranging from 0 to 10)
█ KEY POINTS AND TECHNIQUES
• Advanced Pine Script Features:
• Multiple Nested Conditions: Uses nested conditions to assess complex market scenarios.
• Combination of Conditions: Combines multiple conditions to provide a more reliable signal.
• Optimization Techniques:
• Thresholds: Employs specific thresholds (0.04 and 0.03) to filter out noise and highlight significant market movements.
• SMA Comparisons: Compares multiple SMAs to identify trends and extreme conditions.
• Unique Approaches:
• Combining Multiple Time Frames: Incorporates multiple time frames to offer a holistic view of the market.
• Visual Distinction: Utilizes different colors and line widths to clearly differentiate between various extreme shadow conditions.
█ EXTENDED KNOWLEDGE AND APPLICATIONS
• Potential Modifications:
• User-Defined Thresholds: Allow users to customize thresholds to align with personal trading strategies.
• Additional Indicators: Integrate other technical indicators like RSI or MACD to improve the detection of extreme market conditions.
• Entry and Exit Signals: Enhance the script to generate clear buy and sell signals based on identified extreme shadow conditions.
• Application Scenarios:
• Volatility Analysis: Analyze market volatility and pinpoint times of extreme price action.
• Trend Following: Pair with trend-following strategies to capitalize on significant market moves.
• Risk Management: Adjust position sizes or stop-loss levels based on detected extreme conditions.
• Related Pine Script Concepts:
• Custom Functions: Demonstrates how to create reusable functions for simplified and organized code.
• Plotting Techniques: Shows effective ways to visualize data using color and styling options.
• Multiple Time Frame Analysis: Highlights the benefits of analyzing multiple time frames for a broader market understanding.

Ensemble Alerts█ OVERVIEW
This indicator creates highly customizable alert conditions and messages by combining several technical conditions into groups , which users can specify directly from the "Settings/Inputs" tab. It offers a flexible framework for building and testing complex alert conditions without requiring code modifications for each adjustment.
█ CONCEPTS
Ensemble analysis
Ensemble analysis is a form of data analysis that combines several "weaker" models to produce a potentially more robust model. In a trading context, one of the most prevalent forms of ensemble analysis is the aggregation (grouping) of several indicators to derive market insights and reinforce trading decisions. With this analysis, traders typically inspect multiple indicators, signaling trade actions when specific conditions or groups of conditions align.
Simplifying ensemble creation
Combining indicators into one or more ensembles can be challenging, especially for users without programming knowledge. It usually involves writing custom scripts to aggregate the indicators and trigger trading alerts based on the confluence of specific conditions. Making such scripts customizable via inputs poses an additional challenge, as it often involves complicated input menus and conditional logic.
This indicator addresses these challenges by providing a simple, flexible input menu where users can easily define alert criteria by listing groups of conditions from various technical indicators in simple text boxes . With this script, you can create complex alert conditions intuitively from the "Settings/Inputs" tab without ever writing or modifying a single line of code. This framework makes advanced alert setups more accessible to non-coders. Additionally, it can help Pine programmers save time and effort when testing various condition combinations.
█ FEATURES
Configurable alert direction
The "Direction" dropdown at the top of the "Settings/Inputs" tab specifies the allowed direction for the alert conditions. There are four possible options:
• Up only : The indicator only evaluates upward conditions.
• Down only : The indicator only evaluates downward conditions.
• Up and down (default): The indicator evaluates upward and downward conditions, creating alert triggers for both.
• Alternating : The indicator prevents alert triggers for consecutive conditions in the same direction. An upward condition must be the first occurrence after a downward condition to trigger an alert, and vice versa for downward conditions.
Flexible condition groups
This script features six text inputs where users can define distinct condition groups (ensembles) for their alerts. An alert trigger occurs if all the conditions in at least one group occur.
Each input accepts a comma-separated list of numbers with optional spaces (e.g., "1, 4, 8"). Each listed number, from 1 to 35, corresponds to a specific individual condition. Below are the conditions that the numbers represent:
1 — RSI above/below threshold
2 — RSI below/above threshold
3 — Stoch above/below threshold
4 — Stoch below/above threshold
5 — Stoch K over/under D
6 — Stoch K under/over D
7 — AO above/below threshold
8 — AO below/above threshold
9 — AO rising/falling
10 — AO falling/rising
11 — Supertrend up/down
12 — Supertrend down/up
13 — Close above/below MA
14 — Close below/above MA
15 — Close above/below open
16 — Close below/above open
17 — Close increase/decrease
18 — Close decrease/increase
19 — Close near Donchian top/bottom (Close > (Mid + HH) / 2)
20 — Close near Donchian bottom/top (Close < (Mid + LL) / 2)
21 — New Donchian high/low
22 — New Donchian low/high
23 — Rising volume
24 — Falling volume
25 — Volume above average (Volume > SMA(Volume, 20))
26 — Volume below average (Volume < SMA(Volume, 20))
27 — High body to range ratio (Abs(Close - Open) / (High - Low) > 0.5)
28 — Low body to range ratio (Abs(Close - Open) / (High - Low) < 0.5)
29 — High relative volatility (ATR(7) > ATR(40))
30 — Low relative volatility (ATR(7) < ATR(40))
31 — External condition 1
32 — External condition 2
33 — External condition 3
34 — External condition 4
35 — External condition 5
These constituent conditions fall into three distinct categories:
• Directional pairs : The numbers 1-22 correspond to pairs of opposing upward and downward conditions. For example, if one of the inputs includes "1" in the comma-separated list, that group uses the "RSI above/below threshold" condition pair. In this case, the RSI must be above a high threshold for the group to trigger an upward alert, and the RSI must be below a defined low threshold to trigger a downward alert.
• Non-directional filters : The numbers 23-30 correspond to conditions that do not represent directional information. These conditions act as filters for both upward and downward alerts. Traders often use non-directional conditions to refine trending or mean reversion signals. For instance, if one of the input lists includes "30", that group uses the "Low relative volatility" condition. The group can trigger an upward or downward alert only if the 7-period Average True Range (ATR) is below the 40-period ATR.
• External conditions : The numbers 31-35 correspond to external conditions based on the plots from other indicators on the chart. To set these conditions, use the source inputs in the "External conditions" section near the bottom of the "Settings/Inputs" tab. The external value can represent an upward, downward, or non-directional condition based on the following logic:
▫ Any value above 0 represents an upward condition.
▫ Any value below 0 represents a downward condition.
▫ If the checkbox next to the source input is selected, the condition becomes non-directional . Any group that uses the condition can trigger upward or downward alerts only if the source value is not 0.
To learn more about using plotted values from other indicators, see this article in our Help Center and the Source input section of our Pine Script™ User Manual.
Group markers
Each comma-separated list represents a distinct group , where all the listed conditions must occur to trigger an alert. This script assigns preset markers (names) to each condition group to make the active ensembles easily identifiable in the generated alert messages and labels. The markers assigned to each group use the format "M", where "M" is short for "Marker" and "x" is the group number. The titles of the inputs at the top of the "Settings/Inputs" tab show these markers for convenience.
For upward conditions, the labels and alert messages show group markers with upward triangles (e.g., "M1▲"). For downward conditions, they show markers with downward triangles (e.g., "M1▼").
NOTE: By default, this script populates the "M1" field with a pre-configured list for a mean reversion group ("2,18,24,28"). The other fields are empty. If any "M*" input does not contain a value, the indicator ignores it in the alert calculations.
Custom alert messages
By default, the indicator's alert message text contains the activated markers and their direction as a comma-separated list. Users can override this message for upward or downward alerts with the two text fields at the bottom of the "Settings/Inputs" tab. When the fields are not empty , the alerts use that text instead of the default marker list.
NOTE: This script generates alert triggers, not the alerts themselves. To set up an alert based on this script's conditions, open the "Create Alert" dialog box, then select the "Ensemble Alerts" and "Any alert() function call" options in the "Condition" tabs. See the Alerts FAQ in our Pine Script™ User Manual for more information.
Condition visualization
This script offers organized visualizations of its conditions, allowing users to inspect the behaviors of each condition alongside the specified groups. The key visual features include:
1) Conditional plots
• The indicator plots the history of each individual condition, excluding the external conditions, as circles at different levels. Opposite conditions appear at positive and negative levels with the same absolute value. The plots for each condition show values only on the bars where they occur.
• Each condition's plot is color-coded based on its type. Aqua and orange plots represent opposing directional conditions, and purple plots represent non-directional conditions. The titles of the plots also contain the condition numbers to which they apply.
• The plots in the separate pane can be turned on or off with the "Show plots in pane" checkbox near the top of the "Settings/Inputs" tab. This input only toggles the color-coded circles, which reduces the graphical load. If you deactivate these visuals, you can still inspect each condition from the script's status line and the Data Window.
• As a bonus, the indicator includes "Up alert" and "Down alert" plots in the Data Window, representing the combined upward and downward ensemble alert conditions. These plots are also usable in additional indicator-on-indicator calculations.
2) Dynamic labels
• The indicator draws a label on the main chart pane displaying the activated group markers (e.g., "M1▲") each time an alert condition occurs.
• The labels for upward alerts appear below chart bars. The labels for downward alerts appear above the bars.
NOTE: This indicator can display up to 500 labels because that is the maximum allowed for a single Pine script.
3) Background highlighting
• The indicator can highlight the main chart's background on bars where upward or downward condition groups activate. Use the "Highlight background" inputs in the "Settings/Inputs" tab to enable these highlights and customize their colors.
• Unlike the dynamic labels, these background highlights are available for all chart bars, irrespective of the number of condition occurrences.
█ NOTES
• This script uses Pine Script™ v6, the latest version of TradingView's programming language. See the Release notes and Migration guide to learn what's new in v6 and how to convert your scripts to this version.
• This script imports our new Alerts library, which features functions that provide high-level simplicity for working with complex compound conditions and alerts. We used the library's `compoundAlertMessage()` function in this indicator. It evaluates items from "bool" arrays in groups specified by an array of strings containing comma-separated index lists , returning a tuple of "string" values containing the marker of each activated group.
• The script imports the latest version of the ta library to calculate several technical indicators not included in the built-in `ta.*` namespace, including Double Exponential Moving Average (DEMA), Triple Exponential Moving Average (TEMA), Fractal Adaptive Moving Average (FRAMA), Tilson T3, Awesome Oscillator (AO), Full Stochastic (%K and %D), SuperTrend, and Donchian Channels.
• The script uses the `force_overlay` parameter in the label.new() and bgcolor() calls to display the drawings and background colors in the main chart pane.
• The plots and hlines use the available `display.*` constants to determine whether the visuals appear in the separate pane.
Look first. Then leap.

Alerts█ OVERVIEW
This library is a Pine Script™ programmers tool that provides functions to simplify the creation of compound conditions and alert messages. With these functions, scripts can use comma-separated "string" lists to specify condition groups from arbitrarily large "bool" arrays , offering a convenient way to provide highly flexible alert creation to script users without requiring numerous inputs in the "Settings/Inputs" menu.
█ CONCEPTS
Compound conditions
Compound conditions are essentially groups of two or more conditions, where each required condition must occur to produce a `true` result. Traders often combine conditions, including signals from various indicators, to drive and reinforce trade decisions. Similarly, programmers use compound conditions in logical operations to create scripts that respond dynamically to groups of events.
Condition conundrum
Providing flexible condition combinations to script users for signals and alerts often poses a significant challenge: input complexity . Conventionally, such flexibility comes at the cost of an extensive list of separate inputs for toggling individual conditions and customizing their properties, often resulting in complicated input menus that are difficult for users to navigate effectively. Furthermore, managing all those inputs usually entails tediously handling many extra variables and logical expressions, making such projects more complex for programmers.
Condensing complexity
This library introduces a technique using parsed strings to reference groups of elements from "bool" arrays , helping to simplify and streamline the construction of compound conditions and alert messages. With this approach, programmers can provide one or more "string" inputs in their scripts where users can list numbers corresponding to the conditions they want to combine.
For example, suppose you have a script that creates alert triggers based on a combination of up to 20 individual conditions, and you want to make inputs for users to choose which conditions to combine. Instead of creating 20 separate checkboxes in the "Settings/Inputs" tab and manually adding associated logic for each one, you can store the conditional values in arrays, make one or more "string" inputs that accept values listing the array item locations (e.g., "1,4,8,11"), and then pass the inputs to these functions to determine the compound conditions formed by the specified groups.
This approach condenses the input space, improving navigability and utility. Additionally, it helps provide high-level simplicity to complex conditional code, making it easier to maintain and expand over time.
█ CALCULATIONS AND USE
This library contains three functions for evaluating compound conditions: `getCompoundConditon()`, `getCompoundConditionsArray()`, and `compoundAlertMessage()`. Each function has two overloads that evaluate compound conditions based on groups of items from one or two "bool" arrays . The sections below explain the functions' calculations and how to use them.
Referencing conditions using "string" index lists
Each function processes "string" values containing comma-separated lists of numerals representing the indices of the "bool" array items to use in its calculations (e.g., "4, 8, 12"). The functions split each supplied "string" list by its commas, then iterate over those specified indices in the "bool" arrays to determine each group's combined `true` or `false` state.
For convenience, the numbers in the "string" lists can represent zero-based indices (where the first item is at index 0) or one-based indices (where the first item is at index 1), depending on the function's `zeroIndex` parameter. For example, an index list of "0, 2, 4" with a `zeroIndex` value of `true` specifies that the condition group uses the first , third , and fifth "bool" values in the array, ignoring all others. If the `zeroIndex` value is `false`, the list "1, 3, 5" also refers to those same elements.
Zero-based indexing is convenient for programmers because Pine arrays always use this index format. However, one-based indexing is often more convenient and familiar for script users, especially non-programmers.
Evaluating one or many condition groups
The `getCompoundCondition()` function evaluates singular condition groups determined by its `indexList` parameter, returning `true` values whenever the specified array elements are `true`. This function is helpful when a script has to evaluate specific groups of conditions and does not require many combinations.
In contrast, the `getCompoundConditionsArray()` function can evaluate numerous condition groups, one for each "string" included in its `indexLists` argument. It returns arrays containing `true` or `false` states for each listed group. This function is helpful when a script requires multiple condition combinations in additional calculations or logic.
The `compoundAlertMessage()` function is similar to the `getCompoundConditionsArray()` function. It also evaluates a separate compound condition group for each "string" in its `indexLists` array, but it returns "string" values containing the marker (name) of each group with a `true` result. You can use these returned values as the `message` argument in alert() calls, display them in labels and other drawing objects, or even use them in additional calculations and logic.
Directional condition pairs
The first overload of each function operates on a single `conditions` array, returning values representing one or more compound conditions from groups in that array. These functions are ideal for general-purpose condition groups that may or may not represent direction information.
The second overloads accept two arrays representing upward and downward conditions separately: `upConditions` and `downConditions`. These overloads evaluate opposing directional conditions in pairs (e.g., RSI is above/below a level) and return upward and downward condition information separately in a tuple .
When using the directional overloads, ensure the `upConditions` and `downConditions` arrays are the same size, with the intended condition pairs at the same indices . For instance, if you have a specific upward RSI condition's value at the first index in the `upConditions` array, include the opposing downward RSI condition's value at that same index in the `downConditions` array. If a condition can apply to both directions (e.g., rising volume), include its value at the same index in both arrays.
Group markers
To simplify the generation of informative alert messages, the `compoundAlertMessage()` function assigns "string" markers to each condition group, where "marker" refers to the group's name. The `groupMarkers` parameter allows you to assign custom markers to each listed group. If not specified, the function generates default group markers in the format "M", where "M" is short for "Marker" and "" represents the group number starting from 1. For example, the default marker for the first group specified in the `indexLists` array is "M1".
The function's returned "string" values contain a comma-separated list with markers for each activated condition group (e.g., "M1, M4"). The function's second overload, which processes directional pairs of conditions, also appends extra characters to the markers to signify the direction. The default for upward groups is "▲" (e.g., "M1▲") and the default for downward ones is "▼" (e.g., "M1▼"). You can customize these appended characters with the `upChar` and `downChar` parameters.
Designing customizable alerts
We recommend following these primary steps when using this library to design flexible alerts for script users:
1. Create text inputs for users to specify comma-separated lists of conditions with the input.string() or input.text_area() functions, and then collect all the input values in a "string" array . Note that each separate "string" in the array will represent a distinct condition group.
2. Create arrays of "bool" values representing the possible conditions to choose from. If your script will process pairs of upward and downward conditions, ensure the related elements in the arrays align at the same indices.
3. Call `compoundAlertMessage()` using the arrays from steps 1 and 2 as arguments to get the alert message text. If your script will use the text for alerts only, not historical display or calculation purposes, the call is necessary only on realtime bars .
4. Pass the calculated "string" values as the `message` argument in alert() calls. We recommend calling the function only when the "string" is not empty (i.e., `messageText != ""`). To avoid repainting alerts on open bars, use barstate.isconfirmed in the condition to allow alert triggers only on each bar's close .
5. Test the alerts. Open the "Create Alert" dialog box and select "Any alert() function call" in the "Condition" field. It is also helpful to inspect the strings with Pine Logs .
NOTE: Because the techniques in this library use lists of numbers to specify conditions, we recommend including a tooltip for the "string" inputs that lists the available numbers and the conditions they represent. This tooltip provides a legend for script users, making it simple to understand and utilize. To create the tooltip, declare a "const string" listing the options and pass it to the `input.*()` call's `tooltip` parameter. See the library's example code for a simple demonstration.
█ EXAMPLE CODE
This library's example code demonstrates one possible way to offer a selection of compound conditions with "string" inputs and these functions. It uses three input.string() calls, each accepting a comma-separated list representing a distinct condition group. The title of each input represents the default group marker that appears in the label and alert text. The code collects these three input values in a `conditionGroups` array for use with the `compoundAlertMessage()` function.
In this code, we created two "bool" arrays to store six arbitrary condition pairs for demonstration:
1. Bar up/down: The bar's close price must be above the open price for upward conditions, and vice versa for downward conditions.
2. Fast EMA above/below slow EMA : The 9-period Exponential Moving Average of close prices must be above the 21-period EMA for upward conditions, and vice versa for downward conditions.
3. Volume above average : The bar's volume must exceed its 20-bar average to activate an upward or downward condition.
4. Volume rising : The volume must exceed that of the previous bar to activate an upward or downward condition.
5. RSI trending up/down : The 14-period Relative Strength Index of close prices must be between 50 and 70 for upward conditions, and between 30 and 50 for downward conditions.
6. High volatility : The 7-period Average True Range (ATR) must be above the 40-period ATR to activate an upward or downward condition.
We included a `tooltip` argument for the third input.string() call that displays the condition numbers and titles, where 1 is the first condition number.
The `bullConditions` array contains the `true` or `false` states of all individual upward conditions, and the `bearConditions` array contains all downward condition states. For the conditions that filter either direction because they are non-directional, such as "High volatility", both arrays contain the condition's `true` or `false` value at the same index. If you use these conditions alone, they activate upward and downward alert conditions simultaneously.
The example code calls `compoundAlertMessage()` using the `bullConditions`, `bearConditions`, and `conditionGroups` arrays to create a tuple of strings containing the directional markers for each activated group. On confirmed bars, it displays non-empty strings in labels and uses them in alert() calls. For the text shown in the labels, we used str.replace_all() to replace commas with newline characters, aligning the markers vertically in the display.
Look first. Then leap.
█ FUNCTIONS
This library exports the following functions:
getCompoundCondition(conditions, indexList, minRequired, zeroIndex)
(Overload 1 of 2) Determines a compound condition based on selected elements from a `conditions` array.
Parameters:
conditions (array) : (array) An array containing the possible "bool" values to use in the compound condition.
indexList (string) : (series string) A "string" containing a comma-separated list of whole numbers representing the group of `conditions` elements to use in the compound condition. For example, if the value is `"0, 2, 4"`, and `minRequired` is `na`, the function returns `true` only if the `conditions` elements at index 0, 2, and 4 are all `true`. If the value is an empty "string", the function returns `false`.
minRequired (int) : (series int) Optional. Determines the minimum number of selected conditions required to activate the compound condition. For example, if the value is 2, the function returns `true` if at least two of the specified `conditions` elements are `true`. If the value is `na`, the function returns `true` only if all specified elements are `true`. The default is `na`.
zeroIndex (bool) : (series bool) Optional. Specifies whether the `indexList` represents zero-based array indices. If `true`, a value of "0" in the list represents the first array index. If `false`, a `value` of "1" represents the first index. The default is `true`.
Returns: (bool) `true` if `conditions` elements in the group specified by the `indexList` are `true`, `false` otherwise.
getCompoundCondition(upConditions, downConditions, indexList, minRequired, allowUp, allowDown, zeroIndex)
(Overload 2 of 2) Determines upward and downward compound conditions based on selected elements from `upConditions` and `downConditions` arrays.
Parameters:
upConditions (array) : (array) An array containing the possible "bool" values to use in the upward compound condition.
downConditions (array) : (array) An array containing the possible "bool" values to use in the downward compound condition.
indexList (string) : (series string) A "string" containing a comma-separated list of whole numbers representing the `upConditions` and `downConditions` elements to use in the compound conditions. For example, if the value is `"0, 2, 4"` and `minRequired` is `na`, the function returns `true` for the first value only if the `upConditions` elements at index 0, 2, and 4 are all `true`. If the value is an empty "string", the function returns ` `.
minRequired (int) : (series int) Optional. Determines the minimum number of selected conditions required to activate either compound condition. For example, if the value is 2, the function returns `true` for its first value if at least two of the specified `upConditions` elements are `true`. If the value is `na`, the function returns `true` only if all specified elements are `true`. The default is `na`.
allowUp (bool) : (series bool) Optional. Controls whether the function considers upward compound conditions. If `false`, the function ignores the `upConditions` array, and the first item in the returned tuple is `false`. The default is `true`.
allowDown (bool) : (series bool) Optional. Controls whether the function considers downward compound conditions. If `false`, the function ignores the `downConditions` array, and the second item in the returned tuple is `false`. The default is `true`.
zeroIndex (bool) : (series bool) Optional. Specifies whether the `indexList` represents zero-based array indices. If `true`, a value of "0" in the list represents the first array index. If `false`, a value of "1" represents the first index. The default is `true`.
Returns: ( ) A tuple containing two "bool" values representing the upward and downward compound condition states, respectively.
getCompoundConditionsArray(conditions, indexLists, zeroIndex)
(Overload 1 of 2) Creates an array of "bool" values representing compound conditions formed by selected elements from a `conditions` array.
Parameters:
conditions (array) : (array) An array containing the possible "bool" values to use in each compound condition.
indexLists (array) : (array) An array of strings containing comma-separated lists of whole numbers representing the `conditions` elements to use in each compound condition. For example, if an item is `"0, 2, 4"`, the corresponding item in the returned array is `true` only if the `conditions` elements at index 0, 2, and 4 are all `true`. If an item is an empty "string", the item in the returned array is `false`.
zeroIndex (bool) : (series bool) Optional. Specifies whether the "string" lists in the `indexLists` represent zero-based array indices. If `true`, a value of "0" in a list represents the first array index. If `false`, a value of "1" represents the first index. The default is `true`.
Returns: (array) An array of "bool" values representing compound condition states for each condition group. An item in the array is `true` only if all the `conditions` elements specified by the corresponding `indexLists` item are `true`. Otherwise, the item is `false`.
getCompoundConditionsArray(upConditions, downConditions, indexLists, allowUp, allowDown, zeroIndex)
(Overload 2 of 2) Creates two arrays of "bool" values representing compound upward and
downward conditions formed by selected elements from `upConditions` and `downConditions` arrays.
Parameters:
upConditions (array) : (array) An array containing the possible "bool" values to use in each upward compound condition.
downConditions (array) : (array) An array containing the possible "bool" values to use in each downward compound condition.
indexLists (array) : (array) An array of strings containing comma-separated lists of whole numbers representing the `upConditions` and `downConditions` elements to use in each compound condition. For example, if an item is `"0, 2, 4"`, the corresponding item in the first returned array is `true` only if the `upConditions` elements at index 0, 2, and 4 are all `true`. If an item is an empty "string", the items in both returned arrays are `false`.
allowUp (bool) : (series bool) Optional. Controls whether the function considers upward compound conditions. If `false`, the function ignores the `upConditions` array, and all elements in the first returned array are `false`. The default is `true`.
allowDown (bool) : (series bool) Optional. Controls whether the function considers downward compound conditions. If `false`, the function ignores the `downConditions` array, and all elements in the second returned array are `false`. The default is `true`.
zeroIndex (bool) : (series bool) Optional. Specifies whether the "string" lists in the `indexLists` represent zero-based array indices. If `true`, a value of "0" in a list represents the first array index. If `false`, a value of "1" represents the first index. The default is `true`.
Returns: ( ) A tuple containing two "bool" arrays:
- The first array contains values representing upward compound condition states determined using the `upConditions`.
- The second array contains values representing downward compound condition states determined using the `downConditions`.
compoundAlertMessage(conditions, indexLists, zeroIndex, groupMarkers)
(Overload 1 of 2) Creates a "string" message containing a comma-separated list of markers representing active compound conditions formed by specified element groups from a `conditions` array.
Parameters:
conditions (array) : (array) An array containing the possible "bool" values to use in each compound condition.
indexLists (array) : (array) An array of strings containing comma-separated lists of whole numbers representing the `conditions` elements to use in each compound condition. For example, if an item is `"0, 2, 4"`, the corresponding marker for that item appears in the returned "string" only if the `conditions` elements at index 0, 2, and 4 are all `true`.
zeroIndex (bool) : (series bool) Optional. Specifies whether the "string" lists in the `indexLists` represent zero-based array indices. If `true`, a value of "0" in a list represents the first array index. If `false`, a value of "1" represents the first index. The default is `true`.
groupMarkers (array) : (array) Optional. If specified, sets the marker (name) for each condition group specified in the `indexLists` array. If `na`, the function uses the format `"M"` for each group, where "M" is short for "Marker" and `` represents the one-based index for the group (e.g., the marker for the first listed group is "M1"). The default is `na`.
Returns: (string) A "string" containing a list of markers corresponding to each active compound condition.
compoundAlertMessage(upConditions, downConditions, indexLists, allowUp, allowDown, zeroIndex, groupMarkers, upChar, downChar)
(Overload 2 of 2) Creates two "string" messages containing comma-separated lists of markers representing active upward and downward compound conditions formed by specified element groups from `upConditions` and `downConditions` arrays.
Parameters:
upConditions (array) An array containing the possible "bool" values to use in each upward compound condition.
downConditions (array) An array containing the possible "bool" values to use in each downward compound condition.
indexLists (array) An array of strings containing comma-separated lists of whole numbers representing the `upConditions` and `downConditions` element groups to use in each compound condition. For example, if an item is `"0, 2, 4"`, the corresponding group marker for that item appears in the first returned "string" only if the `upConditions` elements at index 0, 2, and 4 are all `true`.
allowUp (bool) Optional. Controls whether the function considers upward compound conditions. If `false`, the function ignores the `upConditions` array and returns an empty "string" for the first tuple element. The default is `true`.
allowDown (bool) Optional. Controls whether the function considers downward compound conditions. If `false`, the function ignores the `downConditions` array and returns an empty "string" for the second tuple element. The default is `true`.
zeroIndex (bool) Optional. Specifies whether the "string" lists in the `indexLists` represent zero-based array indices. If `true`, a value of "0" in a list represents the first array index. If `false`, a value of "1" represents the first index. The default is `true`.
groupMarkers (array) Optional. If specified, sets the name (marker) of each condition group specified in the `indexLists` array. If `na`, the function uses the format `"M"` for each group, where "M" is short for "Marker" and `` represents the one-based index for the group (e.g., the marker for the first listed group is "M1"). The default is `na`.
upChar (string) Optional. A "string" appended to all group markers for upward conditions to signify direction. The default is "▲".
downChar (string) Optional. A "string" appended to all group markers for downward conditions to signify direction. The default is "▼".
Returns: ( ): A tuple of "string" values containing lists of markers corresponding to active upward and downward compound conditions, respectively.

DNSE VN301!, SMA & EMA Cross StrategyDiscover the tailored Pinescript to trade VN30F1M Future Contracts intraday, the strategy focuses on SMA & EMA crosses to identify potential entry/exit points. The script closes all positions by 14:25 to avoid holding any contracts overnight.
HNX:VN301!
www.tradingview.com
Setting & Backtest result:
1-minute chart, initial capital of VND 100 million, entering 4 contracts per time, backtest result from Jan-2024 to Nov-2024 yielded a return over 40%, executed over 1,000 trades (average of 4 trades/day), winning trades rate ~ 30% with a profit factor of 1.10.
The default setting of the script:
A decent optimization is reached when SMA and EMA periods are set to 60 and 15 respectively while the Long/Short stop-loss level is set to 20 ticks (2 points) from the entry price.
Entry & Exit conditions:
Long signals are generated when ema(15) crosses over sma(60) while Short signals happen when ema(15) crosses under sma(60). Long orders are closed when ema(15) crosses under sma(60) while Short orders are closed when ema(15) crosses over sma(60).
Exit conditions happen when (whichever came first):
Another Long/Short signal is generated
The Stop-loss level is reached
The Cut-off time is reached (14:25 every day)
*Disclaimers:
Futures Contracts Trading are subjected to a high degree of risk and price movements can fluctuate significantly. This script functions as a reference source and should be used after users have clearly understood how futures trading works, accessed their risk tolerance level, and are knowledgeable of the functioning logic behind the script.
Users are solely responsible for their investment decisions, and DNSE is not responsible for any potential losses from applying such a strategy to real-life trading activities. Past performance is not indicative/guarantee of future results, kindly reach out to us should you have specific questions about this script.
---------------------------------------------------------------------------------------
Khám phá Pinescript được thiết kế riêng để giao dịch Hợp đồng tương lai VN30F1M trong ngày, chiến lược tập trung vào các đường SMA & EMA cắt nhau để xác định các điểm vào/ra tiềm năng. Chiến lược sẽ đóng tất cả các vị thế trước 14:25 để tránh giữ bất kỳ hợp đồng nào qua đêm.
Thiết lập & Kết quả backtest:
Chart 1 phút, vốn ban đầu là 100 triệu đồng, vào 4 hợp đồng mỗi lần, kết quả backtest từ tháng 1/2024 tới tháng 11/2024 mang lại lợi nhuận trên 40%, thực hiện hơn 1.000 giao dịch (trung bình 4 giao dịch/ngày), tỷ lệ giao dịch thắng ~ 30% với hệ số lợi nhuận là 1,10.
Thiết lập mặc định của chiến lược:
Đạt được một mức tối ưu ổn khi SMA và EMA periods được đặt lần lượt là 60 và 15 trong khi mức cắt lỗ được đặt thành 20 tick (2 điểm) từ giá vào.
Điều kiện Mở và Đóng vị thế:
Tín hiệu Long được tạo ra khi ema(15) cắt trên sma(60) trong khi tín hiệu Short xảy ra khi ema(15) cắt dưới sma(60). Lệnh Long được đóng khi ema(15) cắt dưới sma(60) trong khi lệnh Short được đóng khi ema(15) cắt lên sma(60).
Điều kiện đóng vị thể xảy ra khi (tùy điều kiện nào đến trước):
Một tín hiệu Long/Short khác được tạo ra
Giá chạm mức cắt lỗ
Lệnh chưa đóng nhưng tới giờ cut-off (14:25 hàng ngày)
*Tuyên bố miễn trừ trách nhiệm:
Giao dịch hợp đồng tương lai có mức rủi ro cao và giá có thể dao động đáng kể. Chiến lược này hoạt động như một nguồn tham khảo và nên được sử dụng sau khi người dùng đã hiểu rõ cách thức giao dịch hợp đồng tương lai, đã đánh giá mức độ chấp nhận rủi ro của bản thân và hiểu rõ về logic vận hành của chiến lược này.
Người dùng hoàn toàn chịu trách nhiệm về các quyết định đầu tư của mình và DNSE không chịu trách nhiệm về bất kỳ khoản lỗ tiềm ẩn nào khi áp dụng chiến lược này vào các hoạt động giao dịch thực tế. Hiệu suất trong quá khứ không chỉ ra/cam kết kết quả trong tương lai, vui lòng liên hệ với chúng tôi nếu bạn có thắc mắc cụ thể về chiến lược giao dịch này.

Four Supertrend By Baljit AujlaThis Pine Script is an implementation of a "Four Supertrend" indicator by Baljit Aujla. It calculates and plots four Supertrend indicators based on the Average True Range (ATR) method, allowing for different ATR periods and multipliers for each line.
Here is an explanation of the key components:
Inputs
1:- ATR Periods: Four different periods for ATR, adjustable by the user (defaults: 10, 11, 12, 13).
2:- ATR Multipliers: Four different multipliers for the ATR, adjustable by the user (defaults: 1.0, 2.0, 3.0, 4.0).
3:- Source: The data source used for calculation, default is the average of high and low prices (hl2).
4:- Change ATR Calculation Method: Option to switch between the traditional ATR and a simple moving average of true range (SMA of TR).
5:- Signal Display- Options to show buy/sell signals and highlight trends.
Logic:
The script computes four separate Supertrend lines using the ATR method for each line. For each of the four lines, it calculates an uptrend and downtrend threshold, and the trend direction changes when the close price crosses these thresholds.
For each trend line:
1. Uptrend and Downtrend Calculation: The script uses ATR-based bands above and below the price. The uptrend line is calculated by subtracting the ATR multiplied by a given multiplier from the source price, and the downtrend line is calculated by adding the ATR multiplied by a multiplier to the source price.
2. Trend Reversal Logic: The trend switches based on the price action relative to the uptrend and downtrend lines. If the price moves above the downtrend, it signals a switch to an uptrend, and vice versa for a downtrend.
3. Signal Generation: Buy signals occur when the trend changes from negative to positive (down to up), and sell signals occur when the trend changes from positive to negative (up to down).
Plots:
The script plots:
Uptrend and Downtrend Lines: These are visualized as green and red lines for each trend.
Buy/Sell Signals: Small circles are drawn on the chart when a trend change occurs (buy and sell signals).
Trend Highlighting: Background highlighting is applied to show when the market is in an uptrend (green) or downtrend (red).
Alerts:
The script has commented-out alert conditions (alertcondition), which can be enabled to send notifications when a buy or sell signal occurs, or when a trend change happens.
Enhancements:
1. Background Highlighting: This is an option to visually emphasize uptrends and downtrends by filling the background with respective colors.
2. Signal Visibility: You can toggle whether to show the buy/sell signals on the chart.
3. ATR Calculation Method: Option to change the ATR calculation method (using SMA of TR vs the default ATR).
The script is useful for identifying multi-timeframe trends with adjustable parameters and provides both signals and visual markers on the chart to aid in trading decisions.
Issues and Improvements:
The code seems to be truncated, specifically for the last Supertrend line (Line 4). To fully complete the functionality for the fourth line, the logic for up4, down4 and tread4 needs to be finished, similar to the other three lines.
Would you like help finishing the script for the fourth line or improving specific parts of it?

Mean Price
^^ Plotting switched to Line.
This method of financial time series (aka bars) downsampling is literally, naturally, and thankfully the best you can do in terms of maximizing info gain. You can finally chill and feed it to your studies & eyes, and probably use nothing else anymore.
(HL2 and occ3 also have use cases, but other aggregation methods? Not really, even if they do, the use cases are ‘very’ specific). Tho in order to understand why, you gotta read the following wall, or just believe me telling you, ‘I put it on my momma’.
The true story about trading volumes and why this is all a big misdirection
Actually, you don’t need to be a quant to get there. All you gotta do is stop blindly following other people’s contextual (at best) solutions, eg OC2 aggregation xD, and start using your own brain to figure things out.
Every individual trade (basically an imprint on 1D price space that emerges when market orders hit the order book) has several features like: price, time, volume, AND direction (Up if a market buy order hits the asks, Down if a market sell order hits the bids). Now, the last two features—volume and direction—can be effectively combined into one (by multiplying volume by 1 or -1), and this is probably how every order matching engine should output data. If we’re not considering size/direction, we’re leaving data behind. Moreover, trades aren’t just one-price dots all the time. One trade can consume liquidity on several levels of the order book, so a single trade can be several ticks big on the price axis.
You may think now that there are no zero-volume ticks. Well, yes and no. It depends on how you design an exchange and whether you allow intra-spread trades/mid-spread trades (now try to Google it). Intra-spread trades could happen if implemented when a matching engine receives both buy and sell orders at the same microsecond period. This way, you can match the orders with each other at a better price for both parties without even hitting the book and consuming liquidity. Also, if orders have different sizes, the remaining part of the bigger order can be sent to the order book. Basically, this type of trade can be treated as an OTC trade, having zero volume because we never actually hit the book—there’s no imprint. Another reason why it makes sense is when we think about volume as an impact or imbalance act, and how the medium (order book in our case) responds to it, providing information. OTC and mid-spread trades are not aggressive sells or buys; they’re neutral ticks, so to say. However huge they are, sometimes many blocks on NYSE, they don’t move the price because there’s no impact on the medium (again, which is the order book)—they’re not providing information.
... Now, we need to aggregate these trades into, let’s say, 1-hour bars (remember that a trade can have either positive or negative volume). We either don’t want to do it, or we don’t have this kind of information. What we can do is take already aggregated OHLC bars and extract all the info from them. Given the market is fractal, bars & trades gotta have the same set of features:
- Highest & lowest ticks (high & low) <- by price;
- First & last ticks (open & close) <- by time;
- Biggest and smallest ticks <- by volume.*
*e.g., in the array ,
2323: biggest trade,
-1212: smallest trade.
Now, in our world, somehow nobody started to care about the biggest and smallest trades and their inclusion in OHLC data, while this is actually natural. It’s the same way as it’s done with high & low and open & close: we choose the minimum and maximum value of a given feature/axis within the aggregation period.
So, we don’t have these 2 values: biggest and smallest ticks. The best we can do is infer them, and given the fact the biggest and smallest ticks can be located with the same probability everywhere, all we can do is predict them in the middle of the bar, both in time and price axes. That’s why you can see two HL2’s in each of the 3 formulas in the code.
So, summed up absolute volumes that you see in almost every trading platform are actually just a derivative metric, something that I call Type 2 time series in my own (proprietary ‘for now’) methods. It doesn’t have much to do with market orders hitting the non-uniform medium (aka order book); it’s more like a statistic. Still wanna use VWAP? Ok, but you gotta understand you’re weighting Type 1 (natural) time series by Type 2 (synthetic) ones.
How to combine all the data in the right way (khmm khhm ‘order’)
Now, since we have 6 values for each bar, let’s see what information we have about them, what we don’t have, and what we can do about it:
- Open and close: we got both when and where (time (order) and price);
- High and low: we got where, but we don’t know when;
- Biggest & smallest trades: we know shit, we infer it the way it was described before.'
By using the location of the close & open prices relative to the high & low prices, we can make educated guesses about whether high or low was made first in a given bar. It’s not perfect, but it’s ultimately all we can do—this is the very last bit of info we can extract from the data we have.
There are 2 methods for inferring volume delta (which I call simply volume) that are presented everywhere, even here on TradingView. Funny thing is, this is actually 2 parts of the 1 method. I wonder how many folks see through it xD. The same method can be used for both inferring volume delta AND making educated guesses whether high or low was made first.
Imagine and/or find the cases on your charts to understand faster:
* Close > open means we have an up bar and probably the volume is positive, and probably high was made later than low.
* Close < open means we have a down bar and probably the volume is negative, and probably low was made later than high.
Now that’s the point when you see that these 2 mentioned methods are actually parts of the 1 method:
If close = open, we still have another clue: distance from open/close pair to high (HC), and distance from open/close pair to low (LC):
* HC < LC, probably high was made later.
* HC > LC, probably low was made later.
And only if close = open and HC = LC, only in this case we have no clue whether high or low was made earlier within a bar. We simply don’t have any more information to even guess. This bar is called a neutral bar.
At this point, we have both time (order) and price info for each of our 6 values. Now, we have to solve another weighted average problem, and that’s it. We’ll weight prices according to the order we’ve guessed. In the neutral bar case, open has a weight of 1, close has a weight of 3, and both high and low have weights of 2 since we can’t infer which one was made first. In all cases, biggest and smallest ticks are modeled with HL2 and weighted like they’re located in the middle of the bar in a time sense.
P.S.: I’ve also included a "robust" method where all the bars are treated like neutral ones. I’ve used it before; obviously, it has lesser info gain -> works a bit worse.
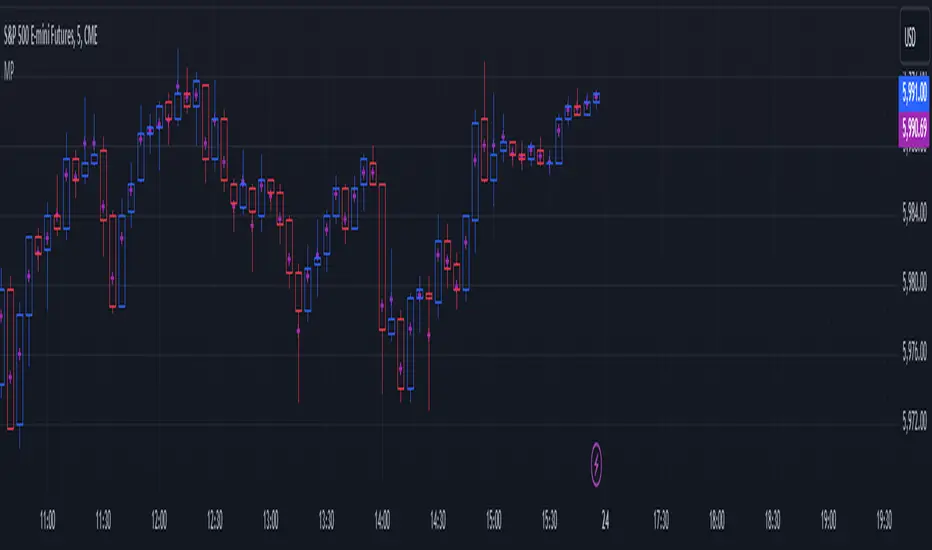
Scalp System# Scalp System
A premium scalping system designed specifically for 2-minute charts, combining multiple timeframe analysis with trend-based trading decisions. This indicator helps identify high-probability scalping opportunities through color-coded moving averages and their crossovers.
## Strategy Overview
### Entry Signals
- ONLY trade LONG when price is above RED line
- ONLY trade SHORT when price is below RED line
- Primary entry: BLUE/GREEN crosses
- Strong trend confirmation: YELLOW/PURPLE crosses
### Best Practices
1. Trade with the trend (follow RED line direction)
2. Wait for price pullbacks of faster lines
3. Combine crosses with support/resistance levels
4. Use smaller targets
5. Quick exits on failed breakouts
6. Monitor volume for confirmation
### Color Guide
- YELLOW: Fast trend identifier
- BLUE: Very short-term momentum (1min)
- GREEN: Short-term momentum (3min)
- RED: Trend filter
- PURPLE: Strong trend baseline
### Risk Management
- Place stops beyond the RED line
- Scale out at key levels
- Use 1:1.5 minimum risk/reward
- Avoid trading during major news
- Reduce position size in choppy markets
### Best Trading Hours
- Most effective during first 2 hours after market open
- Good opportunities during power hour (last hour)
- Avoid lunch hour chop (11:30-1:30 EST)
## Tips
- Less is more - wait for clean setups
- Respect the RED line as your trend filter
- Multiple timeframe confirmation increases success rate
- Use crosses as triggers, not absolute signals
- Practice in simulator before live trading

ATT Model with Buy/Sell SignalsIndicator Summary
This indicator is based on the ATT (Arithmetic Time Theory) model, using specific turning points derived from the ATT sequence (3, 11, 17, 29, 41, 47, 53, 59) to identify potential market reversals. It also integrates the RSI (Relative Strength Index) to confirm overbought and oversold conditions, triggering buy and sell signals when conditions align with the ATT sequence and RSI level.
Turning Points: Detected based on the ATT sequence applied to bar count. This suggests high-probability areas where the market could turn.
RSI Filter: Adds strength to the signals by ensuring buy signals occur when RSI is oversold (<30) and sell signals when RSI is overbought (>70).
Max Signals Per Session: Limits signals to two per session to reduce over-trading.
Entry Criteria
Buy Signal: Enter a buy trade if:
The indicator displays a green "BUY" marker.
RSI is below the oversold level (default <30), suggesting a potential upward reversal.
Sell Signal: Enter a sell trade if:
The indicator displays a red "SELL" marker.
RSI is above the overbought level (default >70), indicating a potential downward reversal.
Exit Criteria
Take Profit (TP):
Define TP as a fixed percentage or point value based on the asset's volatility. For example, set TP at 1.5-2x the risk, or a predefined point target (like 50-100 points).
Alternatively, exit the position when price approaches a key support/resistance level or the next significant swing high/low.
Stop Loss (SL):
Place the SL below the recent low (for buys) or above the recent high (for sells).
Set a fixed SL in points or percentage based on the asset’s average movement range, like an ATR-based stop, or limit it to a specific risk amount per trade (1-2% of account).
Trailing into Profit
Use a trailing strategy to lock in profits and let winning trades run further. Two main options:
ATR Trailing Stop:
Set the trailing stop based on the ATR (Average True Range), adjusting every time a new candle closes. This can help in volatile markets by keeping the stop at a consistent distance based on recent price movement.
Break-Even and Partial Profits:
When the price moves in your favor by a set amount (e.g., 1:1 risk/reward), move SL to the entry (break-even).
Take partial profit at intermediate levels (e.g., 50% at 1:1 RR) and trail the remainder.
Risk Management for Prop Firm Evaluation
Prop firms often have strict rules on daily loss limits, max drawdowns, and minimum profit targets. Here’s how to align your strategy with these:
Limit Risk per Trade:
Keep risk per trade to a conservative level (e.g., 1% or lower of your account balance). This allows for more room in case of a drawdown and aligns with most prop firm requirements.
Daily Loss Limits:
Set a daily stop-loss that ensures you don’t exceed the firm’s rules. For example, if the daily limit is 5%, stop trading once you reach a 3-4% drawdown.
Avoid Over-Trading:
Stick to the max signals per session rule (one or two trades). Taking only high-probability setups reduces emotional and reactive trades, preserving capital.
Stick to a Profit Target:
Aim to meet the evaluation’s profit goal efficiently but avoid risky or oversized trades to reach it faster.
Avoid Major Economic Events:
News events can disrupt technical setups. Avoid trading around significant releases (like FOMC or NFP) to reduce the chance of sudden losses due to high volatility.
Summary
Using this strategy with discipline, a structured entry/exit approach, and tight risk management can maximize your chances of passing a prop firm evaluation. The ATT model’s turning points, combined with the RSI, provide an edge by highlighting reversal zones, while limiting trades to 1-2 per session helps maintain controlled risk.

Low Price VolatilityI highlighted periods of low price volatility in the Nikkei 225 futures trading.
It is Japan Standard Time (JST)
This script is designed to color-code periods in the Nikkei 225 futures market according to times when prices tend to be more volatile and times when they are less volatile. The testing period is from March 11, 2024, to November 1, 2024. It identifies periods and counts where price movement exceeded half of the ATR, and colors are applied based on this data. There are no calculations involved; it simply uses the results of the analysis to apply color.

Previous Highs + Lows by HAZED📈 Introducing: Previous Highs + Lows by H A Z E D 📉
✨ Overview
Get a clear view of market levels with Previous Highs + Lows v1.0! This indicator lets you track critical previous highs and lows across multiple timeframes, marking them directly on your chart for an intuitive view of support and resistance zones. Whether you’re analyzing breakouts or looking for reversal levels, these indicators provide essential context to refine your trades.
🛠️ Key Features
Multiple Timeframes Supported
Toggle on previous highs and lows for daily, weekly, monthly, 4-hour, and 1-hour charts to match your analysis style.
Customizable Labels
Choose label sizes from “tiny” to “huge,” adjust the opacity to blend seamlessly with your chart, and customize text color for optimal readability.
Label Position Control
Avoid overlap with a flexible label offset feature, allowing for 10 adjustable increments to fit your preference and chart layout.
Clear Visual Cues
Labels use icons to differentiate high (⬆️) and low (⬇️) levels at a glance, providing a straightforward way to interpret key price areas.
Instant Alerts for Key Levels
Receive alerts when the price crosses over previous high levels, keeping you informed about potential breakout zones without constant chart-watching.
🚀 How to Use
Identify Key Levels: Quickly locate significant highs and lows from previous periods to define your support and resistance zones.
Set Alerts: Stay updated on market moves with built-in alerts when prices cross these critical levels.
Customize Your View: Use the various options to make this indicator uniquely yours – adjust label size, color, opacity, and position.
🔔 Why Use Previous Highs + Lows v1.0?
Enhanced visibility of critical levels saves you time by giving you a structured view of price action.
Customization features let you adapt the indicator to your personal style and chart setup.
Flexible alerts mean you can focus on other tasks without missing important price movements.
🔗 License: Mozilla Public License 2.0
© H A Z E D, 11/4/2024

Globex Trap ZoneGlobex Trap Indicator
A powerful tool designed to identify potential trading opportunities by analyzing the relationship between Globex session ranges and Supply & Demand zones during regular trading hours.
Key Features
Tracks and visualizes Globex session price ranges
Identifies key Supply & Demand zones during regular trading hours
Highlights potential trap areas where price might experience significant reactions
Fully customizable time ranges and visual settings
Clear labeling of Globex highs and lows
How It Works
The indicator tracks two key periods:
Globex Session (Default: 6:00 PM - 9:30 AM)
Monitors overnight price action
Marks session high and low
Helps identify potential range breakouts
Supply & Demand Zone (Default: 8:00 AM - 11:00 AM)
Tracks price action during key market hours
Identifies potential reaction zones
Helps spot institutional trading areas
Best Practices for Using This Indicator
Use on 1-hour timeframe or lower for optimal visualization
Best suited for futures and other instruments traded during Globex sessions
Pay attention to areas where Globex range and Supply/Demand zones overlap
Use in conjunction with your existing trading strategy for confirmation
Recommended minimum of 10 days of historical data for context
Settings Explanation
Globex Session: Customizable time range for overnight trading session
Supply & Demand Zone: Adjustable time range for regular trading hours
Days to Look Back: Number of historical days to display (default: 10)
Visual Settings: Customizable colors and transparency for both zones
Important Notes
All times are based on exchange timezone
The indicator respects overnight sessions and properly handles timezone transitions
Historical data requirements: Minimum 10 days recommended
Performance impact: Optimized for smooth operation with minimal resource usage
Disclaimer
Past performance is not indicative of future results. This indicator is designed to be used as part of a comprehensive trading strategy and should not be relied upon as the sole basis for trading decisions.
Updates and Support
I actively maintain this indicator and welcome feedback from the trading community. Please feel free to leave comments or suggestions for improvements.

Daily BreadWhat it does:
This script uses specific multiple true ranges from a 30 EMA baseline to plot lines that represent 10% buying increments. Although the common period for ATR is 14, this script employs a period of 20 for smoothing that I have determined is more effective when used with a daily candle chart. It includes onscreen trend signals to identify an uptrend or downtrend when the 50 EMA crosses the 90 EMA and will also display a coloured directional signal at each candle beyond an EMA cross to identify the current trend.
The script plots a scale of percentage labels at the end of each line to identify the percent of an account intended to be in short or longer term trades.
How it does it:
The script uses a 30 EMA baseline and then multiplies ATR increments of +1, +2, +4 and -1 through -7. These ATR multiples and the EMA are plotted as 11 lines, 10 of which make up the range of 10% increments from 10% to 100% with the 11th line being the High Band representing the extreme high or expected sale of any holdings. The percentage label scale uses variable declarations to position and colour match a percentage label to each line.
Intended use:
It is intended to be used for short term trading or long term investing with a daily market index chart such as SPY and multiple exchange traded funds that track said market index. A different ETF is purchased when a daily SPY candle reaches a lower buy band using 10% of a total account value. The sale of any ETFs is at the discretion of the trader and dependent on investment strategy (short term trading or long term inventing) and the trend. When short term trading in a downtrend or when daily candles are below the 50 EMA, selling would be done every 2 to 3 bands above a buy to mitigate the risk of a significant portion of an account getting caught in a downtrend. In an uptrend the High Band would be used to sell any holdings.
S&P 100 Option Expiration Week StrategyThe Option Expiration Week Strategy aims to capitalize on increased volatility and trading volume that often occur during the week leading up to the expiration of options on stocks in the S&P 100 index. This period, known as the option expiration week, culminates on the third Friday of each month when stock options typically expire in the U.S. During this week, investors in this strategy take a long position in S&P 100 stocks or an equivalent ETF from the Monday preceding the third Friday, holding until Friday. The strategy capitalizes on potential upward price pressures caused by increased option-related trading activity, rebalancing, and hedging practices.
The phenomenon leveraged by this strategy is well-documented in finance literature. Studies demonstrate that options expiration dates have a significant impact on stock returns, trading volume, and volatility. This effect is driven by various market dynamics, including portfolio rebalancing, delta hedging by option market makers, and the unwinding of positions by institutional investors (Stoll & Whaley, 1987; Ni, Pearson, & Poteshman, 2005). These market activities intensify near option expiration, causing price adjustments that may create short-term profitable opportunities for those aware of these patterns (Roll, Schwartz, & Subrahmanyam, 2009).
The paper by Johnson and So (2013), Returns and Option Activity over the Option-Expiration Week for S&P 100 Stocks, provides empirical evidence supporting this strategy. The study analyzes the impact of option expiration on S&P 100 stocks, showing that these stocks tend to exhibit abnormal returns and increased volume during the expiration week. The authors attribute these patterns to intensified option trading activity, where demand for hedging and arbitrage around options expiration causes temporary price adjustments.
Scientific Explanation
Research has found that option expiration weeks are marked by predictable increases in stock returns and volatility, largely due to the role of options market makers and institutional investors. Option market makers often use delta hedging to manage exposure, which requires frequent buying or selling of the underlying stock to maintain a hedged position. As expiration approaches, their activity can amplify price fluctuations. Additionally, institutional investors often roll over or unwind positions during expiration weeks, creating further demand for underlying stocks (Stoll & Whaley, 1987). This increased demand around expiration week typically leads to temporary stock price increases, offering profitable opportunities for short-term strategies.
Key Research and Bibliography
Johnson, T. C., & So, E. C. (2013). Returns and Option Activity over the Option-Expiration Week for S&P 100 Stocks. Journal of Banking and Finance, 37(11), 4226-4240.
This study specifically examines the S&P 100 stocks and demonstrates that option expiration weeks are associated with abnormal returns and trading volume due to increased activity in the options market.
Stoll, H. R., & Whaley, R. E. (1987). Program Trading and Expiration-Day Effects. Financial Analysts Journal, 43(2), 16-28.
Stoll and Whaley analyze how program trading and portfolio insurance strategies around expiration days impact stock prices, leading to temporary volatility and increased trading volume.
Ni, S. X., Pearson, N. D., & Poteshman, A. M. (2005). Stock Price Clustering on Option Expiration Dates. Journal of Financial Economics, 78(1), 49-87.
This paper investigates how option expiration dates affect stock price clustering and volume, driven by delta hedging and other option-related trading activities.
Roll, R., Schwartz, E., & Subrahmanyam, A. (2009). Options Trading Activity and Firm Valuation. Journal of Financial Markets, 12(3), 519-534.
The authors explore how options trading activity influences firm valuation, finding that higher options volume around expiration dates can lead to temporary price movements in underlying stocks.
Cao, C., & Wei, J. (2010). Option Market Liquidity and Stock Return Volatility. Journal of Financial and Quantitative Analysis, 45(2), 481-507.
This study examines the relationship between options market liquidity and stock return volatility, finding that increased liquidity needs during expiration weeks can heighten volatility, impacting stock returns.
Summary
The Option Expiration Week Strategy utilizes well-researched financial market phenomena related to option expiration. By positioning long in S&P 100 stocks or ETFs during this period, traders can potentially capture abnormal returns driven by option market dynamics. The literature suggests that options-related activities—such as delta hedging, position rollovers, and portfolio adjustments—intensify demand for underlying assets, creating short-term profit opportunities around these key dates.
