Renko Price Bars Overlay// Shows the price renko bars (or range bars) instead of the PERIOD renko
// bars that are integrated into Trading View. The normal renko bars that
// Trading View offers only consider the drawing of a new brick when the
// price closes above or below the required brick size. This can produce
// misleading charts since depending on the time interval of a chart, new
// bricks may or may not be drawn. True price renko bars will draw a new
// brick immediately upon the price exceeding the next target brick size.
// When running this script in "Traditional" mode, the painting of the
// brick overlay band is INDEPENDENT of the chart interval. If price
// exceeds the required target price for the next brick, the band is
// updated immediately, instead of waiting for the price bar on the chart
// interval to close first. The brick starting anchor point will attempt
// to be a "nice number" at a round interval for the chart ticker. For
// example, if viewing EURUSD with the box size equal to 50 ticks/pips,
// the open and close prices will take the form of 1.2100, 1.2150, 1.2200,
// 1.2250, and so on. This is the same behavior as the normal traditional
// Renko bars in Trading View and other major trading platforms such as
// Meta Trader.
// Use the tick size in traditional mode to specify the block size, in
// ticks. This may give interesting results in FOREX pairs... as the tick
// size in Trading View may be 0.00001 instead of the normal pip size of
// 0.0001, so a 10 pip block size may be '100', and not the expected '10'.
// FOREX futures should work in the manner expected, a 10 pip block size
// will indeed equal 0.0010.
// The "ATR" mode functions differently than the Trading View built in
// version. The block size is updated each time the range is exceeded.
// In Trading View, when using the ATR mode, the ATR is the last ATR
// value calculated on the ENTIRE data interval, and is applied to all
// past data. You can see this when you press the '+' sign of the ticker
// in the top left of the chart window and you will see the brick size
// as a constant, the brick size is not a function of the ever changing
// ATR value of the price action. The block size of this script is not
// updated for each price candle (i.e. each 1HR on a 1HR chart), instead
// it is updated only when the price thresholds are exceeded requiring a
// the band to be updated. At that point the current ATR is considered
// and the brick size is updated.
// Options exist to show the current high and low of the brick, and to
// show the required levels that the price must exceed to draw a new
// brick and update the band.
Please leave comments if you notice any bugs or would like any new features added. I don't find much use for plotting the H/L of the current renko candle, but I have seen some request it in the past.
Cheers.
Cari skrip untuk "量比大于10+外盘大于内盘+股票市场含义"

EMA Indicators with BUY sell SignalCombine 3 EMA indicators into 1. Buy and Sell signal is based on
- Buy signal based on 20 Days Highest High resistance
- Sell signal based on 10 Days Lowest Low support
Input :-
1 - Short EMA (20), Mid EMA (50) and Long EMA (200)
2 - Resistance (20) = 20 Days Highest High line
3 - Support (10) = 10 Days Lowest Low line

Volume Range EventsChanges in the feelings (positive, negative, neutral) in the market concerning the valuation of an instrument are often preceded with sudden outbursts of buying and selling frenzies. The aim of this indicator is to report such outbursts. We can see them as expansions of volume, sometimes 10 times more than usual. and as extensions of the trading range, also sometimes 10 times more than usual (e.g. usual range is 10 cent suddenly a whole dollar.) The changes are calculated in such a way that these fit between plus and minus 100 percent, the bars are scaled in some sort of logarithmic way. The Emoline is the same as the one in the True Balance of Power indicator, which I already published
ONLY RISES ARE EVENTS
Sometimes analysts are tempted to give meaning to low volume or small ranges. These simply mean that the market has little interest in trading this instrument. I believe that in such cases the trader needs to wait for expansion and extension events to happen, then he can make a better guess of where the market is heading. As events often mark the beginning or ending of a trend, this indicator provides an early and clear signal, because it doesn’t bother us about non-events.
WHAT IS USUAL?
If the algorithm would use an average as a normal to scale volume or range events, then previous peaks will act as spoilers by making the average so high that a following peak is scaled too small. I developed a function, usual() , that kicks out all extremes of a ‘population of values’ and which returns the average of the non-extreme values. It can be called with any serial. This function is called by both algorithms that report volume and range peaks, which guarantees that the results are really comparable. As this function has a fixed look back of 8 periods, we might state that ‘usual’ is a short lived relative value. I think this doesn’t matter for the practical use of the indicator.
COLORING AND INTERPRETATION
I follow the categories in the ‘Better Volume Indicator’, published by LeazyBear, these are:
1. Climactic Volumes, event >40 % (this means peak is 1.5 X usual)
LIME: Climax Buying Volume, direction up, range event also > 30 %
RED: Climax Selling Volume, direction down, range event also > 30 %
AQUA: Climax Churning Volume, both directions, range event < 30%
2. Smaller Volumes, event <40 %
GREEN: Supportive Volume, both directions, if combined with range event
BLUE: Churning Volume, both directions, if not combined with range event (Professional Trading)
3. Just Range Events
BLACK histogram bars (Amateurish Trading)

Forex Master v4.0 (EUR/USD Mean-Reversion Algorithm)DESCRIPTION
Forex Master v4.0 is a mean-reversion algorithm currently optimized for trading the EUR/USD pair on the 5M chart interval. All indicator inputs use the period's closing price and all trades are executed at the open of the period following the period where the trade signal was generated.
There are 3 main components that make up Forex Master v4.0:
I. Trend Filter
The algorithm uses a version of the ADX indicator as a trend filter to trade only in certain time periods where price is more likely to be range-bound (i.e., mean-reverting). This indicator is composed of a Fast ADX and a Slow ADX, both using the same look-back period of 50. However, the Fast ADX is smoothed with a 6-period EMA and the Slow ADX is smoothed with a 12-period EMA. When the Fast ADX is above the Slow ADX, the algorithm does not trade because this indicates that price is likelier to trend, which is bad for a mean-reversion system. Conversely, when the Fast ADX is below the Slow ADX, price is likelier to be ranging so this is the only time when the algorithm is allowed to trade.
II. Bollinger Bands
When allowed to trade by the Trend Filter, the algorithm uses the Bollinger Bands indicator to enter long and short positions. The Bolliger Bands indicator has a look-back period of 20 and a standard deviation of 1.5 for both upper and lower bands. When price crosses over the lower band, a Long Signal is generated and a long position is entered. When price crosses under the upper band, a Short Signal is generated and a short position is entered.
III. Money Management
Rule 1 - Each trade will use a limit order for a fixed quantity of 50,000 contracts (0.50 lot). The only exception is Rule
Rule 2 - Order pyramiding is enabled and up to 10 consecutive orders of the same signal can be executed (for example: 14 consecutive Long Signals are generated over 8 hours and the algorithm sends in 10 different buy orders at various prices for a total of 350,000 contracts).
Rule 3 - Every order will include a bracket with both TP and SL set at 50 pips (note: the algorithm only closes the current open position and does not enter the opposite trade once a TP or SL has been hit).
Rule 4 - When a new opposite trade signal is generated, the algorithm sends in a larger order to close the current open position as well as open a new one (for example: 14 consecutive Long Signals are generated over 8 hours and the algorithm sends in 10 different buy orders at various prices for a total of 350,000 contracts. A Short Signal is generated shortly after the 14th Long Signal. The algorithm then sends in a sell order for 400,000 contracts to close the 350,000 contracts long position and open a new short position of 50,000 contracts).

My5min1. Follow the instructions for entry and exit exactly as above. Don’t second guess, or assume/presume anything.
2. Avoid entering the trade when the price is temporarily above /below 10 day MA, but the price candle hasn’t fully formed yet. Enter the trade only after the price candle closes above/below the 10 day MA.
3. Exit the trade immediately when the price candle closes above/below 10 day MA in the direction opposite to the trade. Don’t remain in the trade wishing it to turn in your favor.
4. Never ever trade in the opposite direction of the market. i.e. don’t buy when the price is below 200 day MA and sell when the price is above 200 day MA.
5. Take profits when limit is reached. Don’t be greedy and keep on increasing the target. Remember- A bird in hand is worth two in the bush.

MACD, backtest 2015+ only, cut in half and doubledThis is only a slight modification to the existing "MACD Strategy" strategy plugin!
found the default MACD strategy to be lacking, although impressive for its simplicity. I added "year>2014" to the IF buy/sell conditions so it will only backtest from 2015 and beyond ** .
I also had a problem with the standard MACD trading late, per se. To that end I modified the inputs for fast/slow/signal to double. Example: my defaults are 10, 21, 10 so I put 20, 42, 20 in. This has the effect of making a 30min interval the same as 1 hour at 10,21,10. So if you want to backtest at 4hr, you would set your time interval to 2hr on the main chart. This is a handy way to make shorter time periods more useful even regardless of strategy/testing, since you can view 15min with alot less noise but a better response.
Used on BTCCNY OKcoin, with the chart set at 45 min (so really 90min in the strategy) this gave me a percent profitable of 42% and a profit factor of 1.998 on 189 trades.
Personally, I like to set the length/signals to 30,63,30. Meaning you need to triple the time, it allows for much better use of shorter time periods and the backtests are remarkably profitable. (i.e. 15min chart view = 45min on script, 30min= 1.5hr on script)
** If you want more specific time periods you need to try plugging in different bar values: replace "year" with "n" and "2014" with "5500". The bars are based on unix time I believe so you will need to play around with the number for n, with n being the numbers of bars.

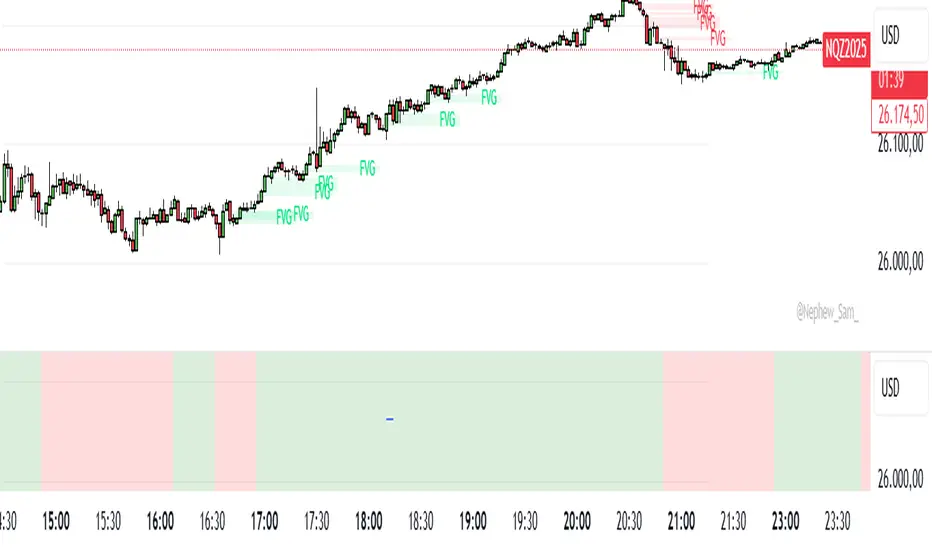
SMC Minimal Setup//@version=5
indicator("SMC Minimal Setup", overlay=true)
// === INPUTS ===
swingLeft = input.int(5, "Swing Left")
swingRight = input.int(5, "Swing Right")
structureLookback = input.int(20, "Structure Lookback")
// === MARKET STRUCTURE ===
var string structure = "neutral"
if high > ta.highest(high , structureLookback)
structure := "bullish"
if low < ta.lowest(low , structureLookback)
structure := "bearish"
// === SWING LEVELS ===
relevantHigh = ta.pivothigh(high, swingLeft, swingRight)
relevantLow = ta.pivotlow(low, swingLeft, swingRight)
// === LIQUIDITY SWEEPS ===
sweepHigh = not na(relevantHigh) and high > relevantHigh and close < relevantHigh
sweepLow = not na(relevantLow) and low < relevantLow and close > relevantLow
// === DISPLACEMENT CANDLES ===
bodySize = math.abs(close - open)
candleRange = high - low
avgRange = ta.sma(candleRange, 10)
displacementUp = close > open and bodySize > candleRange*0.6 and candleRange > avgRange
displacementDown = open > close and bodySize > candleRange*0.6 and candleRange > avgRange
// === SETUP ===
bullishSetup = sweepLow and displacementUp
bearishSetup = sweepHigh and displacementDown
plotshape(bullishSetup, style=shape.triangleup, location=location.belowbar, color=color.green, size=size.small)
plotshape(bearishSetup, style=shape.triangledown, location=location.abovebar, color=color.red, size=size.small)
// === FVG ===
bullishFVG = low > high
bearishFVG = high < low
if bullishFVG
box.new(left=bar_index-2, right=bar_index, top=low , bottom=high , bgcolor=color.new(color.green,85))
if bearishFVG
box.new(left=bar_index-2, right=bar_index, top=high , bottom=low , bgcolor=color.new(color.red,85))
// === BACKGROUND ===
bgcolor(structure=="bullish" ? color.new(color.green,80) : structure=="bearish" ? color.new(color.red,80) : na)
Crypto Market Cap: Ex Top10 & Ex StablesThis indicator calculates the true altcoin market capitalization by removing the top 10 cryptocurrencies (by market cap) and all major stablecoins from the total crypto market (CRYPTOCAP:TOTAL).
💡 Why it matters:
Most “TOTAL” or “OTHERS” charts still include stablecoins and sometimes top coins like BTC or ETH. This script gives a clearer view of liquidity flow into smaller-cap altcoins — the early signal for alt season and speculative market rotation.
📊 Formula:
TOTAL - (BTC + ETH + BNB + SOL + XRP + ADA + AVAX + DOGE + TRX + DOT) - (USDT + USDC + BUSD + DAI + TUSD + USDE + FDUSD)
🧠 Included:
50- and 200-day moving averages for trend context
Optional normalized index view (for performance comparison)
🧩 Use it to:
Detect early altcoin market expansions
Track when capital rotates out of BTC/ETH into smaller projects
Build watchlists that correlate to the “real alt market” strength
⚙️ Built in Pine Script v5. Fully customizable — you can easily edit which coins to exclude as the top 10 shifts.
#altcoins #marketcap #crypto #tradingview #bitcoin #ethereum #total3 #altseason #cryptoindicator

FVG MagicFVG Magic — Fair Value Gaps with Smart Mitigation & Clean up
FVG Magic finds every tradable Fair Value Gap (FVG), shows who powered it (bull vs bear participation), and then manages each gap intelligently as price interacts with it. The goal is simple: see the imbalances that matter, act with clarity, and keep the chart clean as conditions change.
What it does
Detects FVGs using either the classic ICT 3-candle rule (default) or a stricter version.
Splits volume inside the gap (sampled from a 10× lower timeframe) into Bull % / Bear %, shown as a compact horizontal meter at the gap’s left edge.
Tracks and labels each gap through clear states:
ACTIVE – newly formed, volume meter visible
50% SQ – midpoint tagged as “squared”
MITIGATED – fully filled
INVERSED – gap flips function after mitigation (acts as resistance for bullish gaps or support for bearish gaps)
Cleans up automatically so old levels don’t clutter the chart:
(Optional) remove on 50% SQ — instant or with a small delay
inversion window — if price enters the gap but doesn’t invert within N bars, remove once it fully mitigates
inversion clean up — after inversion, keep it N bars then delete (or remove immediately)
Visibility controls to match any data history or workflow:
Lookback (bars) — only keep FVGs created in the last N bars
Nearest per side — keep only the N closest bullish and bearish gaps to current price
Auto-tunes by timeframe (15m / H1 / H4) for sensible defaults on extensions, clean up windows, and meter width.
Dashboard (top-right) shows how many bullish/bearish FVGs are currently on the chart and which state labels are used.
How it works (plain English)
When a 3-candle imbalance forms, I draw a box for the gap and sample volume from a 10× faster timeframe to estimate who dominated that move.
While the gap is ACTIVE, you’ll see a small Bull % / Bear % meter at the left of the box plus the total traded volume text.
As price returns:
50% SQ (midline reached) → I can optionally remove the box instantly (or after a short delay).
Full mitigation (opposite edge hit) → state becomes MITIGATED.
If price then rejects through the other side, the box flips to INVERSED (acts like an SR flip).
After inversion, I’ll keep the box on chart for N bars (configurable) and then remove it.
If price entered the gap but never inverted within your inversion window, I’ll remove it as soon as it fully fills—because it’s no longer useful.
The result: you see timely levels with real participation context, then the chart self-maintains as soon as those levels are done doing their job.
Inputs & what they mean
Detection
Use Strict FVG Filter (extra conditions)
OFF (default) = ICT minimal rule (Bullish: low > high ; Bearish: high < low ) → catches everything.
ON = tighter definition that can skip marginal gaps.
Enable Size Filter (percentile)
OFF (default) = no size gate, plot all valid gaps.
ON = keep only larger gaps by percentile (set threshold below).
Core behaviour
Mitigation Source: high/low or close
high/low = wick-based confirmation (more responsive).
close = stricter, requires closes through boundaries.
Show Bullish / Bearish FVGs — enable/disable per side.
Show Volume Bars (only while ACTIVE) — toggle the Bull % / Bear % meter.
Clean up & lifecycle
Remove on 50% SQ (default ON) + Delay after 50% (bars)
0 = remove immediately on midline touch.
Inversion window after entry (bars, 0=off)
When price first enters the gap, start a timer; if it doesn’t invert within N bars and later fully mitigates, remove it.
Remove inversed after (bars, 0=immediate)
How long to keep a flipped level for context.
Visibility & performance
Lookback (bars) — only keep gaps created within the last N bars.
Keep only the N nearest per side (0=off) — keeps chart focused around current price.
Right Extension Bars — how far to extend the box to the right.
Max FVGs to keep — hard cap (FIFO removal).
Meter width (bars) — width of the Bull/Bear meter (stays stable when you zoom).
Appearance
Bullish / Bearish Fill — gap colours.
Inversed Fill — colour used when a gap flips.
Suggested defaults (what I use)
Detection: Strict OFF, Size Filter OFF (show all).
Mitigation Source: high/low (wick-based).
Remove on 50% SQ: ON, Delay: 0.
Inversion window: 6–8 bars (15m), 6 bars (H1), 5 bars (H4).
Inversed clean up: same as above (or 0 if you want immediate removal).
Nearest per side: 0 at first (see everything), then 2–4 once you’re comfortable.
Lookback: 5000 bars (or whatever your data allows).
The script auto-tunes some internals for 15m / H1 / H4 (extension length, meter width, etc.) so you should get a good experience out of the box.
How to use it in practice
Build bias (your method: HTF structure, VWAP, RSI/MACD, etc.).
Map imbalances with FVG Magic (show all first).
Prioritize by context: session levels, confluence with HTF structure, and the Bull % / Bear % meter:
Bullish FVG with high Bull % suggests constructive demand behind the move.
Bearish FVG with high Bear % suggests strong supply.
Wait for return into the gap. If 50% hits, the box will clear (by design) — treat that as the “job done” cue.
If price fully mitigates then rejects through, watch for INVERSED (acts like SR). Script will keep it for a few bars (your setting) and then auto-remove.
Keep the chart tidy with Nearest per side once you’re in flow.
Tip: If you want to see every last micro-gap on 15m, keep Strict OFF and Size Filter OFF. If it’s too busy, either enable the size filter or set Nearest per side = 2–3.
Notes & edge cases
Why a gap might not “50% SQ”: On close mode, wicks don’t count; switch to high/low if you want wick-based squaring.
Why a gap disappears early: You likely have Remove on 50% ON or hit an inversion window/clean up rule. That’s intentional to keep charts clean.
Meters only on ACTIVE: Once a gap is 50% / mitigated / inversed, meters hide and a simple text tag is used (or the box is removed per your rules).

Liquidity Grab + RSI Divergence═══════════════════════════════════════════════════════════════
LIQUIDITY GRAB + RSI DIVERGENCE INDICATOR
═══════════════════════════════════════════════════════════════
📌 OVERVIEW
This indicator identifies high-probability reversals by combining:
• Liquidity sweeps (stop hunts)
• RSI divergence confirmation
• Filters false breakouts automatically
═══════════════════════════════════════════════════════════════
🟢 BUY SIGNAL (Green Triangle Up)
REQUIRES BOTH CONDITIONS:
1. Liquidity Grab Below Previous Low
• Price breaks BELOW recent low
• Candle CLOSES ABOVE that low
• Traps sellers who shorted the breakdown
2. Bullish RSI Divergence
• Price: Lower Low (LL)
• RSI: Higher Low (HL)
• Shows weakening downward momentum
➜ Result: Potential bullish reversal
═══════════════════════════════════════════════════════════════
🔴 SELL SIGNAL (Red Triangle Down)
REQUIRES BOTH CONDITIONS:
1. Liquidity Grab Above Previous High
• Price breaks ABOVE recent high
• Candle CLOSES BELOW that high
• Traps buyers who bought the breakout
2. Bearish RSI Divergence
• Price: Higher High (HH)
• RSI: Lower High (LH)
• Shows weakening upward momentum
➜ Result: Potential bearish reversal
═══════════════════════════════════════════════════════════════
📊 VISUAL INDICATORS
Main Signals:
🔺 Large Green Triangle = BUY (Liq Grab + Bullish Div)
🔻 Large Red Triangle = SELL (Liq Grab + Bearish Div)
Reference Levels:
━ Red Line = Previous High Level
━ Green Line = Previous Low Level
Additional Markers (Optional):
○ Small Green Circle = Liquidity grab low only
○ Small Red Circle = Liquidity grab high only
✕ Small Blue Cross = Bullish divergence only
✕ Small Orange Cross = Bearish divergence only
═══════════════════════════════════════════════════════════════
⚙️ SETTINGS
1. Lookback Period (Default: 20)
• Range: 5-100
• Sets how far back to identify previous highs/lows
• Higher = fewer but stronger levels
• Lower = more frequent but weaker levels
2. RSI Length (Default: 14)
• Range: 5-50
• Standard RSI calculation period
• 14 is industry standard
3. RSI Divergence Lookback (Default: 5)
• Range: 3-20
• Controls pivot point sensitivity
• Higher = fewer divergence signals
• Lower = more divergence signals
4. Show Labels (Default: ON)
• Toggle BUY/SELL text labels
• Disable for cleaner chart view
═══════════════════════════════════════════════════════════════
💡 HOW TO USE
Step 1: WAIT FOR CONFIRMATION
• Only trade LARGE TRIANGLE signals
• Ignore small circles/crosses alone
Step 2: CHECK TIMEFRAME
• Best on: 15min, 1H, 4H, Daily
• Avoid: 1min, 5min (too noisy)
Step 3: CONFIRM CONTEXT
• Check overall market trend
• Identify key support/resistance
• Look for confluence with price action
Step 4: ENTRY & RISK MANAGEMENT
• Enter on signal candle close or pullback
• Stop loss below/above the liquidity grab wick
• Target: Previous swing high/low or key levels
• Risk/Reward: Minimum 1:2 ratio
Step 5: SET ALERTS
• Create alert for "BUY Signal"
• Create alert for "SELL Signal"
• Never miss opportunities
═══════════════════════════════════════════════════════════════
✅ BEST PRACTICES
DO:
✓ Use on multiple timeframes for confluence
✓ Combine with support/resistance zones
✓ Wait for both conditions (liq grab + divergence)
✓ Practice on demo account first
✓ Use proper position sizing
DON'T:
✗ Trade every small circle/cross
✗ Use on very low timeframes (<15min)
✗ Ignore overall market context
✗ Trade without stop loss
✗ Risk more than 1-2% per trade
═══════════════════════════════════════════════════════════════
⚠️ IMPORTANT NOTES
• This is a CONFIRMATION tool, not a holy grail
• No indicator is 100% accurate
• Combine with your trading strategy
• Backtest on your preferred instruments
• Adjust parameters for your trading style
• Higher timeframes = more reliable signals
• Always use risk management
═══════════════════════════════════════════════════════════════
🔔 ALERTS INCLUDED
Two alert conditions are built-in:
1. "BUY Signal" - Liquidity Grab + Bullish RSI Divergence
2. "SELL Signal" - Liquidity Grab + Bearish RSI Divergence
═══════════════════════════════════════════════════════════════
📈 RECOMMENDED SETTINGS BY TIMEFRAME
5-15 Min Charts:
• Lookback: 10-15
• RSI Length: 14
• RSI Div Lookback: 3-5
1H-4H Charts:
• Lookback: 20-30
• RSI Length: 14
• RSI Div Lookback: 5-7
Daily Charts:
• Lookback: 30-50
• RSI Length: 14
• RSI Div Lookback: 7-10
═══════════════════════════════════════════════════════════════
Good luck and trade safe! 🚀

Liquidity Stress Index (SOFR - IORB)How to use:
> +10 bps — TIGHT
−5 +10 bps — NEUTRAL
< −5 bps — LOOSE

Grok's xAI Signal (GXS) Indicator for BTC V6Grok's xAI Signal (GXS) Indicator: A Simple Guide
Imagine trying to decide if Bitcoin is a "buy," "sell," or "wait" without staring at 10 different charts. The GXS Indicator does that for you—it's like a smart dashboard for BTC traders, overlaying signals right on your price chart. It boils down complex market clues into one easy score (from -1 "super bearish" to +1 "super bullish") and flashes green/red arrows or shaded zones when action's needed. No fancy math overload; just clear visuals like tiny triangles for trades, colored clouds for trends, and a bottom "mood bar" (green=up vibe, red=down, gray=meh).
At its core, GXS mixes three big-picture checks:
Price Momentum (50% weight): Quick scans of RSI (overbought/oversold vibes), MACD (speed of ups/downs), EMAs (is price riding the trend wave?), and Bollinger Bands (is the market squeezing for a breakout?). This catches short-term "hot or not" energy.
Network Health (30% weight): A simple "NVT" hack using trading volume vs. price to spot if BTC feels undervalued (buy hint) or overhyped (sell warning). It's like checking if the crowd's too excited or chill.
Trend Strength (20% weight): ADX filter ensures signals only fire in "trending" markets (not choppy sideways noise), plus a MACD boost for extra momentum nudge.
Why this approach? BTC's wild—pure price charts give false alarms in flat times, while ignoring volume/network ignores the "why" behind moves. GXS blends old-school TA (reliable for patterns) with on-chain smarts (crypto-specific "under the hood" data) and a trend gate (skips 70% of bad trades). It's conservative: Signals need the score to cross ±0.08 and a strong trend, reducing noise for swing/position traders. Result? Fewer emotional guesses, more "wait for confirmation" patience—perfect for volatile assets like BTC where hype kills.
Quick Tips to Tweak for Better Results
Start with defaults, then experiment on historical charts (backtest via TradingView's strategy tester if pairing with one):
Fewer False Signals: Bump thresholds to ±0.15 (buy/sell)—trades only on stronger conviction, cutting whipsaws by 20-30% in choppy markets. Or raise ADX thresh to 28 for "only big trends."
Faster/Slower Response: Shorten EMAs (e.g., 5/21) or RSI (10) for quicker scalps; lengthen (12/50) for swing holds. Test on 4H/daily BTC.
Volume Sensitivity: If NVT flips too often, extend its length to 20—smooths on-chain noise in bull runs.
Visual Polish: Crank cloud opacity to 80% for subtler fills; toggle off EMAs if they clutter. Enable table for score breakdowns during live trades.
Risk Tip: Always pair with stops (e.g., 2-3% below signals). On BTC, tweak in bull markets (looser thresh) vs. bears (tighter).
In short, GXS is your BTC "sixth sense"—balanced, not black-box. Tweak small, track win rate, and let trends lead. Happy trading!

High Zone MapperHigh Zone and Low Zone Mapper — Quick Manual (Short-Term Trading)
Author: hkpress | Script date: 2025-10-26
This indicator draws: PDH/PDL (Prior Day High/Low), PWH/PWL (Prior Week High/Low), ORH/ORL (Opening Range High/Low), IDH/IDL (Intraday High/Low), plus a shaded Opening Range box.
I built this script after watching an interview on TradingLion with a Hong Kong trader who uses prior-day, opening-range, intraday, and prior-week levels to plan entries and exits. The approach is especially useful for traders who run tight stops (about 1.5%–3%) while aiming to size up into bigger positions. (Youtube: www.youtube.com)
1) Quick Start (15-minute default)
Timeframe: use 1–15m for scalps, 5–30m for intraday.
Opening Range (OR — Opening Range): default 15 minutes.
Turn on “Show OR lines while opening range builds” if you want to see ORH/ORL during the first 15 minutes.
Session mode:
Stocks → Use Trading Session = ON (RTH — Regular Trading Hours, e.g., 09:30–16:00).
Crypto/24h → Use Trading Session = OFF (day-start mode).
Visuals: enable PDH/PDL, PWH/PWL, ORH/ORL, IDH/IDL, and the Opening Range box (fill).
2) What each line means
PDH/PDL (Prior Day High/Low): Yesterday’s extremes; frequent reaction zones.
PWH/PWL (Prior Week High/Low): Last week’s extremes; stronger “fences.”
ORH/ORL (Opening Range High/Low): High/low of the first 15 minutes by default; key breakout compass.
IDH/IDL (Intraday High/Low): Today’s high/low so far; confirms momentum after a break.
3) Short-Term Playbook (step-by-step)
A. Before the open
Note where price is vs PDH/PDL and PWH/PWL to set a bias.
Above PDH and pushing up → bullish lean.
Below PDL and slipping → bearish lean.
B. First 15 minutes (Opening Range forms)
Let the Opening Range box print (ORH top, ORL bottom).
Think of this box as the day’s first “battlefield.”
C. Breakout entries
Long: Clean break above ORH (preferably with momentum/volume).
Stop: just below ORH (aggressive) or below ORL (conservative).
Targets: step up through PDH → PWH.
Short: Clean break below ORL.
Stop: just above ORL (aggressive) or above ORH (conservative).
Targets: step down through PDL → PWL.
D. Retest entries (missed the first move?)
After a break, wait for a retest of ORH/ORL from the other side.
Enter on rejection/continuation; place stop on the opposite side of the retested level.
E. Momentum confirmation
New IDH (Intraday High) after an ORH break = trend strengthening (consider add/hold).
New IDL after an ORL break = downtrend strengthening.
Trail stops below higher lows (long) or above lower highs (short).
F. Range mode (no break yet)
If price stays inside the box, fade edges: buy near ORL, sell near ORH, until a decisive break.
4) Risk rules (keep it simple)
Aim for R:R (Risk-to-Reward) ≥ 1:2.
Set a daily max loss (e.g., 1–2R) and respect it.
Invalidation: if price breaks and then re-enters the box and holds, exit—don’t argue.
5) Quick example
The 15-minute OR prints: ORL = 100, ORH = 105.
Price breaks 106 with momentum → Long.
Stop 104.8 (below ORH) or 99.8 (below ORL).
Targets: PDH, then PWH. Trail as IDH keeps making new highs.
6) Handy tweaks
Noisy/news days: widen to 30-minute OR to reduce whipsaws.
Strong trend open: tighten to 5–10-minute OR to engage earlier.
Choppy session: stick to box-edge fades or stand aside after two failed breaks.
7) Built-in alerts to consider
“Break Above ORH / Below ORL” → entry triggers.
“New IDH / New IDL” → momentum confirms; tighten stops or scale.
“Break Above PDH / Below PDL / Above PWH / Below PWL” → target hits or bigger trend shifts.
8) Troubleshooting
No lines? Switch to an intraday timeframe (1–60m).
ORH/ORL missing? Turn ON Show OR lines while opening range builds.
Session mismatch? Use correct RTH hours, or turn session OFF for 24h symbols.
Abbreviation cheat-sheet
OR (Opening Range), ORH/ORL (Opening Range High/Low)
PDH/PDL (Prior Day High/Low)
PWH/PWL (Prior Week High/Low)
IDH/IDL (Intraday High/Low)
RTH (Regular Trading Hours), R:R (Risk-to-Reward)

Market Opens + Killzones — New York, Tokyo & London (SMC/ICT)Market Opens + Killzones — New York, London & Tokyo (SMC/ICT) — TradingATH
Precision. Timing. Liquidity.
This refined overlay defines the world’s three dominant trading sessions — New York , London & Tokyo — plus their critical overlap. Each Opening and Killzone is plotted with full-height visual blocks and precise time anchoring, giving you an immediate understanding of when and where true price delivery begins.
Designed for ICT and SMC Traders , it provides a disciplined structure to navigate intraday volatility — aligning executions with the moments institutional liquidity enters the market.
What You’ll See
New York Killzone (08:30 – 10:30 NY) → Gray full-height Block
London Killzone (07:00 – 10:00 London) → Dark-gray Block
Tokyo Killzone (09:00 – 11:00 Tokyo) → Black Block
London–New York Overlap (13:30 – 16:00 London) → Blue Block
Session Opening Lines : Precise vertical markers with optional labels and customizable color, style, and width.
Every Block extends from chart top to bottom — forming crystal-clear time partitions that highlight where volatility and liquidity converge.
Features
True global time synchronization — automatic daylight-saving adjustment; no manual offset needed.
Full-height killzones — visually structured blocks that scale seamlessly across any timeframe.
Configurable session openings — control color, line width, label visibility, and transparency.
Daily auto-reset — clean, non-repainting visuals with no overlap or drift.
Lightweight performance — optimized rendering with zero lag, even on lower timeframes.
Perfect For
Intraday and Scalping Traders timing executions around session volatility.
ICT / Smart Money Concepts practitioners focusing on liquidity windows.
Traders seeking precise, time-based market context for entries and exits.
Recommended Settings
Line Width: 3–4 px for optimal visibility.
Block Transparency: 60 – 75 % for clean chart integration.
Focus: London + New York sessions for highest liquidity.
In Short
Simple. Accurate. Powerful.
Market Opens + Killzones — New York, London & Tokyo (SMC/ICT) delivers a clean, professional mapping of institutional trading hours — allowing you to trade exactly when the market moves with purpose.
Created by: TradingATH

Crypto Index Price# Crypto Index Price - Indicator Description
## 📊 What is this indicator?
**Crypto Index Price** is an indicator for creating your own cryptocurrency index based on an equal-weighted portfolio. It allows you to track the overall dynamics of the cryptocurrency market through a composite index of selected assets.
## 🎯 Key Features
- **Up to 20 assets in the index** — create an index from any trading pairs
- **Equal-weighted methodology** — each asset has the same weight in the index
- **Moving average** — optional trend filter for the index
- **Flexible visualization settings** — customizable colors and line thickness
## 📈 How to Use
The indicator is displayed in a separate pane below the chart and shows:
1. **Blue line** — crypto index value
2. **Orange line** (optional) — moving average of the index
### Trading Applications:
- **Identify overall market trend** — if the index is rising, most coins are in an uptrend
- **Divergences** — divergence between your asset and the index may signal local opportunities
- **Signal confirmation** — use the index to confirm trading decisions on individual coins
- **Market condition filter** — trade longs when index is above MA, shorts when below
## ⚙️ Settings
### Assets (Symbols)
- **Asset 1-10** — main cryptocurrencies (default: BTC, ETH, BNB, SOL, XRP, ADA, AVAX, LINK, DOGE, TRX)
- **Asset 11-20** — additional slots for index expansion
### Visual Parameters
- **Index line color** — main line color (default: blue)
- **Line width** — from 1 to 5 pixels
- **Show moving average** — enable/disable MA
- **MA period** — moving average calculation period (default: 20)
- **MA color** — moving average line color (default: orange)
## 💡 Recommendations
- For a top coins index, use 5-10 largest cryptocurrencies by market cap
- For an altcoin index, add medium and small coins from your sector
- Use MA to filter false signals and identify the global trend
- Compare individual asset behavior with the index to find anomalies
## ⚠️ Important
The indicator uses equal-weighted methodology — each coin contributes equally regardless of price or market cap. This differs from cap-weighted indices and may provide a different market perspective.
---
*This indicator is intended for analysis and is not trading advice. Always conduct your own analysis before making trading decisions.*
---

Adaptive Volatility Bands | AlphaNattAdaptive Volatility Bands (AVB) | AlphaNatt
Professional-grade dynamic bands that adapt to market volatility and trend strength, featuring smooth gradient visualization for enhanced chart clarity.
🎯 CORE CONCEPT
AVB creates self-adjusting bands around a customizable basis line, expanding during trending markets and contracting during consolidation. The gradient fill provides instant visual feedback on price position within the volatility envelope.
✨ KEY FEATURES
5 Basis Types: Choose between SMA, EMA, ALMA, KAMA, or VWMA for the centerline calculation
Adaptive Band Width: Bands automatically widen in strong trends and tighten in ranging markets
Smooth Gradient Fills: 10-layer gradient on each side for professional depth visualization
Multiple Volatility Metrics: ATR, Standard Deviation, or Range-based calculations
Squeeze Detection: Identifies Bollinger/Keltner squeeze conditions for breakout anticipation
Dynamic Color States: Cyan (#00F1FF) for bullish, Magenta (#FF019A) for bearish conditions
📊 HOW IT WORKS
The basis line is calculated using your selected moving average type
Volatility is measured using ATR, StDev, or Range
Trend strength is quantified via linear regression
Band width adapts based on normalized trend strength (when enabled)
Gradient layers create smooth visual transitions from bands to basis
Color state changes based on price position and basis direction
🔧 PARAMETER GROUPS
Basis Configuration:
Basis Type: Moving average calculation method
Basis Length (20): Period for centerline calculation
ALMA Settings: Offset (0.85) and Sigma (6) for ALMA basis
Volatility Settings:
Volatility Method: ATR, Standard Deviation, or Range
Volatility Length (14): Lookback for volatility calculation
Band Multiplier (2.0): Distance of bands from basis
Adaptive Settings:
Enable Adaptive (true): Toggle dynamic band adjustment
Adaptation Period (50): Trend strength measurement window
Squeeze Detection:
BB/KC Parameters: Settings for squeeze identification
Expansion Threshold: Multiplier for expansion signals
📈 TRADING SIGNALS
Long Conditions:
Price crosses above basis
Basis line is rising
Band color shifts to cyan
Short Conditions:
Price crosses below basis
Basis line is falling
Band color shifts to magenta
💡 USAGE STRATEGIES
Trend Following: Trade with the basis direction when bands are expanding
Mean Reversion: Fade moves to outer bands during squeeze conditions
Breakout Trading: Enter on expansion signals after squeeze periods
Support/Resistance: Use bands as dynamic S/R levels
Position Sizing: Wider bands suggest higher volatility - adjust size accordingly
🎨 VISUAL ELEMENTS
Gradient Fills: 10 opacity layers creating smooth band transitions
Dynamic Colors: State-dependent coloring for instant trend recognition
Basis Line: Bold centerline changes color with trend state
Band Lines: Outer boundaries with matching state colors
⚡ BEST PRACTICES
The AVB indicator works optimally on liquid instruments with consistent volume. The adaptive feature performs best in trending markets but can generate false signals during choppy conditions. Consider using alongside momentum indicators for confirmation. The gradient visualization helps identify price position within the volatility envelope at a glance.
🔔 ALERTS INCLUDED
Long/Short Signals
Squeeze Conditions
Expansion Breakouts
Band Touch Events
Version 6 | Pine Script™ | © AlphaNatt

Relative Momentum Rotation [CHE] Relative Momentum Rotation — Ranks assets by multi-horizon momentum for guided rotational selection with regime overlay
Summary
This indicator evaluates a universe of assets using a blended momentum measure across three time horizons, then ranks them to highlight top performers for potential portfolio rotation. It incorporates a regime filter to contextualize signals, tinting the background to indicate favorable or unfavorable market conditions and labeling transitions for awareness. By focusing on relative strength within a selectable universe, it helps identify leaders without relying on absolute thresholds, reducing noise from isolated trends and promoting disciplined asset switching.
Motivation: Why this design?
Traders often struggle with momentum signals that perform unevenly across market phases, such as overreacting in volatile periods or lagging in steady uptrends, leading to suboptimal rotations in multi-asset portfolios. The core idea of relative momentum rotation addresses this by comparing assets head-to-head within a defined group, blending short- and long-term changes to capture sustained strength while a regime overlay adds a macro layer to avoid fighting broader trends. This setup prioritizes peer-relative outperformance over standalone measures, aiding consistent selection in rotational strategies.
What’s different vs. standard approaches?
- Reference baseline: Traditional rate-of-change indicators track absolute price shifts over a single window, which can generate whipsaws in sideways markets or miss cross-asset opportunities.
- Architecture differences:
- Blends three distinct horizons into one composite score for a fuller momentum picture, rather than isolating one period.
- Applies ranking across a customizable universe (e.g., crypto or tech stocks) to emphasize relatives, not absolutes.
- Integrates a simple regime check via moving average crossover on a reference symbol, gating selections without overcomplicating the core logic.
- Outputs a dynamic table for visual ranking, plus subtle visual cues like background tints, instead of cluttered plots.
- Practical effect: Charts show clearer hierarchy among assets, with regime tints providing at-a-glance context—top ranks stand out more reliably in bull regimes, helping traders focus rotations without constant recalibration.
How it works (technical)
The indicator starts by assembling a list of symbols from the selected universe, including only those marked as active to keep the group focused. For each symbol, it gathers change rates over three specified horizons on a higher timeframe, blends them using user-defined weights (automatically normalized if they do not sum to one), and computes a single composite score. Scores are then ranked to select the top performers up to a set number, forming a rotation candidate list.
To add context, a regime state is determined by comparing the reference symbol's price to its moving average on daily bars—above signals a positive environment, below a negative one, with an option to invert this logic. The current chart's symbol is checked against the top list for inclusion status. All higher-timeframe data pulls are set to avoid lookahead bias, though updates may shift slightly until bars close. Persistent variables track the table state and prior regime to handle redraws efficiently, ensuring the display rebuilds only when the selection count changes.
Parameter Guide
Universe — Switches between predefined crypto or US-tech symbol sets for ranking peers. Default: Crypto. Trade-offs/Tips: Crypto for volatile assets; US-Tech for equities—match to your portfolio to avoid mismatched volatility.
Include Symbol 1–12 — Toggles individual symbols in the universe on or off. Default: Varies (true for top 10, false for extras). Trade-offs/Tips: Start with defaults for a balanced group; disable laggards to sharpen focus, but keep at least 5–8 for robust ranking.
Scoring Timeframe — Sets the aggregation period for momentum changes (e.g., monthly bars). Default: Monthly. Trade-offs/Tips: Monthly for long-term rotation; weekly for faster signals—increases noise if too short.
Weight 12m / 6m / 3m — Adjusts emphasis on long/medium/short horizons in the blend. Default: 0.50 / 0.30 / 0.20. Trade-offs/Tips: Heavier long-term for stability in trends; balance to fit asset class—test sums near 1.0 to avoid auto-normalization surprises.
ROC over MA instead of Close — Uses smoothed averages for change rates to reduce chop. Default: False. Trade-offs/Tips: Enable in noisy markets for fewer false tops; adds slight lag, so monitor for delayed rotations.
Top N to hold — Limits selections to this many highest-ranked assets. Default: 10. Trade-offs/Tips: Lower for concentrated bets (higher risk/reward); higher for diversification—align with your position sizing.
Mark current symbol if in Top N — Highlights if the chart's asset ranks in the selection. Default: True. Trade-offs/Tips: Useful for self-scanning; disable in multi-chart setups to declutter.
Enable Regime Filter — Activates macro overlay using reference symbol. Default: True. Trade-offs/Tips: Core for trend-aware trading; disable for pure momentum plays, but risks counter-trend entries.
Regime Symbol — Chooses the benchmark for regime (e.g., broad index). Default: QQQ. Trade-offs/Tips: Broad market proxy like SPY for equities; swap for BTC in crypto to match universe.
SMA Length (D) — Sets the averaging window for regime comparison. Default: 100. Trade-offs/Tips: Longer for fewer flips (smoother regimes); shorter for quicker detection—default suits daily checks.
Invert (rare) — Flips the regime logic (price above average becomes negative). Default: False. Trade-offs/Tips: Only if your view inverts the benchmark; test thoroughly as it reverses all tints/labels.
Show Ranking Table — Displays the ranked list with scores and regime status. Default: True. Trade-offs/Tips: Essential for selection; position tweaks help on crowded charts.
Table X / Y — Places the table on the chart (e.g., top-right). Default: Right / Top. Trade-offs/Tips: Corner placement avoids price overlap; middle for central focus in reviews.
Dark Theme — Applies inverted colors for visibility. Default: True. Trade-offs/Tips: Matches most TradingView themes; toggle for light backgrounds without losing contrast.
Text Size — Scales table font for readability. Default: Normal. Trade-offs/Tips: Smaller for dense data; larger on big screens—impacts only last-bar render.
Background Tint by Regime — Colors the chart faintly green/red based on state. Default: True. Trade-offs/Tips: Subtle cue for immersion; disable if it distracts from price action.
Label on Regime Flip — Adds text markers at state changes. Default: True. Trade-offs/Tips: Aids journaling flips; space them by disabling in low-vol periods to cut clutter.
Reading & Interpretation
The ranking table lists top assets by position, symbol, percentage score (higher indicates stronger blended momentum), and regime status—green "ON" for favorable, red "OFF" for cautionary. Background shifts to a light teal in positive regimes (suggesting alignment for longs) or pale red in negative ones (hinting at reduced exposure). Flip labels appear as green "Regime ON" above bars or red "Regime OFF" below, marking transitions without ongoing noise. If the current symbol appears in the top rows with a solid score, it signals potential hold or entry priority within rotations.
Practical Workflows & Combinations
- Trend following: Scan the table weekly on monthly charts for top entrants; confirm with higher highs/lows in price structure before rotating in. Use regime tint as a veto—skip buys in red phases.
- Exits/Stops: Rotate out of bottom-half ranks monthly; tighten stops below recent lows during regime flips to protect against reversals. Pair with volatility filters like average true range for dynamic sizing.
- Multi-asset/Multi-TF: Defaults work across crypto/equities on daily+ timeframes; for intraday, shorten scoring to weekly but expect more interim noise. Scale universe size with portfolio count—e.g., top 5 for aggressive crypto rotations.
Behavior, Constraints & Performance
Signals update on bar close to confirm higher-timeframe data, but live bars may preview shifts from security calls, introducing minor repaint until finalized—mitigated by non-lookahead settings, though daily regime checks can lag by one session. Arrays handle up to 12 symbols efficiently, with loops capped at selection size; max bars back at 5000 supports historical depth without overload. Resource use stays low, but dense universes on very long charts may slow initial loads.
Known limits include sensitivity to universe composition (skewed groups amplify biases) and regime lag at sharp market turns, potentially delaying rotations by a period.
Sensible Defaults & Quick Tuning
Defaults assume a 10-asset crypto rotation on monthly scoring with balanced weights and QQQ regime—ideal for intermediate-term equity-like plays. For too-frequent table reshuffles, extend scoring timeframe or weight longer horizons more. If selections feel sluggish, shorten the 3-month weight or enable MA smoothing off. In high-vol environments, raise top N and SMA length for stability; for crypto bursts, drop to weekly scoring and invert regime if using a volatile proxy.
What this indicator is—and isn’t
This is a selection and visualization tool for momentum-based rotations, layering relative ranks and regime context onto charts to inform asset picks. It is not a standalone system—pair it with entry/exit rules, position sizing, and risk limits. Nor is it predictive; it reacts to past changes and may underperform in prolonged ranges or during universe gaps.
Disclaimer
The content provided, including all code and materials, is strictly for educational and informational purposes only. It is not intended as, and should not be interpreted as, financial advice, a recommendation to buy or sell any financial instrument, or an offer of any financial product or service. All strategies, tools, and examples discussed are provided for illustrative purposes to demonstrate coding techniques and the functionality of Pine Script within a trading context.
Any results from strategies or tools provided are hypothetical, and past performance is not indicative of future results. Trading and investing involve high risk, including the potential loss of principal, and may not be suitable for all individuals. Before making any trading decisions, please consult with a qualified financial professional to understand the risks involved.
By using this script, you acknowledge and agree that any trading decisions are made solely at your discretion and risk.
Do not use this indicator on Heikin-Ashi, Renko, Kagi, Point-and-Figure, or Range charts, as these chart types can produce unrealistic results for signal markers and alerts.
Best regards and happy trading
Chervolino
Where does it come from, specifically?
The principle of “composite momentum across multiple horizons” is common in TAA/rotation strategies. As a documented example: Keller/Butler use a composite 1/3/6/12-month momentum (“13612W”)—same idea, different windows/weights.
Robot Wealth
A practical vendor example: EPS Momentum calculates an RMR composite as a weighted mix of 12/6/3/1-month ranks (very close to “12/6/3”).
EPS Momentum
Related but not identical: StockCharts’ RRG measures the momentum rotation of relative strength—often mentioned in the same context, but it doesn’t have a fixed “12/6/3” composite.
chartschool.stockcharts.com
How is it typically computed?
ROC_12 + ROC_6 + ROC_3 (often scaled/weighted), then ranked vs. peers; the rotation periodically holds the top ranks in the portfolio. (Variants use different weights or additionally include 1-month—see the sources above.)
robotwealth.com
epsmomentum.com

Trend Candles Full ColorThe coloring over the candle sticks isn't showing up on the picture for some reason but when you click on the indicator the color coding will appear on the chart.
Trend Candles Full Color Indicator Explanation The "Trend Candles Full Color" indicator, designed for TradingView, visually enhances candlestick charts by coloring candles based on their position relative to a simple moving average (SMA). Here's how it works and how it can benefit traders: How It Works Input : Adjust the SMA period (default is 20) to define the trend length.
Logic : The indicator compares the closing price of each candle to the SMA: Green Candle : Close is above the SMA (indicating an uptrend).
Red Candle : Close is below the SMA (indicating a downtrend).
Gray Candle : Close equals the SMA (neutral/no clear trend).
Output : Candles (body, wick, and border) are colored green, red, or gray based on the trend, overlaid directly on your price chart.
Benefits and Use Cases Trend-Following Strategies Benefit: Clearly identifies bullish (green) or bearish (red) trends, helping traders ride momentum.
Example: A swing trader using a 20-period SMA can enter long positions when candles turn green (price above SMA) and exit or short when candles turn red, confirming trend reversals.
Reversal Trading Benefit: Gray candles signal indecision near the SMA, often a precursor to reversals.
Example: A day trader might watch for gray candles after a prolonged uptrend (green candles) to anticipate a potential bearish reversal, combining with other indicators like RSI for confirmation.
Scalping Benefit: Quick visual cues for short-term trend changes on lower timeframes.
Example: A scalper on a 5-minute chart can use green candles to confirm quick bullish moves and red candles to avoid counter-trend trades, enhancing decision speed.
Position Sizing or Risk Management Benefit: Color changes highlight trend strength, aiding in adjusting trade size or stops.
Example: A trader might increase position size during strong green candle sequences (sustained uptrend) and tighten stops when gray candles appear, signaling potential trend weakness.
Tips for Use Adjust the MA Length to suit your trading style (e.g., shorter for scalping, longer for swing trading).
Combine with other indicators (e.g., support/resistance, MACD) for better accuracy.
Test on different timeframes to match your strategy.
Recommended MA Length for 1-Minute Charts Short-Term/Scalping (1-5 minute trades):10-period SMA : Very sensitive, ideal for capturing quick price movements in fast markets. May produce more noise (false signals).
20-period SMA : A balanced choice for 1-minute charts, smoothing minor fluctuations while reacting to short-term trends. A great starting point for scalpers.
Intraday Trend Trading (10-30 minute holds):50-period SMA : Captures broader intraday trends, reducing noise but lagging slightly. Suitable for larger moves within a session.
This indicator simplifies trend identification, making it a versatile tool for traders of all styles, from beginners to advanced users!
Recommended MA Length for Swing Trading / Higher Timeframes Swing Trading (holding trades for days to weeks):50-period SMA : A popular choice for swing traders on higher timeframes (e.g., 1-hour or 4-hour charts). It smooths out short-term fluctuations while identifying medium-term trends. Ideal for capturing multi-day swings.
100-period SMA : Slightly longer, this MA is great for confirming stronger, more sustained trends. It’s useful on 4-hour or daily charts for swing traders aiming to ride larger price moves.
Longer-Term Trend Trading (holding for weeks to months):200-period SMA : A classic choice for higher timeframes like daily or weekly charts. It highlights major market trends and is widely used by swing and position traders to filter out noise and focus on long-term direction.
150-period SMA : A middle ground between the 100 and 200 SMA, suitable for daily charts when you want a balance between responsiveness and trend reliability.

Pullback Finder AutoPullback Finder Auto — Intraday Momentum Cooling Detector
Pullback Finder Auto is designed to find stocks that have made a strong intraday run from the open and are now cooling off while still positive — the classic pullback zone where continuation entries often form.
It automatically measures the percentage change from today’s open and highlights bars where:
the stock has already run at least a chosen amount (for example +10 % above its open), and
the current price is still up but within a defined pullback range (for example between +3 % and +8 % above the open).
When those two conditions are met, you’ll see green graphics on your chart:
Green triangle markers under the candle.
Optionally, small green PB labels such as “PB 5.2 %” showing the exact percentage from open when the setup occurs.
A green highlight in the sub‑window or line plot if you left the “Change from Open %” plot active.
These are your visual cues that a pullback has formed — a stock that previously ran and is now pulling back while holding strength.
How it works
The script continuously monitors:
• High % from Open = (high − open) / open × 100
• Current % from Open = (close − open) / open × 100
A “Pullback” condition triggers only if:
the high % is greater than or equal to your minimum run threshold, and
the current % sits between your minimum and maximum pullback percentages.
When both are true, the indicator plots the green triangle and optional label.
Default parameters
Min Run % = 10
Min Current % = 3
Max Current % = 8
Session Start = 09:30 – 16:00 US Eastern
All can be changed to fit different volatility levels.
Lower values catch smaller moves; higher values restrict signals to explosive runners.
Using it in real time
During live trading, Pullback Finder Auto updates with each candle.
When a bar first enters the target zone, a green triangle and PB label will appear immediately under that candle.
These are dynamic: if price moves out of the valid zone on the same bar, the marker may disappear.
You can create an alert on “Pullback Finder Auto – Pullback Candidate” to be notified whenever new triangles appear across your active symbols.
This works on any timeframe:
use shorter timeframes such as 1‑minute or 5‑minute charts for fast, intraday detection,
use longer timeframes for a broader view of the day’s market structure.
Using it on past data (scanning backwards)
When you scroll back through history, past green triangles remain visible at every bar where the condition was true at that time.
The PB labels next to those candles show exactly how far above the open the stock was trading during the historical setup.
Use this for visual back‑testing: study how price reacted after these pullback points, adjust the thresholds, and refine your criteria for different markets.
The grey or teal line under the chart (if enabled) shows the percent‑from‑open curve so you can see the full run‑and‑cool pattern leading into each triangle signal.
If you convert the indicator into a strategy, the same condition becomes historical entry points you can test with the Strategy Tester.
Summary
1. Pullback Finder Auto paints green triangles and PB labels whenever an intraday pullback fits your criteria.
2. It runs dynamically in real‑time and also preserves markers for historical review.
3. Adjust the thresholds to match volatility or timeframe.
4. Ideal for visual scanning, watchlist alerts, or integration into a lightweight screening strategy.

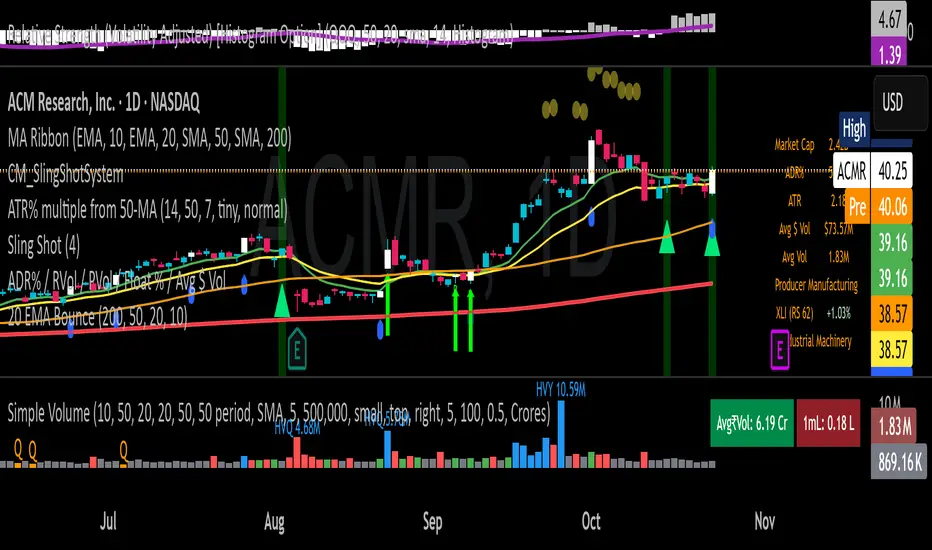
20 EMA Undercut Bounce - M4v3r1ck💎 The "EMA Undercut Bounce" Bullish Scanner
This indicator is designed to identify high-conviction continuation patterns where price makes a temporary dip for liquidity before resuming a powerful, established uptrend. It specifically looks for a bullish rejection off the 20-period Exponential Moving Average (EMA).
🎯 Strategy Logic
The signal is generated only on the Daily (1D) timeframe when the following five precise conditions are met on the most recent completed bar:
1. Price Action (The Undercut Bounce)
• Undercut: The bar's low price must have touched or temporarily traded below the 20-Day EMA.
• Rejection: The bar's close price must have fully recovered and closed above the 20-Day EMA. This is the classic sign of strong buying pressure defending a key support level.
2. Strong Trend Hierarchy (The Bullish Stack)
The moving averages must be perfectly stacked, confirming a robust multi-timeframe uptrend structure:
• 10-Day EMA > 20-Day EMA
• 20-Day EMA > 50-Day SMA
• 50-Day SMA > 200-Day SMA
3. Momentum Confirmation (The Upward Slope)
Both the 10-Day EMA and the 20-Day EMA must be rising from the previous day. This ensures that the short-term trend momentum is positive, ruling out signals during flat or turning markets.
💡 How to Use This Indicator
1. Timeframe: Ensure your chart is set to the Daily (1D) timeframe for accurate results.
2. Signal: A Green Background highlight and an Up-Arrow below the bar mark a confirmed signal.
3. Alerts: Use the built-in alert condition to set up notifications for stocks on your watchlist, allowing you to catch these high-quality setups without constantly monitoring charts.
This script is ideal for trend-following traders looking to enter a position after a healthy shakeout and confirmation of continued bullish commitment.
Advanced Multi-Timeframe Trend & Signal System═══════════════════════════════════════════════════════════════
ADVANCED MULTI-TIMEFRAME TREND & SIGNAL SYSTEM v1.0
═══════════════════════════════════════════════════════════════
Created by: Zakaria Safri
License: Mozilla Public License 2.0
A comprehensive technical analysis tool designed for traders seeking
multi-dimensional market insights. This indicator combines proven
technical analysis methods with modern visualization techniques.
═══════════════════════════════════════════════════════════════
KEY FEATURES
═══════════════════════════════════════════════════════════════
✓ SUPERTREND SIGNAL GENERATION
- Customizable sensitivity settings
- Clear long/short entry signals
- Automatic trend direction detection
- ATR-based dynamic calculations
✓ MULTI-TIMEFRAME DASHBOARD
- Real-time trend analysis across 6 timeframes
- Synchronized trend confirmation
- Customizable table position and size
- Current: 1M, 5M, 15M, 1H, 1D coverage
✓ QQE REVERSAL DETECTION
- Quantitative Qualitative Estimation algorithm
- Early reversal signal identification
- Adjustable RSI and smoothing parameters
- Confirmation-based plotting
✓ DYNAMIC SUPPORT & RESISTANCE
- Pivot-based level calculation
- Quick and standard pivot detection
- Color-coded zones (8 levels)
- Automatic level updates
✓ MOMENTUM BREAKOUT SIGNALS
- Ichimoku-inspired calculations
- Bullish and bearish breakout detection
- Visual zone highlighting
- Trend confirmation filters
✓ RISK MANAGEMENT SYSTEM
- ATR-based stop loss calculation
- Multiple take profit targets (TP1, TP2, TP3)
- Customizable risk-to-reward ratios
- Dynamic price level tracking
- Hit detection markers
✓ VOLATILITY BANDS
- Keltner Channel implementation
- Multiple band layers (3 levels)
- EMA-based calculations
- Adaptive to market conditions
✓ TREND CLOUD VISUALIZATION
- Dual moving average cloud
- Clear trend direction indication
- Customizable color scheme
- Trend bar coloring
═══════════════════════════════════════════════════════════════
HOW TO USE
═══════════════════════════════════════════════════════════════
SETUP:
1. Add indicator to your chart
2. Configure sensitivity in Core Signals section
3. Enable desired features (signals, reversals, breakouts)
4. Set up risk management levels if trading
5. Position MTF dashboard to preference
SIGNAL INTERPRETATION:
• LONG Signal: Price crosses above Supertrend
• SHORT Signal: Price crosses below Supertrend
• REV (Reversal): QQE indicates potential trend change
• Diamond Breakouts: Momentum shift confirmation
• T1/T2/T3: Take profit level hits
MULTI-TIMEFRAME ANALYSIS:
• Green (BULL): Higher timeframe supports uptrend
• Red (BEAR): Higher timeframe supports downtrend
• Use for trend alignment and confirmation
• Best results when multiple timeframes align
RISK MANAGEMENT:
• Enable Stop Loss for automatic SL calculation
• Activate TP levels based on trading style
• Adjust Risk-to-Reward ratio (1:1 to 1:10)
• Monitor hit detection circles for exits
═══════════════════════════════════════════════════════════════
TECHNICAL SPECIFICATIONS
═══════════════════════════════════════════════════════════════
CALCULATIONS:
• Supertrend: ATR-based with customizable multiplier
• QQE: Modified RSI with Wilders smoothing
• Keltner Channels: EMA basis with ATR bands
• Pivots: Standard left/right bar methodology
• Support/Resistance: Multi-level pivot analysis
PARAMETERS:
• Supertrend Sensitivity: 0.5 to 10.0 (default: 2.0)
• RSI Period: 5 to 50 (default: 14)
• QQE Multiplier: 1.0 to 10.0 (default: 4.238)
• Risk-to-Reward: 1 to 10 (default: 4)
TIMEFRAMES:
Compatible with all timeframes. MTF dashboard displays:
• 1 Minute (1M)
• 5 Minutes (5M)
• 15 Minutes (15M)
• 1 Hour (1H)
• 1 Day (1D)
• Current chart timeframe
═══════════════════════════════════════════════════════════════
CUSTOMIZATION OPTIONS
═══════════════════════════════════════════════════════════════
VISUAL:
• Professional color scheme (Cyan/Orange)
• Adjustable table position (9 positions)
• Table size options (tiny/small/normal/large)
• Transparent zone highlighting
• Clean, modern label design
TOGGLES:
• Enable/disable any feature independently
• Show/hide signals, reversals, breakouts
• Toggle S/R levels and zones
• Control trend cloud and bands
• Master trend line optional
ALERTS:
The indicator provides visual signals that can be used with
TradingView's alert system by setting alerts on the indicator.
═══════════════════════════════════════════════════════════════
BEST PRACTICES
═══════════════════════════════════════════════════════════════
✓ Combine signals for higher probability setups
✓ Use MTF dashboard for trend confirmation
✓ Respect S/R levels for entry/exit planning
✓ Monitor QQE reversals at key price levels
✓ Adjust sensitivity based on asset volatility
✓ Test on demo/paper trading first
✓ Use proper risk management always
═══════════════════════════════════════════════════════════════
IMPORTANT DISCLAIMER
═══════════════════════════════════════════════════════════════
This indicator is a technical analysis tool and does NOT:
• Guarantee profitable trades
• Provide financial advice
• Predict future price movements with certainty
• Replace proper risk management
• Substitute for personal due diligence
Past performance does not indicate future results. All trading
involves risk. Users should:
- Understand the indicator's logic
- Test thoroughly before live trading
- Use appropriate position sizing
- Never risk more than they can afford to lose
- Consult financial advisors if needed
═══════════════════════════════════════════════════════════════
CODING STANDARDS
═══════════════════════════════════════════════════════════════
This indicator follows PineCoders Coding Conventions:
✓ Proper variable naming (prefixes: i_, f_, c_)
✓ Clear function documentation
✓ Organized code structure
✓ Type declarations
✓ Efficient calculations
✓ No repainting (confirmed signals)
✓ Proper use of request.security
═══════════════════════════════════════════════════════════════
SUPPORT & UPDATES
═══════════════════════════════════════════════════════════════
Version: 1.0
Author: Zakaria Safri
License: MPL 2.0
Last Updated: 2024
For questions, feedback, or suggestions, please comment below.
═══════════════════════════════════════════════════════════════
#trading #signals #supertrend #multiTimeframe #QQE #reversals
#supportResistance #riskManagement #trendAnalysis #momentum

Choppiness Index | CipherDecodedThe Choppiness Index is a multi-timeframe regime indicator that measures whether price action is trending or consolidating.
This recreation was inspired by the Choppiness Index chart from Checkonchain, with full credit to their team for the idea.
🔹 How It Works
CI = 100 * log10( SUM(ATR(1), n) / (highest(high, n) – lowest(low, n)) ) / log10(n)
Where:
n – lookback length (e.g. 14 days / 10 weeks / 10 months)
ATR(1) – true-range of each bar
SUM(ATR(1), n) – total true-range over n bars
highest(high, n) and lowest(low, n) – price range over n bars
Low values → strong trend
High values → sideways consolidation
Below is a simplified function used in the script for computing CI on any timeframe:
f_ci(_n) =>
_tr = ta.tr(true)
_sum = math.sum(_tr, _n)
_hh = ta.highest(high, _n)
_ll = ta.lowest(low, _n)
_rng = _hh - _ll
_rng > 0 ? 100 * math.log10(_sum / _rng) / math.log10(_n) : na
Consolidation Threshold — 50.0
Trend Threshold — 38.2
When Weekly CI < Trend Threshold, a trending zone (yellow) appears.
When Weekly CI > Consolidation Threshold, a consolidation zone (purple) appears.
Users can toggle either background independently.
🔹 Example Background Logic
bgcolor(isTrend and Trend ? color.new(#f3e459, 50) : na, title = "Trending", force_overlay = true)
bgcolor(isConsol and Cons ? color.new(#974aa5, 50) : na, title = "Consolidation", force_overlay = true)
🔹 Usage Tips
Observe the Weekly CI for regime context.
Combine with price structure or trend filters for signal confirmation.
Low CI values (< 38) indicate strong trend activity — the market may soon consolidate to reset.
High CI values (> 60) reflect sideways or range-bound conditions — the market is recharging before a potential new trend.
🔹 Disclaimer
This indicator is provided for educational purposes.
No trading outcomes are guaranteed.
This tool does not guarantee market turns or performance; it should be used as part of a broader system.
Use responsibly and perform your own testing.
🔹 Credits
Concept origin — Checkonchain Choppiness Index

Asia Session 2h (8PM–10PM EST, Today Only)This indicator automatically highlights the first 2 hours of the Asia trading session (8:00 PM – 10:00 PM EST) with a transparent teal box. It updates daily and only displays the current day’s session for a clean chart appearance.
Features:
Marks the Asia session open range (8–10 PM EST).
Automatically adjusts each day.
Works on any timeframe.
No clutter — only shows today’s box.
Ideal for traders who want to track Tokyo/Asia session volatility or identify key breakout zones before the London open.
