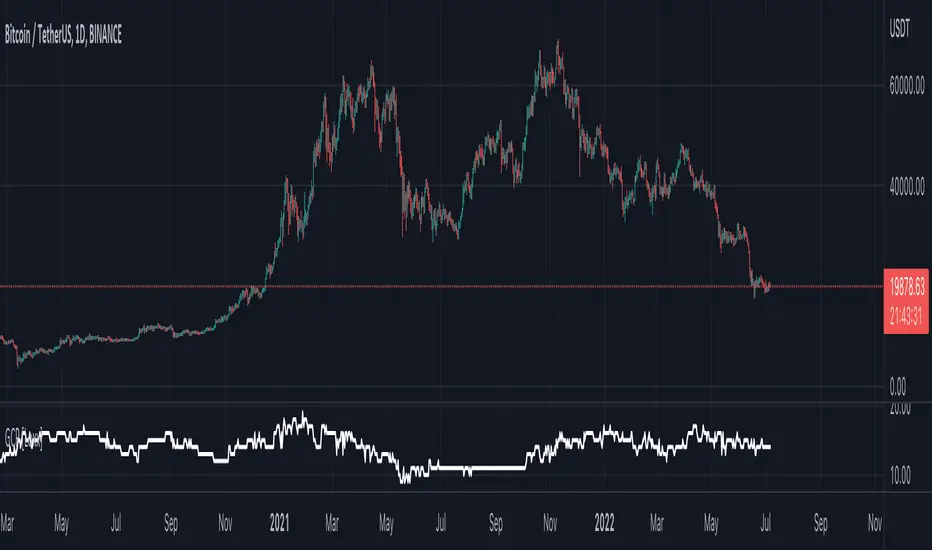
Goertzel Cycle Period [Loxx]Goertzel Cycle Period is an indicator that uses Goertzel algorithm to extract the cycle period of ticker's price input to then be injected into advanced, adaptive indicators and technical analysis algorithms.
The following information is extracted from: "MESA vs Goertzel-DFT, 2003 by Dennis Meyers"
Background
MESA which stands for Maximum Entropy Spectral Analysis is a widely used mathematical technique designed to find the frequencies present in data. MESA was developed by J.P Burg for his Ph.D dissertation at Stanford University in 1975. The use of the MESA technique for stocks has been written about in many articles and has been popularized as a trading technique by John Ehlers.
The Fourier Transform is a mathematical technique named after the famed French mathematician Jean Baptiste Joseph Fourier 1768-1830. In its digital form, namely the discrete-time Fourier Transform (DFT) series, is a widely used mathematical technique to find the frequencies of discrete time sampled data. The use of the DFT has been written about in many articles in this magazine (see references section).
Today, both MESA and DFT are widely used in science and engineering in digital signal processing. The application of MESA and Fourier mathematical techniques are prevalent in our everyday life from everything from television to cell phones to wireless internet to satellite communications.
MESA Advantages & Disadvantage
MESA is a mathematical technique that calculates the frequencies of a time series from the autoregressive coefficients of the time series. We have all heard of regression. The simplest regression is the straight line regression of price against time where price(t) = a+b*t and where a and b are calculated such that the square of the distance between price and the best fit straight line is minimized (also called least squares fitting). With autoregression we attempt to predict tomorrows price by a linear combination of M past prices.
One of the major advantages of MESA is that the frequency examined is not constrained to multiples of 1/N (1/N is equal to the DFT frequency spacing and N is equal to the number of sample points). For instance with the DFT and N data points we can only look a frequencies of 1/N, 2/N, Ö.., 0.5. With MESA we can examine any frequency band within that range and any frequency spacing between i/N and (i+1)/N . For example, if we had 100 bars of price data, we might be interested in looking for all cycles between 3 bars per cycle and 30 bars/ cycle only and with a frequency spacing of 0.5 bars/cycle. DFT would examine all bars per cycle of between 2 and 50 with a frequency spacing constrained to 1/100.
Another of the major advantages of MESA is that the dominant spectral (frequency) peaks of the price series, if they exist, can be identified with fewer samples than the DFT technique. For instance if we had a 10 bar price period and a high signal to noise ratio we could accurately identify this period with 40 data samples using the MESA technique. This same resolution might take 128 samples for the DFT. One major disadvantage of the MESA technique is that with low signal to noise ratios, that is below 6db (signal amplitude/noise amplitude < 2), the ability of MESA to find the dominant frequency peaks is severely diminished.(see Kay, Ref 10, p 437). With noisy price series this disadvantage can become a real problem. Another disadvantage of MESA is that when the dominant frequencies are found another procedure has to be used to get the amplitude and phases of these found frequencies. This two stage process can make MESA much slower than the DFT and FFT . The FFT stands for Fast Fourier Transform. The Fast Fourier Transform(FFT) is a computationally efficient algorithm which is a designed to rapidly evaluate the DFT. We will show in examples below the comparisons between the DFT & MESA using constructed signals with various noise levels.
DFT Advantages and Disadvantages.
The mathematical technique called the DFT takes a discrete time series(price) of N equally spaced samples and transforms or converts this time series through a mathematical operation into set of N complex numbers defined in what is called the frequency domain. Why would we what to do that? Well it turns out that we can do all kinds of neat analysis tricks in the frequency domain which are just to hard to do, computationally wise, with the original price series in the time domain. If we make the assumption that the price series we are examining is made up of signals of various frequencies plus noise, than in the frequency domain we can easily filter out the frequencies we have no interest in and minimize the noise in the data. We could then transform the resultant back into the time domain and produce a filtered price series that hopefully would be easier to trade. The advantages of the DFT and itís fast computation algorithm the FFT, are that it is extremely fast in calculating the frequencies of the input price series. In addition it can determine frequency peaks for very noisy price series even when the signal amplitude is less than the noise amplitude. One of the disadvantages of the FFT is that straight line, parabolic trends and edge effects in the price series can distort the frequency spectrum. In addition, end effects in the price series can distort the frequency spectrum. Another disadvantage of the FFT is that it needs a lot more data than MESA for spectral resolution. However this disadvantage has largely been nullified by the speed of today's computers.
Goertzel algorithm attempts to resolve these problems...
What is the Goertzel algorithm?
The Goertzel algorithm is a technique in digital signal processing (DSP) for efficient evaluation of the individual terms of the discrete Fourier transform (DFT). It is useful in certain practical applications, such as recognition of dual-tone multi-frequency signaling (DTMF) tones produced by the push buttons of the keypad of a traditional analog telephone. The algorithm was first described by Gerald Goertzel in 1958.
Like the DFT, the Goertzel algorithm analyses one selectable frequency component from a discrete signal. Unlike direct DFT calculations, the Goertzel algorithm applies a single real-valued coefficient at each iteration, using real-valued arithmetic for real-valued input sequences. For covering a full spectrum, the Goertzel algorithm has a higher order of complexity than fast Fourier transform (FFT) algorithms, but for computing a small number of selected frequency components, it is more numerically efficient. The simple structure of the Goertzel algorithm makes it well suited to small processors and embedded applications.
The main calculation in the Goertzel algorithm has the form of a digital filter, and for this reason the algorithm is often called a Goertzel filter
Where is Goertzel algorithm used?
This package contains the advanced mathematical technique called the Goertzel algorithm for discrete Fourier transforms. This mathematical technique is currently used in today's space-age satellite and communication applications and is applied here to stock and futures trading.
While the mathematical technique called the Goertzel algorithm is unknown to many, this algorithm is used everyday without even knowing it. When you press a cell phone button have you ever wondered how the telephone company knows what button tone you pushed? The answer is the Goertzel algorithm. This algorithm is built into tiny integrated circuits and immediately detects which of the 12 button tones(frequencies) you pushed.
Future Additions:
Bartels test for cycle significance, testing output cycles for utility
Hodrick Prescott Detrending, smoothing
Zero-Lag Regression Detrending, smoothing
High-pass or Double WMA filtering of source input price data
References:
1. Burg, J. P., ëMaximum Entropy Spectral Analysisî, Ph.D. dissertation, Stanford University, Stanford, CA. May 1975.
2. Kay, Steven M., ìModern Spectral Estimationî, Prentice Hall, 1988
3. Marple, Lawrence S. Jr., ìDigital Spectral Analysis With Applicationsî, Prentice Hall, 1987
4. Press, William H., et al, ìNumerical Receipts in C++: the Art of Scientific Computingî,
Cambridge Press, 2002.
5. Oppenheim, A, Schafer, R. and Buck, J., ìDiscrete Time Signal Processingî, Prentice Hall,
1996, pp663-634
6. Proakis, J. and Manolakis, D. ìDigital Signal Processing-Principles, Algorithms and
Applicationsî, Prentice Hall, 1996., pp480-481
7. Goertzel, G., ìAn Algorithm for he evaluation of finite trigonometric seriesî American Math
Month, Vol 65, 1958 pp34-35.
Cari skrip untuk "通达信+选股公式+换手率+0.5+源码"
Weight Gain 4000 - (Adjustable Volume Weighted MA) - [mutantdog]Short Version:
This is a fairly self-contained system based upon a moving average crossover with several unique features. The most significant of these is the adjustable volume weighting system, allowing for transformations between standard and weighted versions of each included MA. With this feature it is possible to apply partial weighting which can help to improve responsiveness without dramatically altering shape. Included types are SMA, EMA, WMA, RMA, hSMA, DEMA and TEMA. Potentially more will be added in future (check updates below).
In addition there are a selection of alternative 'weighted' inputs, a pair of Bollinger-style deviation bands, a separate price tracker and a bunch of alert presets.
This can be used out-of-the-box or tweaked in multiple ways for unusual results. Default settings are a basic 8/21 EMA cross with partial volume weighting. Dev bands apply to MA2 and are based upon the type and the volume weighting. For standard Bollinger bands use SMA with length 20 and try adding a small amount of volume weighting.
A more detailed breakdown of the functionality follows.
Long Version:
ADJUSTABLE VOLUME WEIGHTING
In principle any moving average should have a volume weighted analogue, the standard VWMA is just an SMA with volume weighting for example. Actually, we can consider the SMA to be a special case where volume is a constant 1 per bar (the value is somewhat arbitrary, the important part is that it's constant). Similar principles apply to the 'elastic' EVWMA which is the volume weighted analogue of an RMA. In any case though, where we have standard and weighted variants it is possible to transform one into the other by gradually increasing or decreasing the weighting, which forms the basis of this system. This is not just a simple multiplier however, that would not work due to the relative proportions being the same when set at any non zero value. In order to create a meaningful transformation we need to use an exponent instead, eg: volume^x , where x is a variable determined in this case by the 'volume' parameter. When x=1, the full volume weighting applies and when x=0, the volume will be reduced to a constant 1. Values in between will result in the respective partial weighting, for example 0.5 will give the square root of the volume.
The obvious question here though is why would you want to do this? To answer that really it is best to actually try it. The advantages that volume weighting can bring to a moving average can sometimes come at the cost of unwanted or erratic behaviour. While it can tend towards much closer price tracking which may be desirable, sometimes it needs moderating especially in markets with lower liquidity. Here the adjustability can be useful, in many cases i have found that adding a small amount of volume weighting to a chosen MA can help to improve its responsiveness without overpowering it. Another possible use case would be to have two instances of the same MA with the same length but different weightings, the extent to which these diverge from each other can be a useful indicator of trend strength. Other uses will become apparent with experimentation and can vary from one market to another.
THE INCLUDED MODES
At the time of publication, there are 7 included moving average types with plans to add more in future. For now here is a brief explainer of what's on offer (continuing to use x as shorthand for the volume parameter), starting with the two most common types.
SMA: As mentioned above this is essentially a standard VWMA, calculated here as sma(source*volume^x,length)/sma(volume^x,length). In this case when x=0 then volume=1 and it reduces to a standard SMA.
RMA: Again mentioned above, this is an EVWMA (where E stands for elastic) with constant weighting. Without going into detail, this method takes the 1/length factor of an RMA and replaces it with volume^x/sum(volume^x,length). In this case again we can see that when x=0 then volume=1 and the original 1/length factor is restored.
EMA: This follows the same principle as the RMA where the standard 2/(length+1) factor is replaced with (2*volume^x)/(sum(volume^x,length)+volume^x). As with an RMA, when x=0 then volume=1 and this reduces back to the standard 2/(length+1).
DEMA: Just a standard Double EMA using the above.
TEMA: Likewise, a standard Triple EMA using the above.
hSMA: This is the same as the SMA except it uses harmonic mean calculations instead of arithmetic. In most cases the differences are negligible however they can become more pronounced when volume weighting is introduced. Furthermore, an argument can be made that harmonic mean calculations are better suited to downtrends or bear markets, in principle at least.
WMA: Probably the most contentious one included. Follows the same basic calculations as for the SMA except uses a WMA instead. Honestly, it makes little sense to combine both linear and volume weighting in this manner, included only for completeness and because it can easily be done. It may be the case that a superior composite could be created with some more complex calculations, in which case i may add that later. For now though this will do.
An additional 'volume filter' option is included, which applies a basic filter to the volume prior to calculation. For types based around the SMA/VWMA system, the volume filter is a WMA-4, for types based around the RMA/EVWMA system the filter is a RMA-2.
As and when i add more they will be listed in the updates at the bottom.
WEIGHTED INPUTS
The ohlc method of source calculations is really a leftover from a time when data was far more limited. Nevertheless it is still the method used in charting and for the most part is sufficient. Often the only important value is 'close' although sometimes 'high' and 'low' can be relevant also. Since we are volume weighting however, it can be useful to incorporate as much information as possible. To that end either 'hlc3' or 'hlcc4' tend to be the best of the defaults (in the case of 24/7 charting like crypto or intraday trading, 'ohlc4' should be avoided as it is effectively the same as a lagging version of 'hlcc4'). There are many other (infinitely many, in fact) possible combinations that can be created, i have included a few here.
The premise is fairly straightforward, by subtracting one value from another, the remaining difference can act as a kind of weight. In a simple case consider 'hl2' as simply the midrange ((high+low)/2), instead of this using 'high+low-open' would give more weight to the value furthest from the open, providing a good estimate of the median. An even better estimate can be achieved by combining that with 'high+low-close' to give the included result 'hl-oc2'. Similarly, 'hlc3' can be considered the basic mean of the three significant values, an included weighted version 'hlc2-o2' combines a sum with subtraction of open to give an estimated mean that may be more accurate. Finally we can apply a similar principle to the close, by subtracting the other values, this one potentially gets more complex so the included 'cc-ohlc4' is really the simplest. The result here is an overbias of the close in relation to the open and the midrange, while in most cases not as useful it can provide an estimate for the next bar assuming that the trend continues.
Of the three i've included, hlc2-o2 is in my opinion the most useful especially in this context, although it is perhaps best considered to be experimental in nature. For that reason, i've kept 'hlcc4' as the default for both MAs.
Additionally included is an 'aux input' which is the standard TV source menu and, where possible, can be set as outputs of other indicators.
THE SYSTEM
This one is fairly obvious and straightforward. It's just a moving average crossover with additional deviation (bollinger) bands. Not a lot to explain here as it should be apparent how it works.
Of the two, MA1 is considered to be the fast and MA2 is considered to be the slow. Both can be set with independent inputs, types and weighting. When MA1 is above, the colour of both is green and when it's below the colour of both is red. An additional gradient based fill is there and can be adjusted along with everything else in the visuals section at the bottom. Default alerts are available for crossover/crossunder conditions along with optional marker plots.
MA2 has the option for deviation bands, these are calculated based upon the MA type used and volume weighted according to the main parameter. In the case of a unweighted SMA being used they will be standard Bollinger bands.
An additional 'source direct' price tracker is included which can be used as the basis for an alert system for price crossings of bands or MAs, while taking advantage of the available weighted inputs. This is displayed as a stepped line on the chart so is also a good way to visualise the differences between input types.
That just about covers it then. The likelihood is that you've used some sort of moving average cross system before and are probably still using one or more. If so, then perhaps the additional functionality here will be of benefit.
Thanks for looking, I welcome any feedack

ALMA stdev band with fibsArnaud Legoux Moving Average with standard deviation band and standard deviation Fibonacci levels.
Standard deviation band is alma + stdev and alma - stdev.
Fibonacci levels are alma + stdev * fib ratio and alma - stdev * fib ratio (0.382 / 0.5 / 0.618 / 1.618 / 2.618).
Used like a moving average, but also shows probable price range based on past volatility, and helps to recognize support/resistance levels, trends and trend momentum based on the Fibonacci levels.

Adaptive, One More Moving Average (OMA) [Loxx]Adaptive, One More Moving Average (OMA) is an adaptive moving average created by Mladen Rakic that changes shape with volatility and momentum
What is the One More Moving Average (OMA)?
The usual story goes something like this : which is the best moving average? Everyone that ever started to do any kind of technical analysis was pulled into this "game". Comparing, testing, looking for new ones, testing ...
The idea of this one is simple: it should not be itself, but it should be a kind of a chameleon - it should "imitate" as much other moving averages as it can. So the need for zillion different moving averages would diminish. And it should have some extra, of course:
The extras:
it has to be smooth
it has to be able to "change speed" without length change
it has to be able to adapt or not (since it has to "imitate" the non-adaptive as well as the adaptive ones)
The steps:
Smoothing - compared are the simple moving average (that is the basis and the first step of this indicator - a smoothed simple moving average with as little lag added as it is possible and as close to the original as it is possible) Speed 1 and non-adaptive are the reference for this basic setup.
Speed changing - same chart only added one more average with "speeds" 2 and 3 (for comparison purposes only here)
Finally - adapting : same chart with SMA compared to one more average with speed 1 but adaptive (so this parameters would make it a "smoothed adaptive simple average") Adapting part is a modified Kaufman adapting way and this part (the adapting part) may be a subject for changes in the future (it is giving satisfactory results, but if or when I find a better way, it will be implemented here)
Some comparisons for different speed settings (all the comparisons are without adaptive turned on, and are approximate. Approximation comes from a fact that it is impossible to get exactly the same values from only one way of calculation, and frankly, I even did not try to get those same values).
speed 0.5 - T3 (0.618 Tilson)
speed 2.5 - T3 (0.618 Fulks/Matulich)
speed 1 - SMA, harmonic mean
speed 2 - LWMA
speed 7 - very similar to Hull and TEMA
speed 8 - very similar to LSMA and Linear regression value
Parameters:
Length - length (period) for averaging
Source - price to use for averaging
Speed - desired speed (i limited to -1.5 on the lower side but it even does not need that limit - some interesting results with speeds that are less than 0 can be achieved)
Adaptive - does it adapt or not

Traling.SL.TargetTrailing SL and Target
I have seen few requests in PineScripters telegram group asking questions about implementation of trailing stop-loss (SL) and targets. This script is one of the way to implement the same.
This script is developed based on dark color theme and is best viewed using dark color theme.
How and where can this script be used:
The script is built to demonstrate how one can implement the trailing SL and target, so by referring the script one can mimic the approach and add trailing SL and target implementation in their own strategy.
How it works:
To demonstrate the SL and target implementation, i have considered simple EMA crossover strategy.
Key Input Parameters
Method to use for SL/Target trailing:
1. % Based Target and SL - Used to calculate trailing based on parameters defined under group '% Based Target SL'
2. Fixed point Based Target and SL - Used to calculate trailing based on parameters defined under group 'Fixed point Based Target and SL'
% Based Target and SL:
Initial profit % - This is used to calculate target when trade is initiated
Initial SL % - This is used to calculate SL when trade is initiated
Initiate trailing % - This parameter determines, when to start trailing SL and target.
Trail profit by % - Target would be trailed by % specified as this parameter
Trail SL by % - SL would be trailed by % specified as this parameter
e.g.
Trade type: - Long
Trade price: 10000
initial profit %: 1
Initial SL %: 1
Initiate trailing %: 0.5
Trail profit by %: 0.3
Trail SL by %: 0.4
Calculations based on above:
initial profit %: 10100 (trade price + 1%)
Initial SL %: 9900 (trade price - 1%)
Initiate trailing %: 10049.5 (initial profit - 0.5%)
Trail profit by %: 10130 (initial profit + 0.3%)
Trail SL by %: 9939.6 (initial SL + 0.4%)
For next iteration of Trailing SL and target above calculated values will be taken as a base and next set of values will be calculated. these calculations will continue till the trade is exited either on price reaching profit or SL point.
Fixed point Based Target and SL:
Initial profit target points - To derive initial target, parameter value is added to trade price in case of long trade.
Initial SL points - To derive SL point, parameter value is subtracted from trade price
Initiate trailing points - To derive start of trailing logic, parameter value is subtracted from initial profit point.
Trail profit by points - In case of long trade, parameter value is added to the profit target to derive new trailed profit target.
Trail SL by % - In case of long trade, parameter value is added to the SL initial point to derive new trailed SL.
Calculation of Trailing SL and target will continue till the trade is exited either on price reaching profit or SL point.
Plots displayed on the chart:
Apart from default trade markings i have added 3 shapes on the chart to describe working of Trailing SL and targets.
Diamond shape marks - These are added on the chart when trade is initiated. These shapes gives additional trade information by way of 'tooltip'. This information can be viewed by placing mouse pointer on the shape.
Circle shape marks - These are added on the chart whenever Trailing SL and targets are calculated. These shapes gives additional trade information by way of 'tooltip'. This information can be viewed by placing mouse pointer on the shape. You will also notice a number displayed just above or below circle denoting Trailing iteration.
Labels up and label down shapes - These are dynamically placed on the chart whenever trade is in progress. These labels will display ongoing trades, Target and SL points.

Multiple MAs + No Trend Zone + ATR WidgetThis is my first Pine Script attempt. Nothing special, just an "all in one" for the most common things I use, and what I have found to be the most common in a lot of strategies.
Great for free and limited accounts as it combines 7 total indicators into one.
-- First 5 indicators are Independant Moving Averages:
-Each one can be set for length, as well as source and type (SMA, EMA, SMMA, WMA, VWMA) individually
-- Second type (6th) of indicator is one I find extremly useful for staying OUT of consolidation trading. It's called a "No Trend Zone" indicator I swipped from the Hoffman Startegy. Basically, its set for a small deviation (0.5) of a 35 EMA, which creates a "Band" around the 35 line. When you have this "Band" flat or with no discernable incline/decline, with price action OR some or multiple moving averages inside this banded zone, it typically indicates a zone of consolidation. This will help you identify when you may be in one of those zones, that way you don't get trapped "waiting for paint to dry" before the market starts to move again with your position, and keep you from entering should you be considering the market at that time.
The last indicator is my favorite, and one I will refine a little deeper soon.
-- The ATR widget finishes us out. This widget can be customized for colors, turned on or off, and automatically rounds the ATR (ATR period based on the chart timeframe) to a nice readable number for what you're trading. It has settings to show or not, the length, what rounding style to use (forex pip 0.0001, forex/stock/etf/indicies 0.01) where to show it on the pane, a Multiplier Factor (for stop loss calculations automatically) and the colors.
***NOTE ABOUT ATR WIDGET:
I am primarily a forex trader, so the defaults are for Forex 0.0001. If you see some odd numbers (like 55798 on a current chart), check the inputs tab on the settings, and change the "ATR Style" from "Forex 0.0001" to "Forex/Stock/ETF/Indicies 0.01", and you should arrive with the correct number.

MTF previous high and low quarter levelsDescription
An experimental script that prints quarter levels of the previous timeframe's high and low to the current timeframe. The idea is quite simple and is basically the Fibonacci pivoted on the previous high and low with quarter level settings (0,0.25,0.5,0.75,1 etc). The default setting is the previous daily high and low but can be customized on user discretion.
New quarter levels are printed after the close of the previous timeframe and open of the new timeframe (user's timeframe setting)
How To Use
Levels should not be used blindly. Levels can be used as confluence when aligned with high probability supply and demand zones, support, resistance, order blocks, and so on.
Credit to @HeWhoMustNotBeNamed for the Previous High/Low MTF indicator code and @mrbirman for the idea to put this together.

MTF Pivots Zones [tanayroy]Dear Fellow Traders,
I only publish scripts that I use and found good for my trading. Pivots are my favorite indicator. I use daily, weekly, monthly, quarterly, and yearly pivots levels. multiple pivot zones are very strong levels and I like to watch these levels for possible price action.
But when I include all pivots levels at a time, my charts get too clumsy. To see price action properly, you need a clean chart. And when we trade we want to see only important levels within the price horizon.
To resolve this, I created this script, which shows important levels within my display option. I control the display option with 14 periods ATR and a multiplier to adjust the display levels.
The following chart displays levels within 14 ATR * 0.5 multipliers. As the price progress, it will automatically add levels and delete levels that do not come within this option.
What levels are included?
I have used traditional pivot calculation and included Daily, Weekly, Monthly, Quarterly, and Yearly pivots with high and low.
What options are available?
You can replace the yearly timeframe with your desired time frame and can adjust the ATR multiplier to increase or decrease display levels.
Use this in 5m, 15m, or 1H chart or any timeframe below Daily.
Please like, share, and comment.

KINSKI Multi Trend OscillatorThe Multi Trend Oscillator is a tool that combines the ratings of several indicators to facilitate the search for profitable trades. I was inspired by the excellent indicator "Technical Ratings" from Team TradingView to create an alternative with a technically new approach. Therefore, it is not a modified copy of the original, but newly conceived and implemented.
The recommendations of the indicator are based on the calculated ratings from the different indicators included in it. The special thing here is that all settings for the individual indicators can be changed according to your own needs and displayed as a histogram and MA line. This provides an excellent visual control of your own settings. Alarms are also triggered.
Criteria for determining the rating
Relative Strength Index (RSI)
Buy - Crossover oversold level and indicator < oversold level and rising
Sell - Crossunder oversold level and indicator >= oversold level and falling
Neutral - neither Buy nor Sell
Relative Strength Index (RSI) Laguerre
Buy - Crossover Oversold Level and Indicator < Oversold Level and rising
Sell - Crossunder oversold level and indicator >= oversold level and falling
Neutral - neither Buy nor Sell
Noise free Relative Strength Index (RSX)
Buy - Crossover Oversold Level and Indicator < Oversold Level and rising
Sell - Crossunder oversold level and indicator >= oversold level and falling
Neutral - neither Buy nor Sell
Money Flow Index (MFI)
Buy - Crossover Oversold Level and Indicator < Oversold Level and rising
Sell - Crossunder oversold level and indicator >= oversold level and falling
Neutral - neither Buy nor Sell
Commodity Channel Index (CCI)
Buy - Crossover Oversold Level and Indicator < Oversold Level and rising
Sell - Crossunder oversold level and indicator >= oversold level and falling
Neutral - neither Buy nor Sell
Moving Average Convergence/Divergence (MACD)
Buy - values of the main line > values of the signal line and rising
Sell - values of the main line < values of the signal line and falling
Neutral - neither Buy nor Sell
Klinger
Buy - indicator >= 0 and rising
Sell - indicator < 0 and falling
Neutral - neither Buy nor Sell
Average Directional Index (ADX)
Buy - indicator > 20 and +DI line crosses over the -DI line and rising
Sell - indicator > 20 and +DI line crosses below the -DI line and falling
Neutral - neither Buy nor Sell
Awesome Oscillator
Buy - Crossover 0 and values are greater than 0, or exceed the zero line
Sell - Crossunder 0 and values are lower than 0, or fall below the zero line
Neutral - neither Buy nor Sell
Ultimate Oscillator
Buy - Crossover oversold level and indicator < oversold level and rising
Sell - Crossunder oversold level and indicator >= oversold level and falling
Neutral - neither Buy nor Sell
Williams Percent Range
Buy - Crossover Oversold Level and Indicator < Oversold Level and rising
Sell - Crossunder Oversold Level and Indicator >= Oversold Level and falling
Neutral - neither Buy nor Sell
Momentum
Buy - Crossover 0 and indicator levels rising
Sell - Crossunder 0 and indicator values falling
Neutral - neither Buy nor Sell
Total Ratings
The numerical value of the rating "Sell" is 0, "Neutral" is 0 and "Buy" is 1. The total rating is calculated as the average of the ratings of the individual indicators and are determined according to the following criteria:
MaxCount = 12 (depending on whether other oscillators are added).
CompareSellStrong = MaxCount * 0.3
CompareMid = MaxCount * 0.5
CompareBuyStrong = MaxCount * 0.7
value <= CompareSellStrong - Strong Sell
value < CompareMid and value > CompareSellStrong - Sell
value == 6 - Neutral
value > CompareMid and value < CompareBuyStrong - Buy
value >= CompareBuyStrong - Strong Buy
Understanding the results
The Multi Trend Oscillator is designed so that its values fluctuate between 0 and currently 12 (maximum number of integrated indicators). Its values are displayed as a histogram with green, red and gray bars. The bars are gray when the value of the indicator is at half of the number of indicators used, currently 12. Increasingly saturated green bars indicate increasing values above 6, and increasingly saturated red bars indicate increasingly decreasing values below 6.
The table at the end of the histogram shows details (can be activated in the settings) about the overall rating and the individual indicators. Its color is determined by the rating value: gray for neutral, green for buy or strong buy, red for sell or strong sell.
The following alarms are triggered:
Multi Trend Oscillator: Sell
Multi Trend Oscillator: Strong Sell
Multi Trend Oscillator: Buy
Multi Trend Oscillator: Strong Buy

LengthAdaptationCollection of dynamic length adaptation algorithms. Mostly from various Adaptive Moving Averages (they are usually just EMA otherwise). Now you can combine Adaptations with any other Moving Averages or Oscillators (see my other libraries), to get something like Deviation Scaled RSI or Fractal Adaptive VWMA. This collection is not encyclopaedic. Suggestions are welcome.
chande(src, len, sdlen, smooth, power) Chande's Dynamic Length
Parameters:
src : Series to use
len : Reference lookback length
sdlen : Lookback length of Standard deviation
smooth : Smoothing length of Standard deviation
power : Exponent of the length adaptation (lower is smaller variation)
Returns: Calculated period
Taken from Chande's Dynamic Momentum Index (CDMI or DYMOI), which is dynamic RSI with this length
Original default power value is 1, but I use 0.5
A variant of this algorithm is also included, where volume is used instead of price
vidya(src, len, dynLow) Variable Index Dynamic Average Indicator (VIDYA)
Parameters:
src : Series to use
len : Reference lookback length
dynLow : Lower bound for the dynamic length
Returns: Calculated period
Standard VIDYA algorithm. The period oscillates from the Lower Bound up (slow)
I took the adaptation part, as it is just an EMA otherwise
vidyaRS(src, len, dynHigh) Relative Strength Dynamic Length - VIDYA RS
Parameters:
src : Series to use
len : Reference lookback length
dynHigh : Upper bound for the dynamic length
Returns: Calculated period
Based on Vitali Apirine's modification (Stocks and Commodities, January 2022) of VIDYA algorithm. The period oscillates from the Upper Bound down (fast)
I took the adaptation part, as it is just an EMA otherwise
kaufman(src, len, dynLow, dynHigh) Kaufman Efficiency Scaling
Parameters:
src : Series to use
len : Reference lookback length
dynLow : Lower bound for the dynamic length
dynHigh : Upper bound for the dynamic length
Returns: Calculated period
Based on Efficiency Ratio calculation orifinally used in Kaufman Adaptive Moving Average developed by Perry J. Kaufman
I took the adaptation part, as it is just an EMA otherwise
ds(src, len) Deviation Scaling
Parameters:
src : Series to use
len : Reference lookback length
Returns: Calculated period
Based on Derivation Scaled Super Smoother (DSSS) by John F. Ehlers
Originally used with Super Smoother
RMS originally has 50 bar lookback. Changed to 4x length for better flexibility. Could be wrong.
maa(src, len, threshold) Median Average Adaptation
Parameters:
src : Series to use
len : Reference lookback length
threshold : Adjustment threshold (lower is smaller length, default: 0.002, min: 0.0001)
Returns: Calculated period
Based on Median Average Adaptive Filter by John F. Ehlers
Discovered and implemented by @cheatcountry:
I took the adaptation part, as it is just an EMA otherwise
fra(len, fc, sc) Fractal Adaptation
Parameters:
len : Reference lookback length
fc : Fast constant (default: 1)
sc : Slow constant (default: 200)
Returns: Calculated period
Based on FRAMA by John F. Ehlers
Modified to allow lower and upper bounds by an unknown author
I took the adaptation part, as it is just an EMA otherwise
mama(src, dynLow, dynHigh) MESA Adaptation - MAMA Alpha
Parameters:
src : Series to use
dynLow : Lower bound for the dynamic length
dynHigh : Upper bound for the dynamic length
Returns: Calculated period
Based on MESA Adaptive Moving Average by John F. Ehlers
Introduced in the September 2001 issue of Stocks and Commodities
Inspired by the @everget implementation:
I took the adaptation part, as it is just an EMA otherwise
doAdapt(type, src, len, dynLow, dynHigh, chandeSDLen, chandeSmooth, chandePower) Execute a particular Length Adaptation from the list
Parameters:
type : Length Adaptation type to use
src : Series to use
len : Reference lookback length
dynLow : Lower bound for the dynamic length
dynHigh : Upper bound for the dynamic length
chandeSDLen : Lookback length of Standard deviation for Chande's Dynamic Length
chandeSmooth : Smoothing length of Standard deviation for Chande's Dynamic Length
chandePower : Exponent of the length adaptation for Chande's Dynamic Length (lower is smaller variation)
Returns: Calculated period (float, not limited)
doMA(type, src, len) MA wrapper on wrapper: if DSSS is selected, calculate it here
Parameters:
type : MA type to use
src : Series to use
len : Filtering length
Returns: Filtered series
Demonstration of a combined indicator: Deviation Scaled Super Smoother

Trend Follower Strategy v2 [divonn1994]The Trend Follower Strategy that I made classifies red and green candles into tiny, small, and big sizes and will send buy or sell signals depending on if the candle is classified as "big" so you get into and out of a position when there is a big candle. Out during a big green candle to take profit. Out during a big red candle in case the market is turning down. It also won't enter a position unless there is positive EMA momentum.
For the chart there is a Buy and a Sell signal. Buy = 1, Sell = 0, and when the value crosses above or below 0.5 it will trigger a long position or close the long position. The graph isn't necessary to the strategy, but can help with visualizing the trade patterns in the past if you like.
This strategy works best so far with these coins at time of posting (March 4th, 2022):
KCSUSDT (621x profit), HTUSDT (45x profit), LUNAUSDT (45x profit), BNBBTC (1553x profit), ETHBTC (219x profit), KCSBTC (1222x profit), LUNABTC (83x profit), FTMBTC (52x profit).
It can work with other pairings, but I personally like these pairings best. I didn't test it with coins outside of the top 100 coins by market cap. Use it however you want.
Works best on 1 Day charts.
The strategy would rather be in the market than out. It gets out when it see's a red flag, but can immediately go back in in the next bar if the red flags are all gone. So it makes a lot of trades.
------------------------------------------------------------------------------------------------------------------------------------------------------------------------------------------------------------------------
Update: This is the same strategy I uploaded before but I made the code Open for anyone to check it out and so it has a similar description as the previous version. Let me know what you think. I'd remove the old version if I could, but I guess it's site policy to not be able to remove scripts that have been uploaded.

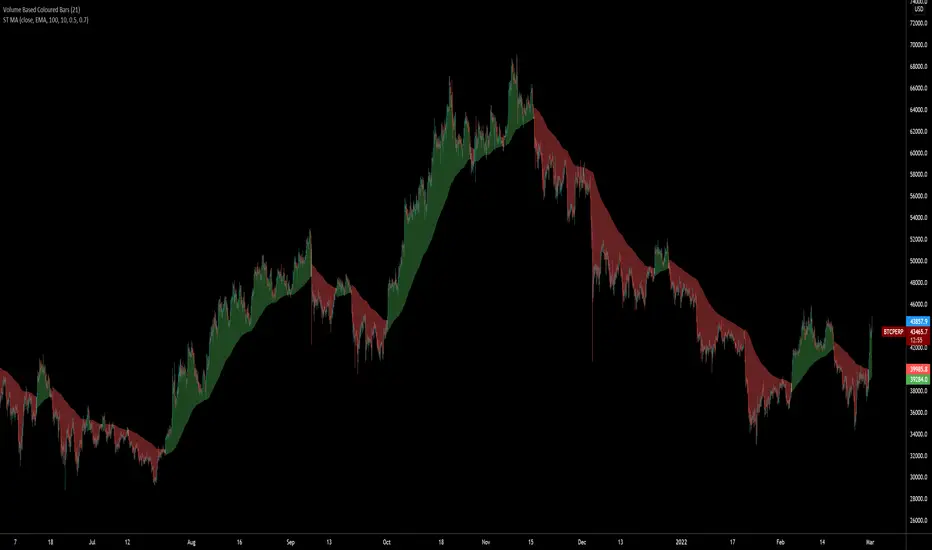
SuperTrended Moving AveragesA different approach to SuperTrend:
adding 100 periods Exponential Moving Average in calculation of SuperTrend and also 0.5 ATR Multiplier to have a clear view of the ongoing trend and also provides significant Supports and Resistances.
Default Moving Average type set as EMA (Exponential Moving Average) but users can choose from 11 different Moving Average types as:
SMA : Simple Moving Average
EMA : Exponential Moving Average
WMA : Weighted Moving Average
DEMA : Double Exponential Moving Average
TMA : Triangular Moving Average
VAR : Variable Index Dynamic Moving Average a.k.a. VIDYA
WWMA : Welles Wilder's Moving Average
ZLEMA : Zero Lag Exponential Moving Average
TSF : True Strength Force
HULL : Hull Moving Average
TILL : Tillson T3 Moving Average
Credits going to @CryptoErge for sharing his development to public.
Trending Bar SRTrending Bar SR is a simple script define a Bar called "Trending Bar".
Depend on direction of Trending Bar, if Trending Bar is UpTrend then this indicator plot Bar's Low Price as Support and if Trending Bar is DownTrend then it plot Bar's High Price as Resistance.
Beside, this indicaor also plot 4 levels retracement of Trending Bar for trading.
1. Define Trending Bar
1.1 Uptrend Bar
+ Close Price higher than previous High Price
+ Body greater than sum of shadows (up and down)
+ Color: A green dot is plotted at bottom chart.
1.2 Downtrend Bar
+ Close Price lower than previous Low Price
+ Body greater than sum of shadows (up and down)
+ Color: A red dot is plotted at bottom chart.
2. Retracement Level
+ Trending Bar Retracement 0.5 is called Equerium.
+ Trending Bar Retracement 0.618 is called Perfect Entry.
+ Trending Bar Retracement 0.705 is called Optimal Entry.
+ Trending Bar Retracement 0.79 is called Max Entry.
3. Trading
+ When Price crossed Equerium, consider open position at Perfect Entry, Optimal Entry with stoploss place at Max Entry.
+ If place order at Max Entry, stoploss can place at Support or Resistance.

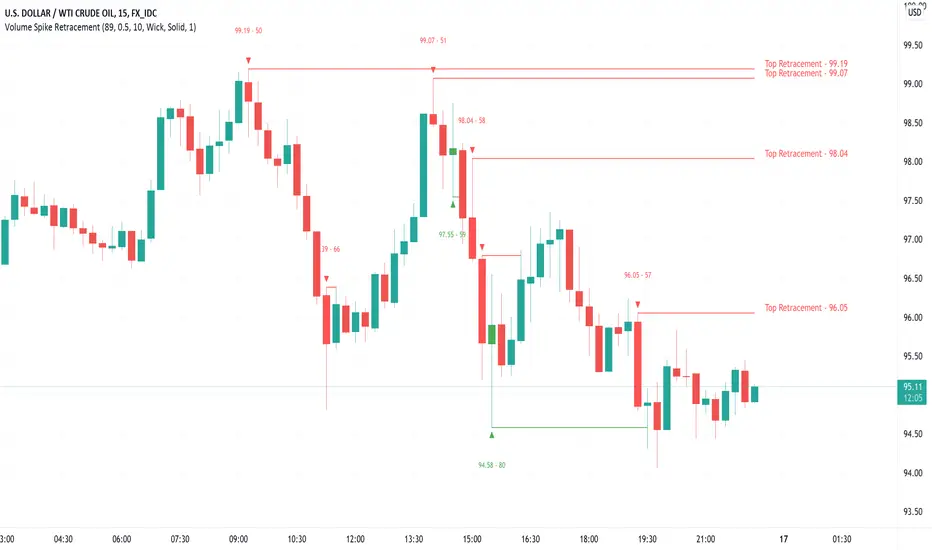
Volume Spike Retracement█ OVERVIEW
-Following many people's request to add "Volume" mode again in my "Institutional OrderBlock Pressure" script. I decided to release an improved
and full-fledged script. This will be the last OB/Retracement script I will release as we have explored every possible way to find them.
█ HOW TO INTERPRET?
-The script uses the the 0.5 Pivot and the maximum value set for Volume Length to find 'Peak Volume'. Once these conditions are met,
the script starts creating a Retracement Line.
-By default, the Volume Length value is set to 89, which works well with most Timeframes following the OrderBlocks/Retracements
logic used in my scripts.
-You have the option to set Alerts when the "Volume Spike Limit" is reached or when a Price Crossing with a Line occurs.
█ NOTES
- Yes Alerts appear instantly. Moreover, they are not 'confirmed', you must ALWAYS wait for confirmation before making a choice.
Good Trade everyone and remember, risk management remains the most important!
Session Levels - Ultimate Range IndicatorSession Levels - Ultimate Range Indicator
Primarily developed for trading the E-MINI Futures Markets like NQ or ES from the CME Group,
but also more than suitable for Crypto or other instruments.
This indicator highlights the chosen session, which can be Globex, Asian, London and New York.
It plots the important levels and also renders the Opening Range as it forms (a.k.a. Initial Balance).
After the 1st hour Opening Range is finished, it can plot the Standard Deviations / Projections.
See below for a complete feature list.
All Opening Ranges on chart and for the New York session the Range Projections are turned on:
s3.tradingview.com
How to use (example):
If you are trading the Nasdaq Futures (NQ!)
Enable the Globex Overnight session. Basically in the Futures Market, the Globex session is everything outside of US trading hours of Stocks. This draws the important overnight levels, like the Low, 25%, 50%, 75% and the High.
Enable the New York Session with Levels and Opening Range. Generally, 70% of the time the 1st hour will put a Low or High of the day.
If the price is trading above the Globex Low, most likely the Low of the Day is formed and the price target for the day will be 1.5x Standard Deviation and 2x Standard Deviation.
[*} Deviation of the Initial Balance depends on the volume ad overall market structure.
** This is not financial advice or any guarantee **
Features:
Show each Session Highlighted on Intraday chart in it's own color (each session can be turned off and has customizable times and color)
Show Line Levels of each session: Low, 25%, 50%, 75% and the High (customizable color)
Show the Opening Range (Initial Balance) of the Asian, London and New York session. Note: NY has more options.
Opening Range is displayed as a box with level lines (customizable color)
Levels are drawn to the end of the NY Cash session (customizable time)
Show IB Standard Deviations 0.5 - 3.0. Calculated from the Opening Range (Initial Balance)
Option to display Higher Timeframe levels: Previous Day Open/Close and Previous Week Open/Close
All level lines and OR boxes size dynamically as the session progresses
Built in Alerts for when price hits key levels. e.g. Alert when price crosses the NY Opening Range High. Or an Alert when the first STDEV is hit.
Option to toggle display of drawings for Today's trading session only, or Show all recent session levels. This keeps the chart clean or not.
Extras:
The NY Opening Range also has a 50% level line
The NY Opening Bar can be highlighted separately
The Level Lines can have small labels turned on/off. Values are only shown on mouse over to keep a clean chart
Keep in mind:
1) This indicator works on all instruments, but on instruments with limited market hours, your chart setting
has to be set to "Extended Hours" otherwise. For example TSLA on NASDAQ.
2) The Exchange Time Zone for the CME Group is Chicago UTC-6. So the session times you configure in the settings menu are based on that timezone too.
3) Globex opens at 5pm CST and closes when the US session starts 8:30CST.
4) When enabling the Alerts in the Indicator settings, be sure to also create an alarm for this indicator using the Alarm function of Tradingview.

Simple/Compounded Returns & Drawdowns TableVery excited to bring this script to the public. This is a very useful table that displays the performance of any strategy you give it in a more detailed view. It runs on all timeframes and at any position on the chart with the replay function. It also updates on tick changes. The table consists of three modes: Simple Equity, Compound Equity and Drawdown.
Simple Equity – shows the change in equity for every month and year. It is calculated by finding the difference in initial equity at the beginning of the month/year and the end of the month/year. The table will thus display strategy performance in blocks of time that are not correlated. It is an excellent way to see individual month/year performance from start to finish but it may not represent true change in equity over time. For example, let's assume that 100% of equity is used on every trade for simplicity. If a loss of 50% is made in the first month and a profit of 100% is made in the next month, the strategy will show 50% profit for the year. This aggregate value might be helpful to know for testing purposes, but in reality, the account is actually at break-even for the year (Initial Equity * 0.5 * 2 = Initial Equity).
Compound Equity – shows compounded change in equity for every month and year. It is calculated by finding the difference in starting equity when the strategy is run and equity at the end of the month/year. The table will thus display the true strategy performance – compounded equity at the end of each month/year.
Drawdown – shows max drawdown for every month and year. It is calculated by finding the difference between the highest equity achieved for the month/year and the trough in equity for the same month/year. Notice: strategy tester might have a max drawdown value higher than any of the drawdown values in the table. This is because the strategy tester calculates the difference between the highest and lowest equity for the entire strategy, whereas the table displays drawdowns for months and years only. Sometimes, the max drawdown for the year will also be the max drawdown for the entire strategy; hence the two values will be the same.
To use this table with your own strategy, simply find " PLACE YOUR STRATEGY CODE HERE " at the bottom of the script and place your strategy code there. Special thanks to QuantNomad for the inspiration. As always, please let me know if there are any bugs or if you need some help. Leave a like if you wish!

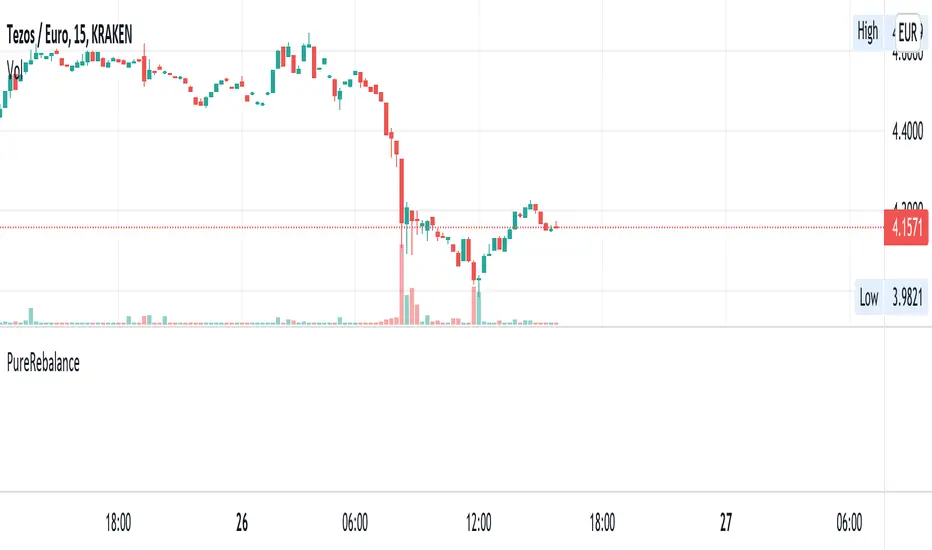
PureRebalanceLibrary "PureRebalance"
A rebalance function that is pure.
Depends only on its arguments to perform the necessary calculations.
rebalance(token_price, portfolio_token_amount, portfolio_fiat_amount, rebalance_ratio) Rebalances a portfolio made of tokens and fiat to a given ratio of tokens per fiat
Parameters:
token_price : The value of a single unit (1) token
portfolio_token_amount : The number of tokens in the portfolio
portfolio_fiat_amount : Fiat available in the portfolio
rebalance_ratio : The ratio of token value / fiat that the portfolio should have after the rebalance (0.5 is used if no argument is supplied).
Returns: The number of tokens to buy or sell in order to achieve the desired portfolio ratio passed as argument (a positive value is returned if the tokens are to be bought, and negative value if the tokens are to be sold).
ADX Screener// Identify potential trend reversals using ADX on up to 40 crypto assets.
// ADX shows the strength of a trend, not the direction.
// By monitoring the difference of ADX values between candles, you can potentially identify reversals before they happen.
// A strong trend has a 14 period ADX slope increasing .5 or more from the prior candle.
// At a minimum, a weak trend has a 14 period ADX slope of +.25 or less, and strictly it would be decreasing.
// This indicator prints one row for each asset with three columns for ADX differences one candle back each.
// The asset name is colored green or red dependent on whether +DI > -DI or not.
The market was in a down trend (-DI > +DI).
A bullish wave moved price up to EMA 8 resistance with strong ADX momentum (ADX diff of prior candle >= 0.5).
A Spinning Top showed that the trend was losing momentum (ADX diff lower than previous candle, showed the bullish wave losing momentum).
A Morning Star bearish reversal pattern draws resistance at the high of the pattern. (ADX Bullish momentum exhausted).
Symbol: -DI > +DI
2: Strong momentum
1: Losing momentum (spinning top)
0: Trend reversal (bearish engulfing pattern)

SuperTrend With EMA100First of all, SuperTrend Indicator is an indicator developed by KivancOzbilgic and I would like to thank him for sharing this indicator with open source code.
In this version of Supertrend, I wanted to determine the best reaction point for upcoming dips in uptrends.
The indicator is easy to use and gives an accurate reading about an ongoing trend. EMA was determined as the source.
There are 3 parameters that you can edit. These are the EMA length, ATR period and ATR Multiplier.
The average true range (ATR) plays an important role in 'Supertrend' as the indicator uses ATR to calculate its value. The ATR indicator signals the degree of price volatility .
I've found it's a bestreaction point when these values are set to 100, 10 and 0.5 respectively. I tried to show them in the graph.

Higher order Orderblocks + Breakerblocks + Range + AlertsThis script identifies Orderblocks, Breakerblocks and Range using higher order pivots and priceaction logic.
I tried to reduce the number of blocks to make the chart cleaner, for this purpose I use only second order pivots for both MSB lines and supply/demand boxes, I also tried to filter out shifts in MS and false breakouts.
Any box has GRAY color until it gets tested.
After successful test box gets colors:
RED for Supply
GREEN for Demand
BLUE for any Breakerblocks
For cleaner chart and script speed all broken boxes deletes from chart.
It gives comparatively clean chart on any TF, even on extra small (5m, 3m, 1m).
For Range there is option to plot 0.25, 0.5, 0.75 lines.
I usually use log scale on charts and there is an option to use it for proper range mean.
In previous my scripts i have requests to make alerts and this time i made it.
It has customizable alert catching all needed alerts into one output:
- Alert MSB - when market structure changes alert will inform you about its direction, MSB line and new Demand/Supply.
- Alert Orderblock or Breakerblock test - alerts when block was tested and it holds (in other words when it get RED/GREEN/BLUE colors)
- Alert New Range - when new range detected
- Alert Range test - alerts when range top or botoom was tested and it holds.
some examples :

Profit Percentage TrackerThis script provides a quick and easy way to visualize profits in a chart, based on the given entry date and price.
Optionally, alerts can be sent when profits cross up the given " profit unit ".
In short:
Tracks how much profit one could take based on the input " entry date " and the input " entry price "
These inputs are interactive (www.tradingview.com)
Displays the result in a label on top of the last candle
(Optional) Sends alerts based on the given " profit unit ", that is: if ' 0.5 ' is given, then an alert is triggered every time the profit is raised by that number
(Be careful with low values, as TradingView could stop an alert if it triggers too much.)
For alerts to be displayed, a " script alert " must be created right after the script was added to the chart:
- www.tradingview.com
(Choose ' Profits ' as condition and ' Any alert() function call ')
Good to know: if you check " Notify on app ", alerts can be delivered directly to your phone:
i.imgur.com
Prerequirements :
The chart's timezone has to be set to " Exchange " (this is required in order to support the alert's logic):
- kodify.net

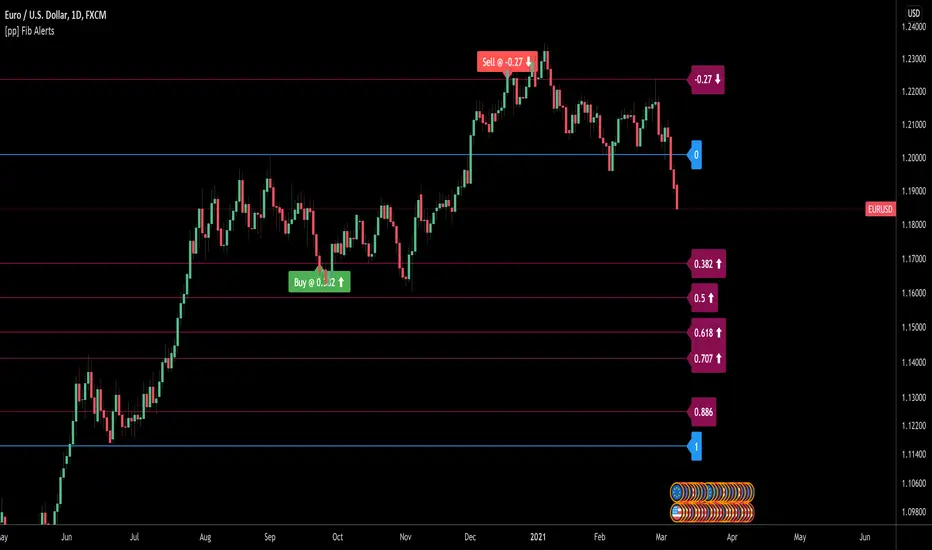
[pp] Fib AlertsUsing the new input.price() function we can now automate our fibonacci tools a little better.
This tool is designed with the intention of trading off of a fibonacci level using alerts.
How to use:
1.Add the indicator to your chart.
2. Place the bottom price where you would normally start your fibonnaci drawing
3. Place the top price where you would normally end your fibonacci drawing
4. Set your alert syntax "buy alert message" and "sell alert message" Should be replaced with webhook configurations or something better.
5. Fibonacci values > 1 (ie. 0.382, 0.5, 0.618) are recognized as retracements and work well as buying opportunities. When the price crosses one of these levels the "buy alert message" alert will be immediately triggered ONCE per BAR (I may update this in the future so it can only trigger ONCE ever to avoid multiple orders)
6. Fibonacci values < 1 (ie . -0.113, -0.27) are recognized as extensions levels and work well as selling opportunities. When the price crosses one of these levels the "Sell alert message" alert will be triggered.
If anyone knows how to convert the fibonacci values to logarithmic values I would greatly appreciate insight.
Opening Range FibonaccisThis indicator uses the concept of the "Opening Range" to create a Fibonacci zone from the high and low set during a specific time period after open (Defaults to 9:30 - 10:05 AM, EST)
The Opening Range is a popular tool for intraday technical analysis. Price frequently uses these levels as support/resistance, and a breakout from within the range can be a sign of further movement.
The Fibonacci levels are set such that the opening range high/low fall on the +/-0.5 fib. This creates an "extended range" outside of the opening range that may be useful during breakouts.
