COT Net Non-Commercials vs Commercials (Updated MTF Non-Repaint)Hello there,
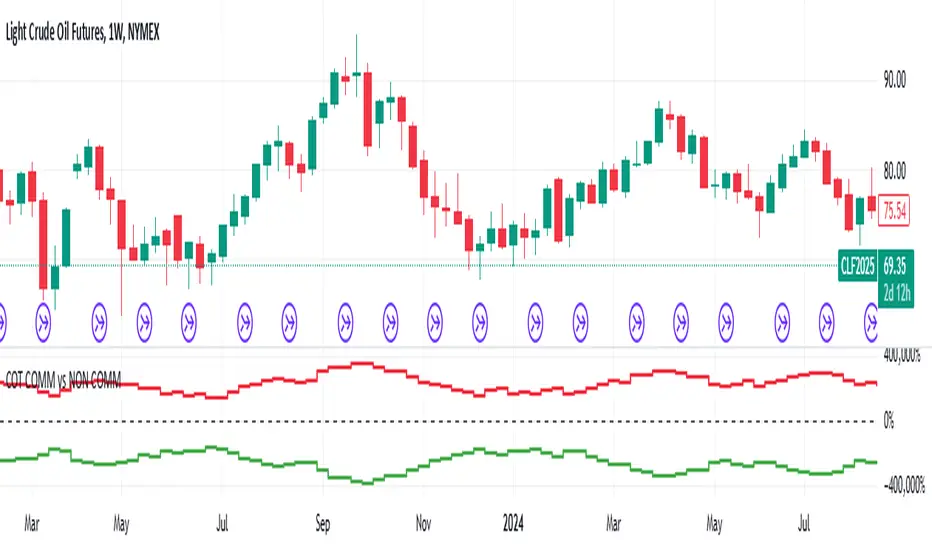
With this script, you can see CFTC COT Non Commercial and Commercial Positions together.
This way, you can analyze net values greater than 0 and smaller, as well as very dense and very shallow positions of producers and speculators.
Green - Non Commercials - Speculators
Red - Commercials - Producers
This script is multi time-frame and non-repaint script.
Data pulled through Quandl.
And the latest version codes have been used.
As time goes by, I will try to make useful modifications to this scheme.
Regards.
Cari skrip untuk "西布罗姆vs伯恩利"
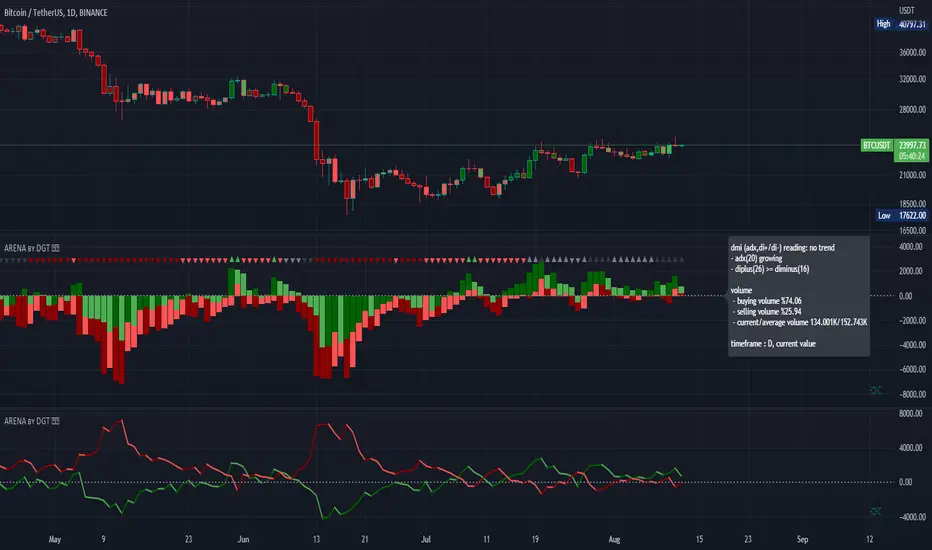
Bull vs Bear Power by DGTElder-Ray Bear and Bull Power
Dr. Alexander Elder cleverly named his first indicator Elder-Ray because of its function, which is designed to see through the market like an X-ray machine. Developed in 1989, the Elder-Ray indicator can be applied to the chart of any security and helps traders determine the strength of competing groups of bulls and bears by gazing under the surface of the markets for data that may not immediately be ascertainable from a superficial glance at prices
The Elder-Ray indicator is comprised by three elements – Bear Power, Bull Power and a 13-period Exponential Moving Average.
As the high price of any candle shows the maximum power of buyers and the low price of any candle shows the maximum power of sellers, Elder uses the 13-period EMA in order to present the average consensus of price value. Bull power shows whether buyers are capable of pushing prices above the average consensus of value. Bear power shows whether sellers are capable of pushing prices below the average consensus of value. Mathematically, Bull power is the result of subtracting the 13-period EMA from the high price of the day, and Bear power is the result of subtracting the 13-period EMA from the low price of the day.
What does this study implements
Attempts to customize interpretation of Alexander Elder's Elder-Ray Indicator (Bull and Bear Power) by
• adding additional insights to support/confirm Elder’s strategy with different indicators related with the Elder’s concept
• providing different options of visualization of the indicator
• providing smoothing capability
Other Indicators to support/confirm Elder-Ray Indicator:
Colored Directional Movement Index (CDMI) , a custom interpretation of J. Welles Wilder’s Directional Movement Index (DMI) , where :
DMI is a collection of three separate indicators ( ADX , +DI , -DI ) combined into one and measures the trend’s strength as well as its direction
CDMI is a custom interpretation of DMI which presents ( ADX , +DI , -DI ) with a color scale - representing the trend’s strength, color density - representing momentum/slope of the trend’s strength, and triangle up/down shapes - representing the trend’s direction. CDMI provides all the information in a single line with colored triangle shapes plotted on the top. DMI can provide quality information and even trading signals but it is not an easy indicator to master, whereus CDMI simplifies its usage.
Alexander Elder considers the slope of the EMA, which gives insight into the recent trend whether is up or down, and CDMI adds additional insight of verifying/confirming the trend as well as its strength
Note : educational content of how to read CDMI can be found in ideas section named as “Colored Directional Movement Index”
different usages of CDMI can be observed with studies “Candlestick Patterns in Context by DGT", “Ichimoku Colored SuperTrend + Colored DMI by DGT”, “Colored Directional Movement and Bollinger Band's Cloud by DGT”, and “Technical Analyst by DGT”
Price Convergence/Divergence , if we pay attention to mathematical formulations of bull power, bear power and price convergence/divergence (also can be expressed as price distance to its ma) we would clearly observe that price convergence/divergence is in fact the result of how the market performed based on the fact that we assume 13-period EMA is consensus of price value. Then, we may assume that the price convergence/divergence crosses of bull power, or bear power, or sum of bull and bear power could be considered as potential trading signals
Additionally, price convergence/divergence visualizes the belief that prices high above the moving average or low below it are likely to be remedied in the future by a reverse price movement
Alternatively, Least Squares Moving Average of Price Convergence/Divergence (also known as Linear Regression Curve) can be plotted instead of Price Convergence/Divergence which can be considered as a smoothed version of Price Convergence/Divergence
Note : different usages of Price Convergence/Divergence can be observed with studies “Trading Psychology - Fear & Greed Index by DGT”, “Price Distance to its MA by DGT”, “P-MACD by DGT”, where “Price Distance to its MA by DGT” can also be considered as educational content which includes an article of a research carried on the topic
Options of Visualization
Bull and Bear Power plotted as two separate
• histograms
• lines
• bands
Sum of Bull and Bear Power plotted as single
• histogram
• line
• band
Others
Price Convergence/Divergence displayed as Line
CDMI is displayed as single colored line of triangle shapes, where triangle shapes displays direction of the trend (triangle up represents bull and triangle down represent bear), colors of CDMI displays the strength of the trend (green – strong bullish, red – strong bearish, gray – no trend, yellow – week trend)
In general with this study, color densities also have a meaning and aims to displays if the value of the indicator is falling or growing, darker colors displays more intense move comparing to light one
Note : band's upper and lower levels are calculated by using standard deviation build-in function with multiply factor of 0.236 Fibonacci’s ratio (just a number for our case, no any meaning)
Smoothing
No smoothing is applied by default but the capability is added in case Price Convergence/Divergence Line is assumed to be used as a signal line it will be worth smoothing the bear, bull or sum of bear and bull power indicators
Interpreting Elder-Ray Indicator, according to Dr. Alexander Elder
Bull Power should remain positive in normal circumstances, while Bear Power should remain negative in normal circumstances. In case the Bull Power indicator enters into negative territory, this implies that sellers have overcome buyers and control the market. In case the Bear Power indicator enters into positive territory, this indicates that buyers have overcome sellers and control the market. A trader should not go long at times when the Bear Power indicator is positive and he/she should not go short at times when the Bull Power indicator is negative.
13-period EMAs slope can be used in order to identify the direction of the major trend. According to Elder, the most reliable buy signals are generated, when there is a bullish divergence between the Bear Power indicator and the price (Bear Power forms higher lows, while the market forms lower lows). The most reliable sell signals are generated, when there is a bearish divergence between the Bull Power indicator and the price (Bull Power forms lower highs, while the market forms higher highs).
There are four basic conditions, required to go long or short, with the use of the Elder-Ray method alone.
In order to go long:
1. The market is in a bull trend, as indicated by the 13-period EMA
2. Bear Power is in negative territory, but increasing
3. The most recent Bull Power top is higher than its prior top
4. Bear Power is going up from a bullish divergence
The last two conditions are optional that fine-tune the buying decision
In order to go short:
1. The market is in a bear trend, as indicated by the 13-period EMA
2. Bull Power is in positive territory, but falling
3. The most recent Bear Power bottom is lower than its prior bottom
4. Bull Power is falling from a bearish divergence
The last two conditions are optional, they provide a stronger signal for shorting but they are not absolutely essential
If a trader is willing to add to his/her position, he/she needs to:
1. add to his/her long position, when the Bear Power falls below zero and then climbs back into positive territory
2. add to his/her short position, when the Bull Power increases above zero and then drops back into negative territory.
note : terminology of the definitions used herein are as per TV dictionary
Trading success is all about following your trading strategy and the indicators should fit within your trading strategy, and not to be traded upon solely
Disclaimer : The script is for informational and educational purposes only. Use of the script does not constitute professional and/or financial advice. You alone have the sole responsibility of evaluating the script output and risks associated with the use of the script. In exchange for using the script, you agree not to hold dgtrd TradingView user liable for any possible claim for damages arising from any decision you make based on use of the script
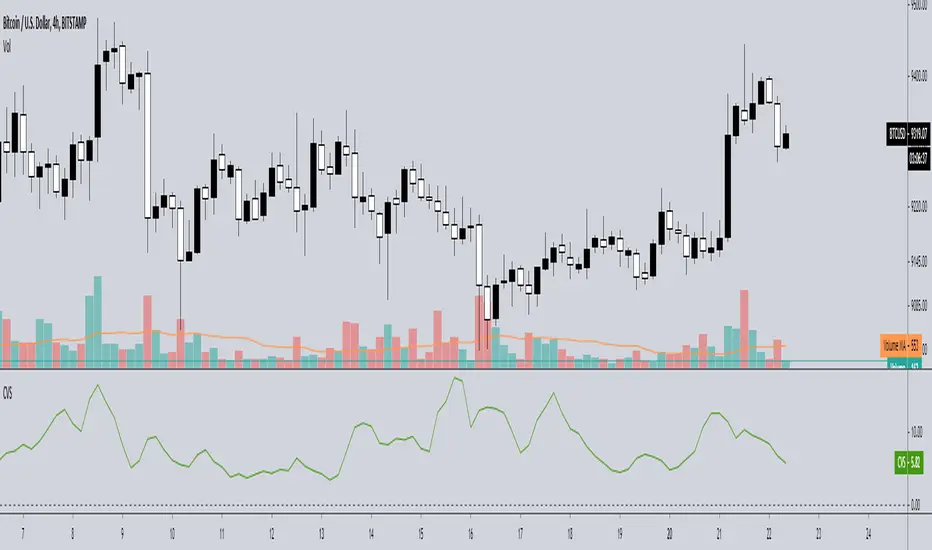
Candle Size vs VolumeBasic script that sees where absorption maybe occurring by looking at the volume of the last 4 candles relative to the distance of their range.
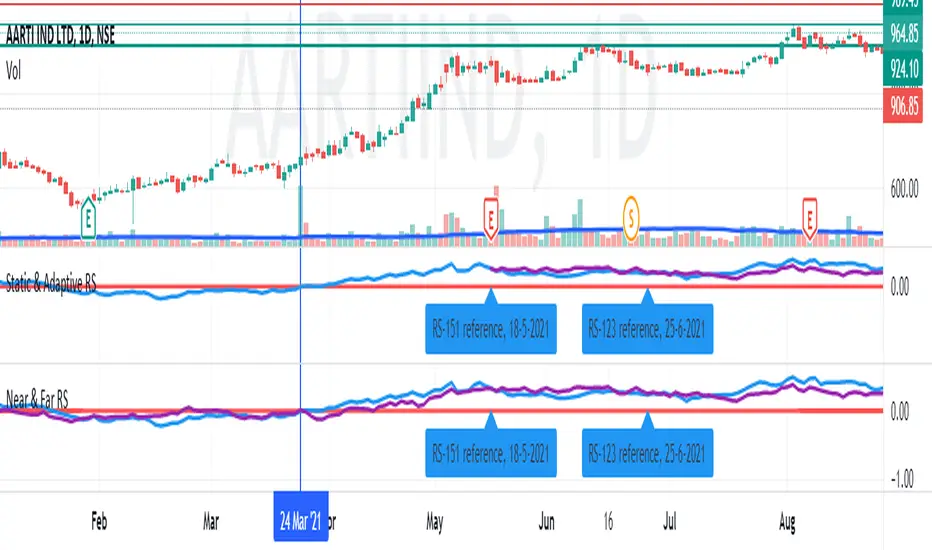
Near & Far Relative StrengthDefine a near time frame base and a far time frame base to compare the selected symbol RS. This helps in situations were you could keep the far RS length to a fixed value and the near RS length to a more recent "event" in the market and it's subsequent movement.
For example, if the market index has made a recovery from a deep crash 80 sessions ago, set the near RS length to 80 and keep the far RS length to a fixed value say, 123 corresponding to 6 months. This will help you gauge the historical vs the recovery strength of your interested symbol before and after the "event".
vol difflearn from
change volume bar color vs sma ,
if bar up, volume bar change to orange, volume >20sma, volume change yellow.
if bar down, volume bar change to silver , volume >20sma, volume change black.

Relative CandleThis script visualizes the relative movement of a single OHLC candle compared to an index (or another symbol). The vertical location of the candle indicates the general positive/negative comparison of the bar vs the index. The color of the candle indicates how the candle moved relative to the index. The wick indicates the closing range compared to the index (did the symbol close at lows of the bar while the index closed at highs).
The area graph in the background shows the average relative close over a 10-day simple moving average.
I use this to pop any behavior that is out of line with the market, whether positive or negative. For example, is a red bar day due to the market pullback or something specific to the stock. Or did the market pull back and the stock did the opposite, strong day!

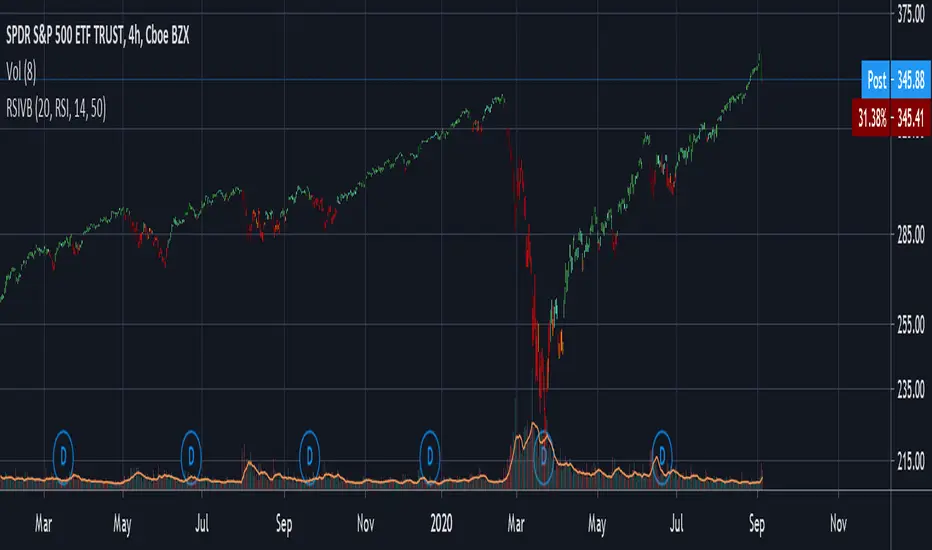
RSI & Volume Coloured BarsCandles get darker when volume is high, and brighter when volume is low. They are red or green depending on whether the RSI is above or below a threshold value, or alternatively you can pick a more vanilla coloring based on current close vs last close or last open.
For personal use as I enjoy the aesthetics of it. The more solid RSI coloring helps highlight the brightness variations from changing volume and makes trends crystal clear.
Inspired by "Volume Based Coloured Bars" by KivancOzbilgic:
and by and by RSI bars chart by taskman9:
Brick count (Renko)Brick is a part of Renko chart. It is reasonable to think, that is the number of green brick is higher than the number of red brick then the trend is bullish. This indicator plots the relative number of red bricks vs green bricks.

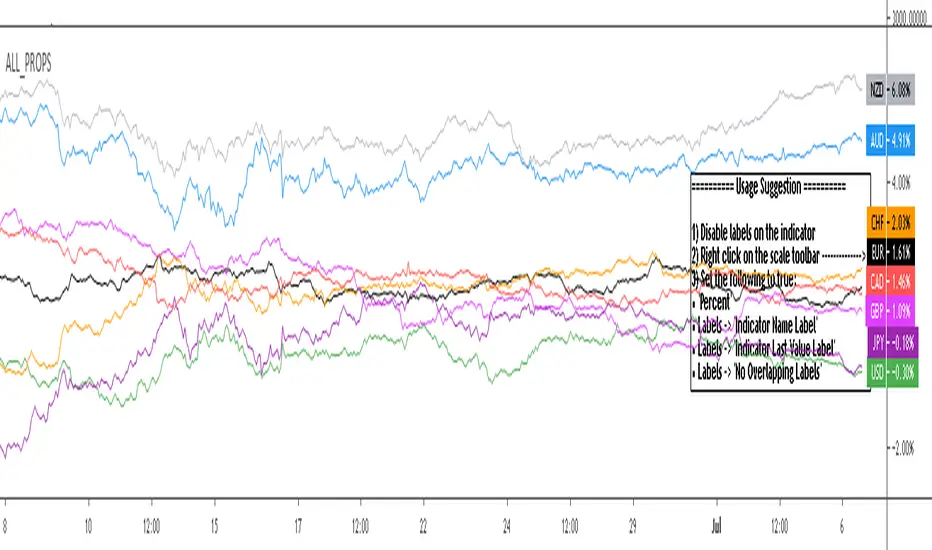
All_Props - non weighted currency indices for major fx pairsAll_Props - non weighted currency indices for major fx pairs
Quickly gauge major fx currency flows in one indicator
Extra use: 2 instances can be combined in the same indicator window to compare just the base currency vs the inverted quote currency. Note: You will need to set one of the instances to 'Only display base currency' and the other to 'Only display inverted quote currency' if you wish to use it in this manner. One of the instances should also have tradingview scaling set to 'Pin to Scale -> No scale fullscreen'
If you wish to update the indicator with new currency values then make a personal copy and update the 'Index Formulas: Copy and paste formulas here' section

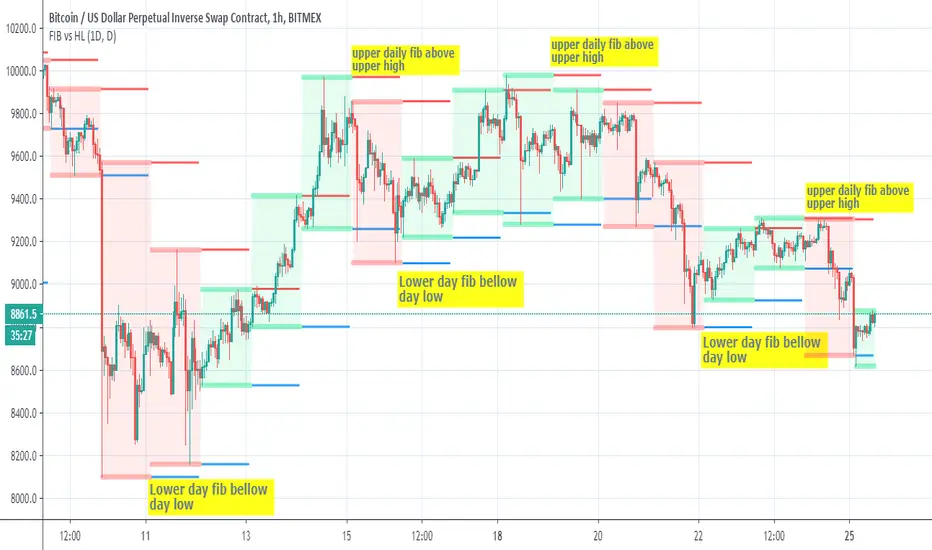
FIB vs HLThis script show the relation bettwen daily fib seen in red =upper and blue=lower to daily candles upper and lower
since there is slight variation how both calculated we can see that when daily fib is lower then the low candles daily low then there is a good chance for a buy trend
and vice versa in oposite direction
so it just a nice idea that need further verification
Cross Asset VolatilityThis script brings together a number of volatility indexes from the CBOE in one space making it easier to use rather than adding a number of different securities to one chart. One could create a template with these securities attached, but sometimes, you don't want to switch charts, for whatever reason, and adding an indicator for is quick and simple.
One note is that due some securities exhibit much larger volatility than others (i.e. oil vs bonds) and it can be difficult to see clearly those securities whose volatilities are low, and hence we have added the ability to calculate the values as a Log value to make the indicator more readable. Another way to do this is to change the Y-axis on the chart to Logarithmic while leaving the indicator at its default settings (i.e. the checkbox for using Log calculations remains unchecked).

V/V weighted ma - JDAs a third new weighted moving average I present the Volume-Volatility Weighted Moving Average.
The Volume-Volatility Weighted Moving Average (VVwma) calculates the average price over a certain period,
weighted by both volume and volatilty, Big volume doesn't necessarily move price a lot but is very important,
big price moves don't always need big volume but also have a lot of importance!
In this indicator both big volume moves as well as big price moves are factored in to calculate the ma behaviour.
The ma has a tendancy to quickly give an indication of a ranging vs trending market by angle of the ma.
In ranging market it quickly flattens out and could be used to filter out insignificant low volume/volatility moves
compared to regular ma's or the standard volume weighted ma
Another use of it could be as entry/exit signals or
as a means of a trailing stop or a hard exit for a strategy or
as a "baseline" to combine with other signals
feel free to experiment!!!
If you use the VVwma in your scripts or your work, a shoutout would be nice!!
Gr, JD.
#NotTradingAdvice #DYOR

Volatility weighted maThe next in my series of weighted moving averages is the Volatility Weighted Moving Average.
The Volatility Weighted Moving Average (Volwma) calculates the average price over a certain period,
contrary to the well known Volume weighted ma, it is weighted by volatilty,
meaning big price moves don't always need big volume but also have a lot of importance!
In this indicator these big price moves are factored in to calculate the ma behaviour.
As the ma is quite biased on price moves it can quickly give an indication of a ranging vs trending market by angle of the ma.
In ranging market it quickly flattens out and could be used to filter out insignificant low volatility moves
compared to regular ma's or the standard volume weighted ma
Another use of it could be as entry/exit signals or
as a means of a trailing stop or a hard exit for a strategy or
as a "baseline" to combine with other signals
feel free to experiment!!!
If you use the Volwma in your scripts or your work, a shoutout would be nice!!
Gr, JD.
#NotTradingAdvice #DYOR

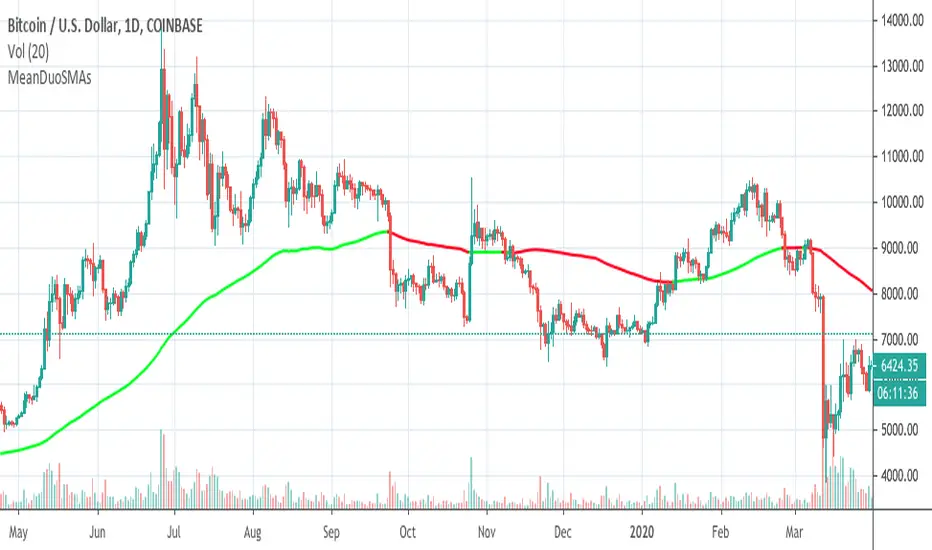
MeanDuoSMAsMean of slow SMA200 and fast SMA50. Color changes according to position of close price vs indicator value. Works best with BTCUSD daily chart.