Pinescript - Common Label & Line Array Functions Library by RRBPinescript - Common Label & Line Array Functions Library by RagingRocketBull 2021
Version 1.0
This script provides a library of common array functions for arrays of label and line objects with live testing of all functions.
Using this library you can easily create, update, delete, join label/line object arrays, and get/set properties of individual label/line object array items.
You can find the full list of supported label/line array functions below.
There are several libraries:
- Common String Functions Library
- Standard Array Functions Library
- Common Fixed Type Array Functions Library
- Common Label & Line Array Functions Library
- Common Variable Type Array Functions Library
Features:
- 30 array functions in categories create/update/delete/join/get/set with support for both label/line objects (45+ including all implementations)
- Create, Update label/line object arrays from list/array params
- GET/SET properties of individual label/line array items by index
- Join label/line objects/arrays into a single string for output
- Supports User Input of x,y coords of 5 different types: abs/rel/rel%/inc/inc% list/array, auto transforms x,y input into list/array based on type, base and xloc, translates rel into abs bar indexes
- Supports User Input of lists with shortened names of string properties, auto expands all standard string properties to their full names for use in functions
- Live Output for all/selected functions based on User Input. Test any function for possible errors you may encounter before using in script.
- Output filters: hide all excluded and show only allowed functions using a list of function names
- Output Panel customization options: set custom style, color, text size, and line spacing
Usage:
- select create function - create label/line arrays from lists or arrays (optional). Doesn't affect the update functions. The only change in output should be function name regardless of the selected implementation.
- specify num_objects for both label/line arrays (default is 7)
- specify common anchor point settings x,y base/type for both label/line arrays and GET/SET items in Common Settings
- fill lists with items to use as inputs for create label/line array functions in Create Label/Line Arrays section
- specify label/line array item index and properties to SET in corresponding sections
- select label/line SET function to see the changes applied live
Code Structure:
- translate x,y depending on x,y type, base and xloc as specified in UI (required for all functions)
- expand all shortened standard property names to full names (required for create/update* from arrays and set* functions, not needed for create/update* from lists) to prevent errors in label.new and line.new
- create param arrays from string lists (required for create/update* from arrays and set* functions, not needed for create/update* from lists)
- create label/line array from string lists (property names are auto expanded) or param arrays (requires already expanded properties)
- update entire label/line array or
- get/set label/line array item properties by index
Transforming/Expanding Input values:
- for this script to work on any chart regardless of price/scale, all x*,y* are specified as % increase relative to x0,y0 base levels by default, but user can enter abs x,price values specific for that chart if necessary.
- all lists can be empty, contain 1 or several items, have the same/different lengths. Array Length = min(min(len(list*)), mum_objects) is used to create label/line objects. Missing list items are replaced with default property values.
- when a list contains only 1 item it is duplicated (label name/tooltip is also auto incremented) to match the calculated Array Length
- since this script processes user input, all x,y values must be translated to abs bar indexes before passing them to functions. Your script may provide all data internally and doesn't require this step.
- at first int x, float y arrays are created from user string lists, transformed as described below and returned as x,y arrays.
- translated x,y arrays can then be passed to create from arrays function or can be converted back to x,y string lists for the create from lists function if necessary.
- all translation logic is separated from create/update/set functions for the following reasons:
- to avoid redundant code/dependency on ext functions/reduce local scopes and to be able to translate everything only once in one place - should be faster
- to simplify internal logic of all functions
- because your script may provide all data internally without user input and won't need the translation step
- there are 5 types available for both x,y: abs, rel, rel%, inc, inc%. In addition to that, x can be: bar index or time, y is always price.
- abs - absolute bar index/time from start bar0 (x) or price (y) from 0, is >= 0
- rel - relative bar index/time from cur bar n (x) or price from y0 base level, is >= 0
- rel% - relative % increase of bar index/time (x) or price (y) from corresponding base level (x0 or y0), can be <=> 0
- inc - relative increment (step) for each new level of bar index/time (x) or price (y) from corresponding base level (x0 or y0), can be <=> 0
- inc% - relative % increment (% step) for each new level of bar index/time (x) or price (y) from corresponding base level (x0 or y0), can be <=> 0
- x base level >= 0
- y base level can be 0 (empty) or open, close, high, low of cur bar
- single item x1_list = "50" translates into:
- for x type abs: "50, 50, 50 ..." num_objects times regardless of xloc => x = 50
- for x type rel: "50, 50, 50 ... " num_objects times => x = x_base + 50
- for x type rel%: "50%, 50%, 50% ... " num_objects times => x_base * (1 + 0.5)
- for x type inc: "0, 50, 100 ... " num_objects times => x_base + 50 * i
- for x type inc%: "0%, 50%, 100% ... " num_objects times => x_base * (1 + 0.5 * i)
- when xloc = xloc.bar_index each rel*/inc* value in the above list is then subtracted from n: n - x to convert rel to abs bar index, values of abs type are not affected
- x1_list = "0, 50, 100, ..." of type rel is the same as "50" of type inc
- x1_list = "50, 50, 50, ..." of type abs/rel/rel% produces a sequence of the same values and can be shortened to just "50"
- single item y1_list = "2" translates into (ragardless of yloc):
- for y type abs: "2, 2, 2 ..." num_objects times => y = 2
- for y type rel: "2, 2, 2 ... " num_objects times => y = y_base + 2
- for y type rel%: "2%, 2%, 2% ... " num_objects times => y = y_base * (1 + 0.02)
- for y type inc: "0, 2, 4 ... " num_objects times => y = y_base + 2 * i
- for y type inc%: "0%, 2%, 4% ... " num_objects times => y = y_base * (1 + 0.02 * i)
- when yloc != yloc.price all calculated values above are simply ignored
- y1_list = "0, 2, 4" of type rel% is the same as "2" with type inc%
- y1_list = "2, 2, 2" of type abs/rel/rel% produces a sequence of the same values and can be shortened to just "2"
- you can enter shortened property names in lists. To lookup supported shortened names use corresponding dropdowns in Set Label/Line Array Item Properties sections
- all shortened standard property names must be expanded to full names (required for create/update* from arrays and set* functions, not needed for create/update* from lists) to prevent errors in label.new and line.new
- examples of shortened property names that can be used in lists: bar_index, large, solid, label_right, white, left, left, price
- expanded to their corresponding full names: xloc.bar_index, size.large, line.style_solid, label.style_label_right, color.white, text.align_left, extend.left, yloc.price
- all expanding logic is separated from create/update* from arrays and set* functions for the same reasons as above, and because param arrays already have different types, implying the use of final values.
- all expanding logic is included in the create/update* from lists functions because it seemed more natural to process string lists from user input directly inside the function, since they are already strings.
Creating Label/Line Objects:
- use study max_lines_count and max_labels_count params to increase the max number of label/line objects to 500 (+3) if necessary. Default number of label/line objects is 50 (+3)
- all functions use standard param sequence from methods in reference, except style always comes before colors.
- standard label/line.get* functions only return a few properties, you can't read style, color, width etc.
- label.new(na, na, "") will still create a label with x = n-301, y = NaN, text = "" because max default scope for a var is 300 bars back.
- there are 2 types of color na, label color requires color(na) instead of color_na to prevent error. text_color and line_color can be color_na
- for line to be visible both x1, x2 ends must be visible on screen, also when y1 == y2 => abs(x1 - x2) >= 2 bars => line is visible
- xloc.bar_index line uses abs x1, x2 indexes and can only be within 0 and n ends, where n <= 5000 bars (free accounts) or 10000 bars (paid accounts) limit, can't be plotted into the future
- xloc.bar_time line uses abs x1, x2 times, can't go past bar0 time but can continue past cur bar time into the future, doesn't have a length limit in bars.
- xloc.bar_time line with length = exact number of bars can be plotted only within bar0 and cur bar, can't be plotted into the future reliably because of future gaps due to sessions on some charts
- xloc.bar_index line can't be created on bar 0 with fixed length value because there's only 1 bar of horiz length
- it can be created on cur bar using fixed length x < n <= 5000 or
- created on bar0 using na and then assigned final x* values on cur bar using set_x*
- created on bar0 using n - fixed_length x and then updated on cur bar using set_x*, where n <= 5000
- default orientation of lines (for style_arrow* and extend) is from left to right (from bar 50 to bar 0), it reverses when x1 and x2 are swapped
- price is a function, not a line object property
Variable Type Arrays:
- you can't create an if/function that returns var type value/array - compiler uses strict types and doesn't allow that
- however you can assign array of any type to another array of any type creating an arr pointer of invalid type that must be reassigned to a matching array type before used in any expression to prevent error
- create_any_array2 uses this loophole to return an int_arr pointer of a var type array
- this works for all array types defined with/without var keyword and doesn't work for string arrays defined with var keyword for some reason
- you can't do this with var type vars, only var type arrays because arrays are pointers passed by reference, while vars are actual values passed by value.
- you can only pass a var type value/array param to a function if all functions inside support every type - otherwise error
- alternatively values of every type must be passed simultaneously and processed separately by corresponding if branches/functions supporting these particular types returning a common single type result
- get_var_types solves this problem by generating a list of dummy values of every possible type including the source type, tricking the compiler into allowing a single valid branch to execute without error, while ignoring all dummy results
Notes:
- uses Pinescript v3 Compatibility Framework
- uses Common String Functions Library, Common Fixed Type Array Functions Library, Common Variable Type Array Functions Library
- has to be a separate script to reduce the number of local scopes/compiled file size, can't be merged with another library.
- lets you live test all label/line array functions for errors. If you see an error - change params in UI
- if you see "Loop too long" error - hide/unhide or reattach the script
- if you see "Chart references too many candles" error - change x type or value between abs/rel*. This can happen on charts with 5000+ bars when a rel bar index x is passed to label.new or line.new instead of abs bar index n - x
- create/update_label/line_array* use string lists, while create/update_label/line_array_from_arrays* use array params to create label/line arrays. "from_lists" is dropped to shorten the names of the most commonly used functions.
- create_label/line_array2,4 are preferable, 5,6 are listed for pure demonstration purposes only - don't use them, they don't improve anything but dramatically increase local scopes/compiled file size
- for this reason you would mainly be using create/update_label/line_array2,4 for list params or create/update_label/line_array_from_arrays2 for array params
- all update functions are executed after each create as proof of work and can be disabled. Only create functions are required. Use update functions when necessary - when list/array params are changed by your script.
- both lists and array item properties use the same x,y_type, x,y_base from common settings
- doesn't use pagination, a single str contains all output
- why is this so complicated? What are all these functions for?
- this script merges standard label/line object methods with standard array functions to create a powerful set of label/line object array functions to simplify manipulation of these arrays.
- this library also extends the functionality of Common Variable Type Array Functions Library providing support for label/line types in var type array functions (any_to_str6, join_any_array5)
- creating arrays from either lists or arrays adds a level of flexibility that comes with complexity. It's very likely that in your script you'd have to deal with both string lists as input, and arrays internally, once everything is converted.
- processing user input, allowing customization and targeting for any chart adds a whole new layer of complexity, all inputs must be translated and expanded before used in functions.
- different function implementations can increase/reduce local scopes and compiled file size. Select a version that best suits your needs. Creating complex scripts often requires rewriting your code multiple times to fit the limits, every line matters.
P.S. Don't rely too much on labels, for too often they are fables.
List of functions*:
* - functions from other libraries are not listed
1. Join Functions
Labels
- join_label_object(label_, d1, d2)
- join_label_array(arr, d1, d2)
- join_label_array2(arr, d1, d2, d3)
Lines
- join_line_object(line_, d1, d2)
- join_line_array(arr, d1, d2)
- join_line_array2(arr, d1, d2, d3)
Any Type
- any_to_str6(arr, index, type)
- join_any_array4(arr, d1, d2, type)
- join_any_array5(arr, d, type)
2. GET/SET Functions
Labels
- label_array_get_text(arr, index)
- label_array_get_xy(arr, index)
- label_array_get_fields(arr, index)
- label_array_set_text(arr, index, str)
- label_array_set_xy(arr, index, x, y)
- label_array_set_fields(arr, index, x, y, str)
- label_array_set_all_fields(arr, index, x, y, str, xloc, yloc, label_style, label_color, text_color, text_size, text_align, tooltip)
- label_array_set_all_fields2(arr, index, x, y, str, xloc, yloc, label_style, label_color, text_color, text_size, text_align, tooltip)
Lines
- line_array_get_price(arr, index, bar)
- line_array_get_xy(arr, index)
- line_array_get_fields(arr, index)
- line_array_set_text(arr, index, width)
- line_array_set_xy(arr, index, x1, y1, x2, y2)
- line_array_set_fields(arr, index, x1, y1, x2, y2, width)
- line_array_set_all_fields(arr, index, x1, y1, x2, y2, xloc, extend, line_style, line_color, width)
- line_array_set_all_fields2(arr, index, x1, y1, x2, y2, xloc, extend, line_style, line_color, width)
3. Create/Update/Delete Functions
Labels
- delete_label_array(label_arr)
- create_label_array(list1, list2, list3, list4, list5, d)
- create_label_array2(x_list, y_list, str_list, xloc_list, yloc_list, style_list, color1_list, color2_list, size_list, align_list, tooltip_list, d)
- create_label_array3(x_list, y_list, str_list, xloc_list, yloc_list, style_list, color1_list, color2_list, size_list, align_list, tooltip_list, d)
- create_label_array4(x_list, y_list, str_list, xloc_list, yloc_list, style_list, color1_list, color2_list, size_list, align_list, tooltip_list, d)
- create_label_array5(x_list, y_list, str_list, xloc_list, yloc_list, style_list, color1_list, color2_list, size_list, align_list, tooltip_list, d)
- create_label_array6(x_list, y_list, str_list, xloc_list, yloc_list, style_list, color1_list, color2_list, size_list, align_list, tooltip_list, d)
- update_label_array2(label_arr, x_list, y_list, str_list, xloc_list, yloc_list, style_list, color1_list, color2_list, size_list, align_list, tooltip_list, d)
- update_label_array4(label_arr, x_list, y_list, str_list, xloc_list, yloc_list, style_list, color1_list, color2_list, size_list, align_list, tooltip_list, d)
- create_label_array_from_arrays2(x_arr, y_arr, str_arr, xloc_arr, yloc_arr, style_arr, color1_arr, color2_arr, size_arr, align_arr, tooltip_arr, d)
- create_label_array_from_arrays4(x_arr, y_arr, str_arr, xloc_arr, yloc_arr, style_arr, color1_arr, color2_arr, size_arr, align_arr, tooltip_arr, d)
- update_label_array_from_arrays2(label_arr, x_arr, y_arr, str_arr, xloc_arr, yloc_arr, style_arr, color1_arr, color2_arr, size_arr, align_arr, tooltip_arr, d)
Lines
- delete_line_array(line_arr)
- create_line_array(list1, list2, list3, list4, list5, list6, d)
- create_line_array2(x1_list, y1_list, x2_list, y2_list, xloc_list, extend_list, style_list, color_list, width_list, d)
- create_line_array3(x1_list, y1_list, x2_list, y2_list, xloc_list, extend_list, style_list, color_list, width_list, d)
- create_line_array4(x1_list, y1_list, x2_list, y2_list, xloc_list, extend_list, style_list, color_list, width_list, d)
- create_line_array5(x1_list, y1_list, x2_list, y2_list, xloc_list, extend_list, style_list, color_list, width_list, d)
- create_line_array6(x1_list, y1_list, x2_list, y2_list, xloc_list, extend_list, style_list, color_list, width_list, d)
- update_line_array2(line_arr, x1_list, y1_list, x2_list, y2_list, xloc_list, extend_list, style_list, color_list, width_list, d)
- update_line_array4(line_arr, x1_list, y1_list, x2_list, y2_list, xloc_list, extend_list, style_list, color_list, width_list, d)
- create_line_array_from_arrays2(x1_arr, y1_arr, x2_arr, y2_arr, xloc_arr, extend_arr, style_arr, color_arr, width_arr, d)
- update_line_array_from_arrays2(line_arr, x1_arr, y1_arr, x2_arr, y2_arr, xloc_arr, extend_arr, style_arr, color_arr, width_arr, d)
Cari skrip untuk "涨幅大于1000的股票"

Volumetric colored candles with matching pivot point linesCandles are split into 10 categories based on their volume, and can be changed in the options. By default and in the images, white is very high volume, reds are high volume, yellows are medium volume, greens are low and dark-grey is very low.
Adjustments for scale are included in the options. The Magnitude option is a 10x multiplier, so 1=10, 2=100, 3=1000, etc., up to 9. There is also a Multiplier selection option where 1=1, 2=2, 3=3, 4=4, etc.
To attenuate for a given chart, these multipliers will need to be changed. In general, all white means you need to increase the Magnitude and all dark-grey means you need to decrease the magnitude. Somewhere between those two, the Multiplier can be used for further calibration. All this color coating is relational, like a spectrum. As you adjust you will see them maintaining their proportions as the candles switch color (ex. green become yellow while yellow becomes red).
I have also included pivot lines that follow the same logic for color coding. Two options exist for adjusting the pivot high and pivot low points respectively. They do not always correspond to the exact color of the candle producing them, but they should be a rough average (ie. red and green bars making yellow lines). They make for good indicators of how much liquidity may be at a certain support/resistance level. The lines can also be turned off altogether.
If your candles aren't looking right, go to settings of both regular candles and heikin-ashi, and uncheck both border and wick.
I still have some code to clean up and I plan on expanding upon this study. If you like my work consider tipping!

Using `varip` variables [PineCoders]█ OVERVIEW
The new varip keyword in Pine can be used to declare variables that escape the rollback process, which is explained in the Pine User Manual's page on the execution model . This publication explains how Pine coders can use variables declared with varip to implement logic that was impossible to code in Pine before, such as timing events during the realtime bar, or keeping track of sequences of events that occur during successive realtime updates. We present code that allows you to calculate for how much time a given condition is true during a realtime bar, and show how this can be used to generate alerts.
█ WARNINGS
1. varip is an advanced feature which should only be used by coders already familiar with Pine's execution model and bar states .
2. Because varip only affects the behavior of your code in the realtime bar, it follows that backtest results on strategies built using logic based on varip will be meaningless,
as varip behavior cannot be simulated on historical bars. This also entails that plots on historical bars will not be able to reproduce the script's behavior in realtime.
3. Authors publishing scripts that behave differently in realtime and on historical bars should imperatively explain this to traders.
█ CONCEPTS
Escaping the rollback process
Whereas scripts only execute once at the close of historical bars, when a script is running in realtime, it executes every time the chart's feed detects a price or volume update. At every realtime update, Pine's runtime normally resets the values of a script's variables to their last committed value, i.e., the value they held when the previous bar closed. This is generally handy, as each realtime script execution starts from a known state, which simplifies script logic.
Sometimes, however, script logic requires code to be able to save states between different executions in the realtime bar. Declaring variables with varip now makes that possible. The "ip" in varip stands for "intrabar persist".
Let's look at the following code, which does not use varip :
//@version=4
study("")
int updateNo = na
if barstate.isnew
updateNo := 1
else
updateNo := updateNo + 1
plot(updateNo, style = plot.style_circles)
On historical bars, barstate.isnew is always true, so the plot shows a value of "1". On realtime bars, barstate.isnew is only true when the script first executes on the bar's opening. The plot will then briefly display "1" until subsequent executions occur. On the next executions during the realtime bar, the second branch of the if statement is executed because barstate.isnew is no longer true. Since `updateNo` is initialized to `na` at each execution, the `updateNo + 1` expression yields `na`, so nothing is plotted on further realtime executions of the script.
If we now use varip to declare the `updateNo` variable, the script behaves very differently:
//@version=4
study("")
varip int updateNo = na
if barstate.isnew
updateNo := 1
else
updateNo := updateNo + 1
plot(updateNo, style = plot.style_circles)
The difference now is that `updateNo` tracks the number of realtime updates that occur on each realtime bar. This can happen because the varip declaration allows the value of `updateNo` to be preserved between realtime updates; it is no longer rolled back at each realtime execution of the script. The test on barstate.isnew allows us to reset the update count when a new realtime bar comes in.
█ OUR SCRIPT
Let's move on to our script. It has three parts:
— Part 1 demonstrates how to generate alerts on timed conditions.
— Part 2 calculates the average of realtime update prices using a varip array.
— Part 3 presents a function to calculate the up/down/neutral volume by looking at price and volume variations between realtime bar updates.
Something we could not do in Pine before varip was to time the duration for which a condition is continuously true in the realtime bar. This was not possible because we could not save the beginning time of the first occurrence of the true condition.
One use case for this is a strategy where the system modeler wants to exit before the end of the realtime bar, but only if the exit condition occurs for a specific amount of time. One can thus design a strategy running on a 1H timeframe but able to exit if the exit condition persists for 15 minutes, for example. REMINDER: Using such logic in strategies will make backtesting their complete logic impossible, and backtest results useless, as historical behavior will not match the strategy's behavior in realtime, just as using `calc_on_every_tick = true` will do. Using `calc_on_every_tick = true` is necessary, by the way, when using varip in a strategy, as you want the strategy to run like a study in realtime, i.e., executing on each price or volume update.
Our script presents an `f_secondsSince(_cond, _resetCond)` function to calculate the time for which a condition is continuously true during, or even across multiple realtime bars. It only works in realtime. The abundant comments in the script hopefully provide enough information to understand the details of what it's doing. If you have questions, feel free to ask in the Comments section.
Features
The script's inputs allow you to:
• Specify the number of seconds the tested conditions must last before an alert is triggered (the default is 20 seconds).
• Determine if you want the duration to reset on new realtime bars.
• Require the direction of alerts (up or down) to alternate, which minimizes the number of alerts the script generates.
The inputs showcase the new `tooltip` parameter, which allows additional information to be displayed for each input by hovering over the "i" icon next to it.
The script only displays useful information on realtime bars. This information includes:
• The MA against which the current price is compared to determine the bull or bear conditions.
• A dash which prints on the chart when the bull or bear condition is true.
• An up or down triangle that prints when an alert is generated. The triangle will only appear on the update where the alert is triggered,
and unless that happens to be on the last execution of the realtime bar, it will not persist on the chart.
• The log of all triggered alerts to the right of the realtime bar.
• A gray square on top of the elapsed realtime bars where one or more alerts were generated. The square's tooltip displays the alert log for that bar.
• A yellow dot corresponding to the average price of all realtime bar updates, which is calculated using a varip array in "Part 2" of the script.
• Various key values in the Data Window for each parts of the script.
Note that the directional volume information calculated in Part 3 of the script is not plotted on the chart—only in the Data Window.
Using the script
You can try running the script on an open market with a 30sec timeframe. Because the default settings reset the duration on new realtime bars and require a 20 second delay, a reasonable amount of alerts will trigger.
Creating an alert on the script
You can create a script alert on the script. Keep in mind that when you create an alert from this script, the duration calculated by the instance of the script running the alert will not necessarily match that of the instance running on your chart, as both started their calculations at different times. Note that we use alert.freq_all in our alert() calls, so that alerts will trigger on all instances where the associated condition is met. If your alert is being paused because it reaches the maximum of 15 triggers in 3 minutes, you can configure the script's inputs so that up/down alerts must alternate. Also keep in mind that alerts run a distinct instance of your script on different servers, so discrepancies between the behavior of scripts running on charts and alerts can occur, especially if they trigger very often.
Challenges
Events detected in realtime using variables declared with varip can be transient and not leave visible traces at the close of the realtime bar, as is the case with our script, which can trigger multiple alerts during the same realtime bar, when the script's inputs allow for this. In such cases, elapsed realtime bars will be of no use in detecting past realtime bar events unless dedicated code is used to save traces of events, as we do with our alert log in this script, which we display as a tooltip on elapsed realtime bars.
█ NOTES
Realtime updates
We have no control over when realtime updates occur. A realtime bar can open, and then no realtime updates can occur until the open of the next realtime bar. The time between updates can vary considerably.
Past values
There is no mechanism to refer to past values of a varip variable across realtime executions in the same bar. Using the history-referencing operator will, as usual, return the variable's committed value on previous bars. If you want to preserve past values of a varip variable, they must be saved in other variables or in an array .
Resetting variables
Because varip variables not only preserve their values across realtime updates, but also across bars, you will typically need to plan conditions that will at some point reset their values to a known state. Testing on barstate.isnew , as we do, is a good way to achieve that.
Repainting
The fact that a script uses varip does not make it necessarily repainting. A script could conceivably use varip to calculate values saved when the realtime bar closes, and then use confirmed values of those calculations from the previous bar to trigger alerts or display plots, avoiding repaint.
timenow resolution
Although the variable is expressed in milliseconds it has an actual resolution of seconds, so it only increments in multiples of 1000 milliseconds.
Warn script users
When using varip to implement logic that cannot be replicated on historical bars, it's really important to explain this to traders in published script descriptions, even if you publish open-source. Remember that most TradingViewers do not know Pine.
New Pine features used in this script
This script uses three new Pine features:
• varip
• The `tooltip` parameter in input() .
• The new += assignment operator. See these also: -= , *= , /= and %= .
Example scripts
These are other scripts by PineCoders that use varip :
• Tick Delta Volume , by RicadoSantos .
• Tick Chart and Volume Info from Lower Time Frames by LonesomeTheBlue .
Thanks
Thanks to the PineCoders who helped improve this publication—especially to bmistiaen .
Look first. Then leap.


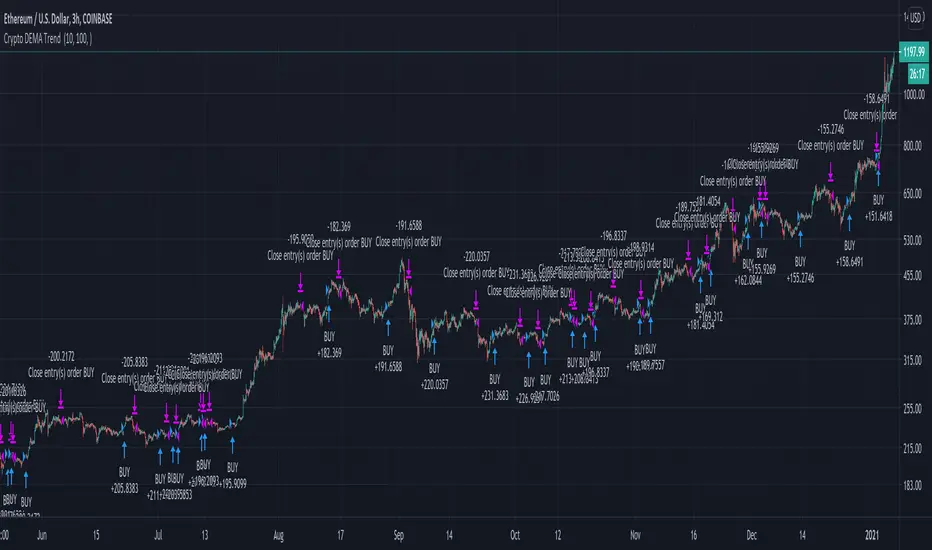
Best Crypto DEMA Strategy Long onlyThis is a crypto strategy suited for big time frames like 3h+.
THIS IS A LONG ONLY STRATEGY , SUITED TO BEAT BUY AND HOLD !
It's a very risky strategy because it has no stop loss at all, so be extremely careful with it.
This strategy is made of 2 DEMA a fast and a slow one.
We have two rules : entry it's when we have a crossunder between the slow DEMA and the fast DEMA. We exit when the opposite happens, in this case, when the slow is above fast.
For this example I used an initial capital of 1000 eur, using 100% of it always, and a commission of 0.2% per each deal.
Crypto Long only Strategy 3h+ timeframeToday I bring another crypto strategy that works greatly with pairs like BTCEUR, ETHEUR, for 3h+ time frames.
Its a risky strategy because we have a hard stop loss of 25% of our capital which can be modified.
The idea behind its simple, we have a candle which is made from open+high+low+close / 4 , and we make the decision based on this one.
We only go long with this strategy .
For entry: if we have 5 ascending candles we enter, and we exit when we have 4 descending candles.
For this example, I used 100% of the initial capital(1000 EUR/USD), with a commission of 0.1% per each deal.
At the same time, the max capital that can be lost in a trade is going to be the equity risk, in this example 25% .
Overall we can see that's more or less around the same level as buy and hold strategy

gold price levels denominated in usd/gramsPlots the gold price (USD) for the quantities (grams) identified as support or resistance in the indicator settings. Default values are:
75 gold grams
300 gold grams
500 gold grams
1000 gold grams
5000 gold grams
More context: The purchasing power of Bitcoin

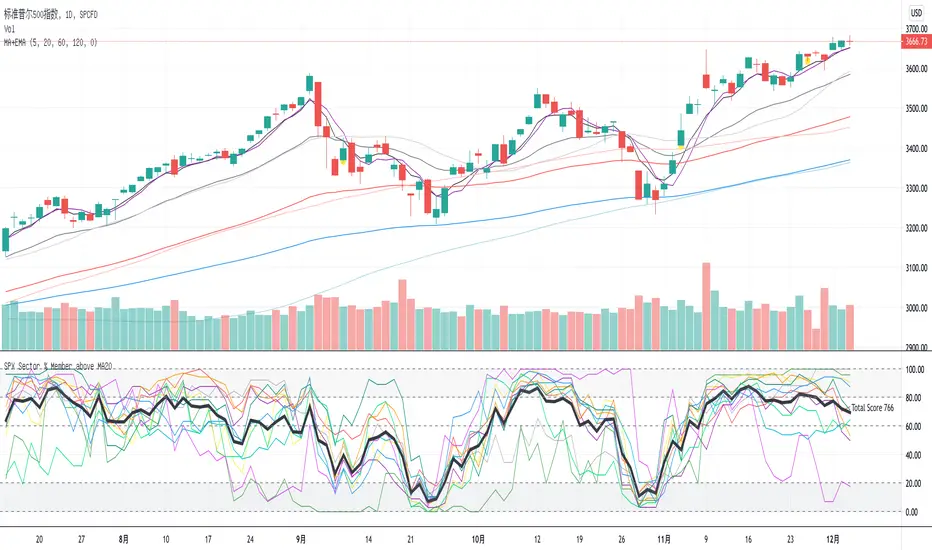
SPX Sector % Member above MA20This indicator shows the SPX sector members which are above ma20. And bold black line is the total, if it is above 1000 which means market so hot and you should sell, or if it is below 200 means you should buy.
Bollinger %B Candles StrategyStrategy built based on earlier published indicator:
Looks to be doing good for short term swing trades. But, I am not sure if there is repainting. I tried to avoid buy/sell trades on same day - but wasn't successful.
So far back-tested on following:
COINBASE:BTCUSD - works on both long and short
CURRENCYCOM:GOLD and equities - long only.
Some of the failures: ASX:WPL , ASX:WHC , ASX:NHC
As usual for back-testing - using 1000 as initial capital with 100% invested on each trade and no compounding so that it will be easy to compare with buy and hold. Trade with caution :)

AlignedMA and Cumulative HighLow Strategy V2Based on earlier strategy published - AlignedMA and Cumulative HighLow Strategy. Adjustments are done in entry and exit criteria to make it work for shares.
Modified to preserve existing entry criteria + additional MA shift condition. Exit criteria is set based on supertrend and trailing stops.
Most of the parameters are already optimized. You only need to alter SupertrendMult for individual shares based on individual share volatility. Usually works within 2-4.
There might be bit of repainting. I am unable to understand if there is any. Any suggestions on further improvements welcome :)
Note to moderators : I have used 1000 as initial capital with 100% on each trade. As strategy does not compound - I believe this is reasonable. I have kept this setting as this makes it easier to compare with buy and hold return.

STRATEGY TESTER ENGINE - ON CHART DISPLAY - PLUG & PLAYSo i had this idea while ago when @alexgrover published a script and dropped a nugget in between which replicates the result of strategy tester on chart as an indicator.
So it seemed fair to use one of his strategy to display the results.
This strategy tester can now be used in replay mode like an indicator and you can see what happen at a particular section of the chart which was is not possible in default strategy tester results of TV.
Please read how each result is calculated so you will know what you are using.
This engine shows most common results of strategy tester in a single screen, which are as follows:
1. Starting Capital
2. Current Profit Percentage
3. Max Profit Percentage
4. Gross Profit
5. Gross Loss
6. Total Closed Trades
7. Total Trades Won
8. Total Trades Lost
9. Percentage Profitable
10. Profit Factor
11. Current Drawdown
12. Max Drawdown
13. Liquidation
So elaborating on what is what:
1. Starting Capital - This stays 0, which signifies your starting balance as 0%. It is set to 0 so we can compare all other results without any change in variables. If set to 100, then all the results will be increased by 100. Some users might find it useful to set it to 100, then they can change code on line 41 from to and it should show starting balance as 100%.
2. Current Profit Percentage - This shows your current profit adjusted to current price of the candle, not like TV which shows after candle is close. There is a comment on the line 38 which can be removed and your can see unrealized profit as well in this section. Please note that this will affect Draw-down calculations later in this section.
3. Max Profit Percentage - This will show you your max profit achieved during your strategy run, which was not possible yet to see via strategy tester. So, now you can see how much profit was achieved by your strategy during the run and you can compare it with chart to see what happens during bull-run or bear-run, so you can further optimize your strategy to best suit your desired results.
4. Gross Profit - This is total percentage of profit your strategy achieved during entire run as if you never had any losses.
5. Gross Loss - This is total percentage of loss your strategy achieved during entire run as if you never had any profits.
6. Total Closed Trades - This is total number of trades that your strategy has executed so far.
7. Total Trades Won - This is the total number of trades that your strategy has executed that resulted in positive increase in equity.
8. Totals Trades Lost - This is the total number of trades that your strategy has executed that resulted in decrease in equity.
9. Percentage Profitable - This is the ratio between your current total winning trades divided by total closed trades, and finally multiplied by 100 to get percentage results.
10. Profit Factor - This is the ratio between Gross Profit and Gross Loss, so if profit factor is 2, then it indicates that you are set to gain 2 times per your risk per trade on average when total trades are executed.
11. Current Drawdown - This is important section and i want you to read this carefully. Here draw-down is calculated very differently than what TV shows. TV has access to candle data and calculates draw-down accordingly as per number of trades closed, but here DD is calculated as difference between max profit achieved and current profit. This way you can see how much percentage you are down from max peak of equity at current point in time. You can do back-test of the data and see when peak was achieved and how much your strategy did a draw-down candle by candle.
12. Max Drawdown - This is also calculated differently same as above, current draw-down. Here you can see how much max DD your strategy did from a peak profit of equity. This is not set as max profit percentage is set because you will see single number on display, while idea is to keep it custom. I will explain.
So lets say, your max DD on TV is 30%. Here this is of no use to see Max DD , as some people might want to see what was there max DD 1000 candles back or 10 candle back. So this will show you your max DD from the data you select. TV shows 25000 candle data in a chart if you go back, you can set the counter to 24999 and it will show you max DD as shown on TV, but if you want custom section to show max DD , it is now possible which was not possible before.
Also, now let's say you put DD as 24999 and open a chart of an asset that was listed 1 week ago, now on 1H chart max DD will never show up until you reach 24999 candle in data history, but with this you can now enter a manual number and see the data.
13. Liquidation - This is an interesting feature, so now when your equity balance is less than 0 and your draw-down goes to -100, it will show you where and at what point in time you got liquidated by adding a red background color in the entire section. This is the most fun part of this script, while you can only see max DD on TV.
------------------------------------------------------------------------------
How to Use -
1 word, plug and play. Yes. Actual codes start from line 33.
select overlay=false or remove it from the title in your strategy on first line,
Just copy the codes from line 33 to 103,
then go to end section of your strategy and paste the entire code from line 33 to line 103,
see if you have any duplicate variable, edit it,
Add to chart.
What you see above is very contracted view. Here is how it looks when zoomed in.
imgur.com
----------------------------------------------------------------------------------
Feel free to edit and share and use. If you use it in your scripts, drop me tag. Cheers.

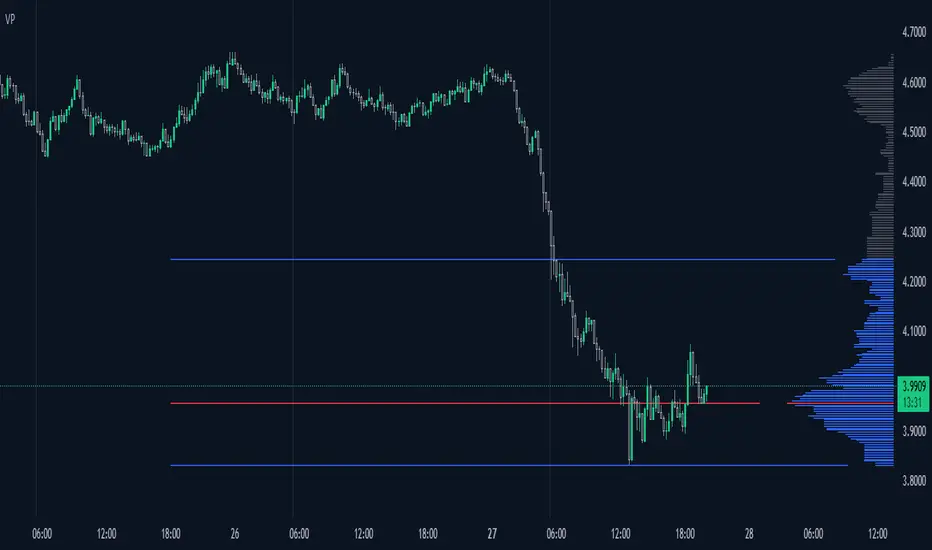
Volume ProfileThis is a Volume Profile based on pine script arrays.
The main idea behind this script is from the user @IldarAkhmetgaleev .
He created an awesome piece of code for free users on tradingview.
Here are some changes to the main script:
0. Used Pine Script Arrays for doing/storing calculations.
1. The bar labels are replaced with lines.
2. Added a POC line.
3. Bar growing directions changed from right to left.
4. Added an option to change bar width.
Inputs:
0. Volume Lookback Depth : Number of bars to look back for volume calculations.
1. Bar Length Multiplier : Bar length multiplier to make bar long or short.
2. Bar Horizontal Offset : Horizontal distance from the current bar in the right direction.
3. Bar Width : Width of the bars.
4. Show POC Line : Show or hide the POC line.
Happy trading.
SSL Backtester With ATR SL TP and Money ManagementSimilar to other SSL Channel scripts, but this one allows you to set an ATR-derived stop loss and adds the option to risk a % of the equity or used a fixed lot.
Enters upon a long or short SSL crossover.
FIXED LOTS
For 0.01 "lots" use 1000
For 1 standard lot, use 100,000
FOR MONEY MANAGEMENT
For 1% risk, enter 0.01
For 10% risk, enter 0.1
etc
You should be able to adapt this to any other indicator by just changing the entry conditions and adding your own indicator values.
It is not meant to be a profitable script, just a template to begin adding money management ideas to existing scripts which currently just enter and exit on an event.

Koala System EURUSD 15minToday I bring you one of the best systems I have found for 15min chart for EURUSD, can be adapted to other pairs aswell I suppose.
Its made of 4 SMA 3 6 9 50 and EMA 200.
It only makes 1 trade per day, in this case we have a risk % of our total eqquity, being the min 0.1 lots , can be changed tho .
We target TP/SL the same 1:1 rr, in this case I use 30 pips for both., that means I risk maximum 30$ out of a total of 1000 equity , per each trade , with 3%
Entry is simple : price is below all movings averages for sell or above for buy. At the same time we check that the ma's are in ascending or descending order.
The key here is patience, never make more than one trade per day.
System always close the trade at the end of london session. Also it only works, during the london session.
Enjoy it.

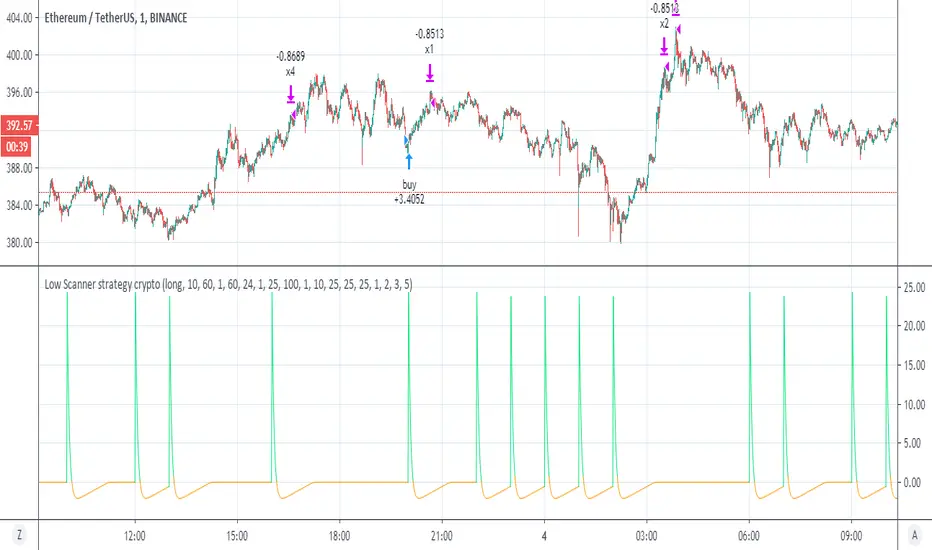
Low Scanner strategy cryptoThis is the last script of the Low scanner series
I have shown in script 1 the best strategy for stocks on 1 hour
script for forex 1 hour (if you look on comments you will find settings which are perfect for low TF (1 min system )
This strategy is the perfect weapen for crypto
no repaint as I shown the scanner do not use security
this system will buy and sell about every 1000 min in the end you will getyour profit which is progressive
set to 1,2,3, and 5 % where each time you take 25% of equaty out
as I shown before the power of the progresive take and my scanner make it best
the scnner serach for low point using my special RSI system with no repaint MTF
every time we get our profit out
the scanner will find us new low to start cycle again
so invite me for coffe if you like this system
thanks to TV that allow donation:)
so this is example of smart strategy that beat the odds
try on major crypto assets (it nice system )
without the script of adolgov
this system was not possible so I would like to thank him very much that he share with us his great script
Time Range StatisticsA good amount of users requested a text box showing various price statistics, the following script returns various of these stats in a user-selected range, and include classical ones such as a central tendency measurement (mean), dispersion (normalized range) and percent change, but also include less common statistics such as average traded volume and number of gaps. The script also calculates the correlation between the closing price and another user-selected instrument.
The script is currently the longest one I ever made and took some efforts, as I wasn't satisfied with the statistics to be originally included. Big thx to Gael for the enormous feedback and the idea of the normalized range, to user @Cookiecrush for the feedback ( without ya I would have posted something bad you know umu ? ), and Lulidolce for the support, friendship is magic!
Selected Range
The setting Start determine the bar at which the range starts, while End determine at which bar the range end. To help you select these values, the current bar number (bar index) is displayed at the right of the indicator title in blue.
The setting evaluate to last bar will use a range starting at Start and ending at the last bar, as such you can use a full range by using Start = 0 and select evaluate to last bar
The range is highlighted by an area on the chart. By default Start = 9000 and End = 10000, you might not have this amount of data in your chart, as such use the displayed bar index to select Start and End, then set the settings as default.
Displayed Statistics
The statistics panel is displayed on the right side of the last bar, the panel has 3 sections, a title section who shows the symbol ticker, timeframe, and overall trends represented by a chart emoji, the overall trends are determined by comparing the number of higher highs with the number of lower low.
Below are displayed the date ranges with time format: year/month/day/hour:minute.
The second section shows the general statistics. The first one is the mean, also represented by the orange line in the chart, the blue line displayed represent the highest price value in the range, while the red one represents the lowest price value.
The second stat is the normalized range, and determine how spread is the price in the user-selected range, why not the standard deviation? Because the standard deviation might return results varying widely depending on the scale of the closing price, you could get measures such as 0.0156 or 16 or even 56 depending on the instrument, as such using a normalized range can be more appropriate as it lays in a range of (0,1). Lower values indicate a low degree of price variation. Note that I still want to find another measure in the future.
The percentage change (or relative change) indicates at which percentage the price has increased or decreased, and is calculated by subtracting the closing at bar Start with the price at bar End , divided by the price at bar End , the result is then multiplied by 100.
The average traded volume calculate the mean of the volume in the selected range, I used the same format used by the original volume indicator for clarity.
Finally, the last stats of the section is the number of gaps, this stat is by default hidden. An up gap is detected when the open price is superior to the previous high, while a down gap is detected when the open price is inferior to the previous low, this allow to only retain significant gaps.
The last section of the indicator panel shows the correlation between the closing price and another instrument, by default GOOG, this correlation is also calculated within the user-selected range. Positive values indicate a positive relationship, that is the two instruments tend to move in the same direction. Negative values indicate a negative relationship, both instruments tend to move in a direction opposite to each other. Values closer to 1 or -1 indicate a stronger relationship, while values closer to 0 indicate no relationship.
In Summary
The script shows various stats, each calculated within a user-selected range, in general one would be more interested in how these stats might evolve with time, but checking them in a custom range can be quite interesting.
Thx for reading. umu

Volume_ATR_HistricalVolatilityCompare Volume, ATR, Historical Volatility in same axis. (percentage last 1000)

inwCoin Martingale Strategy ( for Bitcoin )** Same as my previous martingale script but this version = opensource **
inwCoin Martingale Strategy is the proof of concept strategy that in the end, anyone who using martingale strategy will kaboom their portfolio.
For those who don't know what is "martingale".. it's a simple double down strategy in the hope to cover the loss in previous entry.
Example
In the game that if you win, you'll get 100% of your bet money back.
1st loss = 1$
2nd loss = bet 2$ : if win, get 2$ / real profit = 1$ ( 2-1 )
3rd loss = bet 4$ : if win, get 4$ / real profit = 1$ ( 4 - ( 2+1) )
4th loss = bet 8$ : if win, get 8$ / real profit = 1$ ( 8 - ( 4+2+1 ) )
...
...
10th loss = bet 512$ : if win, get 512$ / real profit = 1$ ( 512 - ( 256+128+64+32+16+8+4+2+1) )
as you can see, the next bet will be first bet x 2^(n-1)
and the profit will equal to your first bet.
==================
In trading and forex EA ( Expert Advisor or bot ) people use this strategy to fool newbies that their martingale system will generate steady income for eternity.
But in reality, this strategy will destroy your whole portfolio eventually some time in the future. Because there will be some "Blackswan event" in market at some point in time. And one who ignore this fact, will lose everything.
But, if you using low risk strategy and generate some profit from your low-risk portfolio. You can take small chunk of that profit and put it in riskier strategy like this martingale, to accerelate your profit snowball.
===================
Parameter Explaination
====================
Price = datasource for indicator calculation
Fixed position size option = if uncheck, the "Start position size" parameter will be % of your initial capital. If checked, it will fixed position size ( like 1 BTC )
Start Position Logic = condition to enter first trade
- MACD singal > 0 : Self explanatory, default macd value
- Stochastic RSI cross up : enter when sto line cross up from bottom ( 20 )
- ATR channel : enter trade if price cross above 2.3 ATR
Take Profit Percent = take profit target % from average entry
Start martingale ..= if price compare to average position entry less than this %, it will start to double down ( martingale )
Martingale Multiplier = you can specific how big you'll double down, default is 2
Trade Direction = long only for now
Use date rang = self explanatory
** make sure to setup your initial capital in properties tab **
On chart
=======
White Line = Average position price
Orange Line = your current equity
If equity less than 0, it will close any remaining positions ( It's mean your position got liquidated )
If price > equity line for "take profit percent" it will close any remaining positions.
=======
As you can see, this strategy survive 2018 drop and pump profit to 1000+% ( Check in the strategy tester tab > list of trades )
But in May 2020 -50% drop in just 3 days, your whole portfolio got liquidated.
Actually, after some digging in profit and backtest result.
This strategy, when it can survive a shape drop, can generate a lot of profit.
So, if you want to use martingale. Make sure to use only small chunk of your profit from "low-risk" strategy to accelerate your profit generation ( aka degen port )
DO NOT greedy and use all of your initial capital or borrowed money to use with this strategy!

Filter Information Box - PineCoders FAQWhen designing filters it can be interesting to have information about their characteristics, which can be obtained from the set of filter coefficients (weights). The following script analyzes the impulse response of a filter in order to return the following information:
Lag
Smoothness via the Herfindahl index
Percentage Overshoot
Percentage Of Positive Weights
The script also attempts to determine the type of the analyzed filter, and will issue warnings when the filter shows signs of unwanted behavior.
DISPLAYED INFORMATION AND METHODS
The script displays one box on the chart containing two sections. The filter metrics section displays the following information:
- Lag : Measured in bars and calculated from the convolution between the filter's impulse response and a linearly increasing sequence of value 0,1,2,3... . This sequence resets when the impulse response crosses under/over 0.
- Herfindahl index : A measure of the filter's smoothness described by Valeriy Zakamulin. The Herfindahl index measures the concentration of the filter weights by summing the squared filter weights, with lower values suggesting a smoother filter. With normalized weights the minimum value of the Herfindahl index for low-pass filters is 1/N where N is the filter length.
- Percentage Overshoot : Defined as the maximum value of the filter step response, minus 1 multiplied by 100. Larger values suggest higher overshoots.
- Percentage Positive Weights : Percentage of filter weights greater than 0.
Each of these calculations is based on the filter's impulse response, with the impulse position controlled by the Impulse Position setting (its default is 1000). Make sure the number of inputs the filter uses is smaller than Impulse Position and that the number of bars on the chart is also greater than Impulse Position . In order for these metrics to be as accurate as possible, make sure the filter weights add up to 1 for low-pass and band-stop filters, and 0 for high-pass and band-pass filters.
The comments section displays information related to the type of filter analyzed. The detection algorithm is based on the metrics described above. The script can detect the following type of filters:
All-Pass
Low-Pass
High-Pass
Band-Pass
Band-Stop
It is assumed that the user is analyzing one of these types of filters. The comments box also displays various warnings. For example, a warning will be displayed when a low-pass/band-stop filter has a non-unity pass-band, and another is displayed if the filter overshoot is considered too important.
HOW TO SET THE SCRIPT UP
In order to use this script, the user must first enter the filter settings in the section provided for this purpose in the top section of the script. The filter to be analyzed must then be entered into the:
f(input)
function, where `input` is the filter's input source. By default, this function is a simple moving average of period length . Be sure to remove it.
If, for example, we wanted to analyze a Blackman filter, we would enter the following:
f(input)=>
pi = 3.14159,sum = 0.,sumw = 0.
for i = 0 to length-1
k = i/length
w = 0.42 - 0.5 * cos(2 * pi * k) + 0.08 * cos(4 * pi * k)
sumw := sumw + w
sum := sum + w*input
sum/sumw
EXAMPLES
In this section we will look at the information given by the script using various filters. The first filter we will showcase is the linearly weighted moving average (WMA) of period 9.
As we can see, its lag is 2.6667, which is indeed correct as the closed form of the lag of the WMA is equal to (period-1)/3 , which for period 9 gives (9-1)/3 which is approximately equal to 2.6667. The WMA does not have overshoots, this is shown by the the percentage overshoot value being equal to 0%. Finally, the percentage of positive weights is 100%, as the WMA does not possess negative weights.
Lets now analyze the Hull moving average of period 9. This moving average aims to provide a low-lag response.
Here we can see how the lag is way lower than that of the WMA. We can also see that the Herfindahl index is higher which indicates the WMA is smoother than the HMA. In order to reduce lag the HMA use negative weights, here 55% (as there are 45% of positive ones). The use of negative weights creates overshoots, we can see with the percentage overshoot being 26.6667%.
The WMA and HMA are both low-pass filters. In both cases the script correctly detected this information. Let's now analyze a simple high-pass filter, calculated as follows:
input - sma(input,length)
Most weights of a high-pass filters are negative, which is why the lag value is negative. This would suggest the indicator is able to predict future input values, which of course is not possible. In the case of high-pass filters, the Herfindahl index is greater than 0.5 and converges toward 1, with higher values of length . The comment box correctly detected the type of filter we were using.
Let's now test the script using the simple center of gravity bandpass filter calculated as follows:
wma(input,length) - sma(input,length)
The script correctly detected the type of filter we are using. Another type of filter that the script can detect is band-stop filters. A simple band-stop filter can be made as follows:
input - (wma(input,length) - sma(input,length))
The script correctly detect the type of filter. Like high-pass filters the Herfindahl index is greater than 0.5 and converges toward 1, with greater values of length . Finally the script can detect all-pass filters, which are filters that do not change the frequency content of the input.
WARNING COMMENTS
The script can give warning when certain filter characteristics are detected. One of them is non-unity pass-band for low-pass filters. This warning comment is displayed when the weights of the filter do not add up to 1. As an example, let's use the following function as a filter:
sum(input,length)
Here the filter pass-band has non unity, and the sum of the weights is equal to length . Therefore the script would display the following comments:
We can also see how the metrics go wild (note that no filter type is detected, as the detected filter could be of the wrong type). The comment mentioning the detection of high overshoot appears when the percentage overshoot is greater than 50%. For example if we use the following filter:
5*wma(input,length) - 4*sma(input,length)
The script would display the following comment:
We can indeed see high overshoots from the filter:
@alexgrover for PineCoders
Look first. Then leap.

Backward Number of BarsThis indicator was written in order to apply bar limit in strategies and it was published as open code so that everyone can use it. When backtesting with stock market api data, we determine how many bars should be, not from which date the data will be drawn. For example, we can draw 1000 bar data from stock exchange and perform the backtest on this data. You can plan your strategy by checking the number of bars you test with the window () == 1 parameter here while checking through Tradingview to check that the test we performed gives correct results.

Grover Llorens Activator Strategy AnalysisThe Grover Llorens Activator is a trailing stop indicator deeply inspired by the parabolic SAR indicator, and aim to provide early exit points and reversal detection. The indicator was posted not so long ago, you can find it here :
Today a strategy using the indicator is proposed, and its profitability is analyzed on 3 different markets with the main time frame being 1 hour, remember that lower time frames involve lower absolute price changes, therefore we are way more affected by the spread, and we can require a larger position sizing depending on our investment target, trading higher time-frames is always a good practice and this is why 1 hour is selected. Based on the result we might make various conclusions regarding the indicator accuracy and might have ideas on future improvements of the indicator.
I'am not great when it comes to strategy design, i still hope to share correct and useful information in this post, let me know your thoughts on the post format and if i should make more of these.
Setup And Rules
The analysis is solely based on the indicator signals, money management isn't taken into account, this allow us to have an idea on the indicator robustness and resilience, particularly on extremely volatile markets and ones exhibiting a chaotic structure, altho it is normally good practice to close any position before a market closure in order to avoid any potential major gaps.
The settings used are 480 for length and 14 for mult, this create relatively mid term signals that are suited for a trend indicator such as the Grover Llorens Activator, unfortunately we can't infer the indicator optimal settings, thats how it is with any technical indicator anyway.
Here are the rules of our strategy :
long : closing price cross over the indicator
short : closing price cross under the indicator
We use constant position sizing, once a signal is triggered all the previous positions are closed.
Description Of The Statistics Used
Various statistics are presented in this post, here is a brief description of the main ones :
Percent Profitability (higher = better): Percentage of winning trades, that is : winning trades/total number of trades × 100
Maximum Drawdown (lower = better) : The highest difference between a peak and a valley in the balance, that is : peak - valley , in percentage : (peak - valley)/peak × 100
Profit Factor (higher = better) : Gross profit divided by gross loss, values under 1 represent gross losses superior to the gross profits
Remember that more volatility = more risk, since higher absolute price changes can logically cause larger losses.
EURUSD
The first market analyzed is the Forex market with the EURUSD major pair with a position sizing of 1000 units (1 micro lot). Since October EURUSD is not showing any particular strong trend but posses a discrete rising motion, fortunately cycles can be observed.
The equity was rising until two trades appeared causing a decline in the equity. Before October a bearish market could be observed.
We can see that the equity is rising, the trend still posses various retracements that affect our indicator, however we can see that the indicator totally nail the end of the trend, thats the power of converging toward the price.
In short :
$ 86.63 net profit
340 closed trades
37.65 % profitable (thats a lot of loosing trades)
1.19 profit factor
$ 76.67 max drawdown
Applying a spread would create negative results (in general the average spread is used), not a great start...
BTCUSD
The cryptocurrency market is relatively more volatile than others, which also mean potentially higher returns, we test the indicator using certainly the most traded cryptocurrency, BTCUSD. We will use a position sizing of 1 unit.
In the case of BTCUSD the strategy balance is relatively stationary around the initial capital, with of course high dispersion.
from september to december the market is bearish with various ranging periods, no apparent cycles can be observed, except maybe in the ranging period of october, this ranging period is followed by a non linear trend (relatively parabolic) that the indicator failed to capture in its integrity (this is a recurrent problem and it is starting to piss me off xD).
In short :
$ 2010.64 net profit (aka how i bet the crypto market)
395 closed trades
38.23 % profitable
1.036 profit factor
$ 5738.01 max drawdown (aka how i lost to the crypto market)
AMD
AMD stand for Advanced Micro Devices and is a company focused on the development of computer technology, i love the microprocessor market and i really like AMD who start this year in a pretty great way with a net bullish trend.
The performance of the indicator on AMD is decent (at last !) with the equity producing many new higher highs. The indicator performance still drop in the middle end of 2019 with a large equity drawdown of 17$ caused by the gap of august 8. Unfortunately AMD, like lot of well behaving stocks can only tells us that the indicator has good performances on heavily trending markets with no excess of noise or chaotic structures.
In short :
$ 17.86 net profit (Enough for a consistent lunch)
295 closed trades
36.27 % profitable
1.414 profit factor
$ 10.37 max drawdown.
Conclusion
A strategy using the recently proposed Grover Llorens activator has been presented. We can easily conclude that the indicator can't possibly generate long term returns under chaotic and volatile markets, and could even produce unnecessary trades in trending markets without much parasitic fluctuations such as noise and retracements (think about a simple linear trend) since the indicator converge toward the price and would therefore automatically cross over/under the trend, thus guaranteeing a false signal.
However we have seen its ability to provide accurate early reversal detection shine from time to time, thus over performing lagging indicators in this aspect, however the duration of price fluctuations isn't fixed at a certain period, the rate of convergence should be way faster during volatile fluctuations, of moderate speed during more cyclic fluctuations, and really slow with apparent long term trends, this could be achieved by making the indicator adaptive, but it won't really make it necessarily perform better.
That said i still believe that converging trend indicators are really interesting and aim to capture the non lasting behavior of price fluctuations, they shouldn't receive so much hate (think about the poor p-sar).
Thanks for reading !

[fikira] MACD & RSI+Stoch + DivergencesThis is a new version of my "Divergences"
Compared to my "Divergences (Pivots)", this is calculated totally different
There are 3 options:
- MACD
- RSI
- Stoch RSI
Since this script is very heavy in calculation it is limited in time (= inspired from a script of "Che_Trader")
Also it uses "max_bars_back" (=1000)
For MACD and Stoch RSI there is a "custom Divergences Period", which compares more then 7 Pivot Points,
the higher the number, the less reliable, it is not necessary to use this, but it is there,
also you can change the "leftbars" and "rightbars", again, it is not necessary to change, but you can...
Linewidth and style of the Divergences lines can be changed
Thank you!

BEST Mayer MultipleHello traders
I'm not a HODLer by any means. I know when to sell (or I think I know....) when an asset starts going against me too much.
Even if it's a "long-term" investment.
My mentor used to telling me this: "If a short-term trade becomes a long-term investment, then you're in for a hell of a ride".
I have no clue if Bitcoin/BTC will go back up or not - I don't even care because I'm an intraday trader.
What if BTC was actually a way to accumulate more fiat? Satoshi fooled us
I coded this Mayer Multiple according to the specifications below. By the way, I'm a big fan of Willy Woo. I've been monitoring all his work since I learned about crypto (10 minutes ago.... it's a joke come on)
charts.woobull.com
Scaling
To respect the Mayer's multiple model, I recommend to select the Logarithmic scaling as shown below
imgur.com
What Mayer's model says
Using the reference below, the model says we're in the oversold zone. But, we can be in that zone for months/years...
When a model says an asset could bounce in a 1000-7000 USD range... well... I don't know how I would be able to perform optimally with that insight. This is very subjective and not a recommendation.
Mayer's Multiple model reference
All the BEST
Dave
