Stock ScreenerMissing great trade opportunities is annoying, and unless you have 12 screens or only trade one market, you are missing a lot of trades. To fix that, we created this stock screener so you get notified instantly of potential great trading conditions in real time, right on your chart.
You get notified of trading benchmarks being met by the value being displayed on the scanner as well as a color change so that it grabs your attention and makes you aware that you should take a look at the other market and look for a potential trade. It also has built in alerts so you can have an alert notification go off when any of your trading conditions are met instead of needing to watch the scanner for color changes.
The screener will change the ticker symbol background color to red green when price is above or below the previous daily range and above or below both VWAPs. This signals that the ticker is trending, which typically means it is a great time to trade that market and follow the trend.
This stock screener allows you to scan up to 10 different markets at the same time for various different conditions so you always know what is going on with your favorite trading symbols. If you want to scan more tickers, just add the indicator to your chart again and change the table position to the other side of the screen and update the tickers on the 2nd screener, allowing you to have 20 tickers at a time.
The scanner can be fully customized by changing the markets that it screens and turning on or off as many of them as you would like. You can also turn on or off any of the different data sets so that you only get information about trading conditions that matter to you.
The screener can provide data on any type of market, such as stocks, crypto, futures, forex and more. Each ticker can be adjusted to whatever market you would like it to scan for data in the settings panel, the only limitation is that it will not provide data for the VWAP and volume trend score if the ticker you are screening does not provide volume data.
Screener Features
The scanner will provide the following types of data for each ticker that is turned on:
Volume - Provides a volume score compared to the average volume and notifies you of higher than normal volume and volume spikes on individual bars by changing colors.
Volatility - Provides a volatility score compared to the average volatility and notifies you of higher than normal volatility by changing colors.
Oscillator - Choose between the RSI or CCI. The value of that oscillator will be displayed and will notify you when values are in extreme ranges such as overbought or oversold conditions according to the threshold values you enter in the settings panel. When those thresholds have been breached, you will be notified by it changing color.
Big Candles - Compares the current candle to average previous candle sizes, and changes color to notify you of big candles including a big top wick, big bottom wick, big candle body and big candle high to low range.
Daily Level Touches & Trends - Calculates and displays various daily candle and intraday open price levels that act as support and resistance. Notifies you when price is touching any of the daily levels that are turned on. The levels you can have on are as follows: previous day high, previous day low or previous day open. It also will notify you when price is touching the current day’s open, NY 930am open, Asia 8pm open, London 2am open and NY midnight 12am open. It will also say “Above” if price is above the previous day’s high or it will say “Below” if price is below the previous day’s low. The color of the cell will also change when a level touch is happening or price is above the previous day high or below the previous day low.
VWAP - Choose from 2 different VWAP lengths, default settings are daily and weekly VWAPs. You will get notified if price touches either of the VWAPs and they will also say “Above” or “Below” if price is currently above or below each VWAP.
How To Use The Screener To Help You Trade
The main purpose of the screener is to scan other markets and notify you of potential good trading opportunities such as price bouncing off of the daily levels or VWAPs. It can also be used to know when price is trending according to the VWAPs and daily levels. Lastly, you can use it to know how the volume and volatility trends are currently which gives you more confidence in taking a trade with this data when volume and volatility are present.
Volume Score
When volume is high, this represents a good time to trade because there are many market participants and price is likely to be volatile while there is high volume which can present a lot of good trade setups for you to take.
The volume score shown on the screener measures the current volume trend compared to previous volume trends and calculates that into a score based on 100 being the same as the previous volume trend. So any value above 100 means it is high volume and any value less than 100 means it is lower volume than normal.
In the settings panel, you can adjust the volume threshold that needs to be met for a volume notification to show up. The default setting is at 120, so you will get notified when the current volume trend score is 120 or higher or you can adjust that threshold value to whatever value you prefer.
It also will notify you when there is a volume spike on the current bar. This is determined by calculating an average of the recent volume totals and then checking to see if the current bar is greater than or equal to that average multiplied by 3. So if a single bar has volume that is greater than 3 times what the average volume is, then you will get a notification that says “Spike” to make you aware of that volume spike.
The volume trend threshold, volume spike multiplier and lookback length for the average volume used in volume spike calculations can all be adjusted in the settings panel to fit your desired preferences.
Volatility Score
High volatility can mean it is a great time to trade because the market is moving quickly and providing large enough movements that you can get in and out in a short amount of time, while still accruing decent sized trade PnL.
The volatility score will calculate the current volatility for each market compared to previous conditions and then divide the current volatility by the average volatility to give you a volatility score. Anything over 100 means the market is decently volatile and you should look at that market to find potential trade setups to execute on. Anything below 100 means the market is not very volatile and it is usually best to just wait until volatility returns before you start trading again.
The screener will notify you when the volatility score is above the threshold you set. The default value is set to 90, but can be adjusted to your preference. Pay attention to any market that shows an alert and take a look at that chart because the high volatility may present a good trade setup for you in the near future.
Oscillator Score
The oscillator data can be switched between Relative Strength Index(RSI) and Commodity Channel Index(CCI).
The RSI provides a value between 0 and 100 that indicates the momentum and strength of the recent price action. Many traders use the extremes of the 0-100 range to signal overbought or oversold conditions and use that as a sign to look for price to reverse in the near future. The typical values used for this and the default settings to provide notifications are: 70 for overbought and 30 for oversold. The scanner will notify you when the RSI value is considered overbought or oversold so you know to take a look at the chart and analyze if it is ready for a trade to be taken.
The CCI provides a value that can be used to determine the trend strength of the underlying asset when the oscillator moves above 100 or below -100. These extreme values are outside of the normal accumulation range and signify that price is moving strongly in that direction so it may be a good time to take a trade in the direction of the trend. The scanner will show you the value of the CCI for each market and notify you if that value is above 100 or below -100.
Both RSI and CCI settings can be adjusted in the settings panel to your desired settings so you have the exact oscillator settings you prefer to use as well as the exact values that you want to use for being notified.
Big Candles
Big candles can mean that many traders are buying or selling at the same time and many times indicate a good signal to trade in that same direction. That is why we included this calculation in the screener, so you are always aware when a large candle prints.
It calculates the average size of the recent candles and then uses that average as the benchmark to determine if the current candle is considered big and worthy of notifying you to take a look at that chart.
You can adjust the multiplier used for the big candle threshold to whatever you desire, but the default setting is 3 which means the candle will be considered big and notify you if it is 3 times as large as an average candle.
The big candles data will track the following candle values and notify you with these labels:
High to Low candle size = HL
Candle Body from open to close candle size = OC
Top Wick size = TW
Bottom Wick size = BW
Daily Level Touches & Trend
Daily level touches are excellent levels to watch for price to bounce because they often act as support and resistance levels for intraday trading. The scanner will track each market and notify you when the current candle is touching any of the daily levels that you have turned on in the settings panel.
The main levels that are turned on by default and are useful for all markets and how they will be labeled on the scanner are as follows:
Previous Day High = High
Previous Day Low = Low
Previous Day Open = < Open
Previous Day Close = Close
Current Day Open = Open
We also included some extra levels that are useful for futures traders. They are as follows:
NY 930am Open = 930am
NY 12am Midnight Open = 12am
Asia Open at 8pm NY time = Asia
London Open at 2am NY Time = London
Watch how price reacts to these levels and then trade the bounces off of these levels if the price action confirms that it is going to respect that level.
When price is currently above the previous day high, the scanner will say “Above” and show a green color, indicating a bullish trend and that price is above the previous daily candle’s high.
When price is currently below the previous day low, the scanner will say “Below” and show a red color, indicating a bearish trend and that price is below the previous daily candle’s low.
Pay attention to when price is trending above or below the previous daily candle as those trends can provide excellent trend trading opportunities.
The daily levels that you have turned on in the settings will also show as lines on the chart and include a label next to them, identifying each level so you know what each line represents. You can turn on or off all of the lines shown on the chart in the main settings or turn them off one by one in the style panel of the settings. Labels can also be turned on or off for all of the lines in the main settings panel. You can adjust the label positioning in the Label Offset section of the settings panel.
VWAP Touches & Trend
VWAP stands for volume weighted average price and is a very popular tool that traders use to determine trend direction based on volume as well as an excellent level to trade price bounces off of.
The typical VWAP time period used is Daily, which means the volume weighted average price will reset at the beginning of a new day. We set the first VWAP to be the daily VWAP by default and the second one to be the weekly VWAP. You can adjust both of the time periods to be any of the provided time lengths that you choose.
The screener will show “Above” with a green background color when price is above the VWAP, indicating a bullish trend. It will show “Below” with a red background color when price is below the VWAP, indicating a bearish trend. When both VWAPs are showing Above or Below, you can expect price to trend in that direction, so look for pullbacks you can trade in the direction of the trend. If the VWAPs are showing different directions, then you should expect to bounce back and forth between the VWAPs, but be careful and watch out for price to break beyond either one and start a trend.
When the current candle is touching the VWAP, the scanner will change colors and say VWAP to notify you that price is touching the VWAP and you should look at that chart and analyze the market for a potential bounce off of the VWAP to trade.
Trending Market Signals
Strong trends are excellent markets to trade and can many times provide excellent trading opportunities that don’t require expert price action reading skills to be able to take winning trades from. That is why we included a signal to notify you of a strong trending market.
The strong trending market will show up as a green or red background color for the ticker name. If the color of the ticker name is green, it is notifying you that the price is above the previous daily high, above VWAP 1 and above VWAP 2 and is a good market to look for bullish trend trades. If the color of the ticker name is red, it is notifying you that the price is below the previous daily low, below VWAP 1 and below VWAP 2 and is a good market to look for bearish trend trades.
Changing The Tickers It Scans
To change the tickers that the indicator scans, scroll near the bottom of the settings panel and select the ticker symbol you want to update and then search for the exact symbol you want to use. If you want to scan less tickers, then just turn some of the tickers off that you don’t need.
Scanning More Than 10 Tickers
If you want to scan more than 10 tickers, you can add the scanner to your chart again and then just change the table position to the other side of the screen. This will allow you to scan 10 more tickers that will show up separately. Then if you want even more, just add the indicator to your chart again and update the table position until you have as many markets as you want. The table position setting can be found at the bottom of the main settings panel.
Alerts
The screener has alerts that can be used to notify you when any of the data set thresholds have been met or if price is touching one of the levels. You can set alerts for the following events:
Bullish Trend Alert - Price is above the previous daily high and above both VWAPs.
Bearish Trend Alert - Price is below the previous daily low and below both VWAPs.
High Volume Alert - Volume is higher than the threshold or a volume spike is detected.
High Volatility Alert - Volatility is higher than the threshold.
Oscillator Is Extended Alert - Oscillator value has exceeded the upper or lower threshold.
Big Candle Alert - A big candle has been detected.
Daily Level Touch Alert - One of the daily levels that is turned on is being touched.
VWAP Touch Alert - One of the 2 VWAPs are being touched.
An alert will trigger when any one of tickers on your scanner meets the alert conditions, so when you see the alert, you will need to go to your chart and look at the scanner to see which ticker it was and then navigate to that chart to look for potential trade setups.
The alerts will use the exact same settings you have configured in the settings panel to send you alert notifications. With normal settings, this could give you a lot of alerts, so if you only want alerts to fire when abnormal conditions are being met, try setting up a second screener on your chart that has very high threshold values and only has the most important level touches on. Then turn the setting "Do Not Show The Screener On The Chart" to off so the calculations will still run and fire alerts, but won't clog up your charts. This way you can only get alert notifications when major events happen but still have your normal screener settings available on your chart.
Markets This Can Be Used On
This screener uses the price action and volume data so you can use it to scan any type of market you would like as long as the ticker you are scanning has price and volume data feeds. If a market does not have volume data, then it will just show NaN in the volume row and the VWAP rows will not show anything.
Scanner

Daily Trend Scanner Plus█ DAILY TREND SCANNER PLUS
A professional-grade trading indicator designed to help traders quickly identify intraday trend bias across multiple symbols by tracking price relationships to key technical levels: Prior Day High/Low (PDH/PDL) and Pre-Market High/Low (PMH/PML).
█ FEATURES
► Single Symbol Table
Compact 5-column table displaying PDH, PMH, PDL, PML, and Trend status for the current chart symbol. Shows green dot (🟢) when price breaks above high levels and red dot (🔴) when price breaks below low levels. Progress bars visualize how close price is to breaking key levels.
► Multi Symbol Table
Monitor up to 20 tickers simultaneously in a single table. Each row displays ticker name, price, change %, breakout dots, progress bars, and trend status. Optional columns for actual PMH/PML and PDH/PDL price values. Real-time updates for all symbols with color-coded change percentages.
► Table Sorting
- None - Displays tickers in input order
- Chg % - Sorts by daily change percentage (highest to lowest)
- Bullish - Prioritizes bullish setups at top
- Bearish - Prioritizes bearish setups at top
► PMH/PML Lines (Pre-Market High/Low)
Horizontal lines at pre-market high and low levels (4:00 AM - 9:29 AM ET). Customizable line styles, colors, labels, and optional price display.
► PDH/PDL Lines (Prior Day High/Low)
Horizontal lines at previous trading day's high and low. Uses RTH only for stocks (9:30 AM - 4:00 PM ET) and full 24-hour day for non equities.
► ORB Lines (Opening Range Breakout)
Captures high and low during the opening period with 5-minute, 10-minute, or 30-minute options. Lines persist from market open until next pre-market session.
► EMA Overlays
Three independent EMAs with customizable periods (default: 8, 20, 200). Third EMA can be switched to SMA. Multiple line styles available.
► VWAP Overlay
Volume Weighted Average Price with customizable line style, width, and color.
█ TREND LOGIC
- BULLISH: Price above BOTH Prior Day High AND Pre-Market High
Indicates strong upward momentum breaking through two resistance levels
- BEARISH: Price below BOTH Prior Day Low AND Pre-Market Low
Indicates strong downward momentum breaking through two support levels
- NEUTRAL: Price not above both highs or below both lows
Price is consolidating between key levels
█ PROGRESS BARS
Visual 5-block meter showing progress from midpoint toward target level:
▓▓▓▓▓ (80-100%) → ▓▓▓▓▒ (60-80%) → ▓▓▓▒▒ (40-60%) → ▓▓▒▒▒ (20-40%) → ▓▒▒▒▒ (0-20%)
Replaced with 🟢 or 🔴 when level is actually broken.
█ ASSET TYPE HANDLING
STOCKS:
- Pre-Market: 4:00 AM - 9:29 AM Eastern
- Prior Day: RTH only (9:30 AM - 4:00 PM Eastern)
NON-EQUITIES:
- Prior Day: Full 24-hour trading day
- Automatically detected via symbol type
█ RECOMMENDED SETTINGS
- Chart Timeframe: 10-minute recommended for multi-table accuracy
- Timeframes 60 minutes or less required for ORB functionality
- Enable extended hours on chart for accurate PMH/PML on stocks
█ USAGE TIPS
- Use Bullish sort to find strongest breakout candidates for long trades
- Use Bearish sort to find weakest stocks for short/put candidates
- Progress bars help anticipate upcoming breakouts before they happen
- Combine with ORB lines to confirm trend direction after market open
- Watch for alignment: Price above all key levels = strongest bullish signal
- PDH/PDL breaks often signal continuation of prior day's trend
- PMH/PML breaks can indicate gap-fill or trend reversal setups
█ INDICATOR SETTINGS
█ EXAMPLE OF FULL MULTI TABLE AND SINGLE TABLE
█ MULTI-TABLE SORTING
█ PMH/PML, PDH/PDL, ORB LINES
█ EMA AND VWAP OVERLAYS
█ CUSTOMIZATION

Multi Asset & Multi Timeframe Trend DashboardOverview
The Multi-Asset & Multi-Timeframe Trend Dashboard is a comprehensive visual data terminal designed to provide a bird's-eye view of market sentiment across five different assets and seven distinct timeframes simultaneously. By consolidating 10 core technical indicators into a single table, it eliminates the need for "chart hopping" and helps traders identify high-probability trend alignment.
How It Works
The dashboard evaluates each asset based on a Scoring System ($-10$ to $+10$). For every timeframe, the script analyzes the following 10 conditions:
Trend: EMA 20 > EMA 50Macro
Trend: EMA 50 > EMA 200
Position: Price > EMA 200
MACD: MACD Line > Signal Line
MACD Momentum: MACD Histogram > 0
RSI Momentum: RSI(14) > RSI SMA(14)
RSI Level: RSI(14) > 50
Stochastics: Stoch K > D
CCI: Commodity Channel Index > 0
Awesome Oscillator: AO > 0
Visual Logic & Features
Indicator Dots (■): Represent the 10 individual technical conditions. Green indicates a bullish state; Red indicates a bearish state.
Trend Arrows (▲/▼): Displays the aggregate directional bias of a timeframe based on the sum of the 10 dots.
Neutral State (✖): If indicators are split 50/50 (Score of 0), a grey cross is displayed to indicate total market indecision.
"ALL" Column: A macro-summary that aggregates scores across all four primary timeframes.
Volatility Marker (•): A dot appearing next to the symbol name indicates that current ATR is higher than the historical average (user-defined threshold).
Market Status Color: The symbol name background turns Green if the market is currently open and active, and Red if it is closed or stagnant.
Technical Implementation
This script utilizes request.security calls to fetch data across timeframes. To ensure performance and prevent repainting issues, all security calls are handled using the barstate.islast flag to only render the dashboard on the most recent bar.
How to Use
Alignment Trading: Look for "Full House" scenarios where all arrows (15m through Daily) are the same color.
Scalping Bias: Use the "Mini Timeframes" (1m, 3m, 5m) to find entries that align with the higher timeframe trend shown in the main table.
Volatility Filter: Only take trades when the volatility marker (•) is active to ensure there is enough "power" in the move.

Photon Price Action Scanner [JOAT]Photon Price Action Scanner - Multi-Pattern Recognition with Adaptive Filtering
Introduction and Purpose
Photon Price Action Scanner is an open-source overlay indicator that automates the detection of 15+ candlestick patterns while filtering them through multiple confirmation layers. The core problem this indicator solves is pattern noise: raw candlestick pattern detection produces too many signals, most of which fail because they lack context. This indicator addresses that by combining pattern recognition with trend alignment, volume-weighted strength scoring, velocity confirmation, and an adaptive neural bias filter.
The combination of these components is not arbitrary. Each filter addresses a specific weakness in standalone pattern detection:
Trend alignment ensures patterns appear in favorable market structure
Volume-weighted strength filters out weak patterns with low conviction
Velocity confirmation identifies momentum behind the pattern
Neural bias filter adapts to recent price behavior to avoid counter-trend signals
What Makes This Indicator Original
While candlestick pattern scanners exist, this indicator's originality comes from:
1. Multi-Layer Filtering System - Patterns must pass through trend, strength, velocity, and neural bias filters before generating signals. This dramatically reduces false positives compared to simple pattern detection.
2. Adaptive Neural Bias Filter - A custom momentum-adjusted EMA that learns from recent price action using a configurable learning rate. This is not a standard moving average but an adaptive filter that accelerates during trends and smooths during consolidation.
3. Pattern Strength Scoring - Each pattern receives a strength score based on volume ratio and body size, allowing traders to focus on high-conviction setups rather than every pattern occurrence.
4. Smart Cooldown System - Prevents signal overlap by enforcing minimum bar spacing between pattern labels, keeping charts clean even when "Show All Patterns" is enabled.
How the Components Work Together
Step 1: Pattern Detection
The indicator scans for 15 candlestick patterns using precise mathematical definitions:
// Example: Bullish Engulfing requires the current bullish candle to completely
// engulf the previous bearish candle with a larger body
isBullishEngulfing() =>
bool pattern = close < open and close > open and
open <= close and close >= open and
close - open > open - close
pattern
// Example: Three White Soldiers requires three consecutive bullish candles
// with each opening within the previous body and closing higher
isThreeWhiteSoldiers() =>
bool pattern = close > open and close > open and close > open and
close < close and close < close and
open > open and open < close and
open > open and open < close
pattern
Step 2: Strength Calculation
Each detected pattern receives a strength score combining volume and body size:
float volRatio = avgVolume > 0 ? volume / avgVolume : 1.0
float bodySize = math.abs(close - open) / close
float baseStrength = (volRatio + bodySize * 100) / 2
This ensures patterns with above-average volume and large bodies score higher than weak patterns on low volume.
Step 3: Trend Alignment
Patterns are checked against the trend direction using an EMA:
float trendEMA = ta.ema(close, i_trendPeriod)
int trendDir = close > trendEMA ? 1 : close < trendEMA ? -1 : 0
Bullish patterns in uptrends and bearish patterns in downtrends receive priority.
Step 4: Neural Bias Filter
The adaptive filter uses a momentum-adjusted EMA that responds to price changes:
neuralEMA(series float src, simple int period, simple float lr) =>
var float neuralValue = na
var float momentum = 0.0
if na(neuralValue)
neuralValue := src
float error = src - neuralValue
float adjustment = error * lr
momentum := momentum * 0.9 + adjustment * 0.1
neuralValue := neuralValue + adjustment + momentum
neuralValue
The learning rate (lr) controls how quickly the filter adapts. Higher values make it more responsive; lower values make it smoother.
Step 5: Velocity Confirmation
Price velocity (rate of change) must exceed the average velocity for strong signals:
float velocity = ta.roc(close, i_trendPeriod)
float avgVelocity = ta.sma(velocity, i_trendPeriod)
bool velocityBull = velocity > avgVelocity * 1.5
Step 6: Signal Classification
Signals are classified based on how many filters they pass:
Strong Pattern : Pattern + strength threshold + trend alignment + neural bias + velocity
Ultra Pattern : Strong pattern + gap in same direction + velocity confirmation
Watch Pattern : Pattern detected but not all filters passed
Detected Patterns
Classic Reversal Patterns:
Bullish/Bearish Engulfing - Complete body engulfment with larger body
Hammer - Long lower wick (2x body), small upper wick, bullish context
Shooting Star - Long upper wick (2x body), small lower wick, bearish context
Morning Star - Three-bar bullish reversal with small middle body
Evening Star - Three-bar bearish reversal with small middle body
Piercing Line - Bullish candle closing above midpoint of previous bearish candle
Dark Cloud Cover - Bearish candle closing below midpoint of previous bullish candle
Bullish/Bearish Harami - Small body contained within previous larger body
Doji - Body less than 10% of total range (indecision)
Advanced Patterns (Optional):
Three White Soldiers - Three consecutive bullish candles with rising closes
Three Black Crows - Three consecutive bearish candles with falling closes
Tweezer Top - Equal highs with reversal candle structure
Tweezer Bottom - Equal lows with reversal candle structure
Island Reversal - Gap isolation creating reversal structure
Dashboard Information
The dashboard displays real-time analysis:
Pattern - Current detected pattern name or "SCANNING..."
Bull/Bear Strength - Volume-weighted strength scores
Trend - UPTREND, DOWNTREND, or SIDEWAYS based on EMA
RSI - 14-period RSI for momentum context
Momentum - 10-period momentum reading
Volatility - ATR as percentage of price
Neural Bias - BULLISH, BEARISH, or NEUTRAL from adaptive filter
Action - ULTRA BUY/SELL, BUY/SELL, WATCH BUY/SELL, or WAIT
Visual Elements
Pattern Labels - Abbreviated codes (BE=Engulfing, H=Hammer, MS=Morning Star, etc.)
Neural Bias Line - Adaptive trend line showing filter direction
Gap Boxes - Cyan boxes highlighting price gaps
Action Zones - Dashed boxes around strong pattern areas
Velocity Markers - Small circles when velocity confirms direction
Ultra Signals - Large labels for highest conviction setups
How to Use This Indicator
For Reversal Trading:
1. Wait for a pattern to appear at a key support/resistance level
2. Check that the Action shows "BUY" or "SELL" (not just "WATCH")
3. Confirm the Neural Bias aligns with your trade direction
4. Use the strength score to gauge conviction (higher is better)
For Trend Continuation:
1. Identify the trend using the Trend row in the dashboard
2. Look for patterns that align with the trend (bullish patterns in uptrends)
3. Ultra signals indicate the strongest continuation setups
For Filtering Noise:
1. Keep "Show All Patterns" disabled to see only filtered signals
2. Increase "Pattern Strength Filter" to see fewer, higher-quality patterns
3. Enable "Velocity Confirmation" to require momentum behind patterns
Input Parameters
Scan Sensitivity (1.0) - Overall detection sensitivity multiplier
Pattern Strength Filter (3) - Minimum strength score for strong signals
Trend Period (20) - EMA period for trend determination
Show All Patterns (false) - Display all patterns regardless of filters
Advanced Patterns (true) - Enable soldiers/crows/tweezer detection
Gap Analysis (true) - Enable gap detection and boxes
Velocity Confirmation (true) - Require velocity for strong signals
Neural Bias Filter (true) - Enable adaptive trend filter
Neural Period (50) - Lookback for neural bias calculation
Neural Learning Rate (0.12) - Adaptation speed (0.01-0.5)
Timeframe Recommendations
1H-4H: Best balance of signal frequency and reliability
Daily: Fewer but more significant patterns
15m-30m: More signals, requires tighter filtering (increase strength threshold)
Limitations
Pattern detection is mechanical and does not consider fundamental context
Neural bias filter may lag during rapid trend reversals
Gap detection requires clean price data without after-hours gaps
Strength scoring favors high-volume patterns, which may miss valid low-volume setups
- Made with passion by officialjackofalltrades

Predictive Analysis Engine — Adaptive MACD Forecasting with R² SProfessional and Rule-Compliant Description (Ready for Publishing)
This description explains every component of the script in detail, highlights its originality, and provides traders with clear usage instructions — exactly what TradingView expects.
Predictive Analysis Engine (PAE)
This script is a predictive analysis model that combines trend filtering, linear forecasting, stability analysis (R²), and outlier filtering using ATR to produce an advanced, leading-style version of MACD rather than a traditional lagging one.
The indicator does not rely on random elements; it is built on four core components that work together:
1. Stability Measurement Using R²
The coefficient of determination (R²) is calculated based on the correlation between price and time, then normalized to a 0–1 scale.
A higher R² indicates more stable price movement, allowing the script to increase forecast accuracy.
Here, R² acts as a primary component of the Confidence Filter.
2. Forecasted Price Using Linear Regression
Instead of relying solely on the current price, the script uses:
Linear Regression
Weighted blending between the forecasted price and actual price
This enables the script to build a Leading MACD based on an “advanced” price that anticipates probable movement.
3. Advanced MACD With Adaptive Smoothing
MACD is applied to the blended (real + forecasted) price using:
Fast EMA
Slow EMA
MACD base
Optional TEMA for reducing signal lag
Adjustable histogram smoothing
This process makes MACD more responsive with significantly less lag, reacting faster to predicted movements.
4. Predictive MACD (Projected MACD)
Linear Regression is applied again — but this time to:
MACD
Signal
Histogram
to generate projected versions of each line (proj_macd, proj_signal), while proj_hist is used to produce early signals before the actual crossover occurs.
5. Volatility Filtering Using ATR & Volatility Ratio
ATR is used to evaluate:
Strength of movement
Overextension levels
Signal quality
ATR is combined with R² to compute:
Confidence = R² × Volatility Ratio
This suppresses weak signals and boosts high-quality, reliable ones.
6. Predictive Signals + Safety Filters
A signal is triggered when:
proj_hist crosses the 0 level
Confidence exceeds the required threshold
The real histogram is not excessively stretched (extra safety)
The script includes:
BUY / SELL
BUY_STRONG / SELL_STRONG
based on the smoothed histogram trend.
7. Coloring, Background & Visual Enhancements
The script colors:
The histogram
Chart background
Signal lines
to clearly highlight momentum direction and confidence conditions.
8. Built-In Alerts
The script provides ready-to-use alerts:
BUY Alert
SELL Alert
Both based on the predictive MACD model.
How to Use the Script
Add it to any timeframe and any market.
BUY/SELL signals are generated from the projected histogram crossover.
Higher Confidence = stronger signal.
Background colors help visualize trend transitions instantly.
Recommended to combine with support/resistance or price action.
Indicator Objective
This script is designed to deliver early insight into momentum shifts using a blend of:
Linear forecasting
Trend stability via R²
Signal quality filtering via ATR
A fast and adaptive advanced MACD

MTF Checklist DashboardMTF Checklist Dashboard
Overview
The MTF Checklist Dashboard is an advanced multi-timeframe analysis tool that provides traders with a comprehensive visual dashboard to analyze market conditions across six customizable timeframes simultaneously. This indicator combines multiple technical analysis methods, including Opening Range Breakouts (ORB), VWAP, EMAs, and daily price levels, to generate high-probability confluence-based trading signals.
Unlike traditional single-timeframe indicators, this dashboard displays all critical information in one organized table, allowing traders to instantly identify when multiple timeframes align for optimal entry and exit opportunities.
Key Features
Multi-Timeframe Analysis
Analyzes up to 6 timeframes simultaneously (default: 1m, 5m, 15m, 30m, 1h, 4h)
Fully customizable timeframe selection via comma-separated input
Color-coded cells for instant visual recognition (green=bullish, red=bearish, yellow=neutral)
Technical Indicators Tracked
Current and previous candle direction
Opening Range Breakout (ORB) positioning with custom period
VWAP relationship (above/below)
200 EMA positioning
Daily and previous day high/low proximity
EMA crossovers (9 vs 21, both vs 200)
Advanced Signal Filtering System
Confluence scoring: Requires multiple timeframes to align (3-6 timeframes)
Higher timeframe confirmation: Ensures 30m/1h/4h agreement
Volume filter: Confirms signals with above-average volume (1.5x default)
ATR volatility filter: Validates sufficient market movement
Session timing: Restricts signals to optimal trading hours (EST)
Momentum confirmation: Requires recent directional strength
Range positioning: Blocks signals near daily extremes
Candle strength: Validates strong directional candles (60%+ body ratio)
Visual Signals
Optional entry arrows (above/below bars)
Background color highlighting
Organized dashboard with real-time price levels
ORB range, current day, and previous day summary rows
Alert Conditions
JSON-formatted alerts for automated trading integration
Separate alerts for long entry, short entry, long exit, and short exit
Compatible with webhook automation systems
How To Use
Dashboard Interpretation
The dashboard displays a color-coded table with the following columns:
TF: Timeframe being analyzed
C: Current candle (Green=bullish, Red=bearish)
P: Previous candle (Green=bullish, Red=bearish)
ORB: Opening Range Breakout position (A=Above, B=Below, W=Within)
VWAP: Price vs VWAP (A=Above, B=Below)
E200: Price vs 200 EMA (A=Above, B=Below)
D Hi/Lo: Proximity to current day high/low (Hi/Lo/Mid)
PD Hi/Lo: Proximity to previous day high/low (Hi/Lo/Mid)
9 vs 21: EMA 9 vs EMA 21 relationship (A=9 above 21, B=9 below 21)
9&21 v200: Both EMAs vs 200 EMA (>>=both above, <<=both below, <>=mixed)
Signal Generation
Long Entry Signal triggers when:
Minimum number of timeframes show bullish alignment (default: 5 of 6)
Higher timeframes (30m/1h/4h) confirm direction (default: 2 of 3)
Price breaks above ORB high with sufficient distance
Volume exceeds average by specified multiplier
ATR shows adequate volatility
Trade occurs during optimal session hours
Recent momentum is upward
Price not too close to daily high
Strong bullish candle forms
Short Entry Signal uses opposite conditions
Exit Signals trigger when opposing timeframe confluence reaches threshold (default: 3 timeframes)
Recommended Workflow
Select your asset and primary trading timeframe
Observe the dashboard - Look for rows showing mostly green (bullish) or red (bearish)
Wait for alignment - The indicator will show arrows when confluence requirements are met
Check the bottom rows - Review ORB levels and daily ranges for context
Set alerts - Enable TradingView alerts using the built-in alert conditions
Manage risk - Use appropriate position sizing and stop losses based on ORB range or daily ATR
Settings Guide
Basic Settings
Timeframes: Enter comma-separated values (e.g., "1,5,15,30,60,240")
Show Header: Toggle column headers on/off
ORB Minutes: Set opening range period (default: 15 minutes)
Near % for daily highs/lows: Define proximity threshold (default: 0.20%)
Use close for comparisons: Compare using close vs current price
Dashboard Position: Choose from 9 screen positions
Confluence Filters
Minimum Timeframes Aligned: Set required confluence (3-6, default: 5)
Require Higher Timeframe Confirmation: Toggle HTF requirement on/off
Min Higher Timeframes: Specify HTF agreement needed (1-3, default: 2)
Volume Filter
Volume Confirmation: Enable/disable volume filtering
Volume vs Average: Set multiplier threshold (default: 1.5x)
Volume Average Length: Period for volume average (default: 20 bars)
Volatility Filter (ATR)
Volatility Filter: Enable/disable ATR confirmation
ATR Length: Calculation period (default: 14)
Min ATR vs Average: Required ATR level (default: 0.5x = 50%)
ORB Filters
ORB Breakout Distance Required: Toggle distance requirement
Min Breakout % Beyond ORB: Additional breakout threshold (default: 0.10%)
Session Filter
Trade Only During Best Hours: Enable time-based filtering
Session 1: First trading window (default: 0930-1130 EST)
Session 2: Second trading window (default: 1400-1530 EST)
Momentum Filter
Recent Momentum Required: Enable directional momentum check
Lookback Bars: Period for momentum comparison (default: 3 bars)
Daily Range Filter
Block Signals Near Daily Extremes: Prevent entries at extremes
Distance from High/Low %: Minimum distance required (default: 2.0%)
Candle Filter
Strong Directional Candle: Require candle strength
Min Candle Body %: Body-to-range ratio threshold (default: 60%)
Visual Signals
Show Entry Signals: Master toggle for visual signals
Show Arrows: Display entry arrows on chart
Background Color: Enable background highlighting
Best Practices
Start with default settings and adjust based on your trading style and asset volatility
Higher confluence requirements (5-6 timeframes) produce fewer but higher-quality signals
Enable all filters for conservative trading; disable some for more frequent signals
Use the dashboard as confirmation alongside your existing trading strategy
Backtest on your specific instruments before live trading
Consider market conditions—trending vs ranging markets may require different settings
Alerts
This indicator includes four alert conditions with JSON formatting for webhook integration:
Long Entry Signal: Triggers when all long conditions are met
Short Entry Signal: Triggers when all short conditions are met
Long Exit Signal: Triggers when opposing confluence reaches exit threshold
Short Exit Signal: Triggers when opposing confluence reaches exit threshold
Alert messages include ticker symbol, action (buy/sell), price, and quantity for automated trading systems.
Important Notes
This indicator works best on liquid instruments with clear price action
Highly volatile markets may require adjusted ATR and ORB distance settings
Session times are in EST timezone—adjust if trading non-US markets
The ORB calculation requires sufficient price history for the day
Signals are generated in real-time but should be confirmed at candle close
Limitations
Maximum of 6 timeframes can be analyzed due to TradingView's security call limits
ORB calculations may not work correctly on instruments with gaps or irregular sessions
The indicator is most effective during regular market hours when volume and volatility are adequate
Lower timeframes (1m, 5m) may produce more false signals in choppy conditions
License
Mozilla Public License 2.0 (MPL-2.0)
This indicator is licensed under the Mozilla Public License 2.0. You are free to use, modify, and distribute this code under the terms of the MPL-2.0. The full license text is available at mozilla.org
Key license provisions:
You may use this code commercially
You may modify and distribute modified versions
Modified versions must be released under the same license
You must include the original license notice in any distributions
No trademark rights are granted
Disclaimer
This indicator is provided for educational and informational purposes only. It is not financial advice, and past performance does not guarantee future results. Trading involves substantial risk of loss. Always:
Practice proper risk management
Test thoroughly on paper/demo accounts before live trading
Use appropriate position sizing
Never risk more than you can afford to lose
Consult with a financial advisor for personalized advice
The creator assumes no liability for trading losses incurred using this indicator.
Version: 2.0
Pine Script Version: v6
Author: © EliasVictor

Breakout ScannerThis is a Breakout Scanner that shows you the immediate trend across 4 higher timeframes for up to 10 different tickers. It calculates a score from 1 to 3 for bullish and -1 to -3 for bearish based on where price is currently at compared to the previous higher timeframe’s candle levels.
When price is breaking out of the previous higher timeframe candle’s range, then it will have a score of 3 for bullish breakout or -3 for bearish breakout. When price is above the high or below the low of multiple different higher timeframe candles, you can expect price to continue the breakout and move to a new area of price range.
The brighter red or green the color is, the stronger the trend is on that timeframe. When it shows a bright green or red box on the far right side of a ticker, it is notifying you that the ticker is bullish or bearish on all timeframes and trending strongly, so switch over to that chart and look to trade in the direction of that trend.
The tickers, colors and time frames can be customized to suit your preference and you can also turn off as many tickers or time frames as you’d like if you want less tickers or time frames to show up on the indicator. It also includes alerts for when all timeframes are bullish or all timeframes are bearish for one ticker.
Make sure to keep each timeframe set to a timeframe that is higher than your chart timeframe.
Bullish Scoring & Colors
If the current candle close is above the midline of the higher time frame candle, it is given a score of 1 and a dark green background. If the current candle close is above the higher timeframe candle body, then it is given a score of 2 and a medium green background. If the current candle close is above the high of the higher time frame candle, it is given a score of 3 and a bright green background.
The higher the score the stronger the bullish trend and the brighter green the color will be.
Bearish Scoring & Colors
If the current candle close is below the midline of the higher timeframe candle, it is given a score of -1 and a dark red background. If the current candle close is below the higher timeframe candle body, then it is given a score of -2 and a medium red background. If the current candle close is below the low of the higher timeframe candle, it is given a score of -3 and a bright red background.
The lower the score, the stronger the bearish trend and the brighter red the color will be.
Total Score Display
On the right side of the indicator table, there is a column that displays the total score by adding all the scores together so you can easily tell the overall strength of the trend across all timeframes. Wait for the trend score to be at least 75% of the possible score to trade so you can ensure you are only trading very strong trends and increase your probability of winning your trade. The total score will update according to how many time frames you have enabled in the settings. You can also turn on or off the total score count if you prefer. The default setting is off.
All Timeframe Trends Agree
When all of the timeframes that you have turned on are in the same direction at the same time, a green or red box will appear on the far right side of the scanner. This is a visual cue that lets you know the strongest trending markets without having to read any of the numbers. Make sure to check out the charts for the markets that have a green or red box on the far right side and look for potential trend trading opportunities.
Alerts
You can set alerts for when all time frames for a certain ticker are bullish or bearish. If you have some time frames turned off at the time of creating your alerts, then it will only require all time frames that are on to be all bullish or bearish to generate an alert. Make sure to set your alerts to once per bar close to ensure you don’t get premature alerts that aren’t yet valid.
Best Way To Use The Scanner
For best results, make sure you wait for the trend to show all bullish or all bearish at the same time and then look to trade in the direction of the strong trend. If you can be patient enough to do that, you will increase the probability of winning your trade because you are trading with the direction of the overall higher timeframe trend when the market is trending strongly and making new highs or lows.
When one of the markets in the scanner shows all timeframes trending, go to that chart and see how price action is reacting to the previous higher timeframe candle levels. You can see those levels easily by adding our Higher Timeframe Candle Levels indicator to your chart and using the same timeframes as your Breakout Scanner is using.
If price is holding the higher timeframe candle levels well, then look to place trades in the direction of the trend that the Breakout Scanner is showing.
Other Indicators To Pair This With
Use this in combination with our Higher Timeframe Candle Levels indicator so you can see all of these levels being used to calculate the trend strength scores and watch how price reacts to those levels. You should also use our Trend Strength Indicator to easily read the historical trends of price compared to the higher timeframes and use those trends to guide you on when to trade and which direction to trade.
Trend Strength Indicator, Higher Timeframe Candle Levels and the Breakout Scanner all use the same levels to calculate the trend scores so they are designed to work all together to help you quickly be able to read a chart and find what direction to trade in.

PDB 4 MA + Candle Strength/Weakness Detector
4MA Strength & Reversal Detector
Unlock the power of momentum with this advanced 4 Moving Average system (20, 50, 100, 200) designed to pinpoint market strength and early reversal zones with precision.
How It Works:
- Bearish Reversal: Triggered when all moving averages align (20 < 50 < 100 < 200) and bearish reversal candles appear — highlighting potential tops.
- Bullish Reversal: Triggered when all moving averages align (200 < 100 < 50 < 20) and bullish reversal candles form — marking potential bottoms
:Best For:
⚡ Scalpers and day traders using 1–5 minute timeframes
📈 Identifying momentum shifts and trend exhaustion early
Tip: Combine this with volume or RSI for stronger confirmation and fewer false signals.

Ichimoku Screener [Pineify]Advanced Multi-Timeframe Ichimoku Screener - Complete Market Analysis Tool
This sophisticated Ichimoku Screener represents a comprehensive approach to multi-timeframe market analysis, combining four distinct Ichimoku-based indicators into a unified screening system. Unlike traditional single-symbol indicators, this screener provides simultaneous analysis across multiple assets and timeframes, enabling traders to identify optimal trading opportunities with enhanced precision and efficiency.
Key Features
Multi-asset screening capability for up to 10 symbols simultaneously
Four customizable timeframes per symbol for comprehensive analysis
Four integrated Ichimoku-based indicators working in harmony
Real-time visual feedback with color-coded signals
Customizable Ichimoku parameters for personalized analysis
Clean, organized table display for easy interpretation
Automated signal strength assessment and timing
How It Works
The screener employs the traditional Ichimoku Kinko Hyo methodology, utilizing five core components: Conversion Line (Tenkan-sen), Base Line (Kijun-sen), Leading Span A (Senkou Span A), Leading Span B (Senkou Span B), and displacement calculations. Each component is mathematically calculated using specific period lengths:
Conversion Line = (Highest High + Lowest Low) / 2 over conversion period
Base Line = (Highest High + Lowest Low) / 2 over base period
Leading Span A = (Conversion Line + Base Line) / 2
Leading Span B = (Highest High + Lowest Low) / 2 over lagging span period
The screener processes these calculations across multiple securities simultaneously using TradingView's security() function, enabling real-time cross-asset analysis. The system tracks state changes using barssince() functions to provide precise timing information for each signal type.
Trading Ideas and Insights
This screener excels in identifying momentum convergence patterns where multiple Ichimoku components align across different timeframes. The most powerful signals occur when:
Cloud color aligns with price position relative to the cloud
Conversion Line crosses above/below Base Line in the same direction as cloud bias
Multiple timeframes show consistent directional bias
Entry signals appear with minimal bars since formation (indicating fresh momentum)
For trend following strategies , focus on symbols where the cloud maintains consistent color across higher timeframes while showing recent entry signals on lower timeframes. For reversal opportunities , identify assets where cloud color changes coincide with price re-entering the cloud after extended periods above or below.
The screener particularly excels in cryptocurrency and forex markets where momentum shifts can be dramatic and sustained. By monitoring multiple timeframes simultaneously, traders can identify when short-term signals align with longer-term trends, significantly improving trade success probability.
How Multiple Indicators Work Together
The four integrated indicators create a comprehensive analytical framework through synergistic interaction:
Ichimoku Cloud (IchiCld) establishes the primary trend bias by comparing Leading Span A with Leading Span B. When Span A > Span B, the cloud displays bullish characteristics; when Span A < Span B, bearish characteristics emerge. The indicator tracks duration since the last cloud color change, providing momentum persistence insight.
Ichimoku Lagging Cloud (IchiLagCld) determines price position relative to the displaced cloud formation. This indicator identifies whether current price action occurs above, below, or within the cloud structure, revealing support/resistance dynamics and trend confirmation signals.
Conversion vs Base (IchiC>Base) monitors the relationship between short-term (Conversion Line) and medium-term (Base Line) momentum. Crossovers in this relationship often precede significant price movements and provide early trend change warnings.
Ichimoku Entry (IchiEnt) synthesizes all components into actionable signals by requiring alignment between cloud bias, price position, and conversion/base relationship. This multi-factor confirmation approach significantly reduces false signals while maintaining sensitivity to genuine momentum shifts.
The mathematical foundation ensures that each indicator contributes unique information while maintaining logical consistency. The system's strength lies in requiring multiple confirmations before generating entry signals, following Ichimoku's original philosophy of comprehensive market analysis.
Unique Aspects
This implementation distinguishes itself through several innovative features:
Advanced State Tracking : Unlike standard Ichimoku indicators that show current values, this screener tracks duration since state changes , providing crucial timing information for signal freshness and momentum strength assessment.
Multi-Asset Efficiency : The screener eliminates the need to manually check multiple charts by presenting comparative analysis across assets and timeframes in a single view, dramatically improving analytical efficiency.
Customizable Visual Feedback : The color-coding system adapts to different signal types and strengths, with recent signals receiving enhanced visual prominence to draw attention to fresh opportunities.
Professional Table Architecture : The organized display accommodates up to 40 symbol-timeframe combinations (10 symbols × 4 timeframes), with intelligent pagination for optimal screen utilization.
Signal Correlation Analysis : By displaying multiple timeframes for each symbol, traders can quickly identify timeframe confluence and divergence patterns that would otherwise require extensive manual analysis.
How to Use
Symbol Configuration : Enter up to 10 symbols in the Symbol input group. Use full exchange:ticker format for optimal compatibility (e.g., "BINANCE:BTCUSDT").
Timeframe Selection : Configure four timeframes in ascending order for logical analysis progression. Recommended combinations include 1m/5m/15m/1h for intraday analysis or 1h/4h/1D/1W for swing trading.
Ichimoku Parameters : Adjust the four core parameters based on your trading style:
Conversion Line Length (default: 9) - Controls short-term momentum sensitivity
Base Line Length (default: 26) - Determines medium-term trend identification
Leading Span B Length (default: 52) - Sets long-term trend calculation period
Displacement (default: 26) - Controls forward projection of cloud structure
Signal Interpretation :
Green backgrounds indicate bullish conditions
Red backgrounds indicate bearish conditions
Numerical values show bars since last state change
"L:" prefix indicates long entry signals
"S:" prefix indicates short entry signals
"N/A" indicates neutral/transitional states
Trading Workflow : Scan for symbols showing consistent signals across multiple timeframes, prioritize fresh signals (low bar counts), and use individual charts for precise entry timing and risk management.
Customization
The screener accommodates various trading approaches through parameter adjustment:
Scalping Configuration : Use shorter periods (Conversion: 5, Base: 13, Span B: 26) with 1m/3m/5m/15m timeframes for high-frequency opportunities.
Swing Trading Setup : Employ standard parameters with 4h/1D/3D/1W timeframes for position trading across days or weeks.
Cryptocurrency Optimization : Given crypto's 24/7 nature, consider using 4h/8h/1D/3D combinations for optimal signal timing.
Symbol selection can focus on correlated assets (e.g., major cryptocurrencies) for sector analysis or diverse assets for portfolio opportunity identification. The flexible timeframe configuration allows adaptation to any market's characteristic volatility and trading patterns.
Conclusion
This Advanced Multi-Timeframe Ichimoku Screener transforms traditional single-chart analysis into a comprehensive market monitoring system. By integrating multiple Ichimoku components across various timeframes and assets, it provides traders with unprecedented analytical efficiency and signal reliability.
The mathematical rigor of traditional Ichimoku analysis combines with modern Pine Script capabilities to deliver a professional-grade screening tool. Whether used for identifying trend continuation opportunities, spotting potential reversals, or conducting broad market analysis, this screener offers the analytical depth and practical functionality required for serious trading applications.
The system's emphasis on signal confluence across multiple timeframes and indicators significantly improves trade selection quality while reducing analysis time. For traders seeking to leverage Ichimoku's proven methodology across multiple markets simultaneously, this screener represents an essential analytical upgrade to traditional single-symbol approaches.

Stockbee ComboBullCustom indicator for identifying stocks that meet the ComboBull criteria. This can be used as a standalone indicator or use it to screen for stocks in Pine Screener.

Crypto Scanner v4This guide explains a version 6 Pine Script that scans a user-provided list of cryptocurrency tokens to identify high probability tradable opportunities using several technical indicators. The script combines trend, momentum, and volume-based analyses to generate potential buying or selling signals, and it displays the results in a neatly formatted table with alerts for trading setups. Below is a detailed walkthrough of the script’s design, how traders can interpret its outputs, and recommendations for optimizing indicator inputs across different timeframes.
## Overview and Key Components
The script is designed to help traders assess multiple tokens by calculating several indicators for each one. The key components include:
- **Input Settings:**
- A comma-separated list of symbols to scan.
- Adjustable parameters for technical indicators such as ADX, RSI, MFI, and a custom Wave Trend indicator.
- Options to enable alerts and set update frequencies.
- **Indicator Calculations:**
- **ADX (Average Directional Index):** Measures trend strength. A value above the provided threshold indicates a strong trend, which is essential for validating momentum before entering a trade.
- **RSI (Relative Strength Index):** Helps determine overbought or oversold conditions. When the RSI is below the oversold level, it may present a buying opportunity, while an overbought condition (not explicitly part of this setup) could suggest selling.
- **MFI (Money Flow Index):** Similar in concept to RSI but incorporates volume, thus assessing buying and selling pressure. Values below the designated oversold threshold indicate potential undervaluation.
- **Wave Trend:** A custom indicator that calculates two components (WT1 and WT2); a crossover where WT1 moves from below to above WT2 (particularly near oversold levels) may signal a reversal and a potential entry point.
- **Scanning and Trading Zone:**
- The script identifies a *bullish setup* when the following conditions are met for a token:
- ADX exceeds the threshold (strong trend).
- Both RSI and MFI are below their oversold levels (indicating potential buying opportunities).
- A Wave Trend crossover confirms near-term reversal dynamics.
- A *trading zone* condition is also defined by specific ranges for ADX, RSI, MFI, and a limited difference between WT1 and WT2. This zone suggests that the token might be in a consolidation phase where even small moves may be significant.
- **Alerts and Table Reporting:**
- A table is generated, with each row corresponding to a token. The table contains columns for the symbol, ADX, RSI, MFI, WT1, WT2, and the trading zone status.
- Visual cues—such as different background colors—highlight tokens with a bullish setup or that are within the trading zone.
- Alerts are issued based on the detection of a bullish setup or entry into a trading zone. These alerts are limited per bar to avoid flooding the trader with notifications.
## How to Interpret the Indicator Outputs
Traders should use the indicator values as guidance, verifying them against their own analysis before making any trading decision. Here’s how to assess each output:
- **ADX:**
- **High values (above threshold):** Indicate strong trends. If other indicators confirm an oversold condition, a trader may consider a long position for a corrective reversal.
- **Low values:** Suggest that the market is not trending strongly, and caution should be taken when considering entry.
- **RSI and MFI:**
- **Below oversold levels:** These conditions are traditionally seen as signals that an asset is undervalued, potentially triggering a bounce.
- **Above typical resistance levels (not explicitly used here):** Would normally caution a trader against entering a long position.
- **Wave Trend (WT1 and WT2):**
- A crossover where WT1 moves upward above WT2 in an oversold environment can signal the beginning of a recovery or reversal, thereby reinforcing buy signals.
- **Trading Zone:**
- Being “in zone” means that the asset’s current values for ADX, RSI, MFI, and the closeness of the Wave Trend lines indicate a period of consolidation. This scenario might be suitable for both short-term scalping or as an early exit indicator, depending on further market analysis.
## Timeframe Optimization Input Table
Traders can optimize indicator inputs depending on the timeframe they use. The following table provides a set of recommended input values for various timeframes. These values are suggestions and should be adjusted based on market conditions and individual trading styles.
Timeframe ADX RSI MFI ADX RSI MFI WT Channel WT Average
5-min 10 10 10 20 30 20 7 15
15-min 12 12 12 22 30 20 9 18
1-hour 14 14 14 25 30 20 10 21
4-hour 16 16 16 27 30 20 12 24
1-day 18 18 18 30 30 20 14 28
Adjust these parameters directly in the script’s input settings to match the selected timeframe. For shorter timeframes (e.g., 5-min or 15-min), the shorter lengths help filter high-frequency noise. For longer timeframes (e.g., 1-day), longer input values may reduce false signals and capture more significant trends.
## Best Practices and Usage Tips
- **Token Limit:**
- Limit the number of tokens scanned to 10 per query line. If you need to scan more tokens, initiate a new query line. This helps manage screen real estate and ensures the table remains legible.
- **Confirming Signals:**
- Use this script as a starting point for identifying high potential trades. Each indicator’s output should be used to confirm your trading decision. Always cross-reference with additional technical analysis tools or market context.
- **Regular Review:**
- Since the script updates the table every few bars (as defined by the update frequency), review the table and alerts regularly. Market conditions change rapidly, so timely decisions are crucial.
## Conclusion
This Pine Script provides a comprehensive approach for scanning multiple cryptocurrencies using a combination of trend strength (ADX), momentum (RSI and MFI), and reversal signals (Wave Trend). By using the provided recommendation table for different timeframes and limiting the tokens to 20 per query line (with a maximum of four query lines), traders can streamline their scanning process and more effectively identify high probability tradable tokens. Ultimately, the outputs should be critically evaluated and combined with additional market research before executing any trades.

Swing Structure Scanner [LuxAlgo]The Swing Structure Scanner Indicator is a dashboard type indicator which displays a Consolidated "High/Low-Only" view of swing structure, with the capability to retrieve and display swing points from up to 6 different tickers and timeframes at once.
🔶 USAGE
This indicator displays swing structure data from up to 6 unique tickers or timeframes; Each graph represents the current swing structure retrieved from the requested chart/s.
Each swing graph displays the current live swing point positioning relative to the previous swing points. By analyzing the different formations, patterns can more easily be recognized and found across multiple tickers or timeframes at once.
This indicator serves as a nifty tool for confluence recognition, whether that's confluence throughout market tickers, or confluence through higher timeframes on the same ticker.
Alternatively, viewing the relative positioning of each swing point to each other, should give a clearer idea when higher lows or lower highs are formed. This can potentially indicate a newly forming trend, as well as serving as a warning to watch for breakouts.
The swing length can be changed to align with each individual's strategy, as well as a display look back can be adjusted to show more or less swing points at one time.
The display is fairly customizable, it is not fixed to 6 symbols at all times and can be minimized to only display the number of symbols needed; Additionally, the display can be set to vertical mode or horizontal(default) to utilize as needed.
Note: Hover over the swing point in the dashboard to get a readout of the exact price level of the swing point.
🔶 SETTINGS
Swing Length: Set the swing length for the structure calculations.
Swing Display Lookback: Sets the number of swing points (Pairs) to display in each Swing Graph display.
Symbols: Sets the Timeframe and Symbol for each Swing Graph.
Vertical Display: Display the Swing Graphs up and down, rather than side to side.
Scaling Factor: Scales the entire indicator up or down, to fit your needs.

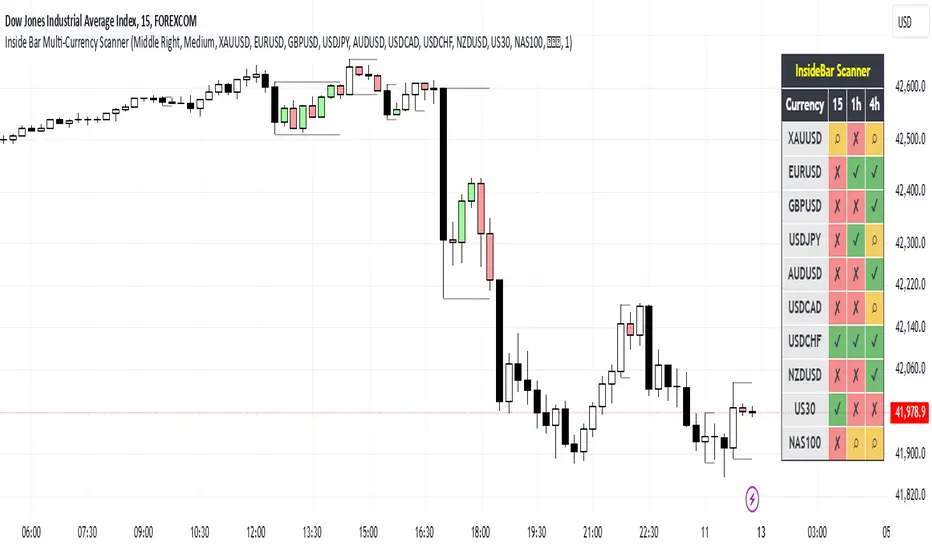
Inside Bar Multi-Currency ScannerDescription:
This script is an Inside Bar Scanner that allows you to monitor multiple currency pairs across different timeframes (15 minutes, 1 hour, and 4 hours). Its main features include:
Inside Bar Detection:
An Inside Bar is a candlestick where both the High and Low are within the range of the previous candle.
The script automatically identifies Inside Bars and displays the results in a table.
Customizable Timeframes:
Supports scanning in 15-minute, 1-hour, and 4-hour timeframes.
Results are displayed for each timeframe separately.
Multi-Currency Support:
Scan up to 10 currency pairs simultaneously.
Currency pairs are customizable and selected by the user.
Candle Coloring:
Inside Bars are highlighted with colors:
Semi-transparent green for bullish Inside Bars.
Semi-transparent red for bearish Inside Bars.
Colors are customizable and selected by the user.
Alerts:
Custom alerts for detecting Inside Bars in selected timeframes.
Receive notifications when an Inside Bar is detected in any of the selected currency pairs.
How to Use:
Select your desired currency pairs from the Scanner Currencies section.
Enable your preferred timeframes in the Scanner Timeframe section.
The script will display a table of results with Inside Bar information for each currency pair and timeframe.
Optionally, customize the candle colors in the Scanner InsideBar Color section.
Additional Explanation for Timeframe Status:
In each selected timeframe, there are three possible states for the candles:
Previous Candle is an Inside Bar:
Displayed with a green background and the symbol ✔.
Previous Candle is NOT an Inside Bar:
Displayed with a red background and the symbol ✘.
Current Candle is an Inside Bar:
Displayed with an orange background and the symbol ⌕.
These visual indicators provide a clear and quick overview of the Inside Bar status for each selected currency pair and timeframe.
Crypto Arbitrage Scanner [CryptoSea]Crypto Arbitrage Scanner
The Crypto Arbitrage Scanner is an advanced tool designed to help traders identify arbitrage opportunities across multiple cryptocurrency exchanges. With the ability to compare prices, volumes, and differences in price, this indicator is a must-have for any trader seeking to exploit cross-exchange inefficiencies in real time.
Key Features
Multi-Exchange Price and Volume Comparison: Tracks data from multiple major cryptocurrency exchanges, including BINANCE, COINBASE, KUCOIN, and others, allowing traders to easily compare prices and volume across platforms.
Customizable Difference Metrics: Allows users to toggle between displaying price differences in percentages or absolute dollar values, depending on the preferred metric for arbitrage analysis.
Sorting and Filtering Options: Includes user-defined sorting options to order the data by Price, Volume, or Difference, helping to prioritize potential arbitrage opportunities based on the trader's chosen criteria.
Difference and Volume Thresholds: Users can specify the minimum volume and price difference thresholds, ensuring that only significant arbitrage opportunities are highlighted.
Real-Time Alerts: Built-in alert conditions notify users when arbitrage opportunities exceed their defined price difference thresholds, helping traders respond instantly to market movements.
The Crypto Arb Scanner displays a table of prices, volumes, and price differences across selected exchanges. Each exchange is listed along with the current close price, volume, and the difference in price compared to the average price across all exchanges. Highlighting is used to indicate significant differences that may present arbitrage opportunities.
In the example below, we can see a highlighted opportunity in green showing that the price is below the user inputed thresold.
How it Works
Data Collection: Gathers real-time volume and price data from various exchanges using a streamlined process, allowing for a detailed comparison.
Average Price Calculation: Computes the average price across all valid exchanges to identify where price discrepancies occur, providing a clear picture of arbitrage potential.
Sorting Mechanism: Utilizes custom sorting based on user preferences, making it easy to quickly analyze and identify key opportunities.
Dynamic Highlighting and Alerts: Price differences that exceed user-defined thresholds are highlighted, and alerts can be triggered for these arbitrage opportunities, allowing for a timely response.
Application
Arbitrage Trading: The Crypto Arb Scanner is ideal for traders looking to exploit price differences across exchanges, enabling efficient arbitrage opportunities.
Market Efficiency Analysis: Offers insights into the consistency of prices across exchanges, which can help gauge the efficiency and liquidity of the markets being traded.
Customizable Alerts: Set alerts based on price differences or volume, allowing traders to stay informed about changes without constantly monitoring the markets.
The Crypto Arbitrage Scanner is a powerful addition to any trader's toolkit, offering comprehensive features to detect arbitrage opportunities with confidence. With real-time monitoring, customizable metrics, and a user-friendly interface, this tool allows traders to make informed decisions and capitalize on inefficiencies across exchanges.

EMA Distance Scanner with Multi-TimeframesThis indicator was created for personal use because I wanted to see, within the five-minute time frame, what is happening with the 15-minute, 1 hour, and 4 hour EMA9 and EMA200.
When the number is green, we are above the EMA value, and when it is red, we are below it. This also helps to get a clearer picture of the short- and long-term trends. When the number is close, within 0.00-0.01%, it turns blue, indicating a potential support level. You can also change the EMA values to your preference in the settings.
Hopefully, this will be helpful for you as well.

COMET_Scanner_Library_FINALLibrary "COMET_Scanner_Library"
- A Trader's Edge (ATE)_Library was created to assist in constructing COM Scanners
TickerIDs(_string)
TickerIDs: You must form this single tickerID input string exactly as described in the scripts info panel (little gray 'i' that
is circled at the end of the settings in the settings/input panel that you can hover your cursor over this 'i' to read the
details of that particular input). IF the string is formed correctly then it will break up this single string parameter into
a total of 40 separate strings which will be all of the tickerIDs that the script is using in your COM Scanner.
Parameters:
_string (simple string) : (string)
A maximum of 40 Tickers (ALL joined as 1 string for the input parameter) that is formulated EXACTLY as described
within the tooltips of the TickerID inputs in my COM Scanner scripts:
assets = input.text_area(tIDs, title="TickerIDs (MUST READ TOOLTIP)", group=g2, tooltip="Accepts 40 TICKERID's
for each copy of the script on the chart. *** MUST FORMAT THIS WAY *** Each FULL tickerID
(ie 'Exchange:ticker') must be separated by A SINGLE BLANK SPACE for correct formatting. The blank space tells
the script where to break off the ticker to assign it to a variable to be used later in the script. So this input
will be a single string constructed from up to 40 tickerID's with a space between each tickerID
(ie. 'BINANCE:BTCUSDT BINANCE:SXPUSDT BINANCE:XRPUSDT').", display=display.none)
Returns: Returns 40 output variables in the tuple (ie. between the ' ') with the separated TickerIDs,
Locations(_firstLocation)
Locations: This function is used when there's a desire to print an assets ALERT LABELS. A set Location on the scale is assigned to each asset.
This is created so that if a lot of alerts are triggered, they will stay relatively visible and not overlap each other.
If you set your '_firstLocation' parameter as 1, since there are a max of 40 assets that can be scanned, the 1st asset's location
is assigned the value in the '_firstLocation' parameter, the 2nd asset's location is the (1st asset's location+1)...and so on.
Parameters:
_firstLocation (simple int) : (simple int)
Optional (starts at 1 if no parameter added).
Location that you want the first asset to print its label if is triggered to do so.
ie. loc2=loc1+1, loc3=loc2+1, etc.
Returns: Returns 40 variables for the locations for alert labels
LabelSize(_barCnt, _lblSzRfrnce)
INVALID TICKERIDs: This is to add a table in the middle right of your chart that prints all the TickerID's that were either not formulated
correctly in the '_source' input or that is not a valid symbol and should be changed.
LABEL SIZES: This function sizes your Alert Trigger Labels according to the amount of Printed Bars the chart has printed within
a set time period, while also keeping in mind the smallest relative reference size you input in the 'lblSzRfrnceInput'
parameter of this function. A HIGHER % of Printed Bars(aka...more trades occurring for that asset on the exchange),
the LARGER the Name Label will print, potentially showing you the better opportunities on the exchange to avoid
exchange manipulation liquidations.
*** SHOULD NOT be used as size of labels that are your asset Name Labels next to each asset's Line Plot...
if your COM Scanner includes these as you want these to be the same size for every asset so the larger ones dont cover the
smaller ones if the plots are all close to each other ***
Parameters:
_barCnt (float) : (float)
Get the 1st variable('barCnt') from the Security function's tuple and input it as this functions 1st input
parameter which will directly affect the size of the 2nd output variable ('alertTrigLabel') that is also outputted by this function.
_lblSzRfrnce (string) : (string)
Optional (if parameter not included, it defaults to size.small). This will be the size of the variable outputted
by this function named 'assetNameLabel' BUT also affects the size of the output variable 'alertTrigLabel' as it uses this parameter's size
as the smallest size for 'alertTrigLabel' then uses the '_barCnt' parameter to determine the next sizes up depending on the "_barCnt" value.
Returns: ( )
Returns 2 variables:
1st output variable ('AssetNameLabel') is assigned to the size of the 'lblSzRfrnceInput' parameter.
2nd output variable('alertTrigLabel') can be of variying sizes depending on the 'barCnt' parameter...BUT the smallest
size possible for the 2nd output variable ('alertTrigLabel') will be the size set in the 'lblSzRfrnceInput' parameter.
InvalidTickerIDs(_close, _securityTickerid, _invalidArray, _tablePosition, _stackVertical)
Parameters:
_close (float)
_securityTickerid (string)
_invalidArray (array)
_tablePosition (simple string)
_stackVertical (simple bool)
PrintedBarCount(_time, _barCntLength, _barCntPercentMin)
The Printed BarCount Filter looks back a User Defined amount of minutes and calculates the % of bars that have printed
out of the TOTAL amount of bars that COULD HAVE been printed within the same amount of time.
Parameters:
_time (int) : (int)
The time associated with the chart of the particular asset that is being screened at that point.
_barCntLength (int) : (int)
The amount of time (IN MINUTES) that you want the logic to look back at to calculate the % of bars that have actually
printed in the span of time you input into this parameter.
_barCntPercentMin (int) : (int)
The minimum % of Printed Bars of the asset being screened has to be GREATER than the value set in this parameter
for the output variable 'bc_gtg' to be true.
Returns: ( )
Returns 2 outputs:
1st is the % of Printed Bars that have printed within the within the span of time you input in the '_barCntLength' parameter.
2nd is true/false according to if the Printed BarCount % is above the threshold that you input into the '_barCntPercentMin' parameter.

Multi Asset Histogram [ChartPrime]Multi Asset Histogram Indicator
Overview:
The "Multi Asset Histogram" indicator provides a comprehensive visualization of the performance of multiple assets relative to each other. By calculating a score for each asset and displaying it in a histogram format, this indicator helps traders quickly identify the trends, dominant asset and the average performance of the assets in the selected group.
Key Features:
◆ Multi-Asset Score Calculation:
The indicator calculates a trend score for each selected asset based on the price source (e.g., hl2).
The trend score is determined by comparing the current price to the prices over the past bars back defined by user, adding or subtracting points based on whether the current price is higher or lower than previous prices.
// Score Function
trscore(src) =>
total = 0.0
for i = 1 to 50
total += (src >= nz(src ) ? 1 : -1)
total
◆ Flexible Symbol Input:
Traders can input up to 10 different symbols (e.g., BTCUSD, ETHUSD, etc.) to be included in the histogram analysis.
◆ Dynamic Visualization:
A histogram is plotted for each asset, with bars colored based on the score, providing a clear visual representation of the relative performance.
Color gradients from red to aqua indicate the performance, with red representing negative scores and aqua representing positive scores.
◆ Adaptive Histogram Lines:
The width and placement of histogram lines adapt based on the calculated scores, ensuring clear visualization regardless of the values.
Dashed lines represent the mean score of all assets, helping traders identify the overall market trend.
◆Detailed Labels and Values:
Labels are placed on the histogram to display the exact score for each asset.
Mean value and zero line labels provide additional context for the overall performance.
◆ Visual Scaling Lines:
Zero line and mean line are clearly marked, helping traders understand the distribution and scale of scores.
Scales on the left and right of the histogram indicate the performance range.
◆ Informative Table:
A table is displayed on the chart, showing the dominant asset (the one with the highest score) and the mean score of all assets.
The table updates dynamically to reflect real-time changes in asset performance.
◆ Settings:
Length: The value of number bars back is greater or less than the current value of the source
Source: The price source to be used for score calculation (e.g., hl2).
Symbols: Up to 10 different asset symbols can be input for analysis.
Usage Notes:
This indicator is useful for traders who monitor multiple assets simultaneously and need a quick visual reference to identify the strongest and weakest performers.
The color coding and dynamic labels make it easy to interpret the relative performance and make informed trading decisions.
This indicator is designed to enhance multi-asset analysis by providing a clear, visual representation of each asset's performance relative to the others, making it easier to identify trends and dominant assets in the market.
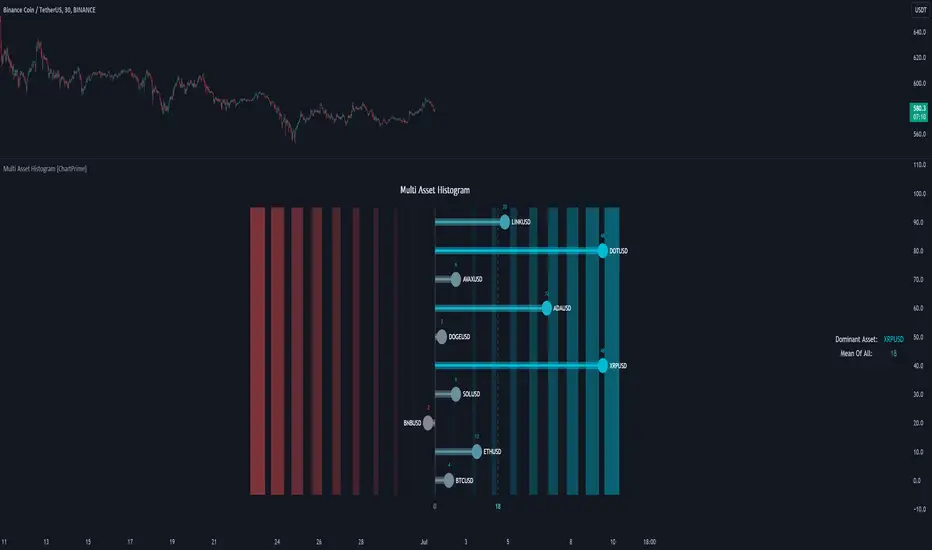
MTF Supertrend [CryptoSea]The MTF Supertrend Indicator is a versatile tool crafted to enhance trend analysis across multiple timeframes. Leveraging the reliable Supertrend formula, it provides traders with a comprehensive view of market trends and potential reversal points.
Key Features
Multi Timeframe Analysis: Tracks Supertrend signals over a variety of timeframes, offering a broad perspective on market direction.
Percentage Threshold Display: Filters out Supertrend data that is not within a specified percentage of the current price, keeping the display focused on relevant trends.
Adaptive Visual Display: Features a dynamic table that shows the current Supertrend status, which is fully customizable to the user's display preferences.
Customizable Sensitivity: Users can fine-tune the factor and ATR period settings, allowing for personalized trend sensitivity.
How it Works
Supertrend Calculation: Computes the Supertrend using the Average True Range (ATR) multiplied by a customizable factor, detecting changes in volatility and trend.
Higher Timeframe Filtering: Prioritizes higher timeframe trends over the current chart's timeframe to avoid chart clutter and focus on the most significant trends.
Colour-Coded Trends: Utilizes colour coding to clearly indicate bullish and bearish trends, aiding quick visual analysis.
Responsive Display Options: Includes a switchable table view to overlay trend information on the chart, with options for dark and light themes.
Benefits for Different Trading Styles
Day Traders: Use real-time updates to catch short-term trend reversals and ride the momentum for quick profits.
Swing Traders: Benefit from viewing medium to long-term trends to formulate strategies that span several days or weeks.
Position Traders: Utilize the monthly supertrend data to make long-term investment decisions based on prevailing market directions.
Application
Strategic Decision-Making: Assists traders in making informed decisions by providing a layered view of trend directions across timeframes.
Trend Confirmation: Reinforces trading strategies by confirming trends with higher timeframe Supertrend alignment.
Customized Analysis: Adapts to various trading styles with input settings that control the display and sensitivity of trend data.
The MTF Supertrend Indicator by is a powerful addition to the trader's toolkit, enhancing multi-timeframe trend analysis and contributing to a strategic trading approach in volatile markets.
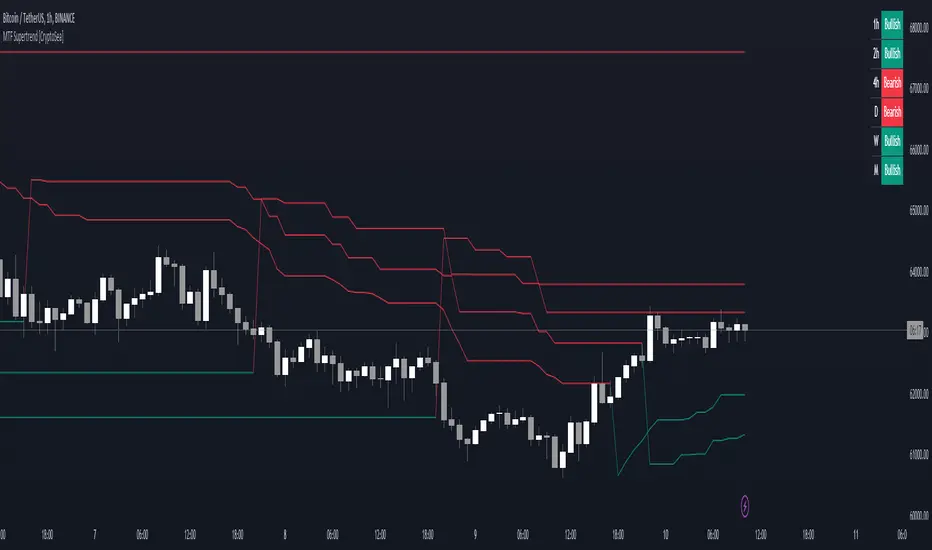
ATH Distance HeatmapThe "ATH Distance Heatmap" is a powerful visualization tool designed for traders and investors who seek to quickly assess the relative performance of assets against their All-Time Highs (ATH). By mapping the percentage distance of current prices from their historical peaks, this script provides a unique perspective on market sentiment, potential recovery opportunities, and overvaluation risks.
Key Features:
Visual Clarity: Utilize a color-coded heatmap to instantly recognize which assets are near or far from their ATHs. Colors transition smoothly from cool to warm tones, indicating smaller to larger distances respectively.
Real-Time Updates: The script updates dynamically with live market data, ensuring you have the most current information at your fingertips.
Versatile Application: Whether you're tracking stocks, cryptocurrencies, commodities, or indices, the "ATH Distance Heatmap" adapts to a wide array of assets, making it a versatile tool for your trading arsenal.
Insightful Analysis: Beyond mere visualization, this tool can help identify potential buying opportunities in assets that are significantly below their ATHs, or highlight caution for those nearing their peaks.
How to Use:
Configure Your Assets: Start by selecting the assets you wish to track. The script can be customized to monitor a broad market range or a specific segment.
Interpret the Colors: Use the color gradient to gauge the distance of each asset from its ATH. Cooler colors indicate assets closer to their ATH, while warmer colors highlight those further away.
Ideal for:
Traders looking for a quick visual guide to market trends and asset performance.
Investors aiming to capitalize on recovery opportunities or to evaluate entry and exit points.
Market analysts interested in a concise overview of asset health relative to historical performance.

Relative Strength Scatter Plot [LuxAlgo]The Relative Strength Scatter Plot indicator is a tool that shows the historical performance of various user-selected securities against a selected benchmark.
This tool is inspired by Relative Rotation Graphs®. Relative Rotation Graphs® is a registered trademark of JOOS Holdings B.V. This script is neither endorsed, nor sponsored, nor affiliated with them.
🔶 USAGE
This tool depicts a simple scatter plot using the relative strength ratio as the X-axis and its momentum as the Y-axis of the user-selected symbols against the selected benchmark.
The graph is divided into four quadrants, and the interpretation of the graph is done depending on where a point is situated on the graph:
A point in the green quadrant would indicate that the security is leading the benchmark in strength, with positive strength momentum.
A point in the yellow quadrant would indicate that the security is leading the benchmark in strength, with negative strength momentum.
A point in the blue quadrant would indicate that the security is lagging behind the benchmark in strength, with positive strength momentum.
A point in the red quadrant would indicate that the security is lagging behind the benchmark in strength, with negative strength momentum.
The trail of each symbol allows the user to see the evolution of the relative strength momentum relative to the relative strength ratio. The length of the trail can be controlled by the "Trail Length" setting.
🔶 DETAILS
Our relative strength ratio estimate is first obtained from the relative strength between the symbol of interest and the benchmark, the result is then smoothed using a linearly weighted moving average (wma). This result is then normalized with a wma of the smoothed relative strength, this ratio is again smoothed with the wma and multiplied by 100.
The relative strength momentum estimate is obtained from the ratio between the previously estimated RS-Ratio and its wma, this ratio is then multiplied by 100.
🔶 SETTINGS
Calculation Window: Calculation window of the RS-Ratio and RS-Momentum metrics.
Symbols: Symbols used for the computation of the graph, each settings line allows us to determine whether the symbol is to be displayed on the graph as well as its color.
Benchmark: Benchmark symbol used for the computation of the graph. Indices are commonly used as a benchmark.
🔹 Graph Settings
Trail Length: Number of past data points to display on the graph for each symbol.
Resolution: Controls the horizontal length of the graph.

CCOMET_Scanner_LibraryLibrary "CCOMET_Scanner_Library"
- A Trader's Edge (ATE)_Library was created to assist in constructing CCOMET Scanners
Loc_tIDs_Col(_string, _firstLocation)
TickerIDs: You must form this single tickerID input string exactly as described in the scripts info panel (little gray 'i' that
is circled at the end of the settings in the settings/input panel that you can hover your cursor over this 'i' to read the
details of that particular input). IF the string is formed correctly then it will break up this single string parameter into
a total of 40 separate strings which will be all of the tickerIDs that the script is using in your CCOMET Scanner.
Locations: This function is used when there's a desire to print an assets ALERT LABELS. A set Location on the scale is assigned to each asset.
This is created so that if a lot of alerts are triggered, they will stay relatively visible and not overlap each other.
If you set your '_firstLocation' parameter as 1, since there are a max of 40 assets that can be scanned, the 1st asset's location
is assigned the value in the '_firstLocation' parameter, the 2nd asset's location is the (1st asset's location+1)...and so on.
Parameters:
_string (simple string) : (string)
A maximum of 40 Tickers (ALL joined as 1 string for the input parameter) that is formulated EXACTLY as described
within the tooltips of the TickerID inputs in my CCOMET Scanner scripts:
assets = input.text_area(tIDset1, title="TickerID (MUST READ TOOLTIP)", tooltip="Accepts 40 TICKERID's for each
copy of the script on the chart. TEXT FORMATTING RULES FOR TICKERID'S:
(1) To exclude the EXCHANGE NAME in the Labels, de-select the next input option.
(2) MUST have a space (' ') AFTER each TickerID.
(3) Capitalization in the Labels will match cap of these TickerID's.
(4) If your asset has a BaseCurrency & QuoteCurrency (ie. ADAUSDT ) BUT you ONLY want Labels
to show BaseCurrency(ie.'ADA'), include a FORWARD SLASH ('/') between the Base & Quote (ie.'ADA/USDT')", display=display.none)
_firstLocation (simple int) : (simple int)
Optional (starts at 1 if no parameter added).
Location that you want the first asset to print its label if is triggered to do so.
ie. loc2=loc1+1, loc3=loc2+1, etc.
Returns: Returns 40 output variables in the tuple (ie. between the ' ') with the TickerIDs, 40 variables for the locations for alert labels, and 40 Colors for labels/plots
TickeridForLabelsAndSecurity(_ticker, _includeExchange)
This function accepts the TickerID Name as its parameter and produces a single string that will be used in all of your labels.
Parameters:
_ticker (simple string) : (string)
For this parameter, input the varible named '_coin' from your 'f_main()' function for this parameter. It is the raw
Ticker ID name that will be processed.
_includeExchange (simple bool) : (bool)
Optional (if parameter not included in function it defaults to false ).
Used to determine if the Exchange name will be included in all labels/triggers/alerts.
Returns: ( )
Returns 2 output variables:
1st ('_securityTickerid') is to be used in the 'request.security()' function as this string will contain everything
TV needs to pull the correct assets data.
2nd ('lblTicker') is to be used in all of the labels in your CCOMET Scanner as it will only contain what you want your labels
to show as determined by how the tickerID is formulated in the CCOMET Scanner's input.
InvalID_LblSz(_barCnt, _close, _securityTickerid, _invalidArray, _tablePosition, _stackVertical, _lblSzRfrnce)
INVALID TICKERIDs: This is to add a table in the middle right of your chart that prints all the TickerID's that were either not formulated
correctly in the '_source' input or that is not a valid symbol and should be changed.
LABEL SIZES: This function sizes your Alert Trigger Labels according to the amount of Printed Bars the chart has printed within
a set time period, while also keeping in mind the smallest relative reference size you input in the 'lblSzRfrnceInput'
parameter of this function. A HIGHER % of Printed Bars(aka...more trades occurring for that asset on the exchange),
the LARGER the Name Label will print, potentially showing you the better opportunities on the exchange to avoid
exchange manipulation liquidations.
*** SHOULD NOT be used as size of labels that are your asset Name Labels next to each asset's Line Plot...
if your CCOMET Scanner includes these as you want these to be the same size for every asset so the larger ones dont cover the
smaller ones if the plots are all close to each other ***
Parameters:
_barCnt (float) : (float)
Get the 1st variable('barCnt') from the Security function's tuple and input it as this functions 1st input
parameter which will directly affect the size of the 2nd output variable ('alertTrigLabel') that is also outputted by this function.
_close (float) : (float)
Put your 'close' variable named '_close' from the security function here.
_securityTickerid (string) : (string)
Throughout the entire charts updates, if a '_close' value is never registered then the logic counts the asset as INVALID.
This will be the 1st TickerID variable (named _securityTickerid) outputted from the tuple of the TickeridForLabels()
function above this one.
_invalidArray (array) : (array string)
Input the array from the original script that houses all of the invalidArray strings.
_tablePosition (simple string) : (string)
Optional (if parameter not included, it defaults to position.middle_right). Location on the chart you want the table printed.
Possible strings include: position.top_center, position.top_left, position.top_right, position.middle_center,
position.middle_left, position.middle_right, position.bottom_center, position.bottom_left, position.bottom_right.
_stackVertical (simple bool) : (bool)
Optional (if parameter not included, it defaults to true). All of the assets that are counted as INVALID will be
created in a list. If you want this list to be prited as a column then input 'true' here, otherwise they will all be in a row.
_lblSzRfrnce (string) : (string)
Optional (if parameter not included, it defaults to size.small). This will be the size of the variable outputted
by this function named 'assetNameLabel' BUT also affects the size of the output variable 'alertTrigLabel' as it uses this parameter's size
as the smallest size for 'alertTrigLabel' then uses the '_barCnt' parameter to determine the next sizes up depending on the "_barCnt" value.
Returns: ( )
Returns 2 variables:
1st output variable ('AssetNameLabel') is assigned to the size of the 'lblSzRfrnceInput' parameter.
2nd output variable('alertTrigLabel') can be of variying sizes depending on the 'barCnt' parameter...BUT the smallest
size possible for the 2nd output variable ('alertTrigLabel') will be the size set in the 'lblSzRfrnceInput' parameter.
PrintedBarCount(_time, _barCntLength, _barCntPercentMin)
The Printed BarCount Filter looks back a User Defined amount of minutes and calculates the % of bars that have printed
out of the TOTAL amount of bars that COULD HAVE been printed within the same amount of time.
Parameters:
_time (int) : (int)
The time associated with the chart of the particular asset that is being screened at that point.
_barCntLength (int) : (int)
The amount of time (IN MINUTES) that you want the logic to look back at to calculate the % of bars that have actually
printed in the span of time you input into this parameter.
_barCntPercentMin (int) : (int)
The minimum % of Printed Bars of the asset being screened has to be GREATER than the value set in this parameter
for the output variable 'bc_gtg' to be true.
Returns: ( )
Returns 2 outputs:
1st is the % of Printed Bars that have printed within the within the span of time you input in the '_barCntLength' parameter.
2nd is true/false according to if the Printed BarCount % is above the threshold that you input into the '_barCntPercentMin' parameter.

OKX Signal BOT - Strategy Scanner & Orderer
Hello traders,
With the OKX Signal BOT - Strategy Scanner & Orderer, you can now design your own strategy, scan over 20 cryptocurrencies, and send orders for futures trades on the OKX exchange.
How to Use:
🌐 First, log into your account on the OKX exchange and create a signal bot.
📝 While creating the signal bot, note down the webhook URL and signal token variables given to you; they'll be needed later.
🔍 Select the trading pairs that the bot will work on.
📈 Add this indicator to your chart.
⚙️ Adjust the values of the indicators you will use in your strategy.
📊 Set your entry conditions and indicator setups according to your preference.
🚀 Decide which condition will generate a LONG signal and which will generate a SHORT signal.
🔗 Then, link these conditions with either an AND or OR connector.
🛠️ This also serves as a strategy designer.
🆔 Paste the signal token value you got from OKX into the OKX Signal ID section in the indicator.
➕ Add the cryptocurrency pairs you added to the bot on OKX to this design tool as well.
💾 Save and exit.
🚨 Set an alarm and paste the webhook URL link you got from OKX.
Congratulations, you can now send signals from Tradingview to the OKX exchange without needing any other platform.
Warnings:
⚠️ Works only for futures trades.
📈 Make your leverage settings through the exchange.
🛑 It is recommended to set take profit and stop loss through the exchange.
🚫 If too many alarms are triggered, Tradingview may stop your alarms.
💡 Ensure that the coins you add in the symbol section are from the OKX exchange.
🔍 For futures trades, make sure the symbols end with ".P".
🎉 Enjoy using it!

Crypto Daily WatchList And Screener [M]
Hi, this is a watchlist and screener indicator designed for traders in the field of cryptocurrencies who want to monitor developments in other currency pairs and indices.
The indicator consists of two tables. One of them is the table containing indices such as BTC dominance, total, total2, which allows you to track market developments and changes. In this table, you will find price information, daily change, stochastic, and trend information.
The other table includes cryptocurrencies like BTC/USDT, ETH/USDT, DOT/USDT, and more. In this table, you will see real-time prices, daily volume, daily change, stochastic, the correlation coefficient between the pair and Bitcoin, and the trend value calculated based on MACD.
The "Customize" section in the settings enables you to personalize the appearance of the tables according to your preferences.
