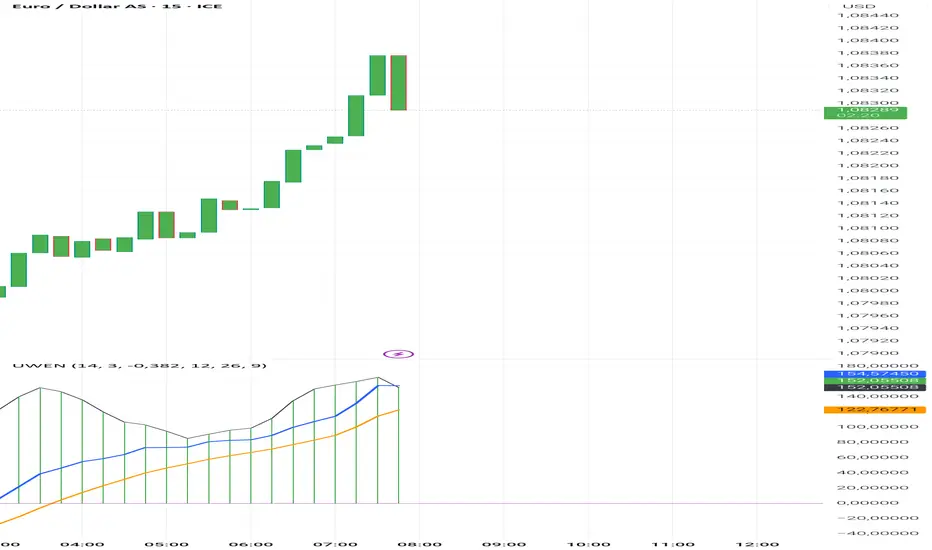
Uwen FX: UWEN StrategyThis Pine Script defines a trading indicator called "Uwen FX: UWEN Strategy" Where ideas coming from Arab Syaukani and modified by Fiki Hafana. It combines a CCI-based T3 Smoothed Indicator with a MACD overlay. Here's a breakdown of what it does:
Key Components of the Script:
1. CCI (Commodity Channel Index) with T3 Smoothing
Uses a T3 smoothing algorithm on the CCI to generate a smoother momentum signal. The smoothing formula is applied iteratively using weighted averages. The final result (xccir) is plotted as a histogram, colored green for bullish signals and red for bearish signals.
2. MACD (Moving Average Convergence Divergence)
The MACD is scaled to match the range of the smoothed CCI for better visualization. Signal Line and MACD Line are plotted if showMACD is enabled. The normalization ensures that MACD values align with the CCI-based indicator.
3. Bar Coloring for Trend Indication
Green bars indicate a positive trend (pos = 1).
Red bars indicate a negative trend (pos = -1).
Blue bars appear when the trend is neutral.
How It Can Be Used:
Buy Signal: When the xccir (smoothed CCI) turns green, indicating bullish momentum.
Sell Signal: When xccir turns red, indicating bearish momentum.
MACD Confirmation: Helps confirm the trend direction by aligning with xccir.
I will add more interesting features if this indicator seems profitable
Scalpers
YSG Scalper V2Ysg Scalper
A powerful scalping indicator that generates multiple buy and sell signals with a good amount of accuracy
How does it work?
As we all know the markets/scripts are not always in trending, many times it moves in a tight range, ysg scalping indicator helps you in identifying the trading opportunities by giving you trading zones and non-trading zones by paining the candles in three different colors Red, Yellow, and Green. When the candles are red it means the script is in the selling zone and when the candles are green the script is in the buying zone, when the candles in yellow it means the script is in no trading zone.
How to trade?
Trading with ysg scalper is very easy as it gives two zones called the trading zone and non-trading zone. If the candles are green or red the script is in trading zone and if the candles are yellow the script is in the non-trading zone.
Buy: when the candles change color to green wait for the first arrow and enter the trade after closing of the candle.
Sell: when the candles change color to red wait for the first arrow and enter the trade after closing of the candle.
What markets does it work best?
Works on indices, forex, and high beta stocks.
What's the best time frame to use?
3mins or 5mins (for forex and commodities)
How to get access?
Please click on the link in the signature or send me a private message to get access.

Scalper Pro Pivot - Scalpers WeaponToday I feel good to share with my all pals a new "Pivot Point" indicator which I never thought that it could be that easily done. I have been trading for years but I am, to be honest, new to pine script. I used to code other programming languages in the past like HTML, CSS, javascript, PHP, etc web-based programming language which luckily helped me to understand pinescript. It was a bit of my history about coding now talking to the main reason why I created this script in the first place? The answer is simple "I mean who the hell don't want to make their own indicators which work to accomplish own goals". There are lots of indicators which I saw in the public library as well as inside build in but, to be honest, I didn't found any pivot point indicator which calculates the "Fibonacci" method. Even if there are hundreds of pivot point indicators out there in public and built-in but they were either in higher timeframe (daily or above resolution) and weren't on a lower timeframe like starting from 1-minute resolution. There are some lower timeframe pivot point indicators but they aren't using the same method of calculation which I wished and if I ever figure out one then they just end up being repaints which didn't work properly as I wanted. The last but not least reason to create this indicator was obviously for all those short term traders (Scalpers) which I believe this indicator will be a game-changer by adding more support on their current trading strategies. It is so flexible that we can change the resolution from 1min to 1month and, to be honest with you all Fibonacci method used pivot points works most of the time with my own years of personal experience using them in higher timeframes and that is mainly one reason why I was eager to make one which can be used in lower timeframes. It will be useful for all types of traders (short-mid-long). The indicator was specially created for my own scalping purposes and indeed at the end, the creation of this indicator became like if I was mean to dedicate this to my fellow scalper's out there who value the pivot point! Lastly, I would like to give credit to pine script who gave support and knowledge for pine script as well as 'LonesomeTheBlue ' my friend who fixed some issue within the code and without him, my imagination wouldn't have been a reality. Inbox me if you are interested in it. Cheers!

Scalp Master V 1.0The Scalp Master is designed for new and experienced trainers to get a better understanding of sudden direction changes in the cryptocurrencies markets, by displaying just 2 basic signals: "Up" or "Down".
It combines the T.A of a group of indicators to give you the most sensitive tool to catch a Pump or Dump before it happens. It also includes one of the most basic and powerful tools to understand how the market is going to behave: Bollinger Bands, if we get an "Up" signal near the lower Bollinger band, we might be close to a good pump and if we get a "Down" signal near the top Bollinger band a dump in the price will most likely happen.
Enjoy!!!

Market Cycle & Scalping entry / exitCycle indicator is an oscillator commonly used to identify market trends and provide buy and sell signals to traders. The Cyle indicator is based on the assumption that currency trends accelerate and decelerate in cyclical patterns that may reflect the dominant price cycle of any stock, during any time frame. It works best on a 1 min chart for quick scalp plays.

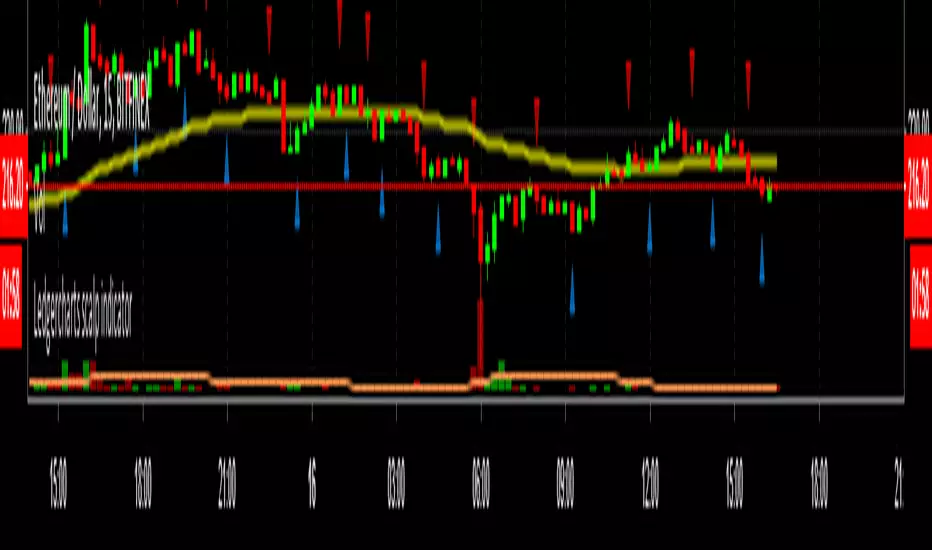
Ledgercharts scalp indicatorI'm using this indicator for finding scalp opportunities with high volume crypto coins. To be used in combination with support & resistance levels and/or other indicators.
Works best on a 15-minute timeframe.
DISCLAIMER:
This script is not intended as financial advice and is for educational purposes only. Do your own research by verifying the accuracy of the information and know that your decisions are your own.
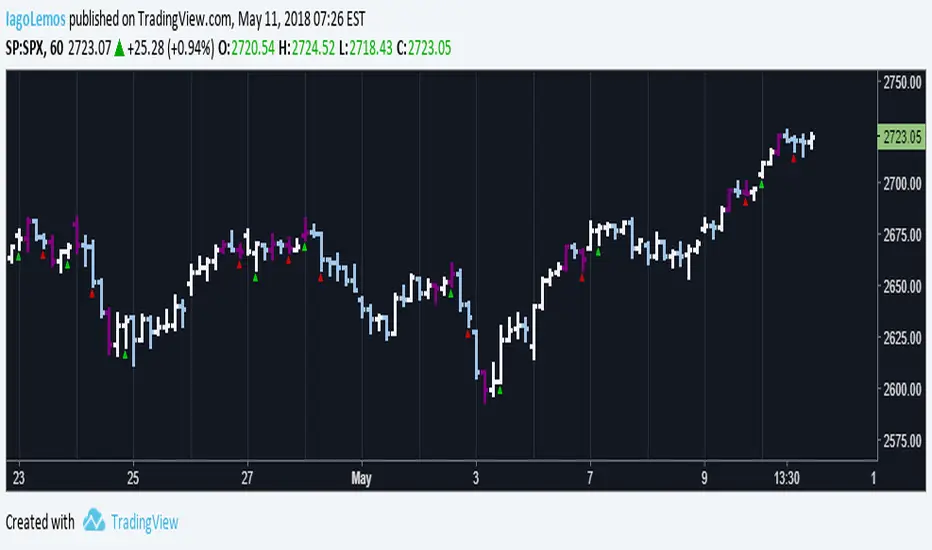
John Carter's Buy/Sell Scalper V2After a couple adjustments, double signals are now being ignore.
Here's how this script works:
Based entirely on a John Carter scalping setup, a candle will be painted purple if the next two closes are in a opposite direction of the past trend.
Green triangles indicates that the reversal is bullish, red triangles indicates that the reversal is bearish. Both are entry/exit points if you want to follow this set up.
Personally, I find this setup to work best in trending days, but it does a great job on choppy days if you use it as a confirmation.
John Carter's Buy/Sell Scalper (with alert)Basic indicator with signals. Con: Presents multiple signals in the same direction (should be ignored, according with the strategy).
