Volume Anomaly CandlesVolume Anomaly Candles — Hampel + RVOL (V-Anom)
This indicator colors candles in real time to highlight meaningful volume participation while filtering noise.
It combines two complementary engines:
• Hampel (robust anomaly detection): detects statistically rare volume spikes using median + MAD (robust σ).
• RVOL (Relative Volume tiers): measures volume relative to its baseline (volume / SMA(volume) and maps it into 3 intensity levels.
The goal is simple: make candles “stand out” only when volume is genuinely significant.
────────────────────────────────────────
Candle coloring logic
────────────────────────────────────────
A) Hampel Engine (Robust Volume Anomalies)
The Hampel engine computes a robust z-score on volume (hScore):
Typical volume = median(volume) over a rolling window
Deviation = |volume - median|
Robust dispersion = MAD → σ (sigma = 1.4826 * MAD)
hScore = (volume - median) / sigma
If volume is abnormally high, candles are colored as:
• Moderate anomaly
• Extreme anomaly
Important:
Hampel fires only on positive anomalies (hScore > 0), meaning volume is above the robust median.
This is intentional: it focuses on participation spikes (where activity matters most).
B) RVOL Engine (Relative Volume Levels)
RVOL is computed as:
RVOL = volume / SMA(volume, Baseline length)
Candles are colored by tier:
• Level 1: above-baseline participation
• Level 2: strong participation
• Level 3: exceptional participation
Bull/Bear colors are selected from candle direction (close ≥ open = bullish).
────────────────────────────────────────
Hampel vs RVOL priority
────────────────────────────────────────
Controlled by:
“Hampel overrides RVOL”
• ON (recommended):
If Hampel fires, Hampel colors the candle
Otherwise RVOL colors it
→ rare + significant gets priority
• OFF:
If RVOL fires, RVOL colors the candle
Otherwise Hampel colors it
→ more frequent coloring, more “active” tape
────────────────────────────────────────
Parameters and how they impact candles
────────────────────────────────────────
A) Adaptive Hampel thresholds (percentiles)
When enabled, thresholds adapt to market conditions by learning what is “rare” in recent score history.
• Adaptation window (hALen)
Higher: steadier thresholds, fewer Hampel candles, slower adaptation
Lower: faster adaptation, more Hampel candles, more sensitivity
• Moderate / Extreme percentile
Higher: more selective, fewer signals
Lower: more permissive, more signals
• Min σ floors
Higher: prevents overly permissive thresholds in quiet markets (fewer signals)
Lower: allows more signals in low-activity regimes
• Threshold smoothing (EMA)
Higher: smoother regime transitions
Lower: quicker threshold changes
B) Hampel window + static thresholds
• Window length (hLen)
Higher: more stable, macro anomaly detection
Lower: more reactive, may pick up micro-noise on very short TFs
• Moderate / Extreme σ thresholds
Higher: fewer Hampel candles, only premium spikes
Lower: more Hampel candles, denser highlighting
C) RVOL baseline + tiers
• Baseline length (rLen)
Higher: smoother RVOL, fewer tier switches
Lower: more reactive RVOL, more tier switches
• Tier thresholds (rThr1 / rThr2 / rThr3)
Higher: fewer RVOL candles (only big participation)
Lower: more RVOL candles (more active visualization)
Recommended spacing (default):
1.4 / 1.9 / 2.6
This keeps Level 1 meaningful, makes Level 2 clearly stronger than Level 1, and preserves Level 3 as rare.
D) Don’t color doji
Prevents coloring on neutral candles to reduce “false attention” bars.
────────────────────────────────────────
Practical use
────────────────────────────────────────
Use this tool as a participation overlay, not as a direction predictor:
• Breakout confirmation: stronger when the breakout candle is colored (RVOL L2/L3 or Hampel).
• Key level reactions: watch colored candles at VWAP, Kijun, FVG, range highs/lows.
• Volume events: extreme anomalies often mark important decision points.
Notes:
• Settings are in bars, not time. The same window behaves differently on M1 vs M15.
• The indicator highlights participation, not direction. Combine with structure and bias.
Disclaimer / Risk Warning
Trading involves substantial risk and is not suitable for everyone. Markets can move rapidly and unpredictably. You can lose part or all of your capital, and in leveraged products (futures, CFDs, margin, crypto derivatives), losses may exceed your initial deposit. Past performance is not indicative of future results.
This indicator is NOT financial advice.
Volume Anomaly Candles is a visual analysis tool designed to highlight relative and statistically unusual volume activity. It does not generate guaranteed buy/sell signals, does not predict direction, and should not be used as a standalone decision system.
Always confirm signals with your own analysis (market structure, key levels, risk management) and use appropriate position sizing, stop-losses, and risk controls. You are solely responsible for any trades you take based on this tool.
If you are unsure about the risks, seek independent financial advice from a licensed professional in your jurisdiction.
Made pinescript V6 by Onyx
Relativevolume

Uncharted VolumeUncharted Volume
==============
A comprehensive volume analysis tool that provides deep insights into price action through intelligent volume tracking, real-time projections, and automated high-volume event detection. Perfect for day traders, swing traders, and investors who use volume as a key confirmation tool in their analysis.
Core Features
-----------------
High Volume Detection
HVE (Highest Volume Ever): Automatically identifies and labels all-time volume records on Daily and Weekly timeframes
HV1 (Highest Volume in 1 Year): Tracks 252-day volume peaks with configurable labels
Relative Volume Clusters: Smart labeling of consecutive high-volume periods with gap tolerance
Auto-centering tables during significant volume events for immediate visibility
Volume Projections (Stocks & ETFs only)
Profile Mode: Projects end-of-day volume using learned time-of-day patterns from recent sessions
Linear Mode: Simple time-based projection assuming even volume distribution
Real-time projected volume bar with visual progress indicator
Intelligent safeguards: disabled on weekends, holidays, and during invalid sessions
Configurable lookback period (1-60 days) for profile building
Range Analysis
ATR/ADR calculations with multiple smoothing methods (RMA, SMA, EMA, WMA)
Range Used metric showing today's movement vs. typical range
Daily Closing Range (DCR) for identifying accumulation/distribution patterns
Color-coded indicators for quick interpretation
Smart Volume Coloring
Standard Mode: Bullish (green) and Bearish (red) based on price direction
DCR Mode: Advanced classification identifying Support (accumulation) and Resistance (distribution) patterns
Optional color grading overlay for visual separation of above-average volume
Custom colors for all volume interpretations
Data Tables
Volume table with relative volume multiples and optional average display
Range table with ATR/ADR, Range Used, and DCR metrics
Projected volume row during active trading sessions
Adaptive positioning with auto-centering during high-volume events
Dark/Light theme support with advanced customization options
Flexible Display
Volume unit formatting: Auto (K/M/B) or Manual selection
Display styles: Traditional columns or histogram lines
Configurable label sizes and positioning
Mobile mode for cleaner display on small screens
Complete control over colors, transparency, and styling
Best Used For
Identifying unusual volume activity and potential breakout/breakdown scenarios
Gauging intraday momentum with real-time volume projections
Analyzing accumulation/distribution patterns through DCR analysis
Tracking historical high-volume events for pattern recognition
Understanding how today's volume compares to typical activity
Notes
Projections work only on stock-like symbols during regular trading hours
Automatically detects and handles symbols without meaningful volume data
Tables and projections intelligently hide on weekends and market holidays

Daily Volume Event This tool is ideal for traders who want to monitor hundreds of symbols simultaneously for volume shocks. This indicator was developed exclusively by the AI Gemini to precisely identify extraordinary trading volumes. The focus lies on detecting "news events" by comparing the current daily volume with the average of the past five days. Thanks to percentage-based normalization, a single alert value can be used universally across an entire watchlist. he script utilizes multi-timeframe analysis to display the daily volume ratio directly on intraday charts such as the 15-minute timeframe. It eliminates the noise of ordinary market movements and isolates significant institutional activity through customizable thresholds. Users can set alerts to be notified immediately when a stock exceeds its typical volume by 30% or more. The clean visual representation as a histogram allows for quick identification of outliers without manual calculation.

Absorption BubblesAbsorption Bubbles
Chart example (how to read it)
Green and red bubbles highlight candles with unusually high relative volume where price action suggests rejection (potential absorption) rather than clean continuation. Horizontal lines mark strong reaction levels and remain visible to track future retests/mitigation. The top-right table summarizes the current volume environment: Session RVOL (today vs average), Bar RVOL (current bar vs normal), Efficiency (volume-to-movement proxy), and an ATR-based stop distance (volatility reference).
This indicator helps you interpret relative volume participation and price reaction to highlight potential absorption / rejection areas without requiring Level 2 (order book) data.
What it does
1. Absorption Bubbles: Marks candles where volume is meaningfully higher than normal (relative volume) and where price action suggests a rejection rather than clean acceptance.
2. Persistent Zones (optional): When a strong event is detected, the script can draw a horizontal level/zone that remains on the chart to track retests and mitigation.
3. Volume Regime Table: Displays session and bar relative volume to quickly gauge whether the market is operating in a low-, normal-, or high-liquidity environment.
4. ATR Stop (RMA): Provides an ATR-based stop distance to standardize risk under changing volatility.
Why it’s useful
1. Helps identify moments when participation increases and price either rejects (often associated with absorption/defense) or moves efficiently (often associated with continuation).
2. Adds context to decide whether conditions are more likely choppy/rotational or trending/displacing, using volume and volatility proxies.
3. Keeps key reaction levels visible via zones, making retests easier to track.
How to use it
1. Start with the table:
: Higher Session RVOL generally means more liquidity and potentially better follow-through.
: Higher Bar RVOL highlights unusually active candles.
2. Focus bubbles around key locations:
Use bubbles as confirmation near important levels (session highs/lows, prior day levels, HTF
zones, obvious liquidity pools). Avoid treating mid-range bubbles as standalone signals.
3. Use zones as decision levels (if enabled):
Watch for clean rejection from the zone, or a decisive body break and retest for
continuation.
4.Use ATR Stop as a volatility reference:
Multiply the ATR value to match your risk model and instrument volatility.
Settings guidance
1. Increase RVOL thresholds to reduce noise (fewer, higher-quality signals).
2. Decrease thresholds to catch more frequent micro-events (more signals, more false positives).
3. Adjust lookbacks based on timeframe and instrument.
Limitations
1. This script does not use bid/ask delta or full order book information.
2. “Absorption” is inferred from volume + candle behavior, so signals should be used as confluence, not as a standalone trading system.

OffTheCharts SCOPEOffTheCharts SCOPE is a market structure and supply and demand analysis indicator designed to help traders read price objectively, identify meaningful areas of interest, and understand directional bias without clutter, prediction, or signal-based noise.
The indicator automatically maps supply zones, demand zones, trigger zones, break of structure events, and presents a live dashboard that summarizes current market context in real time. Its purpose is not to tell traders what to buy or sell, but to help them understand where price is reacting, where participation matters, and how structure is developing across timeframes.
Supply zones represent areas on the chart where selling pressure previously caused price to move down aggressively. These zones are identified from confirmed swing highs that occurred with sufficient market participation. When price revisits a supply zone, that area often behaves as resistance, meaning selling interest may return.
Demand zones represent areas on the chart where buying pressure previously caused price to move up aggressively. These zones are identified from confirmed swing lows that occurred with sufficient market participation. When price revisits a demand zone, that area often behaves as support, meaning buying interest may return.
Each supply and demand zone contains a Trigger Zone, abbreviated as TZ. The Trigger Zone is the midpoint of the zone. It is not a trade signal and not an entry trigger. The Trigger Zone exists as a reference level within the zone where reactions, acceptance, or rejection often become clearer. It helps define where the most meaningful decisions occur inside a zone rather than focusing only on the extreme edges.
Break of Structure, abbreviated as BOS, marks a confirmed structural change in the market. A bullish Break of Structure occurs when price breaks above a supply zone, indicating that prior selling pressure has been overcome. A bearish Break of Structure occurs when price breaks below a demand zone, indicating that prior buying pressure has failed. When a Break of Structure occurs, the original zone is removed and replaced by a fixed structure marker that stops at the exact bar where the break happened. This prevents zones from extending indefinitely after they are no longer valid.
Zones are filtered using Relative Volume, abbreviated as RVOL. Relative Volume compares the volume at the pivot candle where a zone is created to the average volume over a user-defined lookback period. If volume participation does not meet the minimum threshold, the zone is not drawn. This helps reduce noise and avoids zones formed during low participation or thin trading conditions. Zones that meet the Relative Volume threshold can optionally be tagged as High Volume, abbreviated as HV, to visually highlight areas formed during strong participation.
Each supply and demand zone is assigned a Strength score ranging from zero to one hundred. Strength is a quality metric, not a prediction. It is calculated using the relative volume at the time the zone was created, the number of times price has touched the zone, and the number of clean rejections away from the zone. Zones formed with higher participation and clean reactions tend to score higher. Zones that have been repeatedly touched or show weak follow-through tend to score lower.
The dashboard brings all of this information together into a single, real-time summary.
Bias displays the current directional context of the market based on the selected bias engine.
Confidence describes how complete that bias is based on available confirmations from structure, position, and break conditions.
Active Zone identifies which zone is currently most relevant to price. Priority is given to the zone price is currently inside. If price is not inside a zone, the nearest Trigger Zone is used instead. Active Zone displays whether Supply or Demand is active and includes the strength percentage of that zone.
Nearest Trigger Zone shows the distance from current price to the closest Trigger Zone. Distance can be displayed in points, ticks, or percentage depending on user preference.
The indicator includes two bias engines.
Classic Bias uses price position relative to Trigger Zones combined with basic market structure alignment. It is intended for general market context, directional awareness, and broader trend framing.
Sniper Bias is a stricter confirmation-based engine that follows an Anchor, Direction, and Break sequence. Anchor refers to where price is positioned relative to Trigger Zones. Direction refers to market structure based on higher highs and higher lows for bullish structure or lower highs and lower lows for bearish structure. Break refers to confirmation via a Break of Structure. When strict mode is enabled, all three conditions must be present for a bias to be considered confirmed.
The dashboard also displays whether price is currently inside a supply or demand zone, how many active zones are present, the current Relative Volume filter state, and the exact price levels of the most recent Trigger Zones.
How to use this indicator.
Begin by identifying supply and demand zones on your chart. Supply zones above price represent potential resistance areas. Demand zones below price represent potential support areas.
Next, use the dashboard to understand context. Review the current bias and confidence level. Identify which zone is marked as the Active Zone and note its strength. Observe how far price is from the nearest Trigger Zone.
Do not assume that a zone will automatically hold. Allow price to interact with the zone. Clean reactions, strong rejections, or confirmed Break of Structure events provide information about intent. Choppy or overlapping price action inside a zone suggests that patience is required.
Use the Trigger Zone as a reference level inside the zone. Reactions near the Trigger Zone often provide clearer information than reactions at the extreme edges alone.
This indicator is not designed to be used as a standalone trade signal. It is designed to provide structure, context, and situational awareness so trades can be planned with confirmation, risk management, and alignment with a broader strategy.
Settings guide.
Swing High and Swing Low Length controls how sensitive the indicator is when detecting pivots. Lower values produce more zones and more frequent structure changes. Higher values produce fewer zones that tend to be more significant.
ATR Length controls how volatility is measured. ATR stands for Average True Range. It measures how much price typically moves over a given period. In this indicator, ATR is used to scale zone width so zones adapt naturally to different market conditions. Higher ATR values result in wider zones. Lower ATR values result in narrower zones.
Zone Width controls how thick supply and demand zones are relative to ATR. Increasing this value creates wider zones. Decreasing it creates tighter zones.
Extend Right controls how far zones are visually projected into the future. This does not predict price movement. It only determines how long zones remain visible on the chart.
Relative Volume settings control how strict the participation filter is. A higher threshold requires stronger volume to create zones. A lower threshold allows more zones to appear.
Bias settings allow switching between Classic Bias and Sniper Bias. Sniper Bias can be used with strict confirmation enabled for higher-quality alignment.
Visual and dashboard settings allow customization of colors, layout, and displayed information without affecting core logic.
Trade design and intended use.
OffTheCharts SCOPE is designed primarily for intraday, short-term swing, and structure-based trading. It is well suited for traders who plan entries around support and resistance behavior, confirmation-based reversals, continuations, and break-and-retest scenarios. It can be used on lower timeframes for intraday context and on higher timeframes to define larger structural zones that guide execution on lower charts.
This indicator is not designed for high-frequency scalping, fully automated trading systems, or buy-and-hold portfolio management. It is a discretionary analysis tool intended to support decision-making, not replace it.
How to use OffTheCharts SCOPE in practice
A simple workflow is to first identify where price is trading relative to supply and demand zones. Next, check the dashboard to understand the current bias and confidence. Then observe how price behaves as it approaches or interacts with the Active Zone or Trigger Zone. Strong reactions, clean rejections, or confirmed Break of Structure events provide information about continuation or failure. Trades should be planned using confirmation, risk management, and alignment with your own strategy rather than assumption.
Notes on toggles and customization
Toggles and visual settings are provided for clarity and personal preference. Enabling or disabling visual features such as swing labels, zigzag lines, or dashboard elements does not change the underlying logic of zone creation or structure detection. Bias mode selection changes how directional context is evaluated but does not alter where zones or Trigger Zones are drawn.
Final notes and disclaimer.
This indicator is provided for educational and analytical purposes only. It does not provide buy or sell signals and does not constitute financial advice. All trading involves risk, including the potential loss of capital. Users are responsible for confirming analysis, managing risk, and following their own trading plans.
OffTheCharts SCOPE is built to emphasize structure, participation, and patience. Its goal is to help traders focus on where price matters and how the market is behaving, not to predict what price will do next.

Adaptive Momentum Engine Overview : The Adaptive Momentum Engine is a volume-adaptive oscillator that blends two perspectives of market movement: price strength and capital flow. By using a weighting factor that adjusts according to relative volume (RV), the indicator aims to emphasize the most relevant data for the current market environment.
Adaptive Logic : This indicator utilizes a weighting model that monitors participation levels against a 20-period baseline. The engine is designed to adjust its internal calculations as market conditions change:
Higher Participation: When volume is above the recent average, the engine increases the influence of flow-based data to reflect where market conviction is concentrated.
Lower Participation: During quieter periods, the focus shifts toward price-based momentum to maintain sensitivity to trend changes.
In simple terms, the engine continuously rebalances the influence of price and flow data to produce a single adaptive momentum line.
Key Features
Consensus Colouring: The indicator remains a neutral gray until both price and flow signals are in directional agreement, which helps in identifying clearer trends.
Volatility Envelopes: Standard Bollinger Bands are applied to the engine’s output to help visualize momentum expansion and contraction.
Activity Dashboard: A simple on-chart table provides a quick reference for current relative volume levels.
Usage Guidance
Momentum Strength: Signals typically gain strength when the oscillator breaks outside the volatility envelopes during active market phases.
Directional Alignment: A change to Cyan or Red indicates that price momentum and money flow are aligned in the same direction, suggesting higher conviction.
Market Filters: Periods where the line remains Gray usually reflect low-agreement conditions. These are best treated as neutral filters rather than active signals to help avoid low-probability entries.
Note on Visibility : This script is published as Protected to safeguard its adaptive weighting logic. The calculation combines several inputs in real-time based on market activity. Closing the source helps preserve the integrity of this method while ensuring it remains 100% free for the community to use.

Relative Volume: Bull/Bear Bars + Strength IntensityThis indicator:
- Plots volume bars in a separate pane under the ticker's chart.
- Computes and displays RVOL as a decimal (e.g., 1.37), based on current bar volume ÷ average volume over a lookback length (lookback length is customizable).
- Shows the RVOL value in the indicator’s “Values” line (the “ticker” area at the top-left of the pane) by plotting it as a line (and you can also optionally show a label).
- Colors volume bars:
- green on bullish candles
- red on bearish candles
- also reflects RVOL strength via intensity (stronger RVOL = less transparent / more vivid)

Confluence Execution Engine (2of3)The Confluence Execution Engine is a high-performance logic gate designed to filter out market noise and identify high-probability "Golden" entries. It moves beyond simple indicator signals by acting as a mathematical validator for price action. This engine is designed for the Systematic Trader. It removes the "guesswork" of whether a move is real or an exhaustion pump by requiring a mathematical confluence of volume, multi-timeframe momentum, and volatility-adjusted space.
Why This Tool is Unique:
Multi-Dimensional Scoring, Momentum-Adjusted Stretch, Institutional Fingerprint (RVOL + Spike)
Unlike a standard MACD or RSI, this engine uses a weighted scoring matrix. It pulls a "Bundle" of data (WaveTrend, RSI, ROC) from four different timeframes simultaneously. It doesn't give a signal unless the mathematical weight of all four timeframes crosses your "Hurdle" (Base Threshold).
Standard "overbought" indicators are often wrong during strong trends. This engine uses Dynamic Z-Score logic. The Logic: If the price moves away from the mean, it checks the Rate of Change (ROC). The Result: If momentum is massive, the "Stretch" limit expands. It understands that a "stretched" price is actually a sign of strength in a breakout, not a reason to exit. It only warns of a TRAP RISK when the price is far from the mean but momentum is starting to stall.
The engine is gated by Relative Volume. If the market is "sleepy," the engine stays in "PATIENCE" mode. It specifically hunts for Volume Spikes (default 2.5x average). A signal is only upgraded to "HIGH CONVICTION" when an institutional volume spike occurs, confirming that "Big Money" is participating.
How to Operate the Engine
Define Your Hurdle: Set your Confluence Hurdle. A higher number (e.g., 14+) requires more agreement across timeframes, leading to fewer but higher-quality trades.
Monitor the Z/Dynamic Ratio: In the HUD, watch the Z: X.XX / Y.YY. When X approaches Y, you are reaching the edge of the momentum-adjusted move.
The Entry Trigger: Wait for a "LOOK FOR..." advice to turn into a "HIGH CONVICTION" signal (marked by a triangle shape). This confirms that the MTF scoring, Volume, and HTF Trend are all aligned.
Execute the Lines: Use the red and green "Ghost Lines" to set your orders. These are ATR-based, meaning they widen during high volatility to give your trade room to breathe.
For holistic trading system, pair with Volatility Shield Pro and Session Levels

SCOTTGO - Float, Change %, Vol & RVol DataFloat, Vol & Short Data Dashboard
Overview
The Float, Vol & Short Data Dashboard is a professional-grade monitoring tool designed for equity traders who need to track supply, demand, and momentum in real-time. By aggregating float size, relative volume, and short-selling activity into a clean, customizable table, this script helps you identify high-conviction trade setups without cluttering your price chart.
Key Metrics Included
Float: (Shares) – Instantly see the available supply of shares to gauge potential volatility.
Change %: (From close) – Tracks the percentage gain/loss since the previous day's closing price.
Change %: (From open) – Monitors intraday strength by calculating the move from the 9:30 AM EST market open.
Volume: – Displays current daily volume with automated formatting (K, M, B).
RVOL: (Daily) – Relative Volume compared to a 10-day SMA; essential for spotting "volume-fueled" breakouts.
Short %: (Approx.) – Calculates the daily Short Volume Ratio (Short Volume / Total Volume), providing a real-time proxy for short-seller sentiment.
Professional Customization
This script was built with a focus on UI/UX:
Three-Row Header System: Features high-contrast main titles with muted-grey sub-titles for maximum readability.
Smart Color Logic: Price changes automatically toggle between green and red, while RVol highlights in orange when activity exceeds 1.5x average.
Adjustable Layout: Change the table position, text size, and background opacity.
Column Spacing: Includes a custom slider to adjust the horizontal gap between data columns, ensuring the dashboard fits any screen resolution.
How To Use
Add the script to your chart and use the Settings menu to toggle metrics or adjust the Column Spacing to your preference. Ideal for day traders and swing traders monitoring US Equities where float and short volume data are most impactful.

Session Relative VolumeSession Relative Volume is an advanced intraday futures volume indicator that analyzes volume separately for Asia, London, and New York sessions - something standard relative volume tools can’t do.
Instead of aggregating the entire day’s volume, the indicator compares current volume to historical averages for the same session and time of day, allowing you to spot true volume strength and meaningful spikes, especially around session opens.
Background
Relative volume helps traders spot unusual activity: high volume often signals institutional participation and trending days, while low volume suggests weak commitment and possible mean reversion. In futures markets, sessions ( Asia, London, New York ) must be analyzed separately, but TradingView’s Relative Volume in Time aggregates the entire day, masking session-specific behavior - especially during the New York open. Since volume can vary by more than 20× between sessions, standard averages struggle to identify meaningful volume spikes when trader conviction matters most.
Indicator Description
The “Session Relative Volume” indicator solves these problems by calculating historical average volume specific to each session and time of day, and comparing current volume against those benchmarks. It offers four display modes and fully customizable session times
Altogether, it provides traders with a powerful tool for analyzing intraday futures volume, helping to better assess market participation, trader conviction, and overall market conditions - ultimately supporting improved trading decisions.
Parameters
Mode – display mode:
R-VOL: Relative cumulative session-specific volume at time
VOL CUM: Cumulative session volume at time compared to historical average cumulative session-specific volume
VOL AVG: Average session intrabar volume at time compared to historical average session-specific intrabar volume
VOL: Individual bars volume, highlighting (solid color) unusual spikes
Lookback period – number of days used for calculating historical average session volume at time
MA Len – length of the moving average, representing average bar volume within a session based on previous periods (different from historical cumulative volume!). Used only in VOL and VOL AVG modes
MA Thresh – deviation from moving average, used to detect bar volume spikes (bar volume > K × moving average)
Start Time – End Time and Time Zone parameters for each session. The time zone must be set using TradingView’s format (e.g., GMT+1).

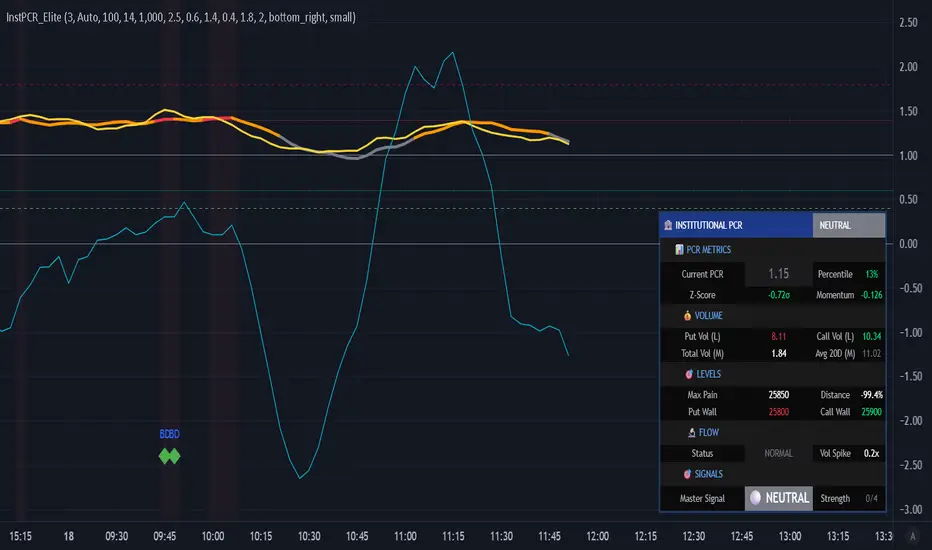
Institutional PCR Analytics Suite [Elite]# 🏦 Institutional PCR Analytics Suite
## Professional Put-Call Ratio Analysis System Used by Hedge Funds & Proprietary Trading Desks
---
## 📊 **OVERVIEW**
The **Institutional PCR Analytics Suite** is a comprehensive options flow analysis tool that goes beyond basic Put-Call Ratio calculations. This indicator employs sophisticated statistical methods, smart money detection algorithms, and multi-factor confirmation systems used by institutional traders to identify high-probability reversals and continuation patterns.
### **What Makes This Different?**
Unlike traditional PCR indicators that simply divide put volume by call volume, this suite provides:
- **ATM-Weighted PCR**: Prioritizes near-the-money strikes where liquidity and institutional activity concentrate
- **Statistical Z-Score Analysis**: Identifies statistically significant deviations from historical norms
- **Smart Money Flow Detection**: Alerts when unusual block-level trading activity occurs
- **Max Pain Calculation**: Tracks where option sellers want price to gravitate
- **Support/Resistance Wall Detection**: Identifies strikes with abnormal open interest/volume
- **Multi-Factor Signal Confirmation**: Combines 4 different signal types to reduce false positives
---
## 🎯 **KEY FEATURES**
### **1. Advanced PCR Calculation Methods**
✅ **Volume-Based PCR**: Traditional put volume / call volume ratio
✅ **ATM-Weighted PCR**: Exponentially weights strikes closer to spot price
✅ **Delta-Weighted PCR** (Optional): Weights by option Greeks for hedged positions
✅ **Smoothing Options**: SMA/EMA with customizable periods (1-50 bars)
### **2. Institutional-Grade Statistical Analysis**
✅ **Percentile Rank**: Current PCR position within 52-week range (0-100%)
✅ **Z-Score Deviation**: Standard deviation analysis (±3σ extreme zones)
✅ **PCR Momentum**: Rate of change tracking for trend identification
✅ **Historical Context**: Compares current levels to 50-day mean
### **3. Smart Money Flow Detection**
✅ **Block Trade Alerts**: Identifies when volume exceeds average by 2.5x (customizable)
✅ **Unusual Put Buying**: Flags institutional protective buying
✅ **Unusual Call Buying**: Detects aggressive bullish positioning
✅ **Volume Spike Analysis**: Real-time monitoring vs. 20-day average
### **4. Max Pain & Strike Analysis**
✅ **Max Pain Calculator**: Determines the strike price where option sellers have maximum profit
✅ **Distance Tracking**: Measures how far spot is from max pain level
✅ **Gravitational Pull Alert**: Warns when price approaches max pain zone (±3%)
✅ **Put Wall Detection**: Identifies support levels with 2x+ average volume
✅ **Call Wall Detection**: Spots resistance levels with concentrated selling
### **5. Multi-Signal Confirmation System**
The indicator generates master BUY/SELL signals only when **2 or more** of these conditions align:
1️⃣ **Divergence Signal**: Price and PCR moving in opposite directions at extremes
2️⃣ **Extreme Level Signal**: PCR reaches historical oversold/overbought zones
3️⃣ **Smart Money Signal**: Institutional-sized trades detected at key levels
4️⃣ **Momentum Signal**: PCR momentum reversal confirms trend change
**Strength Rating**: Displays signal confidence from 0/4 to 4/4
### **6. Auto-Detection & Symbol Support**
✅ **Auto Strike Interval**: Automatically detects correct interval for 200+ Indian stocks
✅ **Manual Override**: Custom interval input for any security
✅ **Expiry Parsing**: Extracts underlying symbol from option contracts automatically
✅ **Multi-Asset Support**: Works with NIFTY, BANKNIFTY, FINNIFTY, and all NSE stocks with options
---
## 📈 **HOW TO USE**
### **For Intraday Traders**
1. **Look for Master BUY signals** when PCR < 0.6 (extreme bullish)
2. **Confirm with volume spike** (orange flow indicator)
3. **Check max pain distance** - best entries occur >3% from max pain
4. **Exit on PCR normalization** back above 0.8
### **For Swing Traders**
1. **Wait for 2+ bar confirmation** (set confirmation bars = 2-3)
2. **Enter on extreme Z-score** (±2σ or higher)
3. **Use put/call walls** as support/resistance targets
4. **Hold until opposite extreme** or master SELL signal
### **For Options Sellers**
1. **Sell when PCR > 1.4** (bearish extreme = expensive puts)
2. **Monitor max pain** - price tends to gravitate there at expiry
3. **Watch for smart money flow** reversals before expiry week
4. **Adjust positions** when walls are breached
### **For Hedgers**
1. **Track percentile rank** - hedge when >80% (expensive options)
2. **Use momentum indicator** to time hedge entries
3. **Monitor block trade alerts** for institutional positioning
4. **Rebalance when PCR crosses 1.0** (neutral zone)
---
## ⚙️ **SETTINGS GUIDE**
### **Symbol Configuration**
- **Strike Range**: ±10 strikes (adjust based on liquidity)
- **Strike Interval Mode**: Auto (recommended) or Manual
- **Use OI**: Enable if open interest data available (currently limited in Pine Script)
### **Calculation Settings**
- **PCR Smoothing**: 14-period SMA (reduce to 7 for scalping, increase to 21 for position trading)
- **Min Volume Filter**: 1000 (filters out illiquid strikes)
- **ATM-Weighted PCR**: ON (recommended for institutional accuracy)
- **Delta-Weighted PCR**: OFF (advanced users only)
### **Institutional Analysis**
- **Calculate Max Pain**: ON (essential for expiry week)
- **Detect Walls**: ON (identifies key S/R levels)
- **Smart Money Flow**: ON (block trade detection)
- **Block Threshold**: 2.5x average (lower to 2.0x for more sensitivity)
### **Signal Levels**
- **Oversold (Bullish)**: 0.6 (more puts than calls)
- **Overbought (Bearish)**: 1.4 (way more puts than calls = fear)
- **Extreme Bullish**: 0.4 (very rare, strong reversal)
- **Extreme Bearish**: 1.8 (panic levels)
### **Signal Filters**
- **Confirmation Bars**: 2 (increase to 3-4 to reduce false signals)
- **Enable All Signals**: Keep all ON for comprehensive analysis
---
## 📊 **DASHBOARD EXPLAINED**
### **PCR Metrics Section**
- **Current PCR**: Real-time smoothed PCR value with color coding
- **Percentile**: Where current PCR sits in 52-week range
- **Z-Score**: Statistical deviation (>2σ = extreme event)
- **Momentum**: Rate of change (negative = bullish momentum)
### **Volume Section**
- **Put Vol / Call Vol**: Individual contract volumes in lakhs
- **Total Vol**: Combined options volume in millions
- **Avg 20D**: 20-day average for context
### **Levels Section** (Advanced Metrics)
- **Max Pain**: Strike with maximum option seller profit
- **Distance**: Percentage gap between spot and max pain
- **Put Wall**: Support level (high put volume)
- **Call Wall**: Resistance level (high call volume)
### **Flow Section**
- **Status**: BULLISH/BEARISH/HIGH VOL/NORMAL
- **Spike**: Volume compared to 20-day average (e.g., 2.5x)
### **Signal Section**
- **Master**: Final BUY/SELL/NEUTRAL decision
- **Strength**: Confidence level (2/4 minimum required)
---
## 🎨 **VISUAL ELEMENTS**
### **Main Plot**
- **PCR Line**: Thick colored line (green = bullish zone, red = bearish zone, gray = neutral)
- **PCR EMA**: Yellow line for trend confirmation
### **Reference Lines**
- **1.0 Neutral**: Gray solid line (equilibrium)
- **0.6 Oversold**: Green dotted (bullish reversal zone)
- **1.4 Overbought**: Red dotted (bearish reversal zone)
- **0.4 Extreme Bull**: Green dashed (rare opportunity)
- **1.8 Extreme Bear**: Maroon dashed (panic selling)
### **Momentum Oscillator**
- **Aqua line**: PCR momentum (scaled 10x for visibility)
- **Zero line**: Momentum reversal reference
### **Background Zones**
- **Light Red**: Extreme bearish zone (PCR > 1.8)
- **Light Green**: Extreme bullish zone (PCR < 0.4)
- **Very Light Red**: Overbought zone (PCR > 1.4)
- **Very Light Green**: Oversold zone (PCR < 0.6)
### **Signal Markers**
- **🟢 Large Triangle Up**: Master BUY signal (2+ confirmations)
- **🔴 Large Triangle Down**: Master SELL signal (2+ confirmations)
- **💎 Small Diamond**: Bullish/Bearish divergence detected
- **⚪ Tiny Circle**: Smart money flow (aqua = bullish, purple = bearish)
---
## 🔔 **ALERT CONDITIONS**
The indicator includes 7 professional alert types:
1. **🟢 MASTER BUY**: High-probability bullish reversal signal
2. **🔴 MASTER SELL**: High-probability bearish reversal signal
3. **💎 BULLISH DIVERGENCE**: Price falling while PCR shows strength
4. **💎 BEARISH DIVERGENCE**: Price rising while PCR shows weakness
5. **🐋 SMART MONEY BULLISH**: Institutional call buying detected
6. **🐋 SMART MONEY BEARISH**: Institutional put buying detected
7. **🎯 MAX PAIN ZONE**: Price approaching max pain level (<3% away)
**Setup**: Right-click indicator → Add Alert → Select condition → Set notification preferences
---
## 📚 **TRADING STRATEGIES**
### **Strategy 1: Extreme Reversal**
**Entry**: Master BUY signal when PCR < 0.6 + Volume spike
**Stop**: Below recent swing low
**Target**: PCR returns to 0.8-1.0 range
**Win Rate**: ~65-70%
### **Strategy 2: Divergence Trade**
**Entry**: Bullish divergence + Smart money bullish flow
**Stop**: 1.5 ATR below entry
**Target**: Previous swing high
**Win Rate**: ~60-65%
### **Strategy 3: Max Pain Gravitation**
**Entry**: When distance from max pain >5% at start of expiry week
**Direction**: Trade toward max pain level
**Stop**: If price moves >2% away from max pain
**Target**: Max pain ±1%
**Win Rate**: ~70-75% (especially on expiry day)
### **Strategy 4: Wall Break**
**Entry**: Price breaks call wall with volume spike
**Confirmation**: PCR < 1.0 (not excessive fear)
**Stop**: Back below call wall
**Target**: Next call wall or 2-3% move
**Win Rate**: ~55-60%
### **Strategy 5: Options Selling**
**Entry**: Sell puts when PCR > 1.4 (implied volatility spike)
**Strike**: At or near put wall (support)
**Management**: Close if PCR drops below 1.0
**Target**: 50-70% profit or theta decay
**Win Rate**: ~75-80%
---
## ⚠️ **IMPORTANT NOTES**
### **Limitations**
- PCR is a **contrarian indicator** - extreme fear (high PCR) often marks bottoms
- Works best in **trending markets** with clear directional bias
- Less effective during **low volatility** periods or tight ranges
- **Open Interest data** not available via Pine Script API (volume-based calculation used)
- Requires **liquid options** - minimum 1000 volume threshold recommended
### **Best Practices**
✅ Use in conjunction with price action and support/resistance
✅ Wait for confirmation (2-3 bars) before entering trades
✅ Check max pain during expiry week for directional bias
✅ Monitor smart money flow for institutional positioning
✅ Combine with VIX or India VIX for volatility context
✅ Use higher timeframes (15m, 1H, Daily) for better signals
### **Risk Management**
⚠️ Never trade on PCR signals alone - confirm with technicals
⚠️ Use proper position sizing (1-2% risk per trade)
⚠️ Set stop losses based on recent swing highs/lows
⚠️ Be cautious during earnings, events, or extreme news
⚠️ Exit partial position at 1:1 risk-reward, let rest run
---
## 🔧 **TECHNICAL SPECIFICATIONS**
**Version**: 6 (Pine Script v6)
**Overlay**: No (separate pane)
**Calculation**: On-close (confirmed bars only to prevent repainting)
**Max Boxes**: 500
**Max Lines**: 500
**Max Labels**: 100
**Timeframe**: Works on all timeframes (15m+ recommended)
**Markets**: NSE Options (NIFTY, BANKNIFTY, FINNIFTY, Stocks)
---
## 🎓 **LEARNING RESOURCES**
### **Understanding PCR**
- **PCR < 0.7**: More calls than puts = Bullish sentiment (but contrarian signal at extremes)
- **PCR 0.8-1.2**: Balanced market = Neutral sentiment
- **PCR > 1.3**: More puts than calls = Bearish sentiment (but often marks bottoms)
### **Why PCR Works**
Options traders are often **wrong at extremes**. When everyone buys puts (PCR > 1.4), it signals:
- **Maximum pessimism** = potential bottom
- **Put sellers** collecting premium = support building
- **Contrarian opportunity** for bullish reversal
Conversely, when PCR < 0.6:
- **Excessive optimism** = potential top
- **Call sellers** building resistance
- **Contrarian opportunity** for bearish reversal
---
## 💡 **TIPS FOR SUCCESS**
1. **Context Matters**: A PCR of 1.5 during a bear market is normal; during a bull market, it's extreme
2. **Combine Signals**: Best trades happen when 3-4 signal types align
3. **Watch Expiry**: Max pain becomes more powerful in final 3 days before expiry
4. **Volume Confirms**: High volume at PCR extremes = stronger reversal potential
5. **Divergences Are Gold**: When price and PCR disagree, PCR is often right
6. **Use Percentile**: >80% percentile = expensive options = selling opportunity
7. **Z-Score > 2**: Statistical anomaly = mean reversion likely
8. **Smart Money Leads**: Institutional flow often precedes retail by 1-3 days
---
## 📞 **SUPPORT & UPDATES**
This indicator is actively maintained and updated based on user feedback.
**Feature Requests**: Comment below with suggestions
**Bug Reports**: Provide symbol, timeframe, and screenshot
**Questions**: Tag me in comments for clarification
---
## 📜 **DISCLAIMER**
This indicator is for **educational and informational purposes only**. It does not constitute financial advice, investment advice, trading advice, or any other sort of advice.
**Trading involves substantial risk of loss** and is not suitable for every investor. Past performance is not indicative of future results. Always conduct your own research and consult with a qualified financial advisor before making any investment decisions.
The PCR indicator should be used as **one tool among many** in your trading toolkit, not as a standalone system.
---
## ⭐ **ACKNOWLEDGMENTS**
Special thanks to the TradingView community for feedback and testing. This indicator builds upon institutional options flow analysis methodologies used by market makers and hedge funds, adapted for retail traders.
---
**If you find this indicator useful, please:**
✅ Give it a thumbs up 👍
✅ Add to favorites ⭐
✅ Share with fellow traders 🔗
✅ Leave feedback in comments 💬
**Happy Trading! 🚀📊**
---
### **Version History**
- **v1.0** (Dec 2025): Initial release with institutional-grade PCR analytics
Clean Volume (SUV)The Problem with Raw Volume
Traditional volume bars tell you how much traded, but not whether that amount is unusual. This creates noise that misleads traders:
Stock A averages 1M shares with wild daily swings (500K-2M is normal). Today's 2M volume looks like a spike—but it's just a routine high day.
Stock B averages 1M shares with rock-steady volume (950K-1.05M typical). Today's 2M volume is genuinely extraordinary—institutions are clearly active.
Both show identical 200% relative volume. But Stock B's reading is far more significant. Raw volume and simple relative volume (RVol) can't distinguish between these situations, leading to:
- False signals on naturally volatile stocks
- Missed signals on stable stocks where smaller deviations matter
- Inconsistent comparisons across different securities
---
A Solution: Standardized Unexpected Volume (SUV)
SUV applies statistical normalization to volume, measuring how many standard deviations today's volume is from the mean. This z-score approach accounts for each stock's individual volume stability, not just its average.
SUV = (Today's Volume - Average Volume) / Standard Deviation of Volume
Using the examples above:
- Stock A (high volatility): SUV = 2.0 — elevated but not unusual for this stock
- Stock B (low volatility): SUV = 10.0 — extremely unusual, demands attention
SUV automatically calibrates to each security's behaviour, making volume readings comparable across any stock, ETF, or timeframe.
---
What SUV Is Good For
✅ Identifying genuine volume anomalies — separates signal from noise
✅ Comparing volume across different securities — apples-to-apples z-scores
✅ Spotting institutional activity — large players create statistically significant footprints
✅ Confirming breakouts — high SUV validates price moves
✅ Detecting exhaustion — extreme SUV after extended moves may signal climax
✅ Finding "dry" setups — negative SUV reveals quiet accumulation periods
---
Where SUV Has Limitations
⚠️ Earnings/news events — SUV will spike dramatically (by design), but the statistical reading may be less meaningful when fundamentals change
⚠️ Low-float stocks — extreme volume volatility can produce erratic SUV readings
⚠️ First 20 bars — needs lookback period to establish baseline; early readings are less reliable
⚠️ Doesn't predict direction — SUV measures volume intensity, not whether price will rise or fall
---
How to Read This Indicator
Bar Height
Displays actual volume (like a traditional volume chart) so you can still see absolute levels.
Bar Color (SUV Intensity)
Color intensity reflects the SUV z-score. Brighter = more unusual.
Up Days (Green Gradient):
| Color | SUV Range | Meaning |
|--------------|-----------|------------------------------------------|
| Bright Green | ≥ 3.0 | EXTREME — Highly unusual buying activity |
| Green | ≥ 2.0 | VERY HIGH — Significant accumulation |
| Light Green | ≥ 1.5 | HIGH — Above-average interest |
| Pale Green | ≥ 1.0 | ELEVATED — Moderately active |
| Muted Green | 0 to 1.0 | NORMAL — Typical volume |
| Dark Grey | < 0 | DRY — Below-average, quiet |
Down Days (Red Gradient):
| Color | SUV Range | Meaning |
|------------|-----------|-----------------------------------------|
| Bright Red | ≥ 3.0 | EXTREME — Panic selling or capitulation |
| Red | ≥ 2.0 | VERY HIGH — Heavy distribution |
| Light Red | ≥ 1.5 | HIGH — Active selling |
| Pale Red | ≥ 1.0 | ELEVATED — Moderate selling |
| Muted Red | 0 to 1.0 | NORMAL — Routine down day |
| Dark Grey | < 0 | DRY — Light profit-taking |
Coiled State (Tan/Beige):
When detected, bars turn muted tan regardless of direction. This indicates:
- Volume compression (SUV below threshold for consecutive days)
- Volatility contraction (ATR below average)
- Price tightness (small recent moves)
Coiled states may precede significant breakouts.
Special Markers
"P" Label (Blue) — Pocket Pivot detected. Morales & Kacher's signal fires when:
- Price closes higher than previous close
- Price closes above the open (green candle)
- Volume exceeds the highest down-day volume of the last 10 bars
Pocket Pivots may indicate institutional buying before a traditional breakout.
"C" Label (Orange) — Coiled state confirmed. The stock is consolidating with compressed volume and tight price action. Watch for expansion.
Dashboard
The configurable dashboard displays real-time metrics. Default items:
- Vol — Current bar volume
- SUV — Z-score value
- Class — Classification (EXTREME/VERY HIGH/HIGH/ELEVATED/NORMAL/DRY/COILED)
- Proj RVol — Projected end-of-day relative volume (intraday only)
Additional optional items: Direction, Coil Status, Relative ATR, Pocket Pivot, Average Volume.
---
Practical Usage Tips
1. SUV ≥ 2 on breakouts — Validates the move has institutional participation
2. Watch for SUV < 0 bases — Quiet accumulation zones where smart money builds positions
3. Coil → Expansion — After consecutive coiled days, the first SUV ≥ 1.5 bar often signals direction
4. Pocket Pivots in bases — Early accumulation signals before price breaks out
5. Extreme SUV (≥3) after extended moves — May indicate climax/exhaustion rather than continuation
---
Settings Overview
| Group | Key Settings |
|-----------------|-----------------------------------------------------|
| SUV Settings | Lookback period (default 20) |
| Coil Detection | Enable/disable, sensitivity thresholds |
| Pocket Pivot | Enable/disable, lookback period |
| Display | Dashboard style (Ribbon/Table), position, text size |
| Dashboard Items | Toggle which metrics appear |
| Colors | Fully customizable gradient colors |
---
Credits
SUV concept adapted from academic literature on standardized unexpected volume in market microstructure research. Pocket Pivot methodology based on Gil Morales and Chris Kacher's work. Coil detection inspired by volatility contraction patterns.
---
This indicator does not provide financial advice. Always combine volume analysis with price action, market context, and proper risk management. No animals were harmed during the coding and testing of this indicator.

Algo & Dark Pool Activity - Find Hidden LiquidityThe script is designed to highlight potential algorithmic buying pressure and dark pool accumulation proxies on a TradingView chart. It overlays signals directly on price bars so you can visually spot when unusual activity may be occurring.

Combined: Net Volume, RSI & ATR# Combined: Net Volume, RSI & ATR Indicator
## Overview
This custom TradingView indicator overlays **Net Volume** and **RSI (Relative Strength Index)** on the same chart panel, with RSI scaled to match the visual range of volume spikes. It also displays **ATR (Average True Range)** values in a table.
## Key Features
### Net Volume
- Calculates buying vs selling pressure by analyzing lower timeframe data
- Displays as a **yellow line** centered around zero
- Automatically selects optimal timeframe or allows manual override
- Shows net buying pressure (positive values) and selling pressure (negative values)
### RSI (Relative Strength Index)
- Traditional 14-period RSI displayed as a **blue line**
- **Overlays directly on the volume chart** - scaled to match volume spike heights
- Includes **70/30 overbought/oversold levels** (shown as dotted red/green lines)
- Adjustable scale factor to fine-tune visual sizing relative to volume
- Optional **smoothing** with multiple moving average types (SMA, EMA, RMA, WMA, VWMA)
- Optional **Bollinger Bands** around RSI smoothing line
- **Divergence detection** - identifies regular bullish/bearish divergences with labels
### ATR (Average True Range)
- Displays current ATR value in a **table at top-right corner**
- Configurable period length (default: 50)
- Multiple smoothing methods: RMA, SMA, EMA, or WMA
- Helps assess current market volatility
## Use Cases
- **Momentum & Volume Confirmation**: See if RSI trends align with net volume flows
- **Divergence Trading**: Automatically spots when price makes new highs/lows but RSI doesn't
- **Volatility Assessment**: Monitor ATR for position sizing and stop-loss placement
- **Overbought/Oversold + Volume**: Identify exhaustion when RSI hits extremes with volume spikes
## Customization
All components can be toggled on/off independently. RSI scale factor allows you to adjust how prominent the RSI line appears relative to volume bars.

RVOL + Volume Z-Score (Textbook)This indicator is a relative-volume and “volume anomaly” dashboard designed to help you quickly spot when a ticker is actually in-play versus simply drifting on normal activity. It plots standard volume bars (colored by up/down candles) and overlays multiple optional smoothers of volume (SMA, LSMA/linear-regression MA, HMA, ALMA) so you can see whether participation is expanding or fading across different smoothing styles. It also calculates RVOL (current bar volume divided by the average volume over a user-defined lookback) and displays RVOL (and Z) in a small table for quick reference.
The core feature is a textbook volume z-score: Z=(V−SMA(V,N))/StDev(V,N)
This measures how far the current bar’s volume is from its recent average in standard-deviation units, making it easy to filter for genuinely unusual volume. The script plots mean + 1σ and mean + 2σ threshold bands and can highlight “anomaly” volume bars when Z exceeds your chosen σ thresholds (default 1σ for broader detection, with alerts available for 1σ/2σ). Use it as a participation filter: combine high RVOL / high Z with your price structure (key levels, VWAP, trend) to validate breakouts or identify high-conviction reversal/flush events.

Volume Trend Analysis Pro📘 How to Use – Volume Blast Analyzer Pro (VBA Pro)
High-Accuracy Volume Blast • Breakout Model • Wyckoff Spring/Upthrust • Trend-Volume Matrix • SIVA Volume Analyzer
🧩 1. Overview
VBA Pro is a complete volume-based trading system that detects:
🔥 Volume Blasts (Bull/Bear/Neutral)
📈 True & False Breakouts
🟦 Wyckoff Springs & Upthrusts
📊 Trend–Volume Matrix (11×11 system)
🟪 SIVA Volume Analyzer states
🟧 Volume Spike events
🔍 Multi-filter confirmation
This tool identifies both momentum continuation and manipulation-based reversals, making it ideal for intraday, swing, and SMC/Wyckoff traders.
🟦 2. Core Components:
A. Volume Blast Detector
Triggered when any of these filters activate:
RVOL Blast (Relative Volume explosion)
Range Blast (Large candle body + large volume)
Volume × ATR Blast (Volatility-weighted volume surge)
Color System (by direction):
🟢 Bullish Blast
🔴 Bearish Blast
⚪ Neutral Blast
B. Wyckoff Model (Spring & Upthrust)
Automatically identifies:
Spring → Bullish liquidity sweep + reversal context
Upthrust → Bearish liquidity sweep + reversal context
Tooltip includes:
✔ Liquidity sweep
✔ Support/Resistance test
✔ Exhaustion or aggressive absorption
✔ Reversal probability
C. Breakout Detector (True/False)
True Breakout when:
Volume strong
Candle closes beyond levels
Trend aligned
No rejection wick
False Breakout when:
Wick rejection
Low confirmation volume
Immediate rejection back inside range
Plot:
TrBu → True Bull Breakout
TrBe → True Bear Breakout
❌ False Breakouts (Bull/Bear)
D. Trend–Volume Matrix (TVM 11×11)
Plots real-time market structure using:
Trend Value (–10 → +10)
Volume Value (–10 → +10)
Quadrants show:
Trend Continuation (Top-Right)
Volume Divergence (Top-Left)
Weakening Trend (Bottom-Right)
Distribution / Manipulation (Bottom-Left)
A 🔵 dot marks current market position.
Volume Trend Matrix shows where the market is sitting:
Top Right (green): Trend ↑ and Volume ↑ → strong confirmed up trend.
Top Left (red): Trend ↓ but Volume ↑ → strong sell momentum.
Bottom Right (blue): Trend ↑ but Volume ↓ → uptrend losing steam.
Bottom Left (yellow): Trend ↓ and Volume ↓ → weak bearish drift.
Dynamic Candle Coloring: Candles are colored by trend only: green for uptrends, red for downtrends, and orange near reversals.
Threshold Fills: The oscillator region is shaded green above +10 (healthy uptrend) and red
below -10 (strong downtrend) for instant confidence.
E. SIVA Volume Analyzer
Color-coded volume states:
🔥 Volume Spike
🟢 Higher Volume
🔴 Lower Volume
🟣 Extremely Low Volume
⚪ Neutral
🟩/🟥 Trend-confirming Volume
📈 3. Trading Examples
🔵 Bullish Setup:
Spring detected
Bullish Blast
Trend Value > 0
True Bull Breakout (optional)
Liquidity confirmation
🔴 Bearish Setup:
Upthrust detected
Bearish Blast
Trend Value < 0
True Bear Breakout
Weak volume pullback
🔔 4. Alerts
Alerts trigger for:
Volume Blast
Spring / Upthrust
Volume Spike
True & False Breakouts
Liquidity engagement
Trend–Volume quadrant changes
🛠 5. Settings Guide
All modules can be toggled independently:
Volume Blast Detector
Wyckoff Model
Breakout Model
Volume Spike Detector
Trend–Volume Matrix
Candle Colors
Label Shapes
🧠 6. Best Practices
Combine Trend–Volume Matrix + Blast for best confirmation
Avoid trading during neutral/grayed volume states
Springs/Upthrusts are strongest after consolidation
Use Breakout Model to avoid fakeouts

Volume Buzz - Real-Time Relative Volume MonitorDon't trade in the dark—know if the market is paying attention.
This indicator displays a simple dashboard on your chart that tells you if the current volume is Higher or Lower than the 20-day average for this specific time of day.
Green Text: High Relative Volume (RVol > 1). Good for spotting breakouts and momentum.
Red Text: Low Relative Volume (RVol < 1). Indicates consolidation or lack of interest.
Includes an optional "Realtime Adjustment" to predict the volume closing value before the bar actually closes.
Vector CPR Bands## Overview
The Vector CPR Bands indicator enhances the classic Central Pivot Range (CPR) by incorporating "vector" detection—identifying periods with above-average or climactic volume. It projects CPR ranges from these high-volume periods forward as visual bands, which act as persistent support/resistance zones until invalidated by price action. Ideal for spotting key levels in trending or ranging markets, especially on higher timeframes like weekly or monthly.
## Key Features
- **CPR Calculation**: Plots previous, developing (non-repainting), and repainting CPR with mid-pivot, TC (top central), and BC (bottom central) lines, plus fills.
- **Vector Detection**: Scans for high-volume bars in the anchor timeframe (default weekly). Flags "above-average" (≥1.5x avg) or "large" (≥2x avg or max climax).
- **Band Projection**: Creates bands from vector-qualified CPR periods. Extends them rightward until touched/revisited (configurable: invalidate on wick/close, delete or freeze/gray out).
- **Customization**:
- Timeframe: Set CPR anchor (e.g., 'W' for weekly, 'M' for monthly).
- Display: Toggle CPR types, pivot guides.
- Volume Thresholds: Adjust lookback and ratios.
- De-clutter: Limit max bands, pin to period start, always extend.
- **Alerts & Signals**: Built-in alerts for developing pivot crossing previous pivot (bullish/bearish).
## How to Use
1. Add to chart and set anchor timeframe (e.g., 'M' for monthly vCPR on BTC, as shown in example charts).
2. Watch bands as S/R: Virgin (untested) bands often provide strong bounces; mitigated ones fade.
3. Combine with volume/price action: Bullish bands suggest upside bias, especially if price holds above.
4. Example: On BTC weekly, vector bands from high-volume weeks highlight multi-month zones—breaks signal shifts.

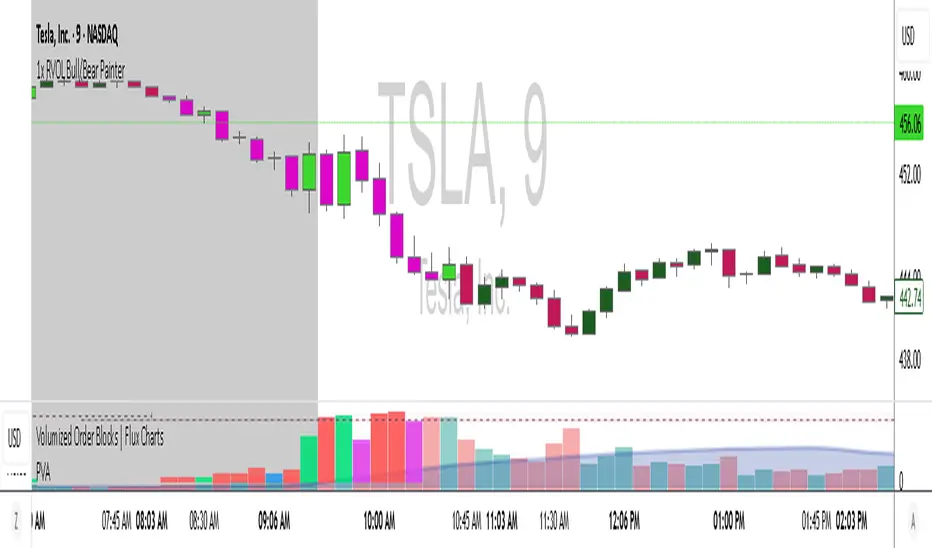
1x RVOL Bull/Bear Painter v2Relative volume candle indicator registers bull and bear relative volume, at a threshold of 1 or greater. This can be modified to your liking. Use this to enter a strong trend on any time frame.

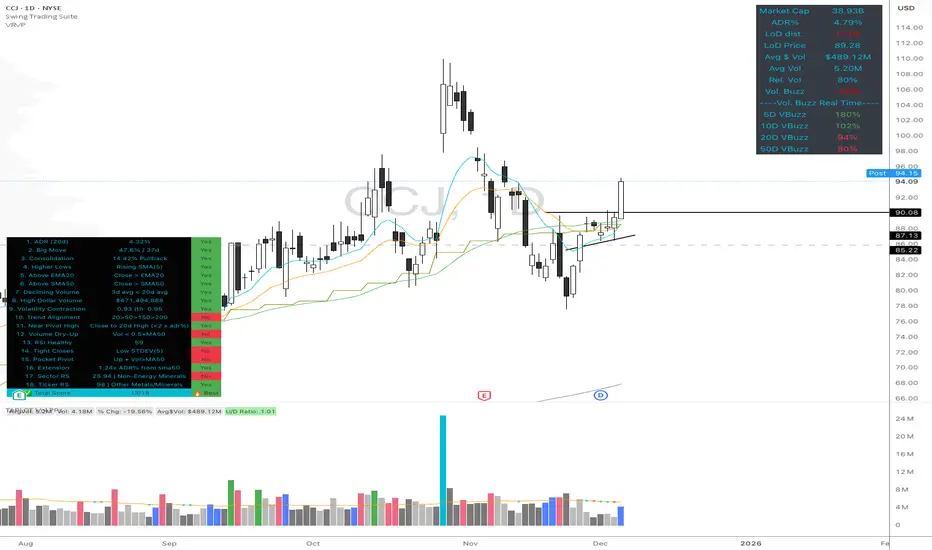
High Quality Setup Detector (Ultimate Edition)High Quality Setup Detector (Ultimate Edition)
A complete, rules-based detector for identifying elite high-probability trading setups based on volatility contraction, trend alignment, volume behavior, RS strength, and classic breakout conditions.
This script consolidates multiple proven technical concepts into one unified scoring system — giving traders a fast, objective way to evaluate the overall quality of any chart.
🔍 What This Tool Does
The indicator evaluates 16–18 technical conditions (depending on whether RS is enabled) and assigns each chart a Total Quality Score.
You instantly see:
✔ ADR volatility quality
✔ Big move + constructive pullback
✔ Higher lows (constructive structure)
✔ Trend alignment (20/50/150/200)
✔ Dollar volume strength
✔ Volatility contraction (ATR ratio)
✔ Volume dry-up before breakout
✔ RSI health
✔ Pocket pivot
✔ Extension from the 50-day
✔ Near pivot high
✔ Optional: Sector RS + Ticker RS
The result appears in a clean, color-coded table displayed on-chart.
🎯 Scoring System
Every condition is worth 1 point.
Based on your total score:
🔥 Best Setup — high probability
🟡 Good Setup — decent but not top-tier
🔴 Weak — avoid
This helps keep you disciplined and objective, even during choppy markets.
📊 RS Rating System (Optional)
Enable RS to compute:
Sector RS strength using mapped sector ETFs
Ticker RS strength using a percentile-based multi-quarter performance model
Both follow a full 1–99 rating scale.
🧩 Customizable Display
Adjustable text size (Tiny → Huge)
Clean 3-column diagnostics table
Organized into logical categories (Trend, Volume, Volatility, RS, etc.)
💡 Ideal For
Growth traders
Breakout traders
VCP / volatility contraction pattern traders
Swing traders who want rule-based confirmation
Anyone who wants structured, systematic chart evaluation

Large Order DetectionHow It Works:
Green diamonds appear below bullish candles (close > open) when large volume is detected
Red diamonds appear above bearish candles (close < open) when large volume is detected
Diamond size scales based on how much larger the volume is compared to the average:
Smallest: 2-2.5x average volume
Medium: 2.5-4x average volume
Larger: 4-6x average volume
Largest: 6x+ average volume
Features:
Customizable threshold - Default is 2x average volume, but you can adjust this
Adjustable lookback - Default 50 bars for calculating average volume
Size range control - Set minimum and maximum diamond sizes
Subtle background highlight - Shows when large orders occur
Built-in alerts - Can notify you when large orders are detected
Usage Tips:
Lower timeframes (1-5min) will show more frequent large orders
Increase threshold multiplier (2.5-3.0x) on high-volume assets to reduce noise
Watch for clusters of same-colored diamonds = strong directional pressure
Red diamonds at resistance + bearish EMAs = strong sell signal
Green diamonds at support + bullish EMAs = strong buy signal

RVOL CandlesRvol indicator shows relative volume on each candle and can be adjusted and color change.
5x Relative Volume vs 30-Day AverageRelative Volume.
If today's volume is more than average of last 30 days volume by 5x.
